Recurrence Intervals for the June 2006 Flood in Delaware and Otsego counties, New York
|
|
|
- Isaac Hutchinson
- 5 years ago
- Views:
Transcription


1 Recurrence Intervals for the June 2006 Flood in Delaware and Otsego counties, New York Earth Sciences Brown Bag Seminar Spring 2008 Les Hasbargen Dept. of Earth Sciences SUNY Oneonta Ouleout Creek, flood scars Picture From :


2 On June Periods 28, a tropical of rain wave moved came in up waves the coast. It s rain was 2 ½ intensified days of heavy by the rain cold in central front Much New of the York humidity on Radar was of tropical origin


3 Otego Creek in Laurens, NY


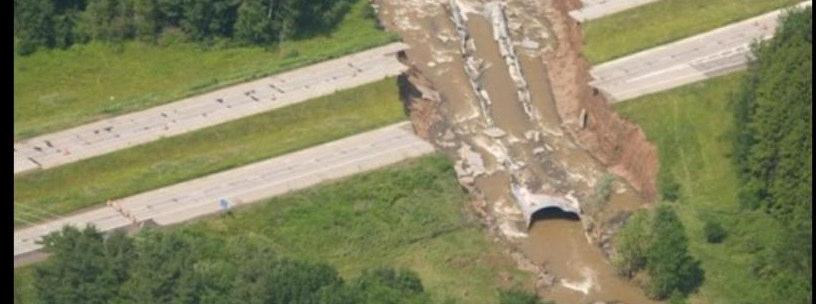
4 Floods caused erosion of cropland Significant transport of cobbles and boulders Picture From :

5 From:


6 From:
7 What can we learn from these floods? How often will a flood like this come along? What areas were most damaged? What areas were least affected? This was a geomorphic event. Can we learn something about erosion, transport, and deposition from this event?
8 There is a lot of basic research to do here! Recent research by USGS provides estimates of flood recurrence but there s more to be done Quantify relationships between rainfall and runoff for local basins Characterize relation between flood heights and channel characteristics (how rough is the bed?) Document erosion, transport, and deposition in a range of settings and grain sizes Today, I ll start with flood recurrence
9 Flood Recurrence The frequency-size distribution for all of the flows a river experiences would be very helpful to know Once a mathematical model is fit to the Once a mathematical model is fit to the data, we can determine the size of flow for a given recurrence interval (e.g., the 100- yr flood)
10 Log-normal flow distributions 0.5 Flow distributions West Branch Delaware River, Delhi frequ uency peak daily 0 log Discharge, cfs A note on flood frequency distributions: Real flow distributions do not fit any known mathematical distributions perfectly well; the USGS recommends the Log Pearson Type III distribution, but they do so with a nod to future changes (USGS Circular 17b, 1982)
11 The standard model for flood frequency distributions from the USGS Treat the flood records as Log-normal distributions (Log Pearson Type III) Compute average, standard deviation, and skew of log transformed data With these values, we can reconstruct the distribution with the LPTIII model log (Q) = µ + K σ where µ is the average of log (Q), K is a frequency factor that depends on recurrence interval (and you need to use look-up tables to get this!!) and skew of log (Q) and σ is the standard deviation of log (Q) From this equation, we can estimate the probability that a flow of a given size will be equaled or exceeded
12 Recurrence Intervals Using Log Pearson Type III Note Recurrence Interval is the reciprocal of probability! "#$#% &# $# % '! (
13 Flow frequency: Weibull method Flow events are ranked (m) from largest to smallest (the n th event) This is essentially the number of events in the record that are larger than some value [exceedance probability, P] P is the probability m is the rank n is the # data values RI is recurrence interval P RI = = n m P = n + 1 m
14 Basic steps to get the frequency Sort the data by size, largest to smallest Rank each event (m), from 1 (the largest) to n (the smallest) Calculate the probability P that a flow of a given size will be equaled or exceeded: m P = n +1 The reciprocal of P is the recurrence interval RI, the size of flow that comes along once in the time interval (years, in our situation) n +1 Plot the discharge vs RI Fit a trend line to the data RI = m
15
16
17 Power law distribution (fractal) Many events in nature have lots of small events and few large ones (earthquakes, fault sizes, floods) These distributions are self-similar we can use one part of the distribution to describe any other part They look the same at any level of magnification They can span several orders of magnitude [thresholds] A power law mathematical model describes such events Order the flows and compute recurrence intervals Fit a power law equation to the data Bruce Malamud and Donald Turcotte, The applicability of power-law frequency statistics to floods, Journal of Hydrology Volume 322, Issues 1-4, 15 May 2006, Pages R. Kidson *, K. S. Richards, & P. A. Carling, Power-law extreme flood frequency, Geological Society, London, Special Publications; 2006; v. 261; p ; DOI: /GSL.SP
18 General form of a power law y( x) = ax b where y is the dependent variable a is a constant coefficient; think of this as a unit scale (at x = 1) x is the variate and b is the exponent which characterizes the rate of change of y vs x for instance, as b 0, y doesn' t vary with x if b > 0, then y increases with x if b < 0, then y decreases with x
19 Power law flow distribution 3%45 6 %"+% 78 )*+,-./01+ "2. Note: Each gage record exhibits the same form as above, but with different exponents and coefficients in the power law relation
20 Comparing LPT3 and Power Law fits to the data )*+,-./01+ "2. 5# &9 95 *5 #, Peak Annual Flow at the West Branch Delaware River at Delhi, NY


21 Shaded Relief Map of USGS Gage Stations
22 Recurrence Intervals for the 2006 Flood Event River Susquehanna River, Unadilla West Branch Delaware River, Walton Peak Discharge (cfs) Recurrence Interval, LPT3 Recurrence Interval, Power Law 34, years 48 years 28, years 32 years Unadilla River, 23, years 70 years Rockdale West Branch Delaware River, Delhi years 51 years Ouleout Creek years 43 years Little Delaware River at Delhi years 50 years Trout Creek years 25 years Wolf Creek years 12 years Note: these are all model dependent approximations, and should NOT be considered an official estimate for planning purposes
23 Bottom line on the 2006 Flood event The 2006 Flood is probably a once-(or twice)-in-a-lifetime experience, but this depends on where you live!! Recurrence intervals vary with drainage basin size (smaller basins exhibit larger ranges) The Log Pearson Type III distribution gives longer return periods than the power law The relationship of RI with basin size is worth following
24 Flood Recurrence-Discharge power law parameters for Delaware and Otsego County Drainage Basin Area (mi 2 ) 1-yr Discharge (cfs) Scaling exponent Wolf Creek Wharton Creek, Edmeston NY Little Elk Creek, Westford NY Trout Creek Little DE-R, Delhi Butternut Creek, Morris NY Oaks Creek, Index NY Ouleout Creek, Sidney, NY Otego Creek, Oneonta NY W. DE-R, Delhi W. Br. Del-R, Walton Susquehanna River, Colliersville Unadilla River, Rockdale Susq-R, Unadilla
25 Plot of the power law coefficients vs drainage basin area for Delaware and Otsego Counties ) *:,-": "/ ;-". Ouleout Creek Dam effect? "! " The coefficient can be thought of as the 1-yr peak discharge for the given drainage basin
26 Plot of power law exponents vs drainage basin area for Delaware and Otsego Counties $1<*:,-"2: "0 ;-"0/ #$ $ " " "! " The small value (-0.16) indicates a weak relation between drainage area and exponent; in general, smaller basins exhibit a larger exponent, which means that small basins exhibit larger increase in flood size with RI than large basins do
27 Predicting flow in ungauged basins We can use the empirical relations between power law parameters and basin size to develop a model for an ungauged basin First, compute the parameters given basin area Then these parameters go into the power law for discharge as a function of recurrence
28 Example: Ungaged basin model for Delaware and Otsego Counties Given the two relations for power law parameters Q 0 (A) = 34.3A 0.82 Exponent(A)= 0.74A where A is an drainage basin area in mi 2 If an ungaged basin is A = 5 mi 2, then Q 0 (A) = 34.3 x =128 Exponent(A) = 0.74 x = 0.57 So Q(RI) = 128 RI 0.57
29 Recent stream flow estimation from the USGS Multivariate analysis of stream flow, basin area, land cover and use, rainfall results in a set of predictive equations for ungaged basins Q = ka b where k is and is S c st is a R d S the ratio of e sl mean annual dimensional coefficient A is drainage area, in mi S R S st sl and 2 rainfall, in inches stream slope to basin slope Lumia, Richard, Freehafer, D.A., and Smith, M.J., 2006, Magnitude and frequency of floods in New York: U.S. Geological Survey Scientific Investigations Report , 152 p. is % storage in the drainage (lakes, wetlands, etc) b, c, d e are scaling exponents derived empirically
30 USGS Recurrence Model for New York For ungauged basins, and based on Area (A), %storage (ST), annual rainfall (R), and channel to basin slope ratio (SR), and coefficients and exponents are functions of the recurrence interval for Log Pearson Type III distribution f ( RI ) Q ( RI) = f ( RI) A ( S + T 0.5) f ( RI ) R f ( RI ) S f R ( RI )
31 % & ' & (! $ %)*)& + ""= ""95 ""# '# '95 '=
32 Conclusions Recurrence intervals for the 2006 flood event vary from 23 to 208 years Small basins exhibit shorter recurrence intervals Peak annual flow and average daily flow are different distributions (choice of distribution matters!) Models can be tweaked to fit local gage records quite well A power law model for flow distributions is simpler than the current USGS method We can estimate flows for ungaged basins, but crudely
33 More work to do Discrepancies between models need to be explored Establish relations for rainfall-runoff for local basins Survey 2006 flood heights, channel geometry, and channel changes in targeted settings Estimate flows in targeted field sites Get a better handle on flow depth and channel characteristics
34 Bedrock vs Alluvial cover in Morris Brook, about 100 m between locations Flood heights varied dramatically between sites
35 References Link to OSU s tutorial site for computing river flow statistics Link to USGS s site for the method to determine flood recurrence (LPT3) Lumia, Richard, Freehafer, D.A., and Smith, M.J., 2006, Magnitude and frequency of floods in New York: U.S. Geological Survey Scientific Investigations Report , 152 p.
Recurrence Interval for the 2006 Flood Delaware and Otsego County, New York
 Recurrence Interval for the 2006 Flood Delaware and Otsego County, New York Les Hasbargen Dept. of Earth Sciences SUNY Oneonta Ouleout Creek, flood scars Picture From : http://www.co.delaware.ny.us/flood_2006/crop%20&%20land%20photos/default.htm
Floods Lecture #21 20
 Floods 20 Lecture #21 What Is a Flood? Def: high discharge event along a river! Due to heavy rain or snow-melt During a flood, a river:! Erodes channel o Deeper & wider! Overflows channel o Deposits sediment
Overview of a Changing Climate in Rhode Island
 Overview of a Changing Climate in Rhode Island David Vallee, Hydrologist in Charge, National Weather Service Northeast River Forecast Center, NOAA Lenny Giuliano, Air Quality Specialist, Rhode Island Department
5/4/2017 Fountain Creek. Gage Analysis. Homework 6. Clifton, Cundiff, Pour, Queen, and Zey CIVE 717
 5/4/2017 Fountain Creek Gage Analysis Homework 6 Clifton, Cundiff, Pour, Queen, and Zey CIVE 717 Introduction: The CIVE 717 class members, Nate Clifton, Susan Cundiff, Ali Reza Nowrooz Pour, Robbie Queen
Due: Monday November 26 th LAB 7: Rivers and Flood Frequency
 1 12.001 Due: Monday November 26 th LAB 7: Rivers and Flood Frequency Overview and Objectives This exercise will provide some hands-on experience with methods used for predicting flood frequency and magnitude.
Implementing a Project with 319 Funds: The Spring Brook Meander Project. Leslie A. Berns
 Implementing a Project with 319 Funds: The Spring Brook Meander Project Leslie A. Berns "...to acquire... and hold lands... for the purpose of protecting and preserving the flora, fauna and scenic beauties...
Wetland & Floodplain Functional Assessments and Mapping To Protect and Restore Riverine Systems in Vermont. Mike Kline and Laura Lapierre Vermont DEC
 Wetland & Floodplain Functional Assessments and Mapping To Protect and Restore Riverine Systems in Vermont Mike Kline and Laura Lapierre Vermont DEC NWI+ Hydro-Geomorphic Characterization of Wetlands and
May 7, Roger Leventhal, P.E. Marin County Public Works Laurel Collins Watershed Sciences
 May 7, 2013 Roger Leventhal, P.E. Marin County Public Works Laurel Collins Watershed Sciences Background Funded in 2009 under EPA 2100 Grant for $30k and managed by SFEP Project Goals: Update original
Each basin is surrounded & defined by a drainage divide (high point from which water flows away) Channel initiation
 Channel initiation") DRAINAGE BASINS A drainage basin or watershed is defined from a downstream point, working upstream, to include all of the hillslope & channel areas which drain to that point Each basin is surrounded &
DRAINAGE BASINS A drainage basin or watershed is defined from a downstream point, working upstream, to include all of the hillslope & channel areas which drain to that point Each basin is surrounded &
STREAM SYSTEMS and FLOODS
 STREAM SYSTEMS and FLOODS The Hydrologic Cycle Precipitation Evaporation Infiltration Runoff Transpiration Earth s Water and the Hydrologic Cycle The Hydrologic Cycle The Hydrologic Cycle Oceans not filling
Precipitation Evaporation Infiltration Earth s Water and the Hydrologic Cycle. Runoff Transpiration
 STREAM SYSTEMS and FLOODS The Hydrologic Cycle Precipitation Evaporation Infiltration Earth s Water and the Hydrologic Cycle Runoff Transpiration The Hydrologic Cycle The Hydrologic Cycle Oceans not filling
1927 Flood: Then and Now Elizabeth Stanley Mann Meghan Kirsch
 1927 Flood: Then and Now Elizabeth Stanley Mann Meghan Kirsch Abstract: This study surveys the 1927 flood effects in Bethel, Cambridge, Montpelier, and Winooski, Vermont. This was done through re-photographing
Science of Natural Disasters: RIVERS& FLOODS! 27 April 2016
 Science of Natural Disasters: RIVERS& FLOODS! 27 April 2016 Rebecca Clotts Department of Geology, University of St Thomas Flood in St Paul, 2014, Star Tribune 1 2 What is a watershed? 3 4 5 6 7 What is
Stream Discharge and the Water Budget
 Regents Earth Science Unit 6: Water Cycle & Climate Name: Lab # Stream Discharge and the Water Budget Introduction: The United States Geological Survey (USGS) measures and publishes values for the daily
NRC Workshop - Probabilistic Flood Hazard Assessment Jan 2013
 Regional Precipitation-Frequency Analysis And Extreme Storms Including PMP Current State of Understanding/Practice Mel Schaefer Ph.D. P.E. MGS Engineering Consultants, Inc. Olympia, WA NRC Workshop - Probabilistic
Alluvial Stratigraphy in Otsego County
 Alluvial Stratigraphy in Otsego County Butternut Creek, 10/1/2010 A view from the river Les Hasbargen October 14, 2010 Overview Acknowledgements: Damon Matteson, Emily Carroll, Cindy Klink, Emmon Johnson
RAINFALL FREQUENCY ANALYSIS FOR NEW BRAUNFELS, TX (or Seems like we ve been having lots of 100-yr storms)
") RAINFALL FREQUENCY ANALYSIS FOR NEW BRAUNFELS, TX (or Seems like we ve been having lots of 100-yr storms) Presented By: SAUL NUCCITELLI, PE, CFM (LAN) BLAKE KRONKOSKY, EIT (LAN) JIM KLEIN, PE (CITY OF
RAINFALL FREQUENCY ANALYSIS FOR NEW BRAUNFELS, TX (or Seems like we ve been having lots of 100-yr storms) Presented By: SAUL NUCCITELLI, PE, CFM (LAN) BLAKE KRONKOSKY, EIT (LAN) JIM KLEIN, PE (CITY OF
Working with Natural Stream Systems
 Working with Natural Stream Systems Graydon Dutcher Delaware County Soil & Water Conservation District Stream Corridor Management Program Tropical Storm Sandy October 29,2012 What is a Watershed?
The Hydrologic Cycle STREAM SYSTEMS. Earth s Water and the Hydrologic Cycle. The Hydrologic Cycle. Hydrologic Cycle
 STREAM SYSTEMS Earth Science: Chapter 5 Reading pages 114-124 The Hydrologic Cycle Oceans not filling up Evaporation = precipitation System is balanced Earth s Water and the Hydrologic Cycle Earth s Water
Muddy waters: particle size distributions in a Holocene lacustrine delta
 Muddy waters: particle size distributions in a Holocene lacustrine delta Les Hasbargen, SUNY College at Oneonta, NY Christoph Geiss, Trinity College, CT Muds and Floods Goal: Use grain size in muddy lake
CAUSES FOR CHANGE IN STREAM-CHANNEL MORPHOLOGY
 CAUSES FOR CHANGE IN STREAM-CHANNEL MORPHOLOGY Chad A. Whaley, Department of Earth Sciences, University of South Alabama, MobileAL, 36688. E-MAIL: caw408@jaguar1.usouthal.edu The ultimate goal of this
Riparian Assessment. Steps in the right direction... Drainage Basin/Watershed: Start by Thinking Big. Riparian Assessment vs.
 Riparian Assessment vs. Monitoring Riparian Assessment What is a healthy stream? Determine stream/riparian health Determine change or trend, especially in response to mgmt Classification = designation
OBJECTIVES. Fluvial Geomorphology? STREAM CLASSIFICATION & RIVER ASSESSMENT
 STREAM CLASSIFICATION & RIVER ASSESSMENT Greg Babbit Graduate Research Assistant Dept. Forestry, Wildlife & Fisheries Seneca Creek, Monongahela National Forest, West Virginia OBJECTIVES Introduce basic
ENGINEERING HYDROLOGY
 ENGINEERING HYDROLOGY Prof. Rajesh Bhagat Asst. Professor Civil Engineering Department Yeshwantrao Chavan College Of Engineering Nagpur B. E. (Civil Engg.) M. Tech. (Enviro. Engg.) GCOE, Amravati VNIT,
PENNSYLVANIA DEPARTMENT OF TRANSPORTATION ENGINEERING DISTRICT 3-0
 PENNSYLVANIA DEPARTMENT OF TRANSPORTATION ENGINEERING DISTRICT 3-0 LYCOMING COUNTY S.R.15, SECTION C41 FINAL HYDROLOGIC AND HYDRAULIC REPORT STEAM VALLEY RUN STREAM RELOCATION DATE: June, 2006 REVISED:
Flood Frequency and Hazard Analysis of Santa Barbara s Mission Creek
 Flood Frequency and Hazard Analysis of Santa Barbara s Mission Creek Dylan Berry Andrew Donnelly Bruce Stevenson Dr. Professor Ed Keller ES 144: Rivers UC Santa Barbara Spring 2013 Abstract: The objective
Suwannee Satilla Basins Flood Control Issues, Opportunities and Assistance
 Suwannee Satilla Basins Flood Control Issues, Opportunities and Assistance Georgia Silver Jackets Meeting Valdosta, GA April 11, 2013 Presentation Outline Basin overview Recent floods: 2009 100 year flood
Flood Forecasting Tools for Ungauged Streams in Alberta: Status and Lessons from the Flood of 2013
 Flood Forecasting Tools for Ungauged Streams in Alberta: Status and Lessons from the Flood of 2013 John Pomeroy, Xing Fang, Kevin Shook, Tom Brown Centre for Hydrology, University of Saskatchewan, Saskatoon
Prepared By: John Blair Sean Donahue Celeste Hoffman Kimberly Klinkers Megan Slater
 Prepared By: John Blair Sean Donahue Celeste Hoffman Kimberly Klinkers Megan Slater Green River Basin Location Green River Basin Stratigraphic Correlation Chart showing Study Map Units Sample of Existing
Field Observations and One-Dimensional Flow Modeling of Summit Creek in Mack Park, Smithfield, Utah
 Intermountain Center for River Rehabilitation and Restoration, Utah State University 31 July 2018 Field Observations and One-Dimensional Flow Modeling of Summit Creek in Mack Park, Smithfield, Utah I.
Estimates of Peak Discharge for the September 2013 Floods in Boulder County, Colorado. John Moody 17 November 2015 AWRA Meeting--Denver
 Estimates of Peak Discharge for the September 2013 Floods in Boulder County, Colorado John Moody 17 November 2015 AWRA Meeting--Denver Location Colorado Front Range Boulder County Streams, rainfall and
Upper Truckee River Restoration Lake Tahoe, California Presented by Brendan Belby Sacramento, California
 Upper Truckee River Restoration Lake Tahoe, California Presented by Brendan Belby Sacramento, California Mike Rudd (Project Manager), Charley Miller & Chad Krofta Declines in Tahoe s Water Clarity The
Lower Susquehanna River Integrated Sediment & Nutrient Monitoring Program
 Lower Susquehanna River Integrated Sediment & Nutrient Monitoring Program Presented at the Chesapeake Bay Program Scientific and Technical Advisory Committee (STAC) Workshop January 13, 2016 Background
Section 4: Model Development and Application
 Section 4: Model Development and Application The hydrologic model for the Wissahickon Act 167 study was built using GIS layers of land use, hydrologic soil groups, terrain and orthophotography. Within
Chapter 5 CALIBRATION AND VERIFICATION
 Chapter 5 CALIBRATION AND VERIFICATION This chapter contains the calibration procedure and data used for the LSC existing conditions model. The goal of the calibration effort was to develop a hydraulic
USING GIS TO MODEL AND ANALYZE HISTORICAL FLOODING OF THE GUADALUPE RIVER NEAR NEW BRAUNFELS, TEXAS
 USING GIS TO MODEL AND ANALYZE HISTORICAL FLOODING OF THE GUADALUPE RIVER NEAR NEW BRAUNFELS, TEXAS ASHLEY EVANS While the state of Texas is well-known for flooding, the Guadalupe River Basin is one of
Laboratory Exercise #4 Geologic Surface Processes in Dry Lands
 Page - 1 Laboratory Exercise #4 Geologic Surface Processes in Dry Lands Section A Overview of Lands with Dry Climates The definition of a dry climate is tied to an understanding of the hydrologic cycle
Susquehanna River Basin A Research Community Hydrologic Observatory. NSF-Funded Infrastructure Proposal in Support of River Basin Hydrologic Sciences
 Susquehanna River Basin A Research Community Hydrologic Observatory NSF-Funded Infrastructure Proposal in Support of River Basin Hydrologic Sciences Fundamental Problem: How Do Humans and Climate Impact
SECTION G SEDIMENT BUDGET
 SECTION G SEDIMENT BUDGET INTRODUCTION A sediment budget has been constructed for the for the time period 1952-2000. The purpose of the sediment budget is to determine the relative importance of different
ENVG/SC 10110L-20110L PLANET EARTH LABORATORY. Laboratory #9: Surface Hydrology & Map Scale
 Name: Lab day: Tuesday Wednesday ENVG/SC 10110L-20110L PLANET EARTH LABORATORY Laboratory #9: Surface Hydrology & Map Scale Readings: Chapter 9. http://www.nd.edu/~cneal/physicalgeo/lab-surfacehydrology/index.html
Design Storms for Hydrologic Analysis
 Design Storms for Hydrologic Analysis Course Description This course is designed to fulfill two hours of continuing education credit for Professional Engineers. Its objective is to provide students with
HAZARD IDENTIFICATION... 1 HAZARD EFFECTS OF CLIMATE CHANGE... 2 OVERVIEW OF HAZARD ANALYSIS... 4 BUILDING VALUES... 5 POTENTIAL DOLLAR LOSSES...
 R ISK OVERVIEW IDENTIFICATION... 1 EFFECTS OF CLIMATE CHANGE... 2 OVERVIEW OF ANALYSIS... 4 BUILDING VALUES... 5 POTENTIAL DOLLAR LOSSES... 7 IDENTIFICATION This section begins the risk assessment, which
Rivers T. Perron
 1 Rivers T. Perron 12.001 After our discussions of large-scale topography, how we represent topography in maps, and how topography interacts with geologic structures, you should be frothing at the mouth
GEOL 1121 Earth Processes and Environments
 GEOL 1121 Earth Processes and Environments Wondwosen Seyoum Department of Geology University of Georgia e-mail: seyoum@uga.edu G/G Bldg., Rm. No. 122 Seyoum, 2015 Chapter 6 Streams and Flooding Seyoum,
Rivers and Streams. Streams. Hydrologic Cycle. Drainage Basins and Divides. Colorado River Drainage Basin. Colorado Drainage Basins.
 Chapter 14 Hydrologic Cycle Rivers and Streams Streams A stream is a body of water that is confined in a channel and moves downhill under the influence of gravity. This definition includes all sizes of
Laboratory Exercise #3 The Hydrologic Cycle and Running Water Processes
 Laboratory Exercise #3 The Hydrologic Cycle and Running Water Processes page - 1 Section A - The Hydrologic Cycle Figure 1 illustrates the hydrologic cycle which quantifies how water is cycled throughout
Great Lakes Tributary Modeling: Canaseraga Creek Watershed
 Great Lakes Tributary Modeling: Canaseraga Creek Watershed SWAT Model Authority: Section 516(e) of WRDA 1996 US Army Corps of Engineers Canaseraga Creek Project Location - Encompasses portions of Livingston,
Michael Schaffner, Alexander Tardy, Jayme Laber, Carl Unkrich, and David Goodrich,
 Michael Schaffner, Alexander Tardy, Jayme Laber, Carl Unkrich, and David Goodrich, A collaborative effort between NWS Western Region Headquarters, NWS San Diego, NWS Oxnard, and the USDA-ARS Southwest
Report on migration of Butternut Creek in Wheeler s field
 Report on migration of Butternut Creek in Wheeler s field Les Hasbargen 1, Peter Booth 2, and David Busby 3 INTRODUCTION Project Overview This report summarizes the activity of a meander loop of Butternut
STUDY GUIDE FOR CONTENT MASTERY. Surface Water Movement
 Surface Water SECTION 9.1 Surface Water Movement In your textbook, read about surface water and the way in which it moves sediment. Complete each statement. 1. An excessive amount of water flowing downslope
Remaining Capacity in Great Lakes Reservoirs
 US Army Corps of Engineers Detroit District Remaining Capacity in Great Lakes Reservoirs Storage Capacity Behind Great Lakes Dams Field Data and Modeling Motivation for project Project overview Data and
3/3/2013. The hydro cycle water returns from the sea. All "toilet to tap." Introduction to Environmental Geology, 5e
 Introduction to Environmental Geology, 5e Running Water: summary in haiku form Edward A. Keller Chapter 9 Rivers and Flooding Lecture Presentation prepared by X. Mara Chen, Salisbury University The hydro
SUPPLEMENTARY INFORMATION
 SUPPLEMENTARY INFORMATION Supplementary Information Rapid formation of a modern bedrock canyon by a single flood event Michael P. Lamb 1 and Mark A. Fonstad 2 1 California Institute of Technology, Geological
WATER ON AND UNDER GROUND. Objectives. The Hydrologic Cycle
 WATER ON AND UNDER GROUND Objectives Define and describe the hydrologic cycle. Identify the basic characteristics of streams. Define drainage basin. Describe how floods occur and what factors may make
Summary. Streams and Drainage Systems
 Streams and Drainage Systems Summary Streams are part of the hydrologic cycle and the chief means by which water returns from the land to the sea. They help shape the Earth s surface and transport sediment
Running Water Earth - Chapter 16 Stan Hatfield Southwestern Illinois College
 Running Water Earth - Chapter 16 Stan Hatfield Southwestern Illinois College Hydrologic Cycle The hydrologic cycle is a summary of the circulation of Earth s water supply. Processes involved in the hydrologic
REDWOOD VALLEY SUBAREA
 Independent Science Review Panel Conceptual Model of Watershed Hydrology, Surface Water and Groundwater Interactions and Stream Ecology for the Russian River Watershed Appendices A-1 APPENDIX A A-2 REDWOOD
THE RECURRENCE INTERVAL
 Floods GEOG 366 THE RECURRENCE INTERVAL How often can a storm of a given magnitude be expected to recur? Calculate as follows: Take list of annual peak flows (largest flow each year) and rank them. R.I.
In cooperation with the South Carolina, Georgia, and North Carolina Departments of Transportation and the North Carolina Floodplain Mapping Program
 In cooperation with the South Carolina, Georgia, and North Carolina Departments of Transportation and the North Carolina Floodplain Mapping Program (Division of Emergency Management) Magnitude and Frequency
Model Calibration and Forecast Error for NFIE-Hydro
 Corey Van Dyk C E 397 Flood Forecasting 5/8/15 Model Calibration and Forecast Error for NFIE-Hydro Introduction The forecasting component of the National Flood Interoperability Experiment (NFIE), like
Near Real-Time Runoff Estimation Using Spatially Distributed Radar Rainfall Data. Jennifer Hadley 22 April 2003
 Near Real-Time Runoff Estimation Using Spatially Distributed Radar Rainfall Data Jennifer Hadley 22 April 2003 Introduction Water availability has become a major issue in Texas in the last several years,
Existing NWS Flash Flood Guidance
 Introduction The Flash Flood Potential Index (FFPI) incorporates physiographic characteristics of an individual drainage basin to determine its hydrologic response. In flash flood situations, the hydrologic
(3) Sediment Movement Classes of sediment transported
 Sediment Movement Classes of sediment transported") (3) Sediment Movement Classes of sediment transported Dissolved load Suspended (and wash load ) Important for scouring algae Bedload (5-10% total load Moves along bed during floods Source of crushing for
(3) Sediment Movement Classes of sediment transported Dissolved load Suspended (and wash load ) Important for scouring algae Bedload (5-10% total load Moves along bed during floods Source of crushing for
Limitation to qualitative stability indicators. the real world is a continuum, not a dichotomy ~ 100 % 30 % ~ 100 % ~ 40 %
 Stream Stability Assessment & BEHI Surveys Joe Rathbun MDEQ Water Resources Division rathbunj@michigan.gov 517--373 517 373--8868 Stability Stream can transport its water and sediment inputs without changing
Great Lakes Update. Volume 194: 2015 Annual Summary
 Great Lakes Update Volume 194: 2015 Annual Summary Background The U.S. Army Corps of Engineers (USACE) tracks and forecasts the water levels of each of the Great Lakes. This report summarizes the hydrologic
Figure 1. Which part of the river is labelled in Figure 1? a) Mouth b) Source c) Lower course d) channel
 Mouth b) Source c) Lower course d) channel") Rivers 1. Study Figure 1 showing the long profile of a river Figure 1 A Which part of the river is labelled in Figure 1? a) Mouth b) Source c) Lower course d) channel (1 mark) 2. Complete the sentences
Rivers 1. Study Figure 1 showing the long profile of a river Figure 1 A Which part of the river is labelled in Figure 1? a) Mouth b) Source c) Lower course d) channel (1 mark) 2. Complete the sentences
DOMINANT DISCHARGE IN THE KOR RIVER, FARS PROVINCE, IRAN
 Tenth International Water Technology Conference, IWTC10 2006, Alexandria, Egypt 299 DOMINANT DISCHARGE IN THE KOR RIVER, FARS PROVINCE, IRAN Keshavarzi Ali Reza 1 and Nabavi, S. H. 2 1 Associate Prof.,
!"#$%&&'()*+#$%(,-./0*)%(!
*+#$%(,-./0*)%(!") 8:30 Sign in Hoosic River Revival Coalition!"#$%&&'()*+#$%(,-./0*)%(! 12-#30+4/#"5-(60 9:00 Welcome and Introductions 9:15 Goals for Today s Program: A Description of the Planning Process 9:30 First Session:
8:30 Sign in Hoosic River Revival Coalition!"#$%&&'()*+#$%(,-./0*)%(! 12-#30+4/#"5-(60 9:00 Welcome and Introductions 9:15 Goals for Today s Program: A Description of the Planning Process 9:30 First Session:
SPECIFIC DEGRADATION AND RESERVOIR SEDIMENTATION. By Renee Vandermause & Chun-Yao Yang
 SPECIFIC DEGRADATION AND RESERVOIR SEDIMENTATION By Renee Vandermause & Chun-Yao Yang Outline Sediment Degradation - Erosion vs Sediment Yield - Sediment Yield - Methods for estimation - Defining Sediment
Modeling Processes in the South River: Discussion. South River Science Team
 Modeling Processes in the South River: Discussion South River Science Team 09-09-03 Dual Approach May Be Appropriate Fluvial Geomorphology Study landforms and changes through erosion and sedimentation
(3) Sediment Movement Classes of sediment transported
 Sediment Movement Classes of sediment transported") 9/17/15 (3) Sediment Movement Classes of sediment transported Dissolved load Suspended load Important for scouring algae Bedload (5-10% total load) Moves along bed during floods Source of crushing for
9/17/15 (3) Sediment Movement Classes of sediment transported Dissolved load Suspended load Important for scouring algae Bedload (5-10% total load) Moves along bed during floods Source of crushing for
Vermont Stream Geomorphic Assessment. Appendix J. Vermont Regional Hydraulic Geometry Curves
 Vermont Stream Geomorphic Assessment Appendix J Vermont Regional Hydraulic Geometry Curves River Management Program Vermont Water Quality Division November, 2001 Natural Resources - J0 - VT Agency of Background
Stream Entrainment, Erosion, Transportation & Deposition
 Lecture 12 Zone 2 of the Fluvial System, Continued Stream Entrainment, Erosion, Transportation & Deposition Erosion in a Fluvial Landscape Corrosion Chemical Erosion Corrasion Mechanical Weathering Cavitation
Squaw Creek. General Information
 General Information is a tributary to the Salmon River. It enters the north side of the river about 0 miles downstream of North Fork, Idaho. The study reach is about a 30 ft length of stream about 2 miles
Core Curriculum Supplement
 Core Curriculum Supplement Academic Unit / Office EAS Catalog Year of Implementation 2018-2019 Course (Prefix / Number) GEOL / 1370 Core Proposal Request Add to Core Curriculum Course Title Natural Disasters
Lower Tuolumne River Accretion (La Grange to Modesto) Estimated daily flows ( ) for the Operations Model Don Pedro Project Relicensing
 Estimated daily flows ( ) for the Operations Model Don Pedro Project Relicensing") Lower Tuolumne River Accretion (La Grange to Modesto) Estimated daily flows (1970-2010) for the Operations Model Don Pedro Project Relicensing 1.0 Objective Using available data, develop a daily time series
Lower Tuolumne River Accretion (La Grange to Modesto) Estimated daily flows (1970-2010) for the Operations Model Don Pedro Project Relicensing 1.0 Objective Using available data, develop a daily time series
Rainfall Estimation at S-44 Site
 Technical Note EMA # 389 Rainfall Estimation at S-44 Site (January 2 "d, 3 rd, and 1 7 th, 1999 Events) March 1999 by Alaa Ali & Wossenu Abtew Hydro Information Systems and Assessment Department Environmental
Which map shows the stream drainage pattern that most likely formed on the surface of this volcano? A) B)
 B)") 1. When snow cover on the land melts, the water will most likely become surface runoff if the land surface is A) frozen B) porous C) grass covered D) unconsolidated gravel Base your answers to questions
1. When snow cover on the land melts, the water will most likely become surface runoff if the land surface is A) frozen B) porous C) grass covered D) unconsolidated gravel Base your answers to questions
Big Wood River. General Information
 General Information The flows out of the southern portion of the Sawtooth National Recreation Area in central Idaho. The study reach is about a,200 ft length of river about.5 miles upstream from the discontinued
Teacher s Pack Key Stage 3 GEOGRAPHY
 Teacher s Pack Key Stage 3 GEOGRAPHY Geography Key Stage 3 Fieldwork Worksheet Rivers: 1. Is the water fresh or salty? (test its resistance or specific gravity) 2. Do you know where the water is coming
NEW YORK STATE WATER RESOURCES INSTITUTE Department of Biological and Environmental Engineering
 NEW YORK STATE WATER RESOURCES INSTITUTE Department of Biological and Environmental Engineering 230 Riley-Robb Hall, Cornell University Tel: (607) 254-7163 Ithaca, NY 14853-5701 Fax: (607) 255-4080 http://wri.cals.cornell.edu
Objectives: After completing this assignment, you should be able to:
 Data Analysis Assignment #1 Evaluating the effects of watershed land use on storm runoff Assignment due: 21 February 2013, 5 pm Objectives: After completing this assignment, you should be able to: 1) Calculate
The Yellow River Initiative: The Birth of a System Approach to Challenges Facing the Everglades of the North
 The Yellow River Initiative: The Birth of a System Approach to Challenges Facing the Everglades of the North Robert Barr and Siavash Beik 2016 INAFSM Annual Conference Belterra Conference Center, Indiana
David R. Vallee Hydrologist-in-Charge NOAA/NWS Northeast River Forecast Center
 David R. Vallee Hydrologist-in-Charge NOAA/NWS Northeast River Forecast Center Record flooding along the Shawsheen River during the 2006 Mother s Day Floods Calibrate and implement a variety of hydrologic
Weathering, Erosion, Deposition
 Weathering, Erosion, Deposition The breakdown of rocks at or near the Earth s Surface. Physical Chemical - The breakdown of rock into smaller pieces without chemical change. - Dominant in moist /cold conditions
DRAFT Design Hydraulic Study. Bridge 04C-0055, Mattole Road Bridge over Mattole River at Honeydew. Humboldt County. Prepared for:
 DRAFT Design Hydraulic Study Bridge 04C-0055, Mattole Road Bridge over Mattole River at Honeydew Humboldt County Prepared for: Morrison Structures Incorporated 1890 Park Marina Drive, Suite 104 Redding,
Analysis of Road Sediment Accumulation to Monumental Creek using the GRAIP Method
 Analysis of Road Sediment Accumulation to Monumental Creek using the GRAIP Method Introduction (from http://www.neng.usu.edu/cee/faculty/dtarb/graip/#over): The Geomorphologic Road Analysis and Inventory
Technical Memorandum No
 Pajaro River Watershed Study in association with Technical Memorandum No. 1.2.10 Task: Evaluation of Four Watershed Conditions - Sediment To: PRWFPA Staff Working Group Prepared by: Gregory Morris and
Sediment Deposition LET THE RIVER RUN T E A C H E R. Activity Overview. Activity at a Glance. Time Required. Level of Complexity.
 Activity at a Glance Grade: 6 9 Subject: Science Category: Physical Science, Earth Science Topic: Deposition, River Systems Time Required Two 45-minute periods Level of Complexity Medium Materials* TI-73
Environmental Geology Chapter 9 Rivers and Flooding
 Environmental Geology Chapter 9 Rivers and Flooding Flooding in Pakistan 2010-1600 killed/20000 affected The hydrologic cycle is powered by the Sun The cycle includes evaporation, precipitation, infiltration,
Surface Processes Focus on Mass Wasting (Chapter 10)
") Surface Processes Focus on Mass Wasting (Chapter 10) 1. What is the distinction between weathering, mass wasting, and erosion? 2. What is the controlling force in mass wasting? What force provides resistance?
Surface Processes Focus on Mass Wasting (Chapter 10) 1. What is the distinction between weathering, mass wasting, and erosion? 2. What is the controlling force in mass wasting? What force provides resistance?
Rainfall Analysis. Prof. M.M.M. Najim
 Rainfall Analysis Prof. M.M.M. Najim Learning Outcome At the end of this section students will be able to Estimate long term mean rainfall for a new station Describe the usage of a hyetograph Define recurrence
Design Flood Estimation in Ungauged Catchments: Quantile Regression Technique And Probabilistic Rational Method Compared
 Design Flood Estimation in Ungauged Catchments: Quantile Regression Technique And Probabilistic Rational Method Compared N Rijal and A Rahman School of Engineering and Industrial Design, University of
Conceptual Model of Stream Flow Processes for the Russian River Watershed. Chris Farrar
 Conceptual Model of Stream Flow Processes for the Russian River Watershed Chris Farrar Several features of creeks affect the interactions between surface and groundwater. This conceptual model uses the
CASE STUDY #9 - Brushy Fork Dam, Sugar Grove, West Virginia
 CASE STUDY #9 - Brushy Fork Dam, Sugar Grove, West Virginia Brushy Fork Dam is a flood control structure built by the Soil Conservation Service southeast of the city of Franklin in Pendleton County, West
Kaskaskia Morphology Study Headwaters to Lake Shelbyville
 Kaskaskia Morphology Study Headwaters to Lake Shelbyville KWA Mini Summit 5 March 2012 1 Kaskaskia Morphology Study Headwaters to Lake Shelbyville Conducted by U.S. Army Corps of Engineers, St. Louis District
Geog Lecture 19
 Geog 1000 - Lecture 19 Fluvial Geomorphology and River Systems http://scholar.ulethbridge.ca/chasmer/classes/ Today s Lecture (Pgs 346 355) 1. What is Fluvial Geomorphology? 2. Hydrology and the Water
Groundwater-Surface Water Interactions along the Hangman, California, and Rock Creeks, September 30, 2009
 Groundwater-Surface Water Interactions along the Hangman, California, and Rock Creeks, September 30, 2009 Abstract This data collection effort was required to complete recommendations in the Hangman Creek
Pompton Lakes Dam Downstream Effects of the Floodgate Facility. Joseph Ruggeri Brian Cahill Michael Mak Andy Bonner
 Pompton Lakes Dam Downstream Effects of the Joseph Ruggeri Brian Cahill Michael Mak Andy Bonner ASFPM 2013: Overview Page 2 Overview Page 3 Overview Page 4 Overview Page 5 Overview - Historical Pompton
AASHTO Extreme Weather Events Symposium Vermont s Road and Rivers - Managing for the Future
 AASHTO Extreme Weather Events Symposium Vermont s Road and Rivers - Managing for the Future May 22, 2013 PLANET EARTH 2 2 MANY MANYYEARS AGO 23,000 years ago there was more than 8,000 feet of glacier over