Vindmøller nord for Als i Lillebælt
|
|
|
- Lucinda Wood
- 6 years ago
- Views:
Transcription
1 D A N M A R K S O G G R Ø N L A N D S G E O L O G I S K E U N D E R S Ø G E L S E R A P P O R T / 29 Vindmøller nord for Als i Lillebælt Bathymetrisk og geologisk kortlægning af område til opstilling af vindmøller i Lillebælt imellem Als og Fyn Jørgen O. Leth & Steen Lomholt DE N A T I O N A L E G E O L O G I S K E U N D E R S Ø G E L S E R FOR D A N M A R K O G G R Ø N L A N D, E N E R G I -, F O R S Y N I N G S - OG K L I M A M I N I S T E R I ET
2 DANMARKS OG GRØNLANDS GEOLOGISKE UNDERSØGELSE RAPPORT / 29 Kortlægning af området Lillebælt Syd Bathymetrisk og geologisk kortlægning af et område til opstilling af vindmøller Udført for Sønderborg Forsyning Jørgen O. Leth & Steen Lomholt Fortrolig rapport Kopi nr. Kan ikke frigives DE NATIONALE GEOLOGISKE UNDERSØGELSER FOR DANMARK OG GRØNLAND, ENERGI-, FORSYNINGS- OG KLIMAMINISTERIET
3 1. Executive Summary 3 2. Introduction Scope of work Geology Data processing, Interpretation and mapping Positioning Bathymetry Data source and processing Bathymetric mapping Seismic Data source and processing Interpretation and results Comment on possibly geotechnical hazard References Enclosures and Charts 17 G E U S 2
4 1. Executive Summary GEUS has performed a bathymetric and seismic mapping of the Lillebælt Syd area north of Als in relation to the construction of wind turbines. The interpretation is based on existing data provided by Sønderborg Forsyning A/S. The bathymetric data have been processed, cleaned and adjusted to existing bathymetry data with reference to DVR90. The data have been gridded and are presented as grid maps with 1 m contour intervals. The seismic data have been interpreted in relation to the distribution of the units regarded as muddy sediment. The data have been gridded and the resulting distribution and thickness is presented as gridded maps with 1 m contour intervals. The comparison between the water depth and the distribution of the muddy sediments indicates a relation between the distribution of the muddy and gassy sediments and the presence of a deep basin in the central part, the deep channel cutting the area to the southeast and at the edges of the study area. Another type of muddy/soft sediment is related to the shallower part and more local valleylike features of the study area including the possibility of lake deposits. G E U S 3

5 2. Introduction GEUS has been asked by NIRAS on behalf of Sønderborg Forsyning A/S to perform a bathymetric and seismic mapping of the Lillebælt Syd area north of Als, that should be used for the construction of wind turbines. The area is located in the southern part of Lillebælt, between Als and Fyn, near the Helnæs peninsula. The mapping is based on existing data provided by Sønderborg Forsyning A/S (Figure 1). Furthermore data from GEUS data archive have been used for depth correction of the bathymetric data. Figure 1 Extend of the study area in the southern part of Lillebælt. Side scan sonar, sparker seismic and bathymetric data are acquired in a grid of 1 x 1 km, covering the area with a total length of 286 km. Data were originally acquired for raw material exploration in 2009 by Rohde Nielsen A/S. Furthermore, 20 km of bathymetric data acquired by GEUS 2014 for habitat mapping are used for calibration of depth measurement (Figure 2). Six vibrocores are present in the northern part of the investigation area. They have been acquired as part of a pre-investigation survey for a cable route from Jylland to Fyn in The cores are shallow and cover only the uppermost part of the subsoil down to between 1.9 and 4.3 m (Figure 2). G E U S 4

6 Figure 2 Seismic data coverage for surveyed area. The seismic and bathymetric data from 2009 are illustrated with black lines and bathymetric from 2014 is data illustrated with blue lines. 3 m vibrocores are marked by red dots. 2.1 Scope of work The purpose with the work is to prepare basis material that could be used to identify potential areas for a 120 MW wind farm in the Lillebælt Syd area north of Als. GEUS has been asked to prepare a bathymetric map of the area, based on an existing dataset acquired in a grid of 1 x 1 km. Data was processed for heave and roll and de-spiked and depth corrected expressed as elevations relative to DVR90. Furthermore, GEUS has been asked to prepare a thickness map of mud based on seismic data in the 1 x 1 km seismic grid. Geological evidence on conditions that could cause geotechnical problems for wind turbines will be described and illustrated on seismic profiles. This could have an impact on the selection of areas suitable for the location of wind turbines. 2.2 Geology The surficial geology of the southern Lillebælt reflects the glacial deformation episodes during the end of the last glaciation. The most important impact of the southern part of Lillebælt is from the so-called Bælthavet Readvance (Houmark-Nielsen 1987), where a glacier intruded the area from the southeast. Meltwater deposits in the deepest part of Lillebælt are believed to originate from this event where water from the melting ice cap flowed G E U S 5


7 from the south to the north. In many areas, the glacial deposits are overlain by late glacial clayey and fine sandy deposits, which again can be overlain by early Holocene freshwater deposits often interlayered with organic deposits and peat (Bennike & Jensen, 2011). Marine Holocene sediments gradually cover these freshwater deposits. Also in the study area, there are indications of the presence of such late glacial deposits in incised channels. During the Holocene transgression, muddy sediments were deposited in the area, mostly connected to the deep basins, the fjords and the troughs in the deepest part. Between these basins, the seabed is partly influenced by areas of Holocene sand and gravel deposits with shallow areas of glacial deposits of moraine ridges and boulder reefs outcropping in between. Examples of such ridges within the study area are Lillegrund / Nordlige Lillegrund, Torø Banke and Hesteskoen. Figure 3. Locationmap and seismic section from an area to the northwest of the study area showing the general stratigraphy of the southern Lillebælt region. From Bennike & Jensen, G E U S 6
8 3. Data processing, Interpretation and mapping 3.1 Positioning For the data acquisition, two navigation systems were used: Simrad Seatex 20 GPS and Thales Sagitta GPS. Despite no differential correction have been used the positioning was very stable during the whole survey with an accuracy between 3-10 m. All positions in this report is in UTM zone 32N, ellipsoid WGS Bathymetry A gridded depth map for the investigation area, have been prepared from depth measurement acquired during the seismic profiling in a 1 x 1 m grid (Appendix 1) Data source and processing The bathymetric data has been acquired in 2009 with a Reson Navisound 215 dual frequency echosounder with a standard GPS system. The original survey was conducted as a regional exploration survey for sand and gravel, where sounding data only were used to determine depths to resources at seabed. X and Y offsets from antenna to Navisound position on the ship can be read in the header of the original raw data in NaviPac files (xxg.npd), and positions are corrected for offset in the navigation program. No. z offsets (the depth of transducer below sea surface) for the echosounder were recorded. An offset of the depth data is therefore introduced using corrected depth data from another survey that covers part of the investigation area. These data are collected by GEUS in 2014 during a habitat survey conducted by the Danish Nature Agency. These data are acquired with RTK positioning and therefore adjusted to DVR90. The overlap between the two surveys shows that the 2009 data z level need to be adjusted -0.6 m to match the new RTK corrected dataset. All data are expressed as elevations relative to DVR90 with negative depth values. Ungridded soundings is stored as (X,Y,Z) values in ASCII data format Bathymetric mapping Based on the depth corrected dataset a grid map was prepared with 1 m resolution and a 1 m contour interval map (Figure 4). The uncertainty on depth measurement is approximately 30 cm with a maximum of approximately 50 cm. The map is presented in Appendix 2. The depth variations are between 5 and - 40 m and the - 20 m depth contour line is highlighted to get a better understanding of the seabed morphology. G E U S 7

9 Figure 4 Bathymetric map of the investigation area, Lillebælt Syd. 3.3 Seismic Data source and processing The seismic data used was acquired in The seismic source is a Geo-Resources sparker model Geo-Spark 200. The energy level of the sparker has been set to 300 J and 400 J during the survey. The frequency of the transmitted pulse is within the interval of Hz. The reflected seismic signal was recorded via a 3 m hydrophone array with 8 elements connected in a series. The sparker data were recorded using the Chesapeake SonarWizMap5 system and stored in SEG-Y format. The Geographix Interpretation software is used for interpretation. The sparker data are used for mapping the distribution of the muddy sediments in the survey area. The thickness of the muddy sediments is determined by subtracting the depth to the mud surface from the depth to the seabed. The resulting thicknesses were exported to Excel for converting the TWT-values in milliseconds values to depths in metres using acoustic velocity of 1500 m/s. The gridding of the mud thicknessis done with the gridding software MapInfo Vertical Mapper. The interpolation method used is Nearest Neighbor with a cell size of 150 m and an aggregation distance of 10 m. G E U S 8

10 3.3.2 Interpretation and results The seismic sparker data, in general, provide information of the upper m of the seabed with a vertical resolution of about 0.5 to 1 m. The interpretation performed has focused on the distribution of units regarded as muddy sediment. Muddy sediments are known to appear with a transparent character in the seismic record, with no or indistinct internal acoustic layering due to the relatively high water content in the sediment. Gas plumes often appear in the seismic unit due to de-gassing of organic rich sediment in the underlying layers. No sediment cores have verified the interpretations of the seismic units in the study area. Thus, at this stage the seismic interpretation and the delineation of expected muddy sediments also include semi-transparent seismic units, which by experience is known to represent soft sediments of different origin. The resulting distribution and thickness map of the muddy and soft sediments is shown in figure 5. Figure 5. Isopach map of muddy sediments in the survey area. The maximum thickness of muddy sediment has been mapped in the central part of the study area. Here a northeast-southwest striking continuous basin is infilled with at least 12 m of soft and muddy deposits. The thickness of the unit has been estimated due the pres- G E U S 9

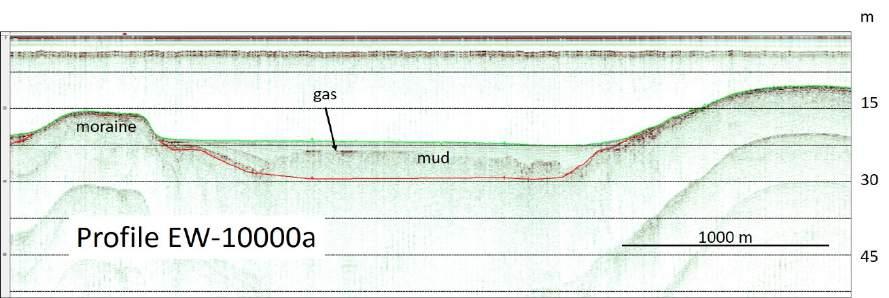
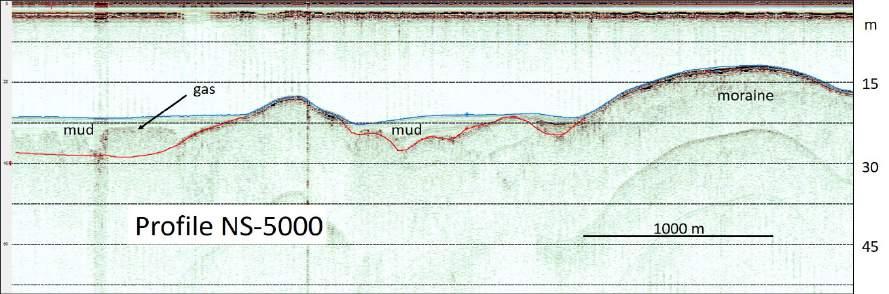
11 ence of gas in the sediment, which blurs the seismic record and by that eliminates the exact delineation of the unit i.e. the actual thickness can be higher than estimated. In the following a series of examples are presented to illustrate, the different types of seismic records, which have been included in the mapping of units, regarded as muddy or soft sediments. In figure 6 the location of the seismic profiles is presented. Figure 6. Overview map showing the location of the seismic profile described in the text. In the deepest part of the study area in general deeper than 20 m water depth muddy deposits with gas are widespread (see figure 9). The 5 seismic examples in figure 7 show the presence of the muddy unit in different parts of the study area. The basin-like structure is typical for this type of muddy sediments. G E U S 10

12 G E U S 11


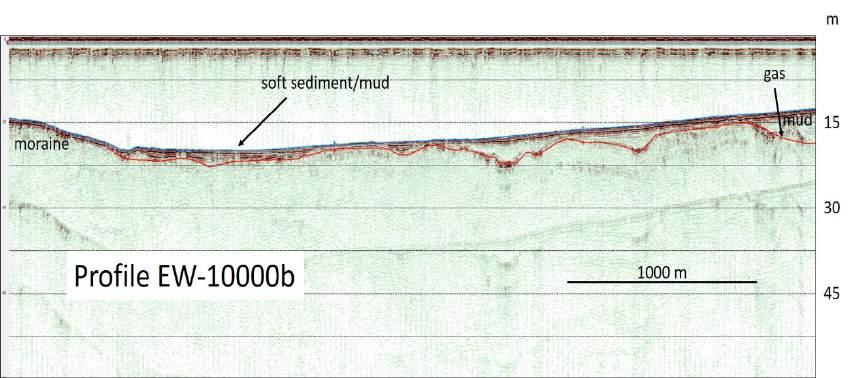
13 Figure 7. Seismic profiles showing transparent seismic units interpreted as muddy sediments bordering glacial deposits (moraine). Gas plumes appearing in the mud indicates degassing of underlying sediments. Outside the basin like structures, muddy sediments have been designated in closed basins or in infilled valleys. Here gas is not present and the bottom layers of the units, in general, are easy to determine. The seismic display of the unit in these areas often show weak internal seismic layering which indicate a layering in the sediment e.g. changes in the fine grained sediments types from muddy sand to sandy mud with interlayering of fine sands or the presence of peat layers. Examples of this type are given in figure 8. Some of the units in the figures are named soft sediment/mud to indicate the difference between these units and the muddy units with gas in figure 7. G E U S 12

14 G E U S 13


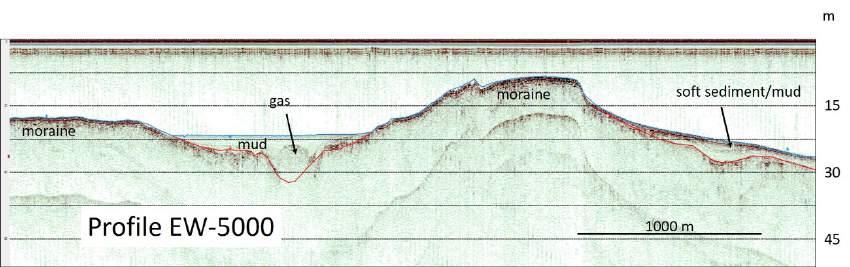
15 Figure 8. Seismic profiles showing transparent seismic units interpreted as muddy and/or soft sediments bordering glacial deposits (moraine), in general above 20 m water depths. In figure 9 the relation between the water depth and the distribution of the muddy sediments is shown. The blue line indicates the 20 m depth contour line. A comparison between the seismic profiles in figure 7 indicates the distribution of the muddy and gassy sediments are related to the deep basin in the central part, the deep channel cutting the area to the southeast and at the edges of the study area. The opposite relation to the other type of muddy/soft sediments shown in seismic profiles in figure 8 is related to the shallower part and more local valley-like features of the study area. Figure 9. The relation between the water depth and the distribution of the muddy sediments. The blue line indicates the 20 m depth contour line. G E U S 14
16 3.4 Comment on possibly geotechnical hazard. It is well known that muddy sediments, containing gas, could cause geotechnical problems, such as instability of seabed and gas leakage, as seen at Sæby, Nearshore Wind Farm project and the Anholt Wind Farm. The present study has illustrated, that the muddy and gassy sediments are related to the deep basin in the central part of the Lillebælt area and the deep channel cutting the area to the southeast and at the edges of the study area, as seen in figure 7. The maximum thickness of muddy sediment varies from 8 to 12 m, based on the seismic interpretation. In other areas muddy sediment could superimpose deeper soft late glacial sediments, which could be the case at Profile EW 5000 figure 8, where gas signature is annotated. Local basins with freshwater lake deposits could be a potential hazard for exploration and establishment of wind turbines. The presence of organic rich peat layers in these basins blurs the seismic data below and potential soft sediments will be invisible on the seismic. This could be the case in the western part of the profiles EW-10000b and NS It should be emphasized that there is a lack of cores in the survey area and by that the seismic interpretations have not been verified. The interpretations of the seismic might be adjusted if vibrocores are performed at a later stage in the investigation of the area. G E U S 15
17 4. References Bennike, O. & Jensen, J. B., 2011: Postglacial, relative shore-level changes in Lillebælt, Denmark. Geol. Surv. of Denmark and Greenland Bull. 23, Houmark-Nielsen, M., 1987: Pleistocene stratigraphy and glacial history of the central part of Denmark. Bull, geol. Soc. Denmark, vol. 36, pp G E U S 16
18 5. Enclosures and Charts G E U S 17
19
20
21
22 Appendix 4 G E U S
23 CMP Shot 0 0 m gas moraine 15 mud Profile EW m 45


24 m moraine gas 15 mud 30 Profile EW 10000a 1000 m 45


25 m gas moraine 15 mud mud 30 Profile NS m 45


26 m gas 15 moraine mud mud moraine 30 Profile NS m 45
27 m gas 15 moraine mud moraine 30 Profile NS m 45


28 m soft sediment/mud 15 moraine 30 Profile EW m 45

29 m moraine mud ga s moraine soft sediment/mud Profile EW m 45


30 m soft sediment/mud gas moraine mud Profile EW 10000b 1000 m 45

31 m moraine soft sediment/mud moraine Profile NS m 45
DANCORE-Day. Master s Thesis
 DANCORE-Day Master s Thesis Interpretation of Shallow Seismic and Sediment Cores from the Area stretching from the Southern Part of Kattegat to the Great Belt in the Period Late-Weichselian to Early Holocene.
THE QUATERNARY GEOLOGY OF NEWARK BAY AND KILL VAN KULL CHANNEL, NEW YORK AND NEW JERSEY. and
 THE QUATERNARY GEOLOGY OF NEWARK BAY AND KILL VAN KULL CHANNEL, NEW YORK AND NEW JERSEY Stephanie Beda, W. Bruce Ward, William Murphy, Robert Fleming, Gary Fleming, Beckett Boyd Earthworks LLC 27 Glen
Data and Information Management. UK All Energy 22 nd May Presented by Leo James
 Data and Information Management UK All Energy 22 nd May 2013 Presented by Leo James Strategic Development Plans Observations at the outset Data and information management and dissemination: company or
FINMARINET: Inventories and Planning for the Marine Natura 2000 Network in Finland. A.2 Geological inventories of the seafloor Final Report
 LIFE07 NAT/FIN/000151 FINMARINET: Inventories and Planning for the Marine Natura 2000 Network in Finland A.2 Geological inventories of the seafloor Final Report Geological Survey of Finland, GTK 1. Introduction
SAND WINNING - PHASE II REPORT
 ADRIATIC SEA - ABRUZZO GEOPHYSICAL SURVEY SAND WINNING - PHASE II REPORT Date: 11/08/2009 Ref: 09_053/MA/GP/RE Version Date Reason for Issue Written by Checked by Approved by 01 11/08/09 ARE GMO FRE Certified
Aarhus Area Overview of geological conditions in Aarhus and surrounding areas
 Aarhus Area Overview of geological conditions in Aarhus and surrounding areas GeoAtlas Live Documentation Report 1, 2018-07-12 This report gives a brief overview of the geological setting and interpretation
Appendix 3: Sæby Offshore Wind Farm Technical Description, Offshore
 Appendix 3: Sæby Offshore Wind Farm Technical Description, Offshore Appendix 3: Sæby Offshore Wind Farm Technical Description, Offshore Appendix 3: Sæby Offshore Wind Farm Technical Description, Offshore
Relationship between gas-bearing (?) sediments and biogenic mounds in the Kalloni Gulf, Lesvos Island, Greece
 sediments and biogenic mounds in the Kalloni Gulf, Lesvos Island, Greece") 6 th Workshop Seabed Acoustics, Rostock, November 14/15, 2013 P13-1 Relationship between gas-bearing (?) sediments and biogenic mounds in the Kalloni Gulf, Lesvos Island, Greece Alexandros Chronis, Dr.
6 th Workshop Seabed Acoustics, Rostock, November 14/15, 2013 P13-1 Relationship between gas-bearing (?) sediments and biogenic mounds in the Kalloni Gulf, Lesvos Island, Greece Alexandros Chronis, Dr.
Topic: Bathymetric Survey Techniques. (a) Single-beam echo-sounders (SBES) (b) Multi-beam echo-sounders (MBES)
 Single-beam echo-sounders (SBES) (b) Multi-beam echo-sounders (MBES)") Topic: Bathymetric Survey Techniques (a) Single-beam echo-sounders (SBES) (b) Multi-beam echo-sounders (MBES) Bathymetry is the measurement of water depths - bathymetry is the underwater equivalent of
Topic: Bathymetric Survey Techniques (a) Single-beam echo-sounders (SBES) (b) Multi-beam echo-sounders (MBES) Bathymetry is the measurement of water depths - bathymetry is the underwater equivalent of
ANALYSIS OF SEISMIC PROFILES AND SIDE-SCAN SONAR RECORDS FROM LOWER NEW YORK HARBOR, A PROGRESS REPORT. Roger D. Flood Vicki Lynn Ferrini
 45 ANALYSIS OF SISMIC PROFILS AND SID-SCAN SONAR RCORDS FROM LOWR NW YORK HARBOR, A PROGRSS RPORT Roger D. Flood Vicki Lynn Ferrini Marine Sciences Research Center State University of New York, Stony Brook,
Mo Myce 06 Comparative Seismic Source Study for Buried Palaeolandscape Investigations in the Southern North Sea
 Mo Myce 06 Comparative Seismic Source Study for Buried Palaeolandscape Investigations in the Southern North Sea O.J. Zurita Hurtado* (Renard Centre of Marine Geology - Ghent University), T. Missiaen (Renard
2) re-positioning of the SSS data, 3) individuation of geomorphological features and morphometrical parameters correlated to instability phenomena.
 re-positioning of the SSS data, 3) individuation of geomorphological features and morphometrical parameters correlated to instability phenomena.") HIGH-RESOLUTION SIDE SCAN SONAR AND MULTIBEAM DATA PROCESSING AND MERGING TO STUDY SUBMARINE INSTABILITY PHENOMENA ON VOLCANIC ISLANDS (PONTINE, CAMPANIAN AND AEOLIAN ARCHIPELAGOS) A. BOSMAN Extended abstract:
HIGH-RESOLUTION SIDE SCAN SONAR AND MULTIBEAM DATA PROCESSING AND MERGING TO STUDY SUBMARINE INSTABILITY PHENOMENA ON VOLCANIC ISLANDS (PONTINE, CAMPANIAN AND AEOLIAN ARCHIPELAGOS) A. BOSMAN Extended abstract:
SITE SURVEY FOR SITE 410, AN EXAMPLE OF THE USE OF LONG-RANGE SIDE-SCAN SONAR (GLORIA)
") 10. SITE SURVEY FOR SITE 410, AN EXAMPLE OF THE USE OF LONG-RANGE SIDE-SCAN SONAR (GLORIA) R. C. Searle and A. S. Laughton, Institute of Oceanographic Sciences, Wormley, GU8 5UB, UK and B. D. Loncarevic,
10. SITE SURVEY FOR SITE 410, AN EXAMPLE OF THE USE OF LONG-RANGE SIDE-SCAN SONAR (GLORIA) R. C. Searle and A. S. Laughton, Institute of Oceanographic Sciences, Wormley, GU8 5UB, UK and B. D. Loncarevic,
Iceberg Plough Marks in the Vicinity of the Norwegian Trough
 Iceberg Plough Marks in the Vicinity of the Norwegian Trough ROBERT H. BELDERSON & JOHN B. WILSON Belderson, R. H. & Wilson, J. B.: Iceberg plough marks in the vicinity of the Norwegian Trough. Norsk Geologisk
The Palmer Hill Glacial-Marine Delta, Whitefield, Maine
 Maine Geologic Facts and Localities December, 2010, Maine 44 o 10 12.16 N, 69 o 37 18.93 W Text by Woodrow Thompson, Department of Agriculture, Conservation & Forestry 1 Introduction The most recent continental
Geophysical Site Surveys
 Geophysical Site Surveys Simon Oakley Geoscience Team Leader Fugro Survey Limited 16/04/2014 Contents Menu Introduction Section 1 - Geophysical Site Surveys - Seabed Bathymetry - Shallow Geology - Seabed
COBRA Cable Site Investigation in the Wadden Sea, Denmark
 NGM 2016 Reykjavik Proceedings of the 17 th Nordic Geotechnical Meeting Challenges in Nordic Geotechnic 25 th 28 th of May COBRA Cable Site Investigation in the Wadden Sea, Denmark L. Klinkby COWI, Denmark,
The Geology of Sebago Lake State Park
 Maine Geologic Facts and Localities September, 2002 43 55 17.46 N, 70 34 13.07 W Text by Robert Johnston, Department of Agriculture, Conservation & Forestry 1 Map by Robert Johnston Introduction Sebago
DATA REPOSITORY MATERIAL: PALEOCHANNEL GROUP MAPPING DESCRIPTIONS
 Data Repository item 2695 DATA REPOSITORY MATERIAL: PALEOCHANNEL GROUP MAPPING DESCRIPTIONS Groups 1 (North Myrtle Beach) and 2 (Atlantic Beach) Channel Groups 1 (North Myrtle Beach) and 2 (Atlantic Beach)
Basin Analysis Applied to Modelling Buried Valleys in the Great Lakes Basin
 EARTH SCIENCES SECTOR GENERAL INFORMATION PRODUCT 35 Basin Analysis Applied to Modelling Buried Valleys in the Great Lakes Basin Sharpe, D R; Russell, H A J 2004 Originally released as: Basin Analysis
Copenhagen Area Overview of the geological conditions in the Copenhagen area and surrounding areas
 Copenhagen Area Overview of the geological conditions in the Copenhagen area and surrounding areas GeoAtlas Live Documentation Report 1, 2018-07-12 This report gives a brief overview of the geological
IODP Science Evaluation Panel: Guidelines and Rationale for Site Characterization Data (Revised: August 2013)
") Site Characterization Data Guidelines IODP Science Evaluation Panel: Guidelines and Rationale for Site Characterization Data (Revised: August 2013) This document outlines the method and rationale for data
Site Characterization Data Guidelines IODP Science Evaluation Panel: Guidelines and Rationale for Site Characterization Data (Revised: August 2013) This document outlines the method and rationale for data
Detailed structure of buried glacial landforms revealed by high-resolution 3D seismic data in the SW Barents Sea
 Detailed structure of buried glacial landforms revealed by high-resolution 3D seismic data in the SW Barents Sea Benjamin Bellwald 1, Sverre Planke 1,2, Stéphane Polteau 1, Nina Lebedova-Ivanova 1, Amer
Changes in bottom morphology of Long Island Sound near Mount Misery Shoal as observed through Repeated Multibeam Surveys
 Changes in bottom morphology of Long Island Sound near Mount Misery Shoal as observed through Repeated Multibeam Surveys Laurie A. Zaleski Laurie.Zaleski@msrc.sunysb.edu Roger D. Flood rflood@notes.cc.sunysb.edu
Kigoma Bay bathymetry, sediment distribution, and acoustic mapping
 Kigoma Bay bathymetry, sediment distribution, and acoustic mapping Student: Gwynneth Smith Mentor: Kiram Lezzar Introduction Echosounding is a method commonly employed for determining the bathymetry of
Changes in Geomorphology and Backscatter Patterns in Mount Misery Shoal, Long Island Sound as Revealed through Multiple Multibeam Surveys
 Changes in Geomorphology and Backscatter Patterns in Mount Misery Shoal, Long Island Sound as Revealed through Multiple Multibeam Surveys Laurie A. Zaleski Laurie.Zaleski@msrc.sunysb.edu, Roger D. Flood
Geological control in 3D stratigraphic modeling, Oak Ridges Moraine, southern Ontario. Logan, C., Russell, H. A. J., and Sharpe, D. R.
 Geological control in 3D stratigraphic modeling, Oak Ridges Moraine, southern Ontario Logan, C., Russell, H. A. J., and Sharpe, D. R. Rationale Increasing urbanization in the Greater Toronto Area is creating
Buried-valley Aquifers: Delineation and Characterization from Reflection Seismic and Core Data at Caledon East, Ontario
 Buried-valley Aquifers: Delineation and Characterization from Reflection Seismic and Core Data at Caledon East, Ontario Russell, H.A.J. 1, S.E. Pullan 1, J.A. Hunter 1, D.R. Sharpe 1, and S. Holysh 2 1
Aarhus City Area Overview of geological conditions in the central part of Aarhus and Harbour area
 Aarhus City Area Overview of geological conditions in the central part of Aarhus and Harbour area GeoAtlas Live Documentation Report 1, 2018-07-12 This report gives a brief overview of the geological setting
Offshore Operations and Project Execution Geophysical Site Surveys
 Offshore Operations and Project Execution Geophysical Site Surveys Chris Almond Senior Geophysicist Fugro Survey Limited 22/04/2015 Presentation Summary: Office-based Personnel Project Awarded Pre Offshore
Michigan s Geology and Groundwater
 Michigan s Geology and Groundwater Ralph J. Haefner Deputy Director U.S. Geological Survey Michigan-Ohio Water Science Center Lansing, Michigan Outline About the USGS Geology 101 Michigan s geology Bedrock
Aspects of the Tertiary Development of the Wyville-Thomson Ridge Complex, SW Faroe Islands based on 2D digital seismic data
 Aspects of the Tertiary Development of the Wyville-Thomson Ridge Complex, SW Faroe Islands based on 2D digital seismic data Highlights of my Master Project at Institute of Geography and Geology, KU By
4.3. Geomorphologic route along the Urasalakh River
 The Expedition Lena-Anabar 2003 4 Periglacial studies around Cape Mamontov Klyk 4.3. Geomorphologic route along the Urasalakh River Dimitri Bolshiyanov and Alexander Makarov 4.3.1 Structure of Quaternary
Amazing Ice: Glaciers and Ice Ages
 Amazing Ice: Glaciers and Ice Ages Updated by: Rick Oches, Professor of Geology & Environmental Sciences Bentley University Waltham, Massachusetts Based on slides prepared by: Ronald L. Parker, Senior
An overview of the use of acoustic data for geology and habitat mapping in MAREANO
 An overview of the use of acoustic data for geology and habitat mapping in MAREANO Margaret Dolan, Valerie Bellec, Sigrid Elvenes, Reidulv Bøe, Terje Thorsnes, Shyam Chand, Leif Rise, Monica Winsborrow
MARINE GEOLOGY & GEOGRAPHY
 MARINE GEOLOGY & GEOGRAPHY Bathymetry BATHYMETRY BATHYMETRY THE UNDERWATER EQUIVALENT TO TOPOGRAPHY THE STUDY OF WATER DEPTH A BATHYMETRIC MAP SHOWS FLOOR RELIEF OR TERRAIN AS CONTOUR LINES Bathymetry
Reading Material. See class website. Sediments, from Oceanography M.G. Gross, Prentice-Hall
 Reading Material See class website Sediments, from Oceanography M.G. Gross, Prentice-Hall Materials filling ocean basins Dissolved chemicals especially from rivers and mid-ocean ridges (volcanic eruptions)
CHAPTER 28. PHYSIOGRAPHY Cook Inlet Drainages
 PEBBLE PROJECT ENVIRONMENTAL BASELINE DOCUMENT 2004 through 2008 CHAPTER 28. PHYSIOGRAPHY Cook Inlet Drainages PREPARED BY: Knight Piésold Ltd. PHYSIOGRAPHY COOK INLET DRAINAGES TABLE OF CONTENTS TABLE
Properties of Danish Clay Tills determined from laboratory testing
 Properties of Danish Clay Tills determined from laboratory testing S. B. Jessen 1 GEO, Lyngby, Denmark ABSTRACT As a part of the soil investigations for the Fehmarnbelt Fixed Link project (tunnel or bridge),
Late glacial to early Holocene development of southern Kattegat Bendixen, Carina; Jensen, Jørn Bo; Bennike, Ole; Boldreel, Lars Ole
 university of copenhagen Københavns Universitet Late glacial to early Holocene development of southern Kattegat Bendixen, Carina; Jensen, Jørn Bo; Bennike, Ole; Boldreel, Lars Ole Published in: Geological
Why is Sebago Lake so deep?
 Maine Geologic Facts and Localities February, 1999 Why is Sebago Lake so deep? 43 51 13.36 N, 70 33 43.98 W Text by Robert A. Johnston, Department of Agriculture, Conservation & Forestry 1 Introduction
Digital Elevation Model (DEM) of Sable Island Bank and adjacent areas
 of Sable Island Bank and adjacent areas") GEOLOGICAL SURVEY OF CANADA OPEN FILE 5348 Digital Elevation Model (DEM) of Sable Island Bank and adjacent areas K.J. Webb and E.L. King 2014 GEOLOGICAL SURVEY OF CANADA OPEN FILE 5348 Digital Elevation
GEOLOGICAL SURVEY OF CANADA OPEN FILE 5348 Digital Elevation Model (DEM) of Sable Island Bank and adjacent areas K.J. Webb and E.L. King 2014 GEOLOGICAL SURVEY OF CANADA OPEN FILE 5348 Digital Elevation
Investigating the potential of stone reefs in reducing. of a stone reef in the Natura 2000-area Løgstør Bredning, Vejlerne and Bulbjerg
 Investigating the potential of stone reefs in reducing nutrient loads, as an input to the reestablishing of a stone reef in the Natura 2000-area Løgstør Bredning, Vejlerne and Bulbjerg The geological study
Ultrasonic Measuring System for Deposition of Sediments in Reservoirs
 MECAHITECH 11, vol. 3, year: 011 Ultrasonic Measuring System for Deposition of Sediments in Reservoirs M. Mărgăritescu* 1, A. Moldovanu * 1, P. Boeriu *, A.M.E. Rolea* 1 * 1 National Institute of Research
Lake Levels and Climate Change in Maine and Eastern North America during the last 12,000 years
 Maine Geologic Facts and Localities December, 2000 Lake Levels and Climate Change in Maine and Eastern North America during the last 12,000 years Text by Robert A. Johnston, Department of Agriculture,
Appendix H High Resolution Marine Seismic Reflection Surveys
 Appendix H High Resolution Marine Seismic Reflection Surveys Shoreline Fault Zone Report, Appendix H Seis. Reflection Page H-1 of 8 Introduction Single-channel seismic-reflection data were acquired in
Advanced processing and inversion of two AEM datasets for 3D geological modelling: the case study of Spiritwood Valley Aquifer
 Advanced processing and inversion of two AEM datasets for 3D geological modelling: the case study of Spiritwood Valley Aquifer Vincenzo Sapia, INGV, Rome, Italy Vincenzo.sapia@ingv.it Andrea Viezzoli,
Station Description Sheet W03
 Station Description Sheet W3 1. General Information 2. Geographical Information / Geomorphology 3. Geological Information 4. Geotechnical Site Characterization 5. Geophysical Site Characterization 6. Site
Regional-scale understanding of the geologic character and sand resources of the Atlantic inner continental shelf, Maine to Virginia
 Regional-scale understanding of the geologic character and sand resources of the Atlantic inner continental shelf, Maine to Virginia Workshop on Dredging, Beach Nourishment and Bird Conservation Atlantic
4. The map below shows a meandering stream. Points A, B, C, and D represent locations along the stream bottom.
 1. Sediment is deposited as a river enters a lake because the A) velocity of the river decreases B) force of gravity decreases C) volume of water increases D) slope of the river increases 2. Which diagram
Ground-Water Exploration in the Worthington Area of Nobles County: Summary of Seismic Data and Recent Test Drilling Results
 Ground-Water Exploration in the Worthington Area of Nobles County: Summary of Seismic Data and Recent Test Drilling Results Jim Berg and Todd Petersen Geophysicists, DNR Waters January 2000 Table of Contents
The Niagara Escarpment extends from western New York, through the GTA all the way up to Manitoulin Island and into Michigan and Wisconsin.
 is southern Ontario s most prominent topographic feature, extending more than 500 kilometres from western New York, through Niagara Falls and the western part of the Greater Toronto Area (GTA), and north
,Baynes Lake. TO...?&.?...A 2...KO.?'!!&... Sr. *logical Engineer
 > i evernment OF BRITISH COLUMBIA a TO...?&.?...A 2....KO.?'!!&... Sr. *logical Engineer... Grou,,water. Section Hydrology Division Wat.er... In~.~s.tiga.ti.On.s..Branck.... 5 u BJECT...C;.roun.dw.ater...Snve
'0"W. Sigguk 70 45'0"N. B a f f i n. B a y. Bathymetric high referenced in section A l h a. g e. o u g h. i d.
 p 60 50'0"W Baffin Bay Greenland Sigguk B a f f i n B a y S h e l f E d g e Beta 8 6 5 4 19 21 U u m m a n n a q C h a n n e l Note: Lineaments are iceberg scours Gamma 3 10 12 1 11 2 Bathymetric high
Monitoring The Sand Extraction On The Belgian Continental Shelf
 Monitoring The Sand Extraction On The Belgian Continental Shelf Methodology, Results And Expectations K. Degrendele and M. Roche Within the framework of a sustainable exploitation of the mineral resources
Bulletin of Earth Sciences of Thailand
 Quantitative Seismic Geomorphology of Early Miocene to Pleistocene Fluvial System of Northern Songkhla Basin, Gulf of Thailand Oanh Thi Tran Petroleum Geoscience Program, Department of Geology, Faculty
HYDROGEOLOGIC FRAMEWORK OF LONG ISLAND'S NORTH FORK, SUFFOLK COUNTY, NEW YORK
 HYDROGEOLOGIC FRAMEWORK OF LONG ISLAND'S NORTH FORK, SUFFOLK COUNTY, NEW YORK Christopher E. Schubert 1, Richard E. Bova 2, and Paul E. Misut 1 1 U.S. Geological Survey, 2045 Route 112, Building 4, Coram,
Walkaway Seismic Experiments: Stewart Gulch, Boise, Idaho
 Walkaway Seismic Experiments: Stewart Gulch, Boise, Idaho Lee M. Liberty Center for Geophysical Investigation of the Shallow Subsurface Boise State University Boise, Idaho 1. Summary CGISS conducted walkaway
Detailed Surficial Geologic Mapping and Terrain Analysis of the Blue Hills Felsenmeer Valley, Rusk County, Wisconsin
 Detailed Surficial Geologic Mapping and Terrain Analysis of the Blue Hills Felsenmeer Valley, Rusk County, Wisconsin Department of Geology, University of Wisconsin, Eau Claire, WI 54702 Jeremy Hinke and
Permafrost-influenced Geomorphic Processes
 Section 4 Permafrost-influenced Geomorphic Processes Geomorphic processes vary greatly among ecoregions in northern Alaska, extending from the Beaufort Sea coast to the Brooks Range (Figure 4.1). Regional
National Marine Sanctuary Program
 National Marine Sanctuary Program NMSP/USGS Joint Seabed Mapping Initiative: September 2004 AA National Ocean Service National Marine Sanctuaries Interim Report September 2004 Background: Since 2002,
J.B. Shaw and D. Mohrig
 GSA DATA REPOSITORY 2014008 J.B. Shaw and D. Mohrig Supplementary Material Methods Bathymetric surveys were conducted on 26 June- 4 July, 2010 (Fig. 2A), 7 March, 2011 (Fig. 2B), 11-12 August, 2011 (Figs.
Geology and New England Landscapes
 Geology and New England Landscapes Jim Turenne, CPSS USDA-NRCS Warwick, RI. http://nesoil.com Why Geology? Provides the big picture of site conditions. Major part of soil formation (parent material and
NEW PRODUCTS AND ADVANCEMENTS IN 3-D MODELLING PROTOCOLS BASED ON STUDIES IN THICK DRIFT AREAS IN ONTARIO, CANADA
 NEW PRODUCTS AND ADVANCEMENTS IN 3-D MODELLING PROTOCOLS BASED ON STUDIES IN THICK DRIFT AREAS IN ONTARIO, CANADA Abigail K. Burt and Andrew F. Bajc Ontario Geological Survey, 933 Ramsey Lake Road, Sudbury,
Supplement of Scenario-based numerical modelling and the palaeo-historic record of tsunamis in Wallis and Futuna, Southwest Pacific
 Supplement of Nat. Hazards Earth Syst. Sci., 15, 1763 1784, 2015 http://www.nat-hazards-earth-syst-sci.net/15/1763/2015/ doi:10.5194/nhess-15-1763-2015-supplement Author(s) 2015. CC Attribution 3.0 License.
Moosehead Lake and the Tale of Two Rivers
 Maine Geologic Facts and Localities June, 2005 45 o 53 5.09 N, 69 o 42 14.54 W Text by Kelley, A.R.; Kelley, J.T.; Belknap, D.F.; and Gontz, A.M. Department of Earth Sciences, University of Maine, Orono,
Geological Mapping using Geophysics
 Geological Mapping using Geophysics Pugin, A.J.M. and T.H. Larson Illinois State Geological Survey, 615 E Peabody Dr., Champaign, IL 61820; E-mail: A.J.M. Pugin at pugin@isgs.uiuc.edu Mapping Techniques.
Airborne gravity gradiometer surveying of petroleum systems under Lake Tanganyika, Tanzania
 Airborne gravity gradiometer surveying of petroleum systems under Lake Tanganyika, Tanzania D. Roberts Beach Energy P. Roy Chowdhury CGG S. J. Lowe CGG A. N. Christensen CGG Outline Introduction Geology
Station Description Sheet GRA
 Station Description Sheet GRA 1. General Information 2. Geographical Information / Geomorphology 3. Geological Information 4. Geotechnical Site Characterization 5. Geophysical Site Characterization 6.
Supplementary Material
 GSA Data Repository item 2018118 Brardinoni, F., Picotti, V., Maraio, S., Paolo Bruno, P., Cucato, M., Morelli, C., and Mair, V., 2018, Postglacial evolution of a formerly glaciated valley: Reconstructing
Neogene Stratigraphic Development of the Arabian (Persian) Gulf
 Gulf") Neogene Stratigraphic Development of the Arabian (Persian) Gulf Stephen A. Swift and David A. Ross Dept. of Geology and Geophysics Woods Hole Oceanographic Institution Woods Hole, MA 02543 Swift: ph: 508-289-2626
Neogene Stratigraphic Development of the Arabian (Persian) Gulf Stephen A. Swift and David A. Ross Dept. of Geology and Geophysics Woods Hole Oceanographic Institution Woods Hole, MA 02543 Swift: ph: 508-289-2626
Stratigraphic and Geoacoustic Characterization of the Outer New Jersey Shelf
 Stratigraphic and Geoacoustic Characterization of the Outer New Jersey Shelf John A. Goff Institute for Geophysics, Jackson School of Geoscience University of Texas at Austin JJ Pickle Research Campus,
(with 3 Text-figures)
") 18 SUBTIDAL SEDIMENTARY FACIES, SOUTHERN MORETON BAY by M.C. Friederich (with 3 Text-figures) ABSTRACT. On the basis of the mud/sand and carbonate content, sediments are assigned to one of four facies:
18 SUBTIDAL SEDIMENTARY FACIES, SOUTHERN MORETON BAY by M.C. Friederich (with 3 Text-figures) ABSTRACT. On the basis of the mud/sand and carbonate content, sediments are assigned to one of four facies:
Holocene Carbonate-Siliciclastic Shoreline and Ravinement Stratigraphy of the Belize Lagoon: a Mixed-System Model
 Holocene CarbonateSiliciclastic Shoreline and Ravinement Stratigraphy of the Belize Lagoon: a MixedSystem Model DONALD F. MCNEILL AND CLINTON A. COWAN Key findings o Mixedsystem facies heterogeneity during
HYBRID DETERMINISTIC AND STOCHASTIC HYDROSTRATIGRAPHIC MODELING OF A COMPLEX GLACIAL AQUIFER SYSTEM
 HYBRID DETERMINISTIC AND STOCHASTIC HYDROSTRATIGRAPHIC MODELING OF A COMPLEX GLACIAL AQUIFER SYSTEM Lawrence D. Lemke, Andrew L. Frahm, Lena K. Pappas Department of Geology, Wayne State University, Detroit,
Varying Bathymetric Data Collection Methods and their Impact on Impoundment Volume and Sediment Load Calculations I.A. Kiraly 1, T.
 Varying Bathymetric Data Collection Methods and their Impact on Impoundment Volume and Sediment Load Calculations I.A. Kiraly 1, T. Sullivan 2 1 Gomez and Sullivan Engineers, D.P.C., 41 Liberty Hill Road,
A lithological map created from multibeam backscatter data in challenging circumstances: the Lower Sea Scheldt estuary
 A lithological map created from multibeam backscatter data in challenging circumstances: the Lower Sea Scheldt estuary Mieke Mathys*, Marc Sas*, Frederik Roose** HYDRO12, Rotterdam, 15/11/2012 *International
Acoustical recognition of the bottom sediments in the southern Baltic Sea
 Acoustical recognition of the bottom sediments in the southern Baltic Sea PACS: 43.30.Ma Jaros³aw Têgowski Institute of Oceanology, Polish Academy of Sciences, Powstañców Warszawy 55,8-7 Sopot, Poland,
Environmental impact assessment study of the new offshore dumping sites for Šventoji port in Lithuania
 Environmental impact assessment study of the new offshore dumping sites for Šventoji port in Lithuania Introduction Summary In 2003 Lithuanian Ministry of Transport initiated the preparation of feasibility
Cretaceous, Dakota Formation, Terra Cotta Member South Side of I-70, Salina County, Kansas
 Cretaceous, Dakota Formation, Terra Cotta Member South Side of I-70, Salina County, Kansas Written By: Steven D.J. Baumann G-102010-1A Outcrop looking southeast Photo taken by: Steven Baumann on 10-20-2010
Redwood City Harbor, California, Navigation Improvement Feasibility Study. Appendix D. Geotechnical Engineering. DRAFT April 2015
 1 Redwood City Harbor, California, Navigation Improvement Feasibility Study Appendix D Geotechnical Engineering DRAFT April 2015 2 Contents 1 Purposes of Report... 3 2 Background... 3 3 References and
High-resolution Geophysical Mapping of Submarine Glacial Landforms
 High-resolution Geophysical Mapping of Submarine Glacial Landforms M. Jakobsson 1, J.A. Dowdeswell 2, M. Canals 3, B.J. Todd 4, E.K. Dowdeswell 2, K.A. Hogan 5 L.A. Mayer 6 1 Stockholm University, Sweden
CHAPTER 6 RESULTS FIGURE 8.- DATA WORK FLOW FOR BACKSCATTER PROCESSING IN HYPACK
 CHAPTER 6 RESULTS 6.1. Backscatter Workflow Comparison Currently, INOCAR owns and operates RESON and Kongsberg multibeam systems for nearshore surveys. The RESON system is integrated with HYPACK Hysweep
Comment on: Cenozoic evolution of the eastern Danish North Sea by M. Huuse, H. Lykke-Andersen and O. Michelsen, [Marine Geology 177, 243^269]
![Comment on: Cenozoic evolution of the eastern Danish North Sea by M. Huuse, H. Lykke-Andersen and O. Michelsen, [Marine Geology 177, 243^269]](/thumbs/93/112023617.jpg "Comment on: Cenozoic evolution of the eastern Danish North Sea by M. Huuse, H. Lykke-Andersen and O. Michelsen, [Marine Geology 177, 243^269]") Marine Geology 186 (2002) 571^575 Discussion Comment on: Cenozoic evolution of the eastern Danish North Sea by M. Huuse, H. Lykke-Andersen and O. Michelsen, [Marine Geology 177, 243^269] P. Japsen, T.
Marine Geology 186 (2002) 571^575 Discussion Comment on: Cenozoic evolution of the eastern Danish North Sea by M. Huuse, H. Lykke-Andersen and O. Michelsen, [Marine Geology 177, 243^269] P. Japsen, T.
DEVELOPMENT OF EMPIRICAL CORRELATION BETWEEN SHEAR WAVE VELOCITY AND STANDARD PENETRATION RESISTANCE IN SOILS OF CHENNAI CITY
 DEVELOPMENT OF EMPIRICAL CORRELATION BETWEEN SHEAR WAVE VELOCITY AND STANDARD PENETRATION RESISTANCE IN SOILS OF CHENNAI CITY Uma Maheswari R 1, Boominathan A 2 and Dodagoudar G.R 3 1 Research Scholar,
Hydroacoustic survey and bathymetric map creation for Brant Lake, New York
 Hydroacoustic survey and bathymetric map creation for Brant Lake, New York Holly A. Waterfield CLM 1 INTRODUCTION Brant Lake is located in Warren County, New York, within the bounds of the Adirondack Park.
25. SURVEY AT SITE 337, NEAR THE EXTINCT AXIS IN THE NORWAY BASIN
 25. SURVEY AT SITE 337, NEAR THE EXTINCT AXIS IN THE NORWAY BASIN M. Talwani and S. Sandal, Lamont-Doherty Geological Observatory of Columbia University, Palisades, New York In order to explain the asymmetric
Lab 12 Coastal Geology
 Lab 12 Coastal Geology I. Fluvial Systems Hydrologic Cycle Runoff that flows into rivers = precipitation (rain and snowmelt) [infiltration (loss to groundwater) + evaporation (loss to atmosphere) + transpiration
Figure 3.1: Illustration showing the bathymetry s role for the tsunami propagation following the earth quake 26 December 2004 outside of Sumatra.
 Figure 3.1: Illustration showing the bathymetry s role for the tsunami propagation following the earth quake 26 December 2004 outside of Sumatra. The left globe shows the seafloor bathymetry as portrayed
 Page 1 of 9 Name: Base your answer to the question on the diagram below. The arrows show the direction in which sediment is being transported along the shoreline. A barrier beach has formed, creating a
Glacial Geology of Moose Point State Park, ME
 Geologic Site of the Month May, 2013 Glacial Geology of Moose Point State Park, Maine 44 o 25 59.18"N, 68 o 56 37.11"W Text and photos by Woodrow B. Thompson, Department of Agriculture, Conservation &
Evidence for distribution and thickness of Athens Sub-episode and older sediments in Ottawa County, Michigan
 Evidence for distribution and thickness of Athens Sub-episode and older sediments in Ottawa County, Michigan Patrick M. Colgan Department of Geology Grand Valley State University With thanks to Al Kehew
4.11 Groundwater model
 4.11 Groundwater model 4.11 Groundwater model 4.11.1 Introduction and objectives Groundwater models have the potential to make important contributions in the mapping and characterisation of buried valleys.
Monitoring of CO2 Leakage Using High-Resolution 3D Seismic Data Examples from Snøhvit, Vestnesa Ridge and the Western Barents Sea
 Monitoring of CO2 Leakage Using High-Resolution 3D Seismic Data Examples from Snøhvit, Vestnesa Ridge and the Western Barents Sea Bellwald, B. 1, Waage, M. 2, Planke, S. 1,3,4, Lebedeva-Ivanova, N. 1,
Chapter 2. Wearing Down Landforms: Rivers and Ice. Physical Weathering
 Chapter 2 Wearing Down Landforms: Rivers and Ice Physical Weathering Weathering vs. Erosion Weathering is the breakdown of rock and minerals. Erosion is a two fold process that starts with 1) breakdown
Z046 Seismic Characteristics of Gas Migration Structures on the North Atlantic Margin Imaged by High-resolution 3D Seismic
 Z046 Seismic Characteristics of Gas Migration Structures on the North Atlantic Margin Imaged by High-resolution 3D Seismic O.K. Eriksen* (P-Cable 3D Seismic), C. Berndt (IFM-GEOMAR), S. Buenz (University
APPENDIX C GEOLOGICAL CHANCE OF SUCCESS RYDER SCOTT COMPANY PETROLEUM CONSULTANTS
 APPENDIX C GEOLOGICAL CHANCE OF SUCCESS Page 2 The Geological Chance of Success is intended to evaluate the probability that a functioning petroleum system is in place for each prospective reservoir. The
EMODnet data. Flanders Marine Institute. Simon Claus. A. Giorgetti, D. Schaap, A. Novellino, A. Pititto, H.Lilis, V. Henry, T.
 EMODnet data Simon Claus A. Giorgetti, D. Schaap, A. Novellino, A. Pititto, H.Lilis, V. Henry, T. Schmitt Flanders Marine Institute EMODnet data themes Types of Data Vocabularies Data Exchange Format Metadata
A NOVEL APPROACH TO GROUNDWATER MODEL DEVELOPMENT. Thomas D. Krom 1 and Richard Lane 2
 A NOVEL APPROACH TO GROUNDWATER MODEL DEVELOPMENT Thomas D. Krom 1 and Richard Lane 2 1 Touch Water Ltd., P.O. Box 143, Lincoln, Christchurch, New Zealand; email: touchwater@gmail.com 2 Applied Research