Research Interests: variability of sea ice thickness interactions among ocean, seaice and atmosphere climate modelling
|
|
|
- Georgia Hardy
- 5 years ago
- Views:
Transcription
, PhD (Yale University, 1988) Research Interests: variability of sea ice thickness interactions among")
1 Dr. Richard Moritz Department Chair, Polar Science Center M.S. (Yale University, 1979), M.A. (University of Colorado, 1979), PhD (Yale University, 1988) Research Interests: variability of sea ice thickness interactions among ocean, seaice and atmosphere climate modelling
2


3 WEEKLY TO INTERANNUAL VARIATIONS OF SEA-ICE DRAFT DISTRIBUTION AT THE NORTH POLE ENVIRONMENTAL OBSERVATORY Richard Moritz Contributing NPEO PI s: Rebecca Woodgate, Knut Aagaard and Jamie Morison Polar Science Center, Applied Physics Laboratory, University of Washington Applied Physics Lab Polar Science Center ARCTIC FORUM, 13 May, 2004
4 OUTLINE The NPEO Motivation, Background Ice Draft Distribution Moored Sonar Measurements Ice Draft Time Series Estimated Distributions & Statistics Features of the Temporal Variation Comparison with Published Data Preliminary Consideration of Causes Conclusions 5/20/04 Arctic Forum
5 The NPEO Established in 2000 (NSF LTO s) Time Series and Repeat Measurements Key Variables in Central Arctic Emphasis on Tracking Changes UW, OSU, NPS, CRREL, JAMSTEC, PMEL ELEMENTS Spring Surveys (CTD, Ocean Chemistry) Autonomous Drifting Stations (OAI) Bottom-anchored Mooring ( )

6 NPEO MAP:

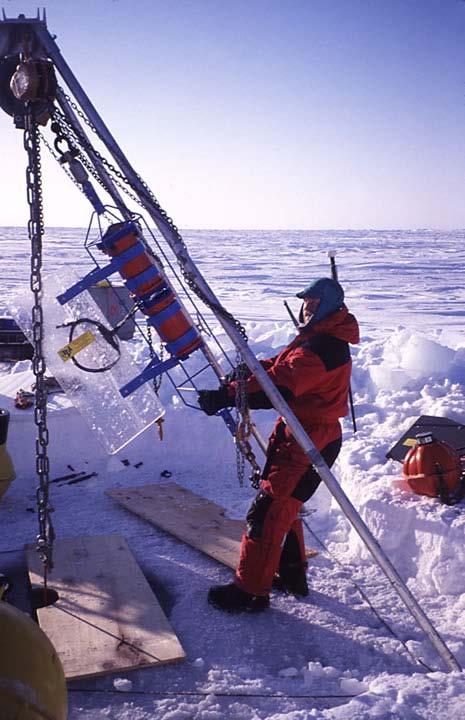
7 NPEO 2004 Mooring

8 NPEO DRIFTING STATION WEB PAGE psc.apl.washington.edu/northpole/index.html


9 NPEO DRIFTING STATION NOAA/PMEL Web Cam TODAY 13 May, 2004 Camera #2 Camera #1
: Ice Draft near NP Decreased ~ 1.")
10 Interdecadal Changes (Rothrock, et al., 1999): Ice Draft near NP Decreased ~ 1.5 m NPEO POSITION 5/20/04 Arctic Forum
11 Regional, Interdecadal Changes (Rothrock,, et al., 1999, Data adjusted seasonally to 15 September using a model) Time Continuity, Trends, & Interannual changes? Causes Radiative Forcing? Advection? Ocean Heating? How influential are the seasonal adjustments? NPEO aims to help address these questions. 5/20/04 Arctic Forum
12 Background Ice Thickness is Fundamental to Arctic Ocean: Ice Mass Budget Heat Budget Freshwater Budget Ice Thickness h(x,t) varies chaotically on small scales: _ ~ 2 m Autocorrelation Length scale ~ 150 m Time scale ~ 5 min Aggregate the data for relevance to climate: Area Statistics Ice Thickness Distribution Atmos/Ocean Forcing & Response Scales ~ km Ice Thickness Distribution temporal variations are not well known on intraseasonal, interseasonal and interannual time scales 5/20/04 Arctic Forum

13 Spatial Variations in Ice Thickness: Multiyear and First Year Ice ICEX-03 Camp MY Thickness 3 10 m FY Thickness 1 2 m Ridges spaced < 100m 5/20/04 Arctic Forum

14 Spatial Variations: Leads and Young Ice Ice Thickness < 15 cm Ice Thickness > 30 cm 5/20/04 Arctic Forum


15 Spatial Variations of the Underside of Sea Ice Blocks in Deformed First Year Ice Some Smooth Multi-Year Ice 5/20/04 Arctic Forum


16 Temporal Variations of Morphology Air View of ice station SHEBA before melting Air View of ice station SHEBA during melting 5/20/04 Arctic Forum
17 Much of this variation can be summarized by the Ice Thickness Distribution Total Area Ao Areas where thickness is on {h, h+dh} Definition (Thorndike, et al., 1976): g(h)dh = [1/Ao] * A(h, h+dh) 5/20/04 Arctic Forum
18 The Ice Draft Distribution Summarizes the Amount (Area) of Ice in Each Draft Interval (Reminder: Thickness is approx 1.2 * Draft, & Draft is what we measure here) 5/20/04 Arctic Forum
19 Statistical Parameters of the I.D.D MODE Count (<5 cm) OWF MEAN ~ Area STDV SLOPE Ice Draft (m) 5/20/04 Arctic Forum

20 NPEO Ocean-Ice Mooring (Water Depth ~ 4200 m) Year 1: 4/10/02-04/21/02, Lat N Lon E Ice Draft Year2: 4/23/02-04/23/03 Lat N Lon E Ice Velocity Drawing: Jim Johnson 5/20/04 Arctic Forum
21 Estimating Sea Ice Draft with a Moored ULS Sea Level (SLP from IABP) Draft Thickness Ice Velocity (ADCP) Depth Range Draft = Depth Range Thickness = 1.2 * Draft ULS (measures range and depth) SSP, DENS from T,S T,S from PHC Anchor 5/20/04 Arctic Forum
22 APL ULS Mark 2 Specifications Frequency: 300 khz Beam Width: 2 half power Nominal Footprint (55 m depth): 2 meter diameter Pulse Length: 1 millisecond Sampling Intervals: Low-Resolution: 5 minutes, continuous High-Resolution: 10 seconds for 25 minutes twice per day Typical Overall Errors: Approx. +/- 2 cm for level ice in summer Larger in Winter than in Summer (O.W. offsets rarer) Larger for deformed ice (Draft computed from first echo) Uncertainties Echoes from off-axis targets Variations in Sound Speed and Density (T & S) 5/20/04 Arctic Forum
23 25 Minute Sample of High-Res. ULS Measurements 1-D Profile of Ice Bottom 5/20/04 Arctic Forum


24 ADCP Ice Velocity Data Complete Annual Record of Ice Speed Daily Ice Motion & Wind Correlated 88% of Speeds > 2 cm/s Ice Lockup is Rare 5/20/04 Arctic Forum
25 Eulerian Time Series: The ULS Samples a Streak Line on the Ice Bottom Surface Ice Velocity ULS t1 t2 Ice Velocity data can benefit the analysis: * How much ice was sampled (length of streak) * Where is the ice that was sampled 5/20/04 Arctic Forum

26 Eulerian Time Series: The ULS Samples a Streak Line on the Ice Bottom Surface Ice Velocity t1 ULS t2 Sample from t1 to t2 Ice Draft Histogram ULS Ice Draft ~ ADCP Ice Speed Compute Stats Pseudo-Spatial Statistics 5/20/04 Arctic Forum
27 Pseudo-Spatial Statistics (e.g. Melling,, et al., 1995, J. Atm. Oc.. Tech.) Probability ~ Distance ~ Speed*Time PS-Weight ~ Distance Comparison of time and p.s. Statistics ULS DATA 9-22 May Low Speed, Anomalous Draft ADCP DATA 5/20/04 Arctic Forum

28 Complete 5-minute spacing Annual Time Series, Year 1 107,467 Obs 5/20/04 Arctic Forum

29 Complete 10-minute spacing Annual Time Series, Year 2 53,791 Obs 5/20/04 Arctic Forum
30 Annual Ice Draft Histograms for NPEO Year 1 and Year 2 Apr 2001 Apr 2002 Apr 2002 Apr 2003 Count MEAN = 3.0 m MODE = 2.0 m OWF = 2% SLOPE = Count MEAN = 3.5 m MODE = 2.2 m OWF = 1% SLOPE = Ice Draft (m) Ice Draft (m) 5/20/04 Arctic Forum
31 Annual Ice Draft PDF for NPEO Year 1 and Year 2 5/20/04 Arctic Forum
32 RESOLVING INTRASEASONAL VARIATIONS Divide the Time Series into Non-overlapping 2-week segments Use the ADCP Data to Weight Time Intervals ~ Speed Estimate Time Series Stats and Pseudo Spatial Series Stats Plot the Annual Variations of 2-Week sample statistics 5/20/04 Arctic Forum
33 6 19 June, /20/04 Arctic Forum
34 6-19 June, 2001 ICE DRAFT (m) 5/20/04 Arctic Forum
35 4 17 July, 2001 Ice Draft (m) 5/20/04 Arctic Forum
36 26 Sept 9 Oct, /20/04 Arctic Forum
37 26 March 8 April, /20/04 Arctic Forum
38 Interseasonal Variations Rothrock NP 1990 s 5/20/04 Arctic Forum
39 Regional, Interdecadal Changes (Rothrock,, et al., 1999, Data adjusted seasonally to 15 September using a model) 2.45 m 5/20/04 Arctic Forum

40 Interseasonal Variations Rothrock NP 1990 s 5/20/04 Arctic Forum
41 Open Water Fraction and Slope SHEBA 1998 Air Photos (Perovich( Perovich,, et al) 5/20/04 Arctic Forum
42 NPEO ULS 12 5/20/04 Arctic Forum
43 NPEO ULS 12 5/20/04 Arctic Forum
44 NPEO ULS 12 5/20/04 Arctic Forum
45 NPEO /20/04 Arctic Forum
46 Framework for Understanding Time Changes H = Mean ice draft dh/dt = G + A + D G = Growth (Melt when negative) A = Advection (Veloc( across H contours) D = Divergence 5/20/04 Arctic Forum

47 Thermodynamic Effects: Variations of Thickness and Temperature at a Lagrangian Point Snow 2.6 m Ice Top 1.5 m Ice Temperature Ice Bottom 20 May 15 Sep Oct 1997 (M.Y. Ice at SHEBA, Perovich,, et al., 1999) Oct /20/04 Arctic Forum

48 Thermodynamics: No Melt Ponds, July, 2002 No melt ponds on web cam in year 2 5/20/04 Arctic Forum

49 Thermodynamics: Melt ponds in July, 2003 No melt ponds on web cam in year 2 5/20/04 Arctic Forum

50 NPEO Mooring Location and 2001 Ice Displacements NPEO 5/20/04 Arctic Forum

51 2002 Ice Displacements 5/20/04 Arctic Forum

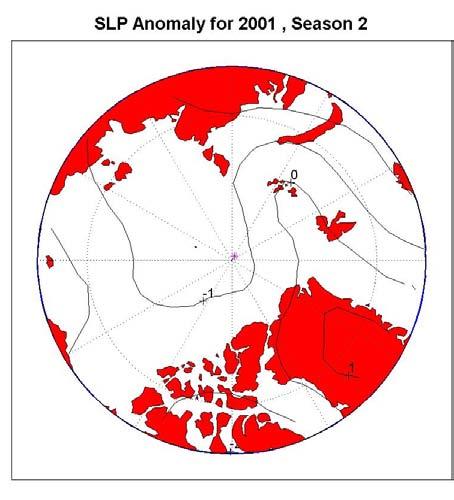

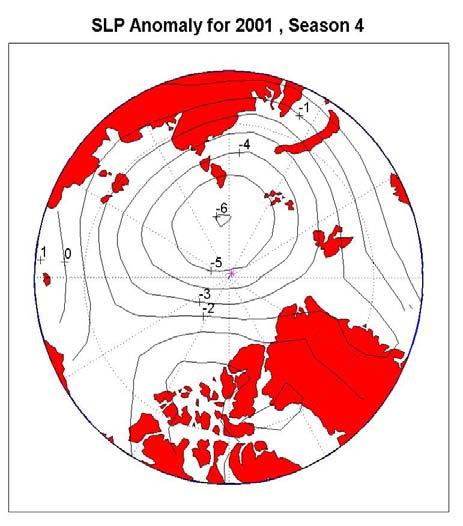
52 SEASONAL SLP ANOMALIES, 2001 H L L L 5/20/04 Arctic Forum


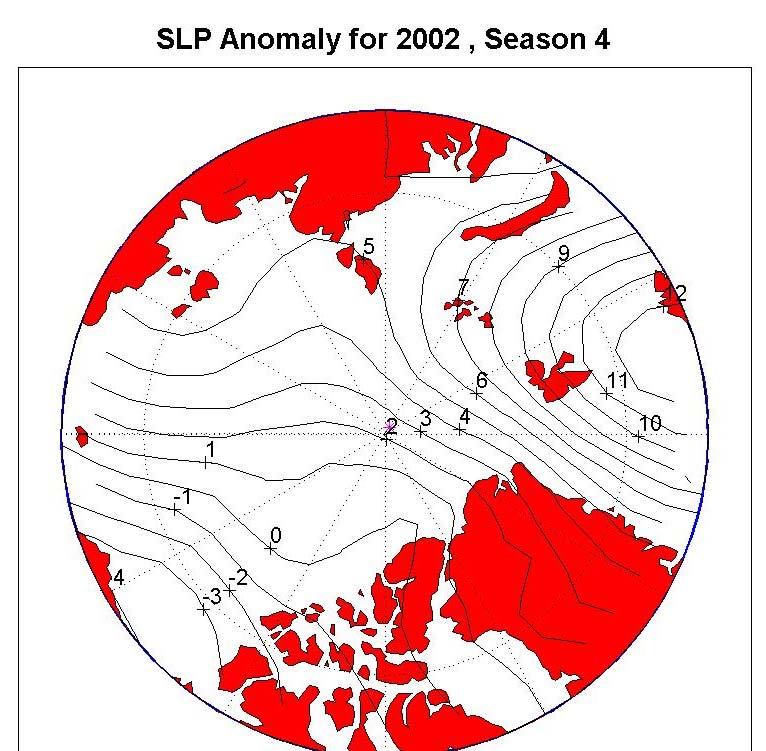
53 SEASONAL SLP ANOMALIES, 2002 L H L 5/20/04 Arctic Forum L
54 MULTI-YEAR ICE CONCENTRATION Overall Low values, Max s s along Greenland-Archipelago 5/20/04 Arctic Forum
55 MULTI-YEAR ICE CONCENTRATION Overall high values, Max s s away coasts 5/20/04 Arctic Forum
56 MULTI-YEAR ICE CONCENTRATION Lower values, Max spread out toward Eurasian Basin 5/20/04 Arctic Forum
57 MULTI-YEAR ICE CONCENTRATION 5/20/04 Arctic Forum
58 MULTI-YEAR ICE CONCENTRATION 5/20/04 Arctic Forum

59 MULTI-YEAR ICE CONCENTRATION Lower values, Max spread out toward Eurasian Basin 5/20/04 Arctic Forum
60 Conclusions Year 1 The ADCP ice velocities are consistent with the IABP Geostrophic Winds and our knowledge of daily ice motion. The ADCP ice velocities are used to estimate pseudo-spatial statistics of Ice Draft. Overall, differences between two-week sample time and pseudo-spatial statistics are small. The two-week samples resolve interseasonal variations of the mean, standard deviation, modes, open water fraction and ridged ice slope. The sample mean draft in Year 1 varied from 3.7 meters in early April to 2.3 meters in late August, with an overall annual mean of 3.0 meters. The sample mean draft estimated for 15 September, 2001 is 2.3 meters, a value near the middle of the Rothrock et al. estimates for NP in the 1990 s. Changes in the modal draft lag behind the sample mean, with extrema of 2.3 meters in late June, 2001 and 1.6 meters in early January, The January minimum is more than 3 months later than one expects from thermodynamic forcing only. The open water fraction reached a maximum of 13 percent in July, and is not inconsistent with air photo estimates from SHEBA during /20/04 Arctic Forum
61 Conclusions (continued) The annual variation of the modal draft during year 1 is not consistent with a purely thermodynamic forcing. The annual variations of mean, mode and owf in year 2 differ qualitatively and quantitatively from those of year 1. The annual mean draft in year 2 is 3.5 Meters, which is 0.5 meters higher than in year 1. The mean draft for 15 September 2002 is 0.90 meters greater than that of 2001, and lies just above the upper limit of submarine-derived values for the 1990 s s in this region. In year 1 the modal draft decreases monotonically by approx. 0.8 m from June to January. In year 2 the mode fluctuatures,, then increases over this interval. Preliminary, qualitative analysis suggests that both thermodynamics and ice advection contributed significantly to the differences between the time series of the two years 5/20/04 Arctic Forum
62 Acknowledgements Jim Johnson, Mooring Technician, PSC-APL/UW Kay Runciman,, Data Reduction and Analysis, PSC-APL/UW NPEO Logistics Team and Divers CF Alert Funded by the U.S. National Science Foundation ARCSS Program 5/20/04 Arctic Forum
63 THE END 5/20/04 Arctic Forum
64
65 ABSTRACT Session JSP04, Arctic Environmental Change Annual variation of sea-ice draft distribution at the North Pole Environmental Observatory R. E. Moritz, R. Woodgate,, K. Aagaard and J. Morison, Polar Science Center, Applied Physics Laboratory, University of Washington. A time series of sea-ice draft D(t) was estimated from measurements made by an Upward Looking Sonar (ULS) from 10 April, 2001 to 21 April, The mooring was located at the North Pole Environmental Observatory (NPEO), Latitude N, Longitude E. Sample statistics and probability density distributions (PDFs)) of D(t) have been estimated by grouping the data in nonoverlapping,, two-week intervals with equal weight given to each observation. The sample mean draft varied from 3.7 meters in early April to 2.3 meters in late August, with an overall annual mean of 3.0 meters. The sample mean draft estimated for 15 September, 2001 is 2.3 meters, a value near the middle of the seasonally adjusted estimates derived from submarine sonar profiles near the North Pole in the 1990's (Rothrock( Rothrock,, et al., GRL, 26, 1999, ). The modal draft of the sample PDF lags behind the sample mean, with extrema of 2.3 meters in late June, 2001 and 1.6 meters in early January, The open water fraction (OWF) is defined by integrating the sample PDFs over ice drafts less than.05 meters. OWF exceeded 1 percent from mid-june to early October, and for a brief period in late December. The maximum OWF of 13 percent occurred in mid-july. The evolution of the ice draft PDF on time scales of a few days to one year is discussed with reference to physical processes and to the problem of estimating trends in the climatology of D. 5/20/04 Arctic Forum
66 April, 2001 May, 2001 June, /20/04 Arctic Forum
67 5/20/04 Arctic Forum
68 Objectives Estimate Ice Draft from Measurements Estimate Ice Thickness Distribution Present Annual Variations in Ice Thickness Distribution Compare with Published Estimates Explain differences between the two years Derive Implications for Lg Scale Ice Physics & Climate Variability Overall Goals Quantify and Understand Temporal Variability of I.T.D. Interseasonal Interannual Climate 5/20/04 Arctic Forum
69 Statistics of Complete Annual Time Series Basic Sample Statistics Exponential Tail Deformed Ice 5/20/04 Arctic Forum
70 Variables Shown on Histograms N Number of Observations MEAN - Sample Mean MODE - Sample Mode STDV - Sample Standard Dev. OWF - Sample Open Water Fraction Slope Exponent for 4-10m ice Subscript t Simple time series statistics p Pseudo-Spatial statistics 5/20/04 Arctic Forum
71
Buoy deployment by the ice breaker USCG Healy
 Enhancements of the Arctic Buoys for the International Polar Year Buoy deployment by the ice breaker USCG Healy Buoys-on-Ice 2007 a success: Deployment flights 26 and 29 March o Flying hours funded by
IABP Deployment Plans for 2004
 IABP Buoy Positions IABP Deployment Plans for 2004 SPRING NPEO (Multiple buoys provided by NOAA/PMEL, JAMSTEC, & CRREL) EC/NIC- CES (80N 120W, & 80N 130W) SUMMER IARC/NABOS Cruise 2 NOAA-PSC IMB (North
Spectral Albedos. a: dry snow. b: wet new snow. c: melting old snow. a: cold MY ice. b: melting MY ice. d: frozen pond. c: melting FY white ice
 Spectral Albedos a: dry snow b: wet new snow a: cold MY ice c: melting old snow b: melting MY ice d: frozen pond c: melting FY white ice d: melting FY blue ice e: early MY pond e: ageing ponds Extinction
The Arctic Sea Ice Cover
 The Arctic Sea Ice Cover From the Living Earth Interface, Impediment, Integrator Frozen ocean 8-15 million km 2 Size of U.S. Meters thick Floating, moving ice Highly variable Large albedo Climate change!
CAM Tutorial. Sea Ice Modeling 31 July 2009 David Bailey and Marika Holland, NCAR
 CAM Tutorial Sea Ice Modeling 31 July 2009 David Bailey and Marika Holland, NCAR Sea ice influences in the climate system Surface albedo in March > 0.8 < 0.1 Ice-Ocean Freshwater Exchange Contrasting the
Sea Ice Motion: Physics and Observations Ron Kwok Jet Propulsion Laboratory California Institute of Technology, Pasadena, CA
 Sea Ice Motion: Physics and Observations Ron Kwok Jet Propulsion Laboratory California Institute of Technology, Pasadena, CA 7 th ESA Earth Observation Summer School ESRIN, Frascati, Italy 4-14 August
Sea Ice Observations: Where Would We Be Without the Arctic Observing Network? Jackie Richter-Menge ERDC-CRREL
 Sea Ice Observations: Where Would We Be Without the Arctic Observing Network? Jackie Richter-Menge ERDC-CRREL Sea Ice Observations: Where Would We Be Without the Arctic Observing Network? Jackie Richter-Menge
Arctic Ocean-Sea Ice-Climate Interactions
 Arctic Ocean-Sea Ice-Climate Interactions Sea Ice Ice extent waxes and wanes with the seasons. Ice extent is at a maximum in March (typically 14 million square km, about twice the area of the contiguous
The Seasonal Evolution of Sea Ice Floe Size Distribution
 DISTRIBUTION STATEMENT A. Approved for public release; distribution is unlimited. The Seasonal Evolution of Sea Ice Floe Size Distribution Jacqueline A. Richter-Menge and Donald K. Perovich CRREL 72 Lyme
The Arctic Crossroads
 The Arctic Crossroads The Influence of the Mendeleev Ridge and the Chukchi Borderland on the Large-scale Circulation of the Arctic Ocean Rebecca Woodgate and Knut Aagaard, University of Washington Jim
Radiative Climatology of the North Slope of Alaska and the Adjacent Arctic Ocean
 Radiative Climatology of the North Slope of Alaska and the Adjacent Arctic Ocean C. Marty, R. Storvold, and X. Xiong Geophysical Institute University of Alaska Fairbanks, Alaska K. H. Stamnes Stevens Institute
Ed Ross 1, David Fissel 1, Humfrey Melling 2. ASL Environmental Sciences Inc. Victoria, British Columbia V8M 1Z5
 Spatial Variability of Sea Ice Drafts in the Continental Margin of the Canadian Beaufort Sea from a Dense Array of Moored Upward Looking Sonar Instruments Ed Ross 1, David Fissel 1, Humfrey Melling 2 1
In-situ and airborne sea ice observations for better sea ice prediction and climate analysis. Christian Haas
 In-situ and airborne sea ice observations for better sea ice prediction and climate analysis Christian Haas Data assimilation improves sea ice forecasts Most important parameters are: Concentration (SIC),
Ice and Ocean Mooring Data Statistics from Barrow Strait, the Central Section of the NW Passage in the Canadian Arctic Archipelago
 Ice and Ocean Mooring Data Statistics from Barrow Strait, the Central Section of the NW Passage in the Canadian Arctic Archipelago Simon Prinsenberg and Roger Pettipas Bedford Institute of Oceanography,
Arctic sea ice in IPCC climate scenarios in view of the 2007 record low sea ice event A comment by Ralf Döscher, Michael Karcher and Frank Kauker
 Arctic sea ice in IPCC climate scenarios in view of the 2007 record low sea ice event A comment by Ralf Döscher, Michael Karcher and Frank Kauker Fig. 1: Arctic September sea ice extent in observations
The Arctic Energy Budget
 The Arctic Energy Budget The global heat engine [courtesy Kevin Trenberth, NCAR]. Differential solar heating between low and high latitudes gives rise to a circulation of the atmosphere and ocean that
The U. S. Winter Outlook
 The 2018-2019 U. S. Winter Outlook Michael Halpert Deputy Director Climate Prediction Center Mike.Halpert@noaa.gov http://www.cpc.ncep.noaa.gov Outline About the Seasonal Outlook Review of 2017-18 U. S.
Outline: 1) Extremes were triggered by anomalous synoptic patterns 2) Cloud-Radiation-PWV positive feedback on 2007 low SIE
 Extremes were triggered by anomalous synoptic patterns 2) Cloud-Radiation-PWV positive feedback on 2007 low SIE") Identifying Dynamical Forcing and Cloud-Radiative Feedbacks Critical to the Formation of Extreme Arctic Sea-Ice Extent in the Summers of 2007 and 1996 Xiquan Dong University of North Dakota Outline: 1)
Identifying Dynamical Forcing and Cloud-Radiative Feedbacks Critical to the Formation of Extreme Arctic Sea-Ice Extent in the Summers of 2007 and 1996 Xiquan Dong University of North Dakota Outline: 1)
Experimental and Theoretical Studies of Ice-Albedo Feedback Processes in the Arctic Basin
 LONG TERM GOALS Experimental and Theoretical Studies of Ice-Albedo Feedback Processes in the Arctic Basin D.K. Perovich J.A. Richter-Menge W.B. Tucker III M. Sturm U. S. Army Cold Regions Research and
The Seasonal Evolution of Sea Ice Floe Size Distribution
 DISTRIBUTION STATEMENT A. Approved for public release; distribution is unlimited. The Seasonal Evolution of Sea Ice Floe Size Distribution Jacqueline A. Richter-Menge and Donald K. Perovich CRREL, 72 Lyme
Evaluating the Discrete Element Method as a Tool for Predicting the Seasonal Evolution of the MIZ
 DISTRIBUTION STATEMENT A. Approved for public release; distribution is unlimited. Evaluating the Discrete Element Method as a Tool for Predicting the Seasonal Evolution of the MIZ Arnold J. Song Cold Regions
Using Remote-sensed Sea Ice Thickness, Extent and Speed Observations to Optimise a Sea Ice Model
 Using Remote-sensed Sea Ice Thickness, Extent and Speed Observations to Optimise a Sea Ice Model Paul Miller, Seymour Laxon, Daniel Feltham, Douglas Cresswell Centre for Polar Observation and Modelling
A summary of the weather year based on data from the Zumwalt weather station
 ZUMWALT PRAIRIE WEATHER 2016 A summary of the weather year based on data from the Zumwalt weather station Figure 1. An unusual summer storm on July 10, 2016 brought the second-largest precipitation day
The U. S. Winter Outlook
 The 2017-2018 U. S. Winter Outlook Michael Halpert Deputy Director Climate Prediction Center Mike.Halpert@noaa.gov http://www.cpc.ncep.noaa.gov Outline About the Seasonal Outlook Review of 2016-17 U. S.
Origins of the SHEBA freshwater anomaly in the Mackenzie River delta
 GEOPHYSICAL RESEARCH LETTERS, VOL. 33, L09601, doi:10.1029/2005gl024813, 2006 Origins of the SHEBA freshwater anomaly in the Mackenzie River delta M. Steele, 1 A. Porcelli, 1 and J. Zhang 1 Received 29
High-Resolution MPAS Simulations for Analysis of Climate Change Effects on Weather Extremes
 High-Resolution MPAS Simulations for Analysis of Climate Change Effects on Weather Extremes ALLISON MICHAELIS, GARY LACKMANN, & WALT ROBINSON Department of Marine, Earth, and Atmospheric Sciences, North
Observing Arctic Sea Ice Change. Christian Haas
 Observing Arctic Sea Ice Change Christian Haas Decreasing Arctic sea ice extent in September Ice extent is decreasing, but regional patterns are very different every year The Cryosphere Today, http://arctic.atmos.uiuc.edu;
Recent Improvements in the U.S. Navy s Ice Modeling Efforts Using CryoSat-2 Ice Thickness for Model Initialization
 Recent Improvements in the U.S. Navy s Ice Modeling Efforts Using CryoSat-2 Ice Thickness for Model Initialization Richard Allard 1, David Hebert 1, Pamela Posey 1, Alan Wallcraft 1, Li Li 2, William Johnston
Sea Ice Modeling for Climate Applications. Marika M Holland (NCAR) David Bailey (NCAR), Cecilia Bitz (U. Washington), Elizabeth Hunke (LANL)
 David Bailey (NCAR), Cecilia Bitz (U. Washington), Elizabeth Hunke (LANL)") Sea Ice Modeling for Climate Applications Marika M Holland (NCAR) David Bailey (NCAR), Cecilia Bitz (U. Washington), Elizabeth Hunke (LANL) Surface albedo > 0.8 < 0.1 Why do we care about sea ice? Surface
Sea Ice Modeling for Climate Applications Marika M Holland (NCAR) David Bailey (NCAR), Cecilia Bitz (U. Washington), Elizabeth Hunke (LANL) Surface albedo > 0.8 < 0.1 Why do we care about sea ice? Surface
Interannual Variations of Arctic Cloud Types:
 Interannual Variations of Arctic Cloud Types: Relationships with Sea Ice and Surface Temperature Ryan Eastman Stephen Warren University of Washington Department of Atmospheric Sciences Changes in Arctic
Changing predictability characteristics of Arctic sea ice in a warming climate
 Changing predictability characteristics of Arctic sea ice in a warming climate Marika Holland 1 Laura Landrum 1, John Mioduszewski 2, Steve Vavrus 2, Muyin Wang 3 1. NCAR, 2. U. Wisconsin-Madison, 3. NOAA
Rick Krishfield and John Toole Ice-Tethered Platform Workshop June 29, 2004 Woods Hole Oceanographic Institution
 Ice-tethered Instruments: History and Future Development Rick Krishfield and John Toole Ice-Tethered Platform Workshop June 29, 2004 Woods Hole Oceanographic Institution Since the 1980s, Arctic drifting
MOSAiC Science Implementation The Multidisciplinary drifting Observatory for the Study of Arctic Climate
 MOSAiC Science Implementation The Multidisciplinary drifting Observatory for the Study of Arctic Climate MOSAiC Coordination Team M. Shupe. 13 March 2016 MOSAiC Plan Drifting, interdisciplinary process
Physical Oceanography of the Northeastern Chukchi Sea: A Preliminary Synthesis
 Physical Oceanography of the Northeastern Chukchi Sea: A Preliminary Synthesis I. Hanna Shoal Meltback Variability (causes?) II. Hydrography: Interannual Variability III. Aspects of Hanna Shoal Hydrographic
ALASKA REGION CLIMATE OUTLOOK BRIEFING. November 16, 2018 Rick Thoman Alaska Center for Climate Assessment and Policy
 ALASKA REGION CLIMATE OUTLOOK BRIEFING November 16, 2018 Rick Thoman Alaska Center for Climate Assessment and Policy Today s Outline Feature of the month: Southeast Drought Update Climate Forecast Basics
The importance of long-term Arctic weather station data for setting the research stage for climate change studies
 The importance of long-term Arctic weather station data for setting the research stage for climate change studies Taneil Uttal NOAA/Earth Systems Research Laboratory Boulder, Colorado Things to get out
Extreme, transient Moisture Transport in the high-latitude North Atlantic sector and Impacts on Sea-ice concentration:
 AR conference, June 26, 2018 Extreme, transient Moisture Transport in the high-latitude North Atlantic sector and Impacts on Sea-ice concentration: associated Dynamics, including Weather Regimes & RWB
Sea ice thickness. Ed Blanchard-Wrigglesworth University of Washington
 Sea ice thickness Ed Blanchard-Wrigglesworth University of Washington Sea ice thickness Ed Blanchard-Wrigglesworth University of Washington Part II: variability Sea ice thickness Ed Blanchard-Wrigglesworth
Ocean & Sea Ice SAF. Validation of ice products January March Version 1.1. May 2005
 Ocean & Sea Ice SAF Validation of ice products January 2002 - March 2005 Version 1.1 May 2005 Morten Lind, Keld Q. Hansen, Søren Andersen 1 INTRODUCTION... 3 2 PRODUCTS VALIDATION METHODS... 3 3 GENERAL
Arctic Climate Change. Glen Lesins Department of Physics and Atmospheric Science Dalhousie University Create Summer School, Alliston, July 2013
 Arctic Climate Change Glen Lesins Department of Physics and Atmospheric Science Dalhousie University Create Summer School, Alliston, July 2013 When was this published? Observational Evidence for Arctic
GPC Exeter forecast for winter Crown copyright Met Office
 GPC Exeter forecast for winter 2015-2016 Global Seasonal Forecast System version 5 (GloSea5) ensemble prediction system the source for Met Office monthly and seasonal forecasts uses a coupled model (atmosphere
MODELLING THE EVOLUTION OF DRAFT DISTRIBUTION IN THE SEA ICE PACK OF THE BEAUFORT SEA
 Ice in the Environment: Proceedings of the 6th IAHR International Symposium on Ice Dunedin, New Zealand, nd 6th December International Association of Hydraulic Engineering and Research MODELLING THE EVOLUTION
On Modeling the Oceanic Heat Fluxes from the North Pacific / Atlantic into the Arctic Ocean
 On Modeling the Oceanic Heat Fluxes from the North Pacific / Atlantic into the Arctic Ocean Wieslaw Maslowski Naval Postgraduate School Collaborators: Jaclyn Clement Kinney Terry McNamara, John Whelan
Determining the Impact of Sea Ice Thickness on the
 US NAVAL RESEARCH LABORATORY FIVE YEAR RESEARCH OPTION Determining the Impact of Sea Ice Thickness on the Arctic s Naturally Changing Environment (DISTANCE) Co-PI s for NRL John Brozena, Joan Gardner (Marine
Nonlinear atmospheric response to Arctic sea-ice loss under different sea ice scenarios
 Nonlinear atmospheric response to Arctic sea-ice loss under different sea ice scenarios Hans Chen, Fuqing Zhang and Richard Alley Advanced Data Assimilation and Predictability Techniques The Pennsylvania
Overview of Achievements October 2001 October 2003 Adrian Raftery, P.I. MURI Overview Presentation, 17 October 2003 c 2003 Adrian E.
 MURI Project: Integration and Visualization of Multisource Information for Mesoscale Meteorology: Statistical and Cognitive Approaches to Visualizing Uncertainty, 2001 2006 Overview of Achievements October
Interannual variability of top-ofatmosphere. CERES instruments
 Interannual variability of top-ofatmosphere albedo observed by CERES instruments Seiji Kato NASA Langley Research Center Hampton, VA SORCE Science team meeting, Sedona, Arizona, Sep. 13-16, 2011 TOA irradiance
We greatly appreciate the thoughtful comments from the reviewers. According to the reviewer s comments, we revised the original manuscript.
 Response to the reviews of TC-2018-108 The potential of sea ice leads as a predictor for seasonal Arctic sea ice extent prediction by Yuanyuan Zhang, Xiao Cheng, Jiping Liu, and Fengming Hui We greatly
Arctic sea ice thickness, volume, and multiyear ice coverage: losses and coupled variability ( )
") Environmental Research Letters LETTER OPEN ACCESS Arctic sea ice thickness, volume, and multiyear ice coverage: losses and coupled variability (1958 2018) To cite this article: R Kwok 2018 Environ. Res.
Environmental Research Letters LETTER OPEN ACCESS Arctic sea ice thickness, volume, and multiyear ice coverage: losses and coupled variability (1958 2018) To cite this article: R Kwok 2018 Environ. Res.
KESS and Its Legacies
 KESS and Its Legacies Report to US CLIVAR 18 July 2012 Meghan Cronin (NOAA PMEL) KESS objec ves & field program Best Prac ces h p://uskess.org A few highlights from KESS research Ac vi es since KESS 1
Sea-ice change around Alaska & Impacts on Human Activities
 Sea-ice change around Alaska & Impacts on Human Activities Hajo Eicken Geophysical Institute University of Alaska Fairbanks, hajo.eicken@gi.alaska.edu Introduction The Arctic sea-ice cover: Observations
International Arctic Buoy Programme Report
 International Arctic Buoy Programme Report Data Buoy Cooperation Panel 29 Paris, France September 25, 2013 Introduction Some Highlights Increased Russian Collaboration Arctic Observing Experiment Summary
Supplemental Information for. Thompson, L.G., et al. Ice Core Records of Climate Variability on the Third Pole
 1 1 2 3 4 5 6 7 8 Supplemental Information for Thompson, L.G., et al. Ice Core Records of Climate Variability on the Third Pole with Emphasis on the Guliya ice cap, western Kunlun Mountains 9 10 11 12
Mass Balance of Multiyear Sea Ice in the Southern Beaufort Sea
 DISTRIBUTION STATEMENT A. Approved for public release; distribution is unlimited. Mass Balance of Multiyear Sea Ice in the Southern Beaufort Sea PI Andrew R. Mahoney Geophysical Institute University of
ENSO Cycle: Recent Evolution, Current Status and Predictions. Update prepared by Climate Prediction Center / NCEP 23 April 2012
 ENSO Cycle: Recent Evolution, Current Status and Predictions Update prepared by Climate Prediction Center / NCEP 23 April 2012 Outline Overview Recent Evolution and Current Conditions Oceanic Niño Index
Figure 1: Two schematic views of the global overturning circulation. The Southern Ocean plays two key roles in the global overturning: (1) the
 the") Figure 1: Two schematic views of the global overturning circulation. The Southern Ocean plays two key roles in the global overturning: (1) the Antarctic Circumpolar Current connects the ocean basins, establishing
Figure 1: Two schematic views of the global overturning circulation. The Southern Ocean plays two key roles in the global overturning: (1) the Antarctic Circumpolar Current connects the ocean basins, establishing
Dynamical Statistical Seasonal Prediction of Atlantic Hurricane Activity at NCEP
 Dynamical Statistical Seasonal Prediction of Atlantic Hurricane Activity at NCEP Hui Wang, Arun Kumar, Jae Kyung E. Schemm, and Lindsey Long NOAA/NWS/NCEP/Climate Prediction Center Fifth Session of North
ENSO Cycle: Recent Evolution, Current Status and Predictions. Update prepared by Climate Prediction Center / NCEP 24 September 2012
 ENSO Cycle: Recent Evolution, Current Status and Predictions Update prepared by Climate Prediction Center / NCEP 24 September 2012 Outline Overview Recent Evolution and Current Conditions Oceanic Niño
on climate and its links with Arctic sea ice cover
 The influence of autumnal Eurasian snow cover on climate and its links with Arctic sea ice cover Guillaume Gastineau* 1, Javier García- Serrano 2 and Claude Frankignoul 1 1 Sorbonne Universités, UPMC/CNRS/IRD/MNHN,
SAMS Gliders: Research Activities
 SAMS Gliders: Research Activities Mark Inall, Toby Sherwin, Stuart Cunningham Estelle Dumont, Marie Porter, Dmitry Aleynik Scottish Association for Marine Science Scottish Marine Institute Oban PA37 1QA
Agricultural Science Climatology Semester 2, Anne Green / Richard Thompson
 Agricultural Science Climatology Semester 2, 2006 Anne Green / Richard Thompson http://www.physics.usyd.edu.au/ag/agschome.htm Course Coordinator: Mike Wheatland Course Goals Evaluate & interpret information,
Linkages between Arctic sea ice loss and midlatitude
 Linkages between Arctic sea ice loss and midlatitude weather patterns Response of the wintertime atmospheric circulation to current and projected Arctic sea ice decline Gudrun Magnusdottir and Yannick
APPENDIX B PHYSICAL BASELINE STUDY: NORTHEAST BAFFIN BAY 1
 APPENDIX B PHYSICAL BASELINE STUDY: NORTHEAST BAFFIN BAY 1 1 By David B. Fissel, Mar Martínez de Saavedra Álvarez, and Randy C. Kerr, ASL Environmental Sciences Inc. (Feb. 2012) West Greenland Seismic
Deke Arndt, Chief, Climate Monitoring Branch, NOAA s National Climatic Data Center
 Thomas R. Karl, L.H.D., Director, NOAA s National Climatic Data Center, and Chair of the Subcommittee on Global Change Research Peter Thorne, PhD, Senior Scientist, Cooperative Institute for Climate and
Trends in Climate Teleconnections and Effects on the Midwest
 Trends in Climate Teleconnections and Effects on the Midwest Don Wuebbles Zachary Zobel Department of Atmospheric Sciences University of Illinois, Urbana November 11, 2015 Date Name of Meeting 1 Arctic
Brita Horlings
 Knut Christianson Brita Horlings brita2@uw.edu https://courses.washington.edu/ess431/ Natural Occurrences of Ice: Distribution and environmental factors of seasonal snow, sea ice, glaciers and permafrost
ASSESMENT OF THE SEVERE WEATHER ENVIROMENT IN NORTH AMERICA SIMULATED BY A GLOBAL CLIMATE MODEL
 JP2.9 ASSESMENT OF THE SEVERE WEATHER ENVIROMENT IN NORTH AMERICA SIMULATED BY A GLOBAL CLIMATE MODEL Patrick T. Marsh* and David J. Karoly School of Meteorology, University of Oklahoma, Norman OK and
M. Mielke et al. C5816
 Atmos. Chem. Phys. Discuss., 14, C5816 C5827, 2014 www.atmos-chem-phys-discuss.net/14/c5816/2014/ Author(s) 2014. This work is distributed under the Creative Commons Attribute 3.0 License. Atmospheric
Why Has the Land Memory Changed?
 3236 JOURNAL OF CLIMATE VOLUME 17 Why Has the Land Memory Changed? QI HU ANDSONG FENG Climate and Bio-Atmospheric Sciences Group, School of Natural Resource Sciences, University of Nebraska at Lincoln,
ENSO Cycle: Recent Evolution, Current Status and Predictions. Update prepared by Climate Prediction Center / NCEP 11 November 2013
 ENSO Cycle: Recent Evolution, Current Status and Predictions Update prepared by Climate Prediction Center / NCEP 11 November 2013 Outline Overview Recent Evolution and Current Conditions Oceanic Niño Index
Experimental and Theoretical Studies of Ice-Albedo Feedback Processes in the Arctic Basin
 LONG TERM GOALS Experimental and Theoretical Studies of Ice-Albedo Feedback Processes in the Arctic Basin D.K. Perovich J.A. Richter-Menge W.B. Tucker III M. Sturm U. S. Army Cold Regions Research and
The Thinning of Arctic Sea Ice, : Have We Passed a Tipping Point?
 The Thinning of Arctic Sea Ice, 1988-2003: Have We Passed a Tipping Point? R. W. Lindsay and J. Zhang Polar Science Center, University of Washington, Seattle, WA Submitted to Journal of Climate, 12 November
ENSO: Recent Evolution, Current Status and Predictions. Update prepared by: Climate Prediction Center / NCEP 30 October 2017
 ENSO: Recent Evolution, Current Status and Predictions Update prepared by: Climate Prediction Center / NCEP 30 October 2017 Outline Summary Recent Evolution and Current Conditions Oceanic Niño Index (ONI)
North Pacific Climate Overview N. Bond (UW/JISAO), J. Overland (NOAA/PMEL) Contact: Last updated: September 2008
, J. Overland (NOAA/PMEL) Contact: Last updated: September 2008") North Pacific Climate Overview N. Bond (UW/JISAO), J. Overland (NOAA/PMEL) Contact: Nicholas.Bond@noaa.gov Last updated: September 2008 Summary. The North Pacific atmosphere-ocean system from fall 2007
North Pacific Climate Overview N. Bond (UW/JISAO), J. Overland (NOAA/PMEL) Contact: Nicholas.Bond@noaa.gov Last updated: September 2008 Summary. The North Pacific atmosphere-ocean system from fall 2007
ENSO Cycle: Recent Evolution, Current Status and Predictions. Update prepared by Climate Prediction Center / NCEP 5 August 2013
 ENSO Cycle: Recent Evolution, Current Status and Predictions Update prepared by Climate Prediction Center / NCEP 5 August 2013 Outline Overview Recent Evolution and Current Conditions Oceanic Niño Index
Challenges of Collecting Data for Article 76 in Ice Covered Waters of the Arctic
 Challenges of Collecting Data for Article 76 in Ice Covered Waters of the Arctic 5 th ABLOS Conference Monaco October 16, 2008 Richard MacDougall - Canada Jacob Verhoef - Canada Wendell Sanford - Canada
PHYSICAL PROPERTIES TAHOE.UCDAVIS.EDU 8
 PHYSICAL PROPERTIES 8 Lake surface level Daily since 1900 Lake surface level varies throughout the year. Lake level rises due to high stream inflow, groundwater inflow, and precipitation directly onto
A. Windnagel M. Savoie NSIDC
 National Snow and Ice Data Center ADVANCING KNOWLEDGE OF EARTH'S FROZEN REGIONS Special Report #18 06 July 2016 A. Windnagel M. Savoie NSIDC W. Meier NASA GSFC i 2 Contents List of Figures... 4 List of
Effects of Arctic sea ice loss on Northern Hemisphere blocking highs
 Effects of Arctic sea ice loss on Northern Hemisphere blocking highs B. Ayarzagüena 1, J. Screen 1, E. Barnes 2 1 University of Exeter, UK 2 Colorado State University, USA Motivation Arctic amplification
The Climate of Marshall County
 The Climate of Marshall County Marshall County is part of the Crosstimbers. This region is a transition region from the Central Great Plains to the more irregular terrain of southeastern Oklahoma. Average
Climate Variability. Eric Salathé. Climate Impacts Group & Department of Atmospheric Sciences University of Washington. Thanks to Nathan Mantua
 Climate Variability Eric Salathé Climate Impacts Group & Department of Atmospheric Sciences University of Washington Thanks to Nathan Mantua Northwest Climate: the mean Factors that influence local/regional
Thinning of Arctic sea ice observed in Fram Strait:
 JOURNAL OF GEOPHYSICAL RESEARCH: OCEANS, VOL. 118, 5202 5221, doi:10.1002/jgrc.20393, 2013 Thinning of Arctic sea ice observed in Fram Strait: 1990 2011 E. Hansen, 1 S. Gerland, 1 M. A. Granskog, 1 O.
Observing the ice-covered oceans around Antarctica by profiling floats
 Observing the ice-covered oceans around Antarctica by profiling floats Annie Wong, Stephen Riser School of Oceanography University of Washington, USA Aug 1 2007 Since 2007, UW has deployed 83 profiling
PH YSIC A L PROPERT IE S TERC.UCDAVIS.EDU
 PH YSIC A L PROPERT IE S 8 Lake surface level Daily since 1900 Lake surface level varies throughout the year. Lake level rises due to high stream inflow, groundwater inflow and precipitation directly onto
NSIDC Sea Ice Outlook Contribution, 31 May 2012
 Summary NSIDC Sea Ice Outlook Contribution, 31 May 2012 Julienne Stroeve, Walt Meier, Mark Serreze, Ted Scambos, Mark Tschudi NSIDC is using the same approach as the last 2 years: survival of ice of different
Regional Outlook for the Bering-Chukchi-Beaufort Seas Contribution to the 2018 Sea Ice Outlook
 Regional Outlook for the Bering-Chukchi-Beaufort Seas Contribution to the 2018 Sea Ice Outlook 25 July 2018 Matthew Druckenmiller (National Snow and Ice Data Center, Univ. Colorado Boulder) & Hajo Eicken
Observations of Arctic snow and sea ice thickness from satellite and airborne surveys. Nathan Kurtz NASA Goddard Space Flight Center
 Observations of Arctic snow and sea ice thickness from satellite and airborne surveys Nathan Kurtz NASA Goddard Space Flight Center Decline in Arctic sea ice thickness and volume Kwok et al. (2009) Submarine
Antarctic Sea Ice: Mean state and variability in CCSM control run. Laura Landrum, Marika Holland, Dave Schneider, Elizabeth Hunke
 Antarctic Sea Ice: Mean state and variability in CCSM4 1850 control run Laura Landrum, Marika Holland, Dave Schneider, Elizabeth Hunke Overview Model years and variables Mean state and some comparisons
PRMS WHITE PAPER 2014 NORTH ATLANTIC HURRICANE SEASON OUTLOOK. June RMS Event Response
 PRMS WHITE PAPER 2014 NORTH ATLANTIC HURRICANE SEASON OUTLOOK June 2014 - RMS Event Response 2014 SEASON OUTLOOK The 2013 North Atlantic hurricane season saw the fewest hurricanes in the Atlantic Basin
Graphing Sea Ice Extent in the Arctic and Antarctic
 Graphing Sea Ice Extent in the Arctic and Antarctic 1. Large amounts of ice form in some seasons in the oceans near the North Pole and the South Pole (the Arctic Ocean and the Southern Ocean). This ice,
ENSO: Recent Evolution, Current Status and Predictions. Update prepared by: Climate Prediction Center / NCEP 9 November 2015
 ENSO: Recent Evolution, Current Status and Predictions Update prepared by: Climate Prediction Center / NCEP 9 November 2015 Outline Summary Recent Evolution and Current Conditions Oceanic Niño Index (ONI)
(1) Arctic Sea Ice Predictability,
 Arctic Sea Ice Predictability,") (1) Arctic Sea Ice Predictability, (2) It s Long-term Loss and Implications for Ocean Conditions Marika Holland, NCAR With contributions from: David Bailey, Alex Jahn, Jennifer Kay, Laura Landrum, Steve
(1) Arctic Sea Ice Predictability, (2) It s Long-term Loss and Implications for Ocean Conditions Marika Holland, NCAR With contributions from: David Bailey, Alex Jahn, Jennifer Kay, Laura Landrum, Steve
Eurasian Snow Cover Variability and Links with Stratosphere-Troposphere Coupling and Their Potential Use in Seasonal to Decadal Climate Predictions
 US National Oceanic and Atmospheric Administration Climate Test Bed Joint Seminar Series NCEP, Camp Springs, Maryland, 22 June 2011 Eurasian Snow Cover Variability and Links with Stratosphere-Troposphere
Observed Climate Variability and Change: Evidence and Issues Related to Uncertainty
 Observed Climate Variability and Change: Evidence and Issues Related to Uncertainty David R. Easterling National Climatic Data Center Asheville, North Carolina Overview Some examples of observed climate
The Climate of Payne County
 The Climate of Payne County Payne County is part of the Central Great Plains in the west, encompassing some of the best agricultural land in Oklahoma. Payne County is also part of the Crosstimbers in the
The Atmospheric Circulation
 The Atmospheric Circulation Vertical structure of the Atmosphere http://www.uwsp.edu/geo/faculty/ritter/geog101/textbook/atmosphere/atmospheric_structure.html The global heat engine [courtesy Kevin Trenberth,
Global climate predictions: forecast drift and bias adjustment issues
 www.bsc.es Ispra, 23 May 2017 Global climate predictions: forecast drift and bias adjustment issues Francisco J. Doblas-Reyes BSC Earth Sciences Department and ICREA Many of the ideas in this presentation
Introduction to Climate ~ Part I ~
 2015/11/16 TCC Seminar JMA Introduction to Climate ~ Part I ~ Shuhei MAEDA (MRI/JMA) Climate Research Department Meteorological Research Institute (MRI/JMA) 1 Outline of the lecture 1. Climate System (
2013 ATLANTIC HURRICANE SEASON OUTLOOK. June RMS Cat Response
 2013 ATLANTIC HURRICANE SEASON OUTLOOK June 2013 - RMS Cat Response Season Outlook At the start of the 2013 Atlantic hurricane season, which officially runs from June 1 to November 30, seasonal forecasts
The Climate of Seminole County
 The Climate of Seminole County Seminole County is part of the Crosstimbers. This region is a transition region from the Central Great Plains to the more irregular terrain of southeastern Oklahoma. Average