Sediment Sources, Baseline Sediment- Transport Rates and the Effectiveness of Restoration Measures for Reducing Loads to Receiving Waters
|
|
|
- Lesley Washington
- 5 years ago
- Views:
Transcription
1 Sediment Sources, Baseline Sediment- Transport Rates and the Effectiveness of Restoration Measures for Reducing Loads to Receiving Waters Andrew Simon Cardno, Oxford, MS, USA

2 Not to Blame for the Content of This Presentation Prof. Andrew Simons Dept of Fisheries, Wildlife and Conservation Biology Bell Museum of Natural History, St Paul, MN
3 Sediment Delivery to Receiving Waters: Issues Degradation of water quality and habitat Loss of reservoir capacity with associated issues of water supply and hydropower generation Damage to estuarine systems; Damage to marine fisheries Damage to reef ecosystems
4 Fundamental Issues for Receiving Waters How much is being delivered? Where is it coming from (sources)? Spatial distribution? Important processes? Delivery to the channel? Can we reduce it? Need to know where it s coming from Need to address ALL of the significant delivery processes if management strategies are to be effective
5 Catchment Models Rainfall-runoff processes Sediment detachment by Rain drop impact Overland flow processes USLE, MUSLE, RUSLE for fields and slopes Edge of Field Erosion * sediment delivery factor Crude channel erosion based on (??) Streambanks (??) often are determined by subtracting predicted upland values from the measured total at the outlet. Why do we ignore streambanks? Lack of data? Difficult to simulate within catchment model? Pathway dependency / Agency inertia?
6 Sediment Export: A + B = C A = overland flow sources: uplands and fields B = channels and gullies C = delivery to receiving water body But, does B = C A?? Assume we can rely on calculation of loads ( C ) based on measured values; How robust are the calculations of A loads from uplands and fields (USLE/RUSLE);? Are the sediment-delivery and storage terms reliable? Should we not use a more deterministic approach?


7 Sediment Delivery: Chesapeake Bay, 2011 August 23, 2011 September 13, 2011
 Burnett")
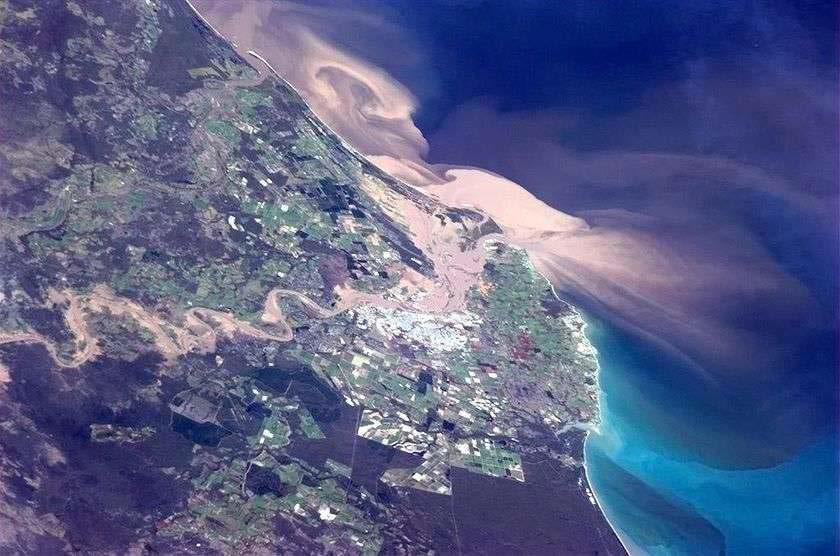
8 Kolan River Sediment Delivery: January 2013 Queensland Floods (Great Barrier Reef) Burnett River


9 Hoteo River, NZ; March 2011 Kaipara Harbor, North Island, NZ: Important Maori and Commercial Fishery being impacted by deposition of fine sediment
10 Potential Sediment Sources Upland hillslopes Forests Pastures Timber production / Roads Foot slopes and Fields Forests Pastures Cropping Channels Beds Banks

11 Hillslope Sediment Eroded hillslope sediment can be trapped (stored) on lower slopes and in fields Poor Connectivity Low sedimentdelivery ratio


12 Streambank Sediment Sediment from stream banks is delivered directly to the channel, available for downstream transport. Good Connectivity Perhaps 100% sediment delivery


13 Sediment Sources ~100 years ago upland & agricultural sources dominated December 1906 December 2013 Images provided by Mark and Loma Page, 2014


14 There is a growing body of evidence that channel systems, particularly streambanks, are now the dominant source of sediment in many disturbed systems Oklahoma Tennessee Minnesota Nebraska Kansas Mississippi

15 For Example, in Kansas ~ 631,000 tonnes eroded during 7 months About 42,000 dump trucks Photo and data from Phil Balch
16 Example Contributions of Streambank Erosion Stream Ecoregion Dominant Bed Material Contribution from Banks James Creek, MS Southeastern Plains Sand/Clay 78% Shades Creek, AL Ridge and Valley Gravel 71-82% Goodwin Creek, MS Burnett River, QLD O Connell River. QLD Upper Truckee River, CA Le Sueur River, MN Obion-Forked Deer River, TN Mississippi Valley Loess Plains Sand/Gravel 70% Reef Catchment Sand 44%-73% Reef Catchment Sand/Gravel 64% Sierra Nevada Gravel 47% Western Corn Belt Plains Mississippi Valley Loess Plains Gravel 75% Sand 81%* *Represents percent contribution from channel sources


17 Example: Coral Sea & Great Barrier Reef Burnett River: January 2013
 Compare to SedNet (catchment model) Implications")
18 How Much Sediment and Where is it Coming From? ~ 8% from streambanks, (Brodie et al., 2003) Is that Correct?? Determine bank-derived sediment loads Empirical and modeling (BSTEM-Dynamic) Compare to SedNet (catchment model) Implications for sediment management?
19 Channel Widening ( ) Empirical Analysis Based on Analysis of LiDAR and Air Photos Paradise Dam Simon et al., 2014
")
20 Unit Bank-Erosion Rates: (m 2 /m) Paradise Dam
21 Empirical Results: (Land lost by bank failures and delivered to the river) About 28 million m 3 (47 million t) (10.2 Mt/y) over the 292 km main stem (4.58 years) About 21 million m 3 or two thirds of these sediments were eroded from banks downstream of Paradise Dam Several reaches had calculated land losses in excess of 1 million m 3. This annual rate represents a short period, characterized by very high flows. Need to simulate a longer period

22 SedNet Long-Term Erosion Rates 1. Long-term erosion rates? (175,000 t/y; 0.175Mt/y) 2. Comparison to other catchment sources? (8%) 3. Sediment export to the Great Barrier Reef? (0.47 Mt/y) 4. Overall management strategy for the Burnett River Catchment? 5. Dredging of the Bundaberg Harbour and the lower River? 6. Are these results unique or typical for the Reef Catchments? Data from Brodie et al., (2003)
23 WATER LEVEL, M 2-D wedge- and cantileverfailures Daily (hourly) time steps Search routine for failures Hydraulic toe erosion Accounts for grain roughness Complex bank geometries Positive and negative pore-water pressures (dynamic groundwater) Confining pressure from flow Layers of different strength Vegetation effects: RipRoot Variable roughness Inputs: g s, c, f, f b, h, u w, k, t c FACTOR OF SAFETY Bank-Stability Model (Dynamic) Ver. 2.3 B Confining pressure Stage Factor of safety Effect of confining pressure Bank failures shear surface Tensiometers (pore pressure) /29/97 01/05/98 01/12/98 01/19/98 01/26/98 02/02/ RIVER STAGE, IN METERS ABOVE SEA LEVEL
24 Average, Annual Bank-Erosion Rates (for different simulation periods) Brodie et al., (2003) BSTEM-derived results for the 4.58 year modeling period within 10% of empirical value; (9.3 Mt/y)
25 SedNet: The Numbers Hillslopes: 1.65 Mt/y Gullies: 0.93 Mt/y Banks: Mt/y (8%) Total: 2.76 Mt/y Scenario 1 Hillslopes: 1.65 Mt/y Gullies: 0.93 Mt/y Banks: 2.0 Mt/y (44%) Total: 4.6 Mt/y Scenario 2 Hillslopes:? Mt/y Gullies:? Mt/y Banks: 2.0 Mt/y (72%) Total: 2.76 Mt/y We have a problem here What if management strategies are based on these results??
26 How Much Sediment Reduction? Targets Level III Ecoregions and Available Data
27 Two-Stage Suspended-Sediment Ratings SUSPENDED-SEDIMENT LOAD, IN TONNES/DAY James Wolf Creek near Looxahoma, MS DISCHARGE IN CUBIC METERS PER SECOND 110,000 T/D 26,000 T/D Q 1.5
28 Median Suspended-Sediment Concentrations Median Suspended-Sediment Concentration at Q in mg/l no data Simon et al (2004)
29 Median Suspended-Sediment Yields Median Suspended-Sediment Yield at Q in T/D/km no data
30 Stage I. Sinuous, Premodified h<h c h c = critical bank height Reference Stages h = direction of bank or bed movement Stage I. Sinuous, Premodified h<h c h Stage II. Constructed Stage III. Degradation h<h c h c = critical bank height h<h c floodplain h = direction of bank or bed movement h Stage IV. Degradation and Widening h>h c terrace h Stage IV. Degradation and Stage II. Constructed Stage III. V. Degradation Aggradation and Widening Widening Stage VI. Quasi Equilibrium h<h c h c = critical bank height h<h h>h c c h>h c h<h c floodplain = direction of bank or terrace terrace terrace bed movement bank h h h h bankfull h slumped material References aggraded material aggraded material Stage IV. Degradation and slumped material tage III. Degradation Widening <h c h>h c Stages I, II V. Aggradation and Widening Stage VI. Quasi Equilibrium primary h>h Stage c I terrace h<h c knickpoint Stage III terrace terrace Stage IV t o p b a bank n Stage V h h precursor plunge k Stage h h VI knickpoint pool bankfull d i r e Stage VI c t i o n o f f l o w slumped material slumped secondary material knickpoint aggraded material oversteepened reach aggraded aggradation material zone aggraded material ning Stage VI. Quasi Equilibrium h<h c Stages I, II terrace primary knickpoint h bank Stage bankfull III Stage IV slumped material
31 Reference Suspended-Sediment Yields SEDIMENT YIELD AT Q 1.5, IN T/D/KM Minimum 1st Quartile Median 3rd Quartile Maximum Stable General "reference" 0.31 T/D/km 2 SOUTHEASTERN PLAINS SEDIMENT YIELD AT Q 1.5 IN T/d/km Minimum 1st Quartile Median 3rd Quartile Maximum Stable Reference ARIZONA/NEW MEXICO PLATEAU 1.3 T/d/km 2
32 Reference Suspended-Sediment Concentrations SEDIMENT CONCENTRATION AT Q 1.5, IN mg/l Minimum 1st Quartile Median 3rd Quartile Maximum Stable General "reference" 47.9 mg/l SOUTHEASTERN PLAINS SEDIMENT CONCENTRATION AT Q 1.5 IN mg/l mg/l Minimum 1st Quartile Median 3rd Quartile Maximum Stable Reference ARIZONA/NEW MEXICO PLATEAU


33 How Much Reduction? PERCENT OCCURRENCE I II III IV V VI STAGE OF CHANNEL EVOLUTION Both watersheds contain unstable channel systems characterized by incised channels and unstable banks ER 27: Ft Cobb and Little Washita Channels

 at Q 1.")
34 ER27 Results Suspended-sediment yields from Cobb Creek and Little Washita River are among the highest in the ecoregion (1-2 orders of magnitude greater than the median value for stable sites) at Q 1.5 for mean-annual yield
35 Simon and Klimetz, 2008 How Much Reduction?
36 Duration of High Concentrations and Benthic Populations TOTAL # BENTHIC MACRO-INVERTEBRATES Data from 8 sites in Ecoregion 74 Y = 96585x R 2 = y = x R 2 = ANNUAL DURATION OF SUSPENDED SEDIMENT ABOVE 1000 mg/l (MIN)
37 Metrics for Stable and Unstable Sites Frequency Duration PERCENTAGE OF TIME EQUALLED OR EXCEEDED INTERIOR PLATEAU Ecoregion 71 Stable sites Unstable sites AVERAGE NUMBER OF CONSECUTIVE DAYS EQUALLED OR EXCEEDED Stable sites Unstable sites INTERIOR PLATEAU Ecoregion 71 PERCENTAGE OF TIME EQUALLED OR EXCEEDED CONCENTRATION, IN MILLIGRAMS PER LITER Stable Sites Unstable Sites BLUE RIDGE Ecoregion 66 AVERAGE NUMBER OF CONSECUTIVE DAYS EQUALLED OR EXCEEDED CONCENTRATION, IN MILLIGRAMS PER LITER BLUE RIDGE Ecoregion 66 Stable Sites Unstable Sites CONCENTRATION, IN MILLIGRAMS PER LITER CONCENTRATION, IN MILLIGRAMS PER LITER


38 Reference Frequency of Exceedance (%) Lowland coastal areas Piedmont Highly erodible loess area Plains Need to link with functional traits of aquatic organisms
39 Effectiveness of Mitigation Strategies Bank stability is increased by. Vegetation mechanical, hydraulic and hydrologic effects drainage toe protection / flow reduction
40 Effectiveness of Toe Protection 6000 STREAMBANK EROSION IN CUBIC METERS BW 1.94 E BW 1.94 TP 1 BW 2.39 E BW 2.39 TP Hydraulic toe erosion Geotechnical erosion Lake Tahoe Basin UT 4.51 E No veg UT 4.51 TP 4 UT 13.1 E UT 13.1 TP SITE UT 4.51 E UT 4.51 TP 10 UT 8.45 E UT 8.45 TP WA 2.48 E WA 2.48 TP 5 WA 3.60 E WA 3.60 TP 1 Simon et al (2009) Toe protection = 86% (average) Top-bank vegetation = 53% (root reinforcement) Bed-slope reduction (meandering) = 42-54%
41 ELEVATION, IN METERS ELEVATION, IN METERS Example: Modeled Mitigation Results Start Profile No Action With rock to to 1.5m With ELJ, average per m & per structure With rock to to 1.5m, with vegetation No imposed changes in geometry STATION, IN METERS 20 2:1 Start Profile Hoteo River, NZ: Site 27A :1 Start Profile With reconfigured bank, 2:1 With reconfigured bank, 1.5:1 With reconfigured bank, 1.5:1, with vegetation Flattening of banks STATION, IN METERS
42 Cost Effectiveness of Mitigation Scenarios: (HO-27A: 240 m) PERCENT REDUCTION 100% $400,000 90% 80% 70% 60% 50% 40% 30% 20% 10% Percent reduction in retreat Percent reduction in eroded volume Total Cost $350,000 $300,000 $250,000 $200,000 $150,000 $100,000 $50,000 TOTAL COST IN NZ $ 0% No Action With reconfigured bank, 1.5:1 With reconfigured bank, 2:1 With reconfigured bank, 1.5:1, with vegetation With reconfigured bank, 1.5:1, and rock toe to 1.5m With rock to to 1.5m With rock weirs With ELJ, average per m & per structure With rock to to 1.5m, with vegetation $- Ultimate decision by Stakeholders to be based on: Cost and available resources Health, safety and habitat benefits Need to hold the line? Priority of Load reduction, Land Loss vs. Retreat Aesthetics

43 Generic Bank- Stability Modeling to Test Erosion- Control Effectiveness: West Tennessee Used BSTEM-Dynamic; 155 sites; Daily flows for ; 75 th, 50 th and 25 th percentile values for boundary resistance by sub-basin
44 Bank-Stability Modeling to Test Mitigation Effectiveness in West Tennessee Average Erosion Reductions* Riparian planting: 16% (5-year old trees) Bank-toe protection: 83% Bank-toe & bank-face protection: 88% * For median-strength conditions (higher for 25 th percentile-strength conditions) Only 5% improvement for protecting the entire bank face!! Most effective Least effective
45 Flow Control and Bank Erosion: Mitta Mitta River, Victoria, Australia Dartmouth Dam completed in 1979 has significantly altered the flow regime of the Mitta Mitta River; During dry times, bulk-water transfers are undertaken to supplement storage in Lake Hume; These can be at bankfull levels (~10,000 ML/d) and last for months it s a pipe; Example bulk-water transfers
46 Erosion Thresholds as Determined by BSTEM Site 9L 13R 15R 19R 22R 27R 36L Threshold (ML/d) 9,504 12,960 11,232 5,184 5,184 6,912 5,702 Sites with lowest thresholds have the lowest critical shear-stress values at the bank toe; 1.1, 0.8, and 0.1 Pa (equivalent to resistance of sand); Higher erosion rates are associated with the lowest thresholds No erosion thresholds < 5,184 ML/d, indicating that the current optimal release level of 5,000 ML/d is valid for minimizing erosion.
47 Testing of Alternative Flow Scenarios How best to transfer 920,000 ML over 7 months S1: Moderate-Constant - 5,000 ML/d, 167-day duration S2: Maximum Rate of Fall - Variable, six 7,500 ML/d peaks, recession 20 mm/h, 30- day duration S3: Slower and Smaller - Variable, six 6,400 ML/d peaks, recession 5 mm/h, 26 day duration S4: Worst Case-Maximum Flow - one 10,000 ML/d peak for 86 days
48 Erosion for Alternative Flows (7 months) By site From lowest to highest erosion rates (average values, in m 3 /m) Moderate-Constant Flow: 0.016**; Slower and Smaller: 0.037; Maximum RoF: 0.086; Worst Case/Maximum Flow Rate: By flow scenario **Would not be used without some flow variability
49 Use the Right Tools for the Problem (to Reduce Risk and Uncertainty in Design) 1. Integrate flow and sediment model with bankprocesses model, and ultimately 2. Integrate Channel Model with upland model
50 Some Channel-Model Capabilities Process BSTEM HEC- RAS SRH- 2D HEC+ BSTEM SRH- 2D+BSTEM Shear in meanders Bank-toe erosion Mass-failures Bed erosion Sediment transport Vegetation effects Hard engineering Channel evolution Rapid Assessments
51 HEC-RAS/BSTEM: Interaction of Three Processes Currently contains a simplified version of BSTEM: 1-layer No root reinforcement 3. Bank failure Failure 2. Toe scour Scour 1. Incision modified from Gibson et al., 2015
52 Example HEC-RAS/BSTEM Results From Gibson et al., 2015
53 Summary and Conclusions Gravity and the physics of erosion and sediment transport are the same wherever we are, allowing us to quantify force and resistance mechanisms and predict loadings. Sediment eroded from catchments adversely impact receiving water bodies Sources include uplands, fields AND channels, particularly streambanks Determining sources and magnitudes of sediment erosion and delivery are critical to providing resilient sediment management Appropriate field and analytic techniques exist to quantify catchment and channel erosion, sediment delivery, AND potential reductions. They are no more expensive or time consuming than current practices.
Analysis of Cost-Effective Rehabilitation: Principles and Tools for Reducing Uncertainty in Design
 Analysis of Cost-Effective Rehabilitation: Principles and Tools for Reducing Uncertainty in Design Natasha Bankhead and Andrew Simon Cardno ENTRIX, Oxford, MS natasha.bankhead@cardno.com Often the Questions
Rapid Geomorphic Assessments: RGA s
 Establishing Current Reference Conditions Rates and concentrations of suspended-sediment transport vary over time and space due to factors such as precipitation characteristics and discharge, geology,
Diagnostic Geomorphic Methods for Understanding Future Behavior of Lake Superior Streams What Have We Learned in Two Decades?
 Diagnostic Geomorphic Methods for Understanding Future Behavior of Lake Superior Streams What Have We Learned in Two Decades? Faith Fitzpatrick USGS WI Water Science Center, Middleton, WI fafitzpa@usgs.gov
Why Geomorphology for Fish Passage
 Channel Morphology - Stream Crossing Interactions An Overview Michael Love Michael Love & Associates mlove@h2odesigns.com (707) 476-8938 Why Geomorphology for Fish Passage 1. Understand the Scale of the
Stream Geomorphology. Leslie A. Morrissey UVM July 25, 2012
 Stream Geomorphology Leslie A. Morrissey UVM July 25, 2012 What Functions do Healthy Streams Provide? Flood mitigation Water supply Water quality Sediment storage and transport Habitat Recreation Transportation
Overview of fluvial and geotechnical processes for TMDL assessment
 Overview of fluvial and geotechnical processes for TMDL assessment Christian F Lenhart, Assistant Prof, MSU Research Assoc., U of M Biosystems Engineering Fluvial processes in a glaciated landscape Martin
Erosion Rate is a Function of Erodibility and Excess Shear Stress = k ( o - c ) From Relation between Shear Stress and Erosion We Calculate c and
 From Relation between Shear Stress and Erosion We Calculate c and") Equilibrium, Shear Stress, Stream Power and Trends of Vertical Adjustment Andrew Simon USDA-ARS, Oxford, MS asimon@msa-oxford.ars.usda.gov Non-Cohesive versus Cohesive Materials Non-cohesive: sands and
Equilibrium, Shear Stress, Stream Power and Trends of Vertical Adjustment Andrew Simon USDA-ARS, Oxford, MS asimon@msa-oxford.ars.usda.gov Non-Cohesive versus Cohesive Materials Non-cohesive: sands and
How Do Human Impacts and Geomorphological Responses Vary with Spatial Scale in the Streams and Rivers of the Illinois Basin?
 How Do Human Impacts and Geomorphological Responses Vary with Spatial Scale in the Streams and Rivers of the Illinois Basin? Bruce Rhoads Department of Geography University of Illinois at Urbana-Champaign
Avoiding Geohazards in the Mid-Atlantic Highlands by Using Natural Stream Principles
 Avoiding Geohazards in the Mid-Atlantic Highlands by Using Natural Stream Principles J. Steven Kite, WVU Neal Carte, WVDOT Will Harman, Michael Baker Corp. Donald D. Gray, WVU Photo: W. Gillespie North
low turbidity high turbidity
 What is Turbidity? Turbidity refers to how clear the water is. The greater the amount of total suspended solids (TSS) in the water, the murkier it appears and the higher the measured turbidity. Excessive
Watershed Conservation Management Planning Using the Integrated Field & Channel Technology of AnnAGNPS & CONCEPTS
 Watershed Conservation Management Planning Using the Integrated Field & Channel Technology of AnnAGNPS & CONCEPTS Eddy Langendoen Ron Bingner USDA-ARS National Sedimentation Laboratory, Oxford, Mississippi
CR AAO Bridge. Dead River Flood & Natural Channel Design. Mitch Koetje Water Resources Division UP District
 CR AAO Bridge Dead River Flood & Natural Channel Design Mitch Koetje Water Resources Division UP District Old County Road AAO Bridge Map courtesy of Marquette County Silver Lake Basin McClure Basin
Ways To Identify Background Verses Accelerated Erosion
 Ways To Identify Background Verses Accelerated Erosion Establish Background Condition From Old Ground Photos, Aerial Photos, and Maps Compare Rate Over Time At the Same Location, or for Reaches Channel
SPECIFIC DEGRADATION AND RESERVOIR SEDIMENTATION. By Renee Vandermause & Chun-Yao Yang
 SPECIFIC DEGRADATION AND RESERVOIR SEDIMENTATION By Renee Vandermause & Chun-Yao Yang Outline Sediment Degradation - Erosion vs Sediment Yield - Sediment Yield - Methods for estimation - Defining Sediment
SCOPE OF PRESENTATION STREAM DYNAMICS, CHANNEL RESTORATION PLANS, & SEDIMENT TRANSPORT ANALYSES IN RELATION TO RESTORATION PLANS
 DESIGN METHODS B: SEDIMENT TRANSPORT PROCESSES FOR STREAM RESTORATION DESIGN PETER KLINGEMAN OREGON STATE UNIVERSITY CIVIL ENGINEERING DEPT., CORVALLIS 2 ND ANNUAL NORTHWEST STREAM RESTORATION DESIGN SYMPOSIUM
SECTION G SEDIMENT BUDGET
 SECTION G SEDIMENT BUDGET INTRODUCTION A sediment budget has been constructed for the for the time period 1952-2000. The purpose of the sediment budget is to determine the relative importance of different
Griswold Creek August 22, 2013
 Creek August 22, 2013 1 Lake Erie Protection Fund Creek Study ver Evaluate the overall condition of Creek Determine stable channel dimensions & appropriate restoration techniques Starting Stat gpoint for
Perspectives on river restoration science, geomorphic processes, and channel stability
 Perspectives on river restoration science, geomorphic processes, and channel stability Stream Restoration Forum: Science and Regulatory Connections Andrew C. Wilcox Department of Geosciences University
B-1. Attachment B-1. Evaluation of AdH Model Simplifications in Conowingo Reservoir Sediment Transport Modeling
 Attachment B-1 Evaluation of AdH Model Simplifications in Conowingo Reservoir Sediment Transport Modeling 1 October 2012 Lower Susquehanna River Watershed Assessment Evaluation of AdH Model Simplifications
Island Design. UMRS EMP Regional Workshop. Presentation for the
 Island Design Presentation for the UMRS EMP Regional Workshop by Jon Hendrickson Hydraulic Engineer Regional Technical Specialist, Water Quality and Habitat Restoration August 17 19, 2005 Project Delivery
Gully Erosion Part 1 GULLY EROSION AND ITS CAUSES. Introduction. The mechanics of gully erosion
 Gully Erosion Part 1 GULLY EROSION AND ITS CAUSES Gully erosion A complex of processes whereby the removal of soil is characterised by incised channels in the landscape. NSW Soil Conservation Service,
Sediment and nutrient transport and storage along the urban stream corridor
 Sediment and nutrient transport and storage along the urban stream corridor Greg Noe, Cliff Hupp, Ed Schenk, Jackie Batson, Nancy Rybicki, Allen Gellis What is the role of floodplains everywhere? Noe 2013,
mountain rivers fixed channel boundaries (bedrock banks and bed) high transport capacity low storage input output
 high transport capacity low storage input output") mountain rivers fixed channel boundaries (bedrock banks and bed) high transport capacity low storage input output strong interaction between streams & hillslopes Sediment Budgets for Mountain Rivers Little
mountain rivers fixed channel boundaries (bedrock banks and bed) high transport capacity low storage input output strong interaction between streams & hillslopes Sediment Budgets for Mountain Rivers Little
Defining Hydromorphological Conditions and Links to Ecology. The changing role of Geomorphology in River Management and Restoration
 Defining Hydromorphological Conditions and Links to Ecology The changing role of Geomorphology in River Management and Restoration Colin Thorne University of Nottingham Topic 1 1. How has the role of fluvial
Chris Lenhart, John Nieber, Ann Lewandowski, Jason Ulrich TOOLS AND STRATEGIES FOR REDUCING CHANNEL EROSION IN MINNESOTA
 Chris Lenhart, John Nieber, Ann Lewandowski, Jason Ulrich TOOLS AND STRATEGIES FOR REDUCING CHANNEL EROSION IN MINNESOTA Background and approach Channel loading major source of sediment in much of MN River
NATURE OF RIVERS B-1. Channel Function... ALLUVIAL FEATURES. ... to successfully carry sediment and water from the watershed. ...dissipate energy.
 1 2 Function... Sevier River... to successfully carry sediment and water from the watershed....dissipate energy. 3 ALLUVIAL FEATURES 4 CHANNEL DIMENSION The purpose of a stream is to carry water and sediment
Watershed Assessment of River Stability and Sediment Supply: Advancing the Science of Watershed Analysis
 Watershed Assessment of River Stability and Sediment Supply: Advancing the Science of Watershed Analysis 2009 MWEA Annual Conference Rob Myllyoja, CET rmyllyoja@hrc-engr.com Watershed Assessment of River
Limitation to qualitative stability indicators. the real world is a continuum, not a dichotomy ~ 100 % 30 % ~ 100 % ~ 40 %
 Stream Stability Assessment & BEHI Surveys Joe Rathbun MDEQ Water Resources Division rathbunj@michigan.gov 517--373 517 373--8868 Stability Stream can transport its water and sediment inputs without changing
Each basin is surrounded & defined by a drainage divide (high point from which water flows away) Channel initiation
 Channel initiation") DRAINAGE BASINS A drainage basin or watershed is defined from a downstream point, working upstream, to include all of the hillslope & channel areas which drain to that point Each basin is surrounded &
DRAINAGE BASINS A drainage basin or watershed is defined from a downstream point, working upstream, to include all of the hillslope & channel areas which drain to that point Each basin is surrounded &
Summary of Hydraulic and Sediment-transport. Analysis of Residual Sediment: Alternatives for the San Clemente Dam Removal/Retrofit Project,
 Appendix N SUMMARY OF HYDRAULIC AND SEDIMENT-TRANSPORT ANALYSIS OF RESIDUAL SEDIMENT: ALTERNATIVES FOR THE SAN CLEMENTE DAM REMOVAL/RETROFIT PROJECT, CALIFORNIA the San Clemente Dam Removal/Retrofit Project,
Dam Removal Analysis Guidelines for Sediment
 A review of: Dam Removal Analysis Guidelines for Sediment Joe Rathbun (Retired) rathbunj@sbcglobal.net Some Potential Sediment Issues Reservoir restoration Downstream water quality Downstream deposition
Appendix O. Sediment Transport Modelling Technical Memorandum
 Appendix O Sediment Transport Modelling Technical Memorandum w w w. b a i r d. c o m Baird o c e a n s engineering l a k e s design r i v e r s science w a t e r s h e d s construction Final Report Don
Riparian Assessment. Steps in the right direction... Drainage Basin/Watershed: Start by Thinking Big. Riparian Assessment vs.
 Riparian Assessment vs. Monitoring Riparian Assessment What is a healthy stream? Determine stream/riparian health Determine change or trend, especially in response to mgmt Classification = designation
Influence of the Major Drainages to the Mississippi River and Implications for System Level Management
 Influence of the Major Drainages to the Mississippi River and Implications for System Level Management Brian M. Vosburg Geologist Louisiana Coastal Protection and Restoration Authority brian.vosburg@la.gov
Assessment. Assessment
 2001 SPRINGBROOK CREEK RESTORATION - THREE YEAR POST-CONSTRUCTION REVIEW - Presented by Bruce Henderson and Andy Harris 2005 River Restoration Northwest Symposium Skamania Lodge, Washington www.hendersonlandservices.com
WATER ON AND UNDER GROUND. Objectives. The Hydrologic Cycle
 WATER ON AND UNDER GROUND Objectives Define and describe the hydrologic cycle. Identify the basic characteristics of streams. Define drainage basin. Describe how floods occur and what factors may make
Dolores River Watershed Study
 CHAPTER 4: RIVER AND FLOODPLAIN ISSUES The Dolores River falls into a category of streams in Colorado that share some unique characteristics. Like some other mountain streams in the state, it has a steep
Wetland & Floodplain Functional Assessments and Mapping To Protect and Restore Riverine Systems in Vermont. Mike Kline and Laura Lapierre Vermont DEC
 Wetland & Floodplain Functional Assessments and Mapping To Protect and Restore Riverine Systems in Vermont Mike Kline and Laura Lapierre Vermont DEC NWI+ Hydro-Geomorphic Characterization of Wetlands and
Dr. Eddy Langendoen PUCP 2017
 Agricultural Research Service Channel Width Adjustment: Importance, Mechanics & Assessment Eddy J. Langendoen Research Hydraulic Engineer & Lead Scientist Watershed Physical Processes Research Unit US
Technical Memorandum No
 Pajaro River Watershed Study in association with Technical Memorandum No. 1.2.10 Task: Evaluation of Four Watershed Conditions - Sediment To: PRWFPA Staff Working Group Prepared by: Gregory Morris and
Why Stabilizing the Stream As-Is is Not Enough
 Why Stabilizing the Stream As-Is is Not Enough Several examples of alternatives to the County s design approach have been suggested. A common theme of these proposals is a less comprehensive effort focusing
11/12/2014. Running Water. Introduction. Water on Earth. The Hydrologic Cycle. Fluid Flow
 Introduction Mercury, Venus, Earth and Mars share a similar history, but Earth is the only terrestrial planet with abundant water! Mercury is too small and hot Venus has a runaway green house effect so
Swift Creek Sediment Management Action Plan (SCSMAP)
") Swift Creek Sediment Management Action Plan (SCSMAP) PHASE 2 PROJECT PLAN PROPOSAL Whatcom County Public Works Department 322 N. Commercial Street, Suite 210 Bellingham, WA 98225 (360) 676-6692 June 2013
Swift Creek Sediment Management Action Plan (SCSMAP) PHASE 2 PROJECT PLAN PROPOSAL Whatcom County Public Works Department 322 N. Commercial Street, Suite 210 Bellingham, WA 98225 (360) 676-6692 June 2013
Introduction Fluvial Processes in Small Southeastern Watersheds
 Introduction Fluvial Processes in Small Southeastern Watersheds L. Allan James Scott A. Lecce Lisa Davis Southeastern Geographer, Volume 50, Number 4, Winter 2010, pp. 393-396 (Article) Published by The
RAILWAYS AND FISH: HOW TO PROTECT AND ENHANCE FISH HABITAT VALUES AT STREAM CROSSINGS THROUGH PROJECT DESIGN AND CONSTRUCTION
 RAILWAYS AND FISH: HOW TO PROTECT AND ENHANCE FISH HABITAT VALUES AT STREAM CROSSINGS THROUGH PROJECT DESIGN AND CONSTRUCTION Rail Environment Conference November 2016 AGENDA Objective Background Benefits
Black Gore Creek 2013 Sediment Source Monitoring and TMDL Sediment Budget
 Black Gore Creek 2013 Sediment Source Monitoring and TMDL Sediment Budget Prepared for: Prepared By: - I. Introduction The Black Gore Creek Total Maximum Daily Load (TMDL) was developed in collaboration
Roger Andy Gaines, Research Civil Engineer, PhD, P.E.
 Roger Andy Gaines, Research Civil Engineer, PhD, P.E. Research Civil Engineer/Regional Technical Specialist Memphis District August 24, 2010 Objectives Where we have been (recap of situation and what s
Stream Classification
 Stream Classification Why Classify Streams? Communication Tool Describe Existing Conditions & Trends Describe Restoration Goals Research Tool Morphologic Stream Classification Systems Schumm (1977) Alluvial
Dams, sediment, and channel changes and why you should care
 Dams, sediment, and channel changes and why you should care Gordon E. Grant USDA Forest Service PNW Research Station Corvallis, Oregon Dam effects on river regimes FLOW (Q) SEDIMENT (Qs) TEMP CHEMISTRY
Aquifer an underground zone or layer of sand, gravel, or porous rock that is saturated with water.
 Aggradation raising of the streambed by deposition that occurs when the energy of the water flowing through a stream reach is insufficient to transport sediment conveyed from upstream. Alluvium a general
Carmel River Bank Stabilization at Rancho San Carlos Road Project Description and Work Plan March 2018
 Carmel River Bank Stabilization at Rancho San Carlos Road Project Description and Work Plan March 2018 EXISTING CONDITION The proposed Carmel River Bank Stabilization at Rancho San Carlos Road Project
Appendix K.2: Sediment Management Excerpt from South Orange County Hydromodification Management Plan
 Appendix K.2: Sediment Management Excerpt from South Orange County Hydromodification Management Plan 4 Sediment Supply Management Requirements Permit Order R9-2013-0001 as amended by Order No. R9-2015-0001Section
APPENDIX E. GEOMORPHOLOGICAL MONTORING REPORT Prepared by Steve Vrooman, Keystone Restoration Ecology September 2013
 APPENDIX E GEOMORPHOLOGICAL MONTORING REPORT Prepared by Steve Vrooman, Keystone Restoration Ecology September 2 Introduction Keystone Restoration Ecology (KRE) conducted geomorphological monitoring in
Dan Miller + Kelly Burnett, Kelly Christiansen, Sharon Clarke, Lee Benda. GOAL Predict Channel Characteristics in Space and Time
 Broad-Scale Models Dan Miller + Kelly Burnett, Kelly Christiansen, Sharon Clarke, Lee Benda GOAL Predict Channel Characteristics in Space and Time Assess Potential for Fish Use and Productivity Assess
When Creek Meets Valley Wall: Prioritizing Erosion Mitigation alongside the Oshawa Landfill
 1 When Creek Meets Valley Wall: Prioritizing Erosion Mitigation alongside the Oshawa Landfill Robin McKillop 1, Dan McParland 1 & Cassie Scobie 2 TRIECA conference March 22-23, 2017 1 Palmer Environmental
Instream Erosion Control General
 Instream Erosion Control General EROSION CONTROL TECHNIQUES Revegetation Temperate Climates Short-Term Non Vegetation Wet Tropics Long-Term Weed Control [1] Semi-Arid Zones Permanent [1] Weed control attributes
Do you think sediment transport is a concern?
 STREAM RESTORATION FRAMEWORK AND SEDIMENT TRANSPORT BASICS Pete Klingeman 1 What is Your Restoration Project Like? k? Do you think sediment transport is a concern? East Fork Lewis River, WA Tidal creek,
Rivers T. Perron
 1 Rivers T. Perron 12.001 After our discussions of large-scale topography, how we represent topography in maps, and how topography interacts with geologic structures, you should be frothing at the mouth
River Response. Sediment Water Wood. Confinement. Bank material. Channel morphology. Valley slope. Riparian vegetation.
 River Response River Response Sediment Water Wood Confinement Valley slope Channel morphology Bank material Flow obstructions Riparian vegetation climate catchment vegetation hydrological regime channel
May 7, Roger Leventhal, P.E. Marin County Public Works Laurel Collins Watershed Sciences
 May 7, 2013 Roger Leventhal, P.E. Marin County Public Works Laurel Collins Watershed Sciences Background Funded in 2009 under EPA 2100 Grant for $30k and managed by SFEP Project Goals: Update original
Tarbela Dam in Pakistan. Case study of reservoir sedimentation
 Tarbela Dam in Pakistan. HR Wallingford, Wallingford, UK Published in the proceedings of River Flow 2012, 5-7 September 2012 Abstract Reservoir sedimentation is a main concern in the Tarbela reservoir
Strategies for managing sediment in dams. Iwona Conlan Consultant to IKMP, MRCS
 Strategies for managing sediment in dams Iwona Conlan Consultant to IKMP, MRCS 1 Sediment trapping by dams Active storage capacity Dead storage coarse material (bed load) Fine materials (suspension) Francis
Subcommittee on Sedimentation Draft Sediment Analysis Guidelines for Dam Removal
 Subcommittee on Sedimentation Draft Sediment Analysis Guidelines for Dam Removal August 4, 2011 Jennifer Bountry, M.S., P.E. Tim Randle, M.S., P.E., D.WRE. Blair Greimann, Ph.D., P.E. Sedimentation and
ADDRESSING GEOMORPHIC AND HYDRAULIC CONTROLS IN OFF-CHANNEL HABITAT DESIGN
 ADDRESSING GEOMORPHIC AND HYDRAULIC CONTROLS IN OFF-CHANNEL HABITAT DESIGN Conor Shea - Hydrologist U.S. Fish and Wildlife Service Conservation Partnerships Program Arcata, CA Learning Objectives Examine
Step 5: Channel Bed and Planform Changes
 Step 5: Channel Bed and Planform Changes When disturbed, streams go through a series of adjustments to regain equilibrium with the flow and sediment supply of their watersheds. These adjustments often
Upper Truckee River Restoration Lake Tahoe, California Presented by Brendan Belby Sacramento, California
 Upper Truckee River Restoration Lake Tahoe, California Presented by Brendan Belby Sacramento, California Mike Rudd (Project Manager), Charley Miller & Chad Krofta Declines in Tahoe s Water Clarity The
Sedimentation in the Nile River
 Advanced Training Workshop on Reservoir Sedimentation Sedimentation in the Nile River Prof. Dr. Abdalla Abdelsalam Ahmed 10-16 Oct. 2007, IRTCES, Beijing, China CWR,Sudan 1 Water is essential for mankind
NATURAL RIVER. Karima Attia Nile Research Institute
 NATURAL RIVER CHARACTERISTICS Karima Attia Nile Research Institute NATURAL RIVER DEFINITION NATURAL RIVER DEFINITION Is natural stream of water that flows in channels with ih more or less defined banks.
Bank Erosion and Morphology of the Kaskaskia River
 Bank Erosion and Morphology of the Kaskaskia River US Army Corps Of Engineers St. Louis District Fayette County Soil and Water Conservation District Team Partners : Carlyle Lake Ecosystem Partnership Vicinity
ES 105 Surface Processes I. Hydrologic cycle A. Distribution % in oceans 2. >3% surface water a. +99% surface water in glaciers b.
 ES 105 Surface Processes I. Hydrologic cycle A. Distribution 1. +97% in oceans 2. >3% surface water a. +99% surface water in glaciers b. >1/3% liquid, fresh water in streams and lakes~1/10,000 of water
Illinois State Water Survey Division
 Illinois State Water Survey Division SURFACE WATER SECTION SWS Miscellaneous Publication 108 SEDIMENT YIELD AND ACCUMULATION IN THE LOWER CACHE RIVER by Misganaw Demissie Champaign, Illinois June 1989
Geomorphology Geology 450/750 Spring Fluvial Processes Project Analysis of Redwood Creek Field Data Due Wednesday, May 26
 Geomorphology Geology 450/750 Spring 2004 Fluvial Processes Project Analysis of Redwood Creek Field Data Due Wednesday, May 26 This exercise is intended to give you experience using field data you collected
Earth Science Chapter 9. Day 6 - Finish Capillary Action Lab - Quiz over Notes - Review Worksheets over Sections 9.2 and 9.3
 Earth Science Chapter 9 Day 1 Day 2 Day 3 Read Section 9.1 Surface Water Chapter 9 Term Sheet Notes over Section 9.1 Surface Water Section 9.1 Review Worksheets Quiz over Section 9.1 Notes Virtual Lab
Subject Name: SOIL AND WATER CONSERVATION ENGINEERING 3(2+1) COURSE OUTLINE
 COURSE OUTLINE") Subject Name: SOIL AND WATER CONSERVATION ENGINEERING 3(2+1) COURSE OUTLINE (Name of Course Developer: Prof. Ashok Mishra, AgFE Department, IIT Kharagpur, Kharagpur 721 302) Module 1: Introduction and
Subject Name: SOIL AND WATER CONSERVATION ENGINEERING 3(2+1) COURSE OUTLINE (Name of Course Developer: Prof. Ashok Mishra, AgFE Department, IIT Kharagpur, Kharagpur 721 302) Module 1: Introduction and
7.3 Sediment Delivery Analysis
 7.3 Sediment Delivery Analysis In order to evaluate potential changes in sedimentation patterns that could occur due to impacts from the FCP and LPP alignments, sediment assessment models were constructed
SEDIMENT BENEFICIAL USE SUPPORT ASSESSMENT FOR OTTER CREEK
 SEDIMENT BENEFICIAL USE SUPPORT ASSESSMENT FOR OTTER CREEK Addresses Otter Creek Assessment Unit MT42C002_020 Prepared by: Kristy Fortman November 15, 2013 1 1.0 INTRODUCTION In the spring of 2013, the
GEOL 1121 Earth Processes and Environments
 GEOL 1121 Earth Processes and Environments Wondwosen Seyoum Department of Geology University of Georgia e-mail: seyoum@uga.edu G/G Bldg., Rm. No. 122 Seyoum, 2015 Chapter 6 Streams and Flooding Seyoum,
Modeling Post-Development Runoff and Channel Impacts from Hydromodification: Practical Tools for Hydromodification Assessment
 Modeling Post-Development Runoff and Channel Impacts from Hydromodification: Practical Tools for Hydromodification Assessment Chris Bowles, Ph.D. Andy Collison, Ph.D. Matt Wickland, M.S. c.bowles@pwa-ltd.com
Surface Processes Focus on Mass Wasting (Chapter 10)
") Surface Processes Focus on Mass Wasting (Chapter 10) 1. What is the distinction between weathering, mass wasting, and erosion? 2. What is the controlling force in mass wasting? What force provides resistance?
Surface Processes Focus on Mass Wasting (Chapter 10) 1. What is the distinction between weathering, mass wasting, and erosion? 2. What is the controlling force in mass wasting? What force provides resistance?
OBJECTIVES. Fluvial Geomorphology? STREAM CLASSIFICATION & RIVER ASSESSMENT
 STREAM CLASSIFICATION & RIVER ASSESSMENT Greg Babbit Graduate Research Assistant Dept. Forestry, Wildlife & Fisheries Seneca Creek, Monongahela National Forest, West Virginia OBJECTIVES Introduce basic
Solutions to Flooding on Pescadero Creek Road
 Hydrology Hydraulics Geomorphology Design Field Services Photo courtesy Half Moon Bay Review Solutions to Flooding on Pescadero Creek Road Prepared for: San Mateo County Resource Conservation District
Chapter 3 Erosion in the Las Vegas Wash
 Chapter 3 Erosion in the Las Vegas Wash Introduction As described in Chapter 1, the Las Vegas Wash (Wash) has experienced considerable change as a result of development of the Las Vegas Valley (Valley).
Surface Water and Stream Development
 Surface Water and Stream Development Surface Water The moment a raindrop falls to earth it begins its return to the sea. Once water reaches Earth s surface it may evaporate back into the atmosphere, soak
RESERVOIR DRAWDOWN RATES/RESERVOIR DRAWDOWN TEST Iron Gate, Copco (I & II), and JC Boyle Dams
, and JC Boyle Dams") TECHNICAL MEMORANDUM No. 1 TO: Michael Bowen California Coastal Conservancy Geotechnical & Earthquake Engineering Consultants CC: Eric Ginney Philip Williams & Associates PREPARED BY: Paul Grant SUBJECT:
TECHNICAL MEMORANDUM No. 1 TO: Michael Bowen California Coastal Conservancy Geotechnical & Earthquake Engineering Consultants CC: Eric Ginney Philip Williams & Associates PREPARED BY: Paul Grant SUBJECT:
PolyMet NorthMet Project
 RS 26 Draft-01 December 8, 2005 RS26 Partridge River Level 1 Rosgen Geomorphic Survey Rosgen Classification Partridge River from Headwaters to Colby Lake Prepared for PolyMet NorthMet Project December
The River Restoration Centre therrc.co.uk. Understanding Fluvial Processes: supporting River Restoration. Dr Jenny Mant
 The River Restoration Centre therrc.co.uk Understanding Fluvial Processes: supporting River Restoration Dr Jenny Mant Jenny@therrc.co.uk Understanding your catchment Hydrology Energy associated with the
Landscape Development
 Landscape Development Slopes Dominate Natural Landscapes Created by the interplay of tectonic and igneous activity and gradation Deformation and uplift Volcanic activity Agents of gradation Mass wasting
Final Report. Prepared for. American Rivers, California Trout, Friends of the River and Trout Unlimited
 A of the Potential Downstream Sediment Deposition Following the Removal of Iron Gate, Copco, and J.C. Boyle Dams, Klamath River, CA Final Report Prepared for American Rivers, California Trout, Friends
Stream Restoration and Environmental River Mechanics. Objectives. Pierre Y. Julien. 1. Peligre Dam in Haiti (deforestation)
") Stream Restoration and Environmental River Mechanics Pierre Y. Julien Malaysia 2004 Objectives Brief overview of environmental river mechanics and stream restoration: 1. Typical problems in environmental
Stream Restoration and Environmental River Mechanics Pierre Y. Julien Malaysia 2004 Objectives Brief overview of environmental river mechanics and stream restoration: 1. Typical problems in environmental
Laboratory Exercise #3 The Hydrologic Cycle and Running Water Processes
 Laboratory Exercise #3 The Hydrologic Cycle and Running Water Processes page - 1 Section A - The Hydrologic Cycle Figure 1 illustrates the hydrologic cycle which quantifies how water is cycled throughout
HAW CREEK, PIKE COUNTY, MISSOURI-TRIB TO SALT RIVER ERODING STREAM THREATHENING COUNTY ROAD #107, FOURTEEN FT TALL ERODING BANK WITHIN 4 FT OF THE
 HAW CREEK, PIKE COUNTY, MISSOURI-TRIB TO SALT RIVER ERODING STREAM THREATHENING COUNTY ROAD #107, FOURTEEN FT TALL ERODING BANK WITHIN 4 FT OF THE ROAD, PROJECT CONSTRUCTED IN 1 DAY, MARCH 10, 2009 BY
Natural Shoreline Landscapes on Michigan Inland Lakes
 Natural Shoreline Landscapes on Michigan Inland Lakes Excerpts from Chapters 2 and 3 Photo Photo by Jane by Jane Herbert Herbert Did you know? Twenty-four species of amphibians, 25 species of reptiles,
!"#$%&&'()*+#$%(,-./0*)%(!
*+#$%(,-./0*)%(!") 8:30 Sign in Hoosic River Revival Coalition!"#$%&&'()*+#$%(,-./0*)%(! 12-#30+4/#"5-(60 9:00 Welcome and Introductions 9:15 Goals for Today s Program: A Description of the Planning Process 9:30 First Session:
8:30 Sign in Hoosic River Revival Coalition!"#$%&&'()*+#$%(,-./0*)%(! 12-#30+4/#"5-(60 9:00 Welcome and Introductions 9:15 Goals for Today s Program: A Description of the Planning Process 9:30 First Session:
A GEOMORPHOLOGICAL APPROACH TO RESTORATION OF INCISED RIVERS. David L. Rosgen 1
 Proceedings of the Conference on Management of Landscapes Disturbed by Channel Incision, 1997 S.S.Y. Wang, E.J. Langendoen and F.D. Shields, Jr. (eds.) ISBN 0-937099-05-8 A GEOMORPHOLOGICAL APPROACH TO
National Hydrology committee of Afghanistan (NHCA) Sedimentation in Reservoire
 Sedimentation in Reservoire") National Hydrology committee of Afghanistan (NHCA) Sedimentation in Reservoire OCt.2007 Prof. Mohammad Qasem Seddeqy KPU بسم االله الرحمن الرحيم وجعلنامن الماءکل شي ء حی 30 واز ا ب هر چيزی رازنده گردانيدیم
National Hydrology committee of Afghanistan (NHCA) Sedimentation in Reservoire OCt.2007 Prof. Mohammad Qasem Seddeqy KPU بسم االله الرحمن الرحيم وجعلنامن الماءکل شي ء حی 30 واز ا ب هر چيزی رازنده گردانيدیم
Conceptual Model of Stream Flow Processes for the Russian River Watershed. Chris Farrar
 Conceptual Model of Stream Flow Processes for the Russian River Watershed Chris Farrar Several features of creeks affect the interactions between surface and groundwater. This conceptual model uses the
Waterbury Dam Disturbance Mike Fitzgerald Devin Rowland
 Waterbury Dam Disturbance Mike Fitzgerald Devin Rowland Abstract The Waterbury Dam was completed in October 1938 as a method of flood control in the Winooski Valley. The construction began in April1935
Sediment Transport Analysis for Stream Restoration Design: The Good, the Bad, and the Ugly.
 Sediment Transport Analysis for Stream Restoration Design: The Good, the Bad, and the Ugly. Brett Jordan Phd, PE HydroGeo Designs LLC. Land and Water Services Inc. THE GOOD THE BAD THE UGLY THE GOOD THE
Implementing a Project with 319 Funds: The Spring Brook Meander Project. Leslie A. Berns
 Implementing a Project with 319 Funds: The Spring Brook Meander Project Leslie A. Berns "...to acquire... and hold lands... for the purpose of protecting and preserving the flora, fauna and scenic beauties...
Legacy Sediment in the Piedmont: Past valley aggradation, modern stream erosion, and implications for stream water quality
 Funding provided by grants from: NC WRRI (Grant # 2010-70254), Geological Society of America, Sigma Xi, and NCSU Undergrad Research funds Legacy Sediment in the Piedmont: Past valley aggradation, modern