IMPLEMENTATION OF A BATHYMETRY DATABASE FOR GEOSCIENCE AUSTRALIA
|
|
|
- Jeffry Higgins
- 5 years ago
- Views:
Transcription
1 IMPLEMENTATION OF A BATHYMETRY DATABASE FOR GEOSCIENCE AUSTRALIA FELLINGER Christian & KRUIMEL Daniel, CARIS Asia Pacific, Suite 1 Innovation House, Mawson Lakes Boulevard, Mawson Lakes, SA, Australia SPINOCCIA Michele, Geoscience Australia, Cnr Jerrabomberra Ave and Hindmarsh Drive, Symonston, ACT, Australia ABSTRACT Geoscience Australia (GA) is a world leader in providing first class geoscientific information and knowledge. This contributes to enhanced economic, social and environmental benefits to the community by providing input for decisions that impact upon resource use, management of the environment, and the safety and well-being of Australians. The Energy Division of GA is responsible for the management of bathymetry data from Australian Territorial waters and from a multitude of sources. There are a number of challenges in managing and interacting with data collected through different methods, with varying file sizes, accuracy and resolutions. To address these challenges, a new data management capability is required. GA commenced the task of implementing a relational database for managing its extensive bathymetry data. This task included dedicated on-site support to streamline workflows and the establishment of sound standard operating procedures in order to maximise the benefits of the new system. GA, with the support of CARIS, established a functional relational database. The Energy Division is now able to maintain their datasets in a secure, central database repository. The division has improved data discoverability with the availability of an extensive metadata catalogue. Data analysis capabilities have also been enhanced, including the ability to compare overlapping data collected through different platforms at given points in time. There is also an increased capability to efficiently provide data to other sections within GA. The new bathymetry database solution has provided GA's Energy Division with improved capabilities to manage and interact with their bathymetry data and share the data with other users at GA. GA & CARIS will continue to work closely together to ensure their mutual solutions meet the growing demands for the future management of bathymetry data. 1 INTRODUCTION Geoscience Australia is custodian of the geographic and geological data and knowledge of the nation, along with co-custodian of the largest collection of single and multibeam bathymetry data in the Australian territorial waters. As an Australian government agency within the Department of Resources, Energy and Tourism, GA is responsible for geoscientific research.
2 2 GEOSCIENCE AUSTRALIA OVERVIEW GA's role is to provide geoscientific information and knowledge which enables government and the community to make informed decisions about: the exploitation of resources the management of the environment the safety of critical infrastructure; and the resultant wellbeing of all Australians GA's activities can be divided into three sectors; onshore, offshore and spatial information. Onshore activities focus on enhancing mineral exploration and environmental land-use planning. This is achieved through the production of geoscience maps, databases and information systems, as well as conducting research into regional geological and mineral systems. More widely, onshore activities also contribute to safer communities and critical infrastructure along with the maintenance of fundamental gravity, geomagnetic and seismic networks Offshore activities focus on providing pre-competitive data and information to assist in identifying new prospective basins for petroleum exploration and the geological storage of carbon dioxide, within Australia's offshore jurisdiction. Activities also include mapping and documentation of Australia's maritime boundaries, studies of the marine environment using seabed mapping techniques and determining estuarine water quality and health. These studies assist in natural resource management. Spatial information activities focus on providing key spatial information of Australia with an emphasis on response to rapid and slow onset hazards, the detection of change, emergency management requirements, natural risk assessment and marine zone management. Furthermore, activities also include the coordination and implementation of the Australian Government's policy on spatial data access and pricing. Within GA s Energy Division, the Geophysical Analysis and Data Access project is responsible for the acquisition, processing and management of bathymetric data. 2.1 SURVEYS AND EQUIPMENT With over 325 surveys in their holdings, GA/GADA is co-custodian of the largest collection of single and multibeam bathymetric data in Australian territorial waters. These surveys have been acquired by a total of 43 vessels using a variety of bathymetric systems. The surveys can be roughly divided into three categories: 12 khz: For use in deep water (100m - 11km), EM120 (Vessels L'Atalante, Sonne, Roger Revelle) 30 khz: Intermediate depth systems (10m - 5km), EM300 (Vessels Southern Surveyor, Tangaroa) (see Figure2-1) 300 khz: Shallow water system (0.5m - 200m), EM3002D (transportable system used on vessels such as RV Challenger, Kimbla and the Australian Institute of Marine Science Vessel Solander) (see Figure2-2, Figure2-3) Figure 2-4 and Figure 2-5 show the distribution of surveys between the various platforms. As can be seen, the RV Southern Surveyor accounts for nearly one third of the total surveys. In total there have been 325 multibeam swath surveys, 315 of which have been converted into a single platform. The remaining surveys are from different sources and are of varying quality and have yet to be processed. In terms of file size, the surveys equate to 5.11 terabytes of the CARIS HDCS data structure, which includes a copy of the raw data. There are 1,422,378 line kilometres of data, containing billion beams, and over 2 billion edited beams. The data covers an area


.")
3 of 10,599,967 square kilometres in and around Australian waters. Fifteen percent of the Australian Exclusive Economic Zone is covered. An overview of these surveys are shown in Figure2-6). Figure 2-1: EM300 System Figure 2-2: EM3002D System Figure 2-3: The Southern Surveyor


4 Figure 2-4: Pie Graph of Surveys per vessel Figure 2-5: Tabular representation of Surveys per vessel

5 Figure 2-6: Geoscience Australia's Data Holdings over 2009 (250m bathymetric grid) 3 DATA MANAGEMENT With such a large amount of data from a variety of different sources, the challenge for GA was to convert all of these surveys into a single platform and be able to efficiently manage the data. Historically, the data has been archived on hard drives. A custom built HTML web browser was developed to provide a graphical interface to locate surveys. The user could enter a coordinate to discover what survey(s) existed at that location, with a reference to where the data was stored. GA wanted to improve their data management beyond this capability through the implementation of a database solution. 3.1 IMPLEMENTING THE DATABASE GA chose the CARIS Bathy DataBASE solution to assist them in their challenge of better managing such vast quantities of bathymetric data. The solution is comprised of both a client and server component. At the back end, the server application is running on a high specification PC, utilizing PostgreSQL as the relational database management system. The client application (BASE Manager) is used to compile and validate bathymetric information (both internal and external) so that it can be loaded into the database with a fully customizable and extendable metadata catalogue. Figure 3-1 shows an example of the metadata for one of GA's surveys. There are a number of S-57 type attributes, such as DRVAL1 and DRVAL2 to define the depth range value for the survey. GA have also added several of their own metadata fields, such as: The frequency and model of the sonar utilized for the survey: sonfrq and sonmod. The start and end port for the survey: porend and porsta The name of the vessel used for the survey: vesnam Fields highlighted in green in Figure 3-1 are mandatory attributes and must be populated for the survey to be loaded into the database. The management of this metadata ensures that the

6 data is easily accessible to all internal and external stakeholders through the use of structured database queries (e.g. find all surveys conducted in 2012 using a 12 khz sonar). Figure 3-1: Geoscience Australia customized metadata catalogue The use of batch scripts allow GA to batch load surveys into the database and automatically populate the attributes of each grid, saving time and eliminating the need to use the GUI. To assist with the implementation of the database solution, a senior technical consultant from CARIS HQ visited GA in a consultative capacity. Tasks undertaken included scheduling regular backups for the database, assistance in the construction of zone definition files (zdf), writing a script to automatically update zdf's and populating the database using the aforementioned batch scripts. 3.2 SURFACE OPERATIONS Two of the primary uses of BASE Manager by GA are to create and manage bathymetric grids from soundings and to compile and validate bathymetric data from multiple formats and sources. A number of surface functions are incorporated into the application to accomplish these tasks. It is often necessary to combine different bathymetric datasets into a seamless coverage, which can present many challenges as the data can be at different resolutions, with different coverages and varying levels of uncertainty. A number of deconfliction rules can be defined to determine which value is used in areas of overlap. Some commonly used rules include recent data (i.e. data that has the most recent collection date is favoured), least uncertainty (i.e. data that has the lowest level of uncertainty is favoured) and shoalest depth. Through the use of the deconfliction dialogue (see Figure 3-2), the user is given the power to define as many, or as few rules as needed for their requirements.
 and provided to GA as an XYZ format and subsequently loaded")

7 Figure 3-2: The Deconfliction Rule Wizard Figure 3-3 shows a surface that has been created from combining two surveys around Fraser Island. The first survey was collected in 2003 with a Reson Seabat 8101 (240 khz shallow water system) and provided to GA as an XYZ format and subsequently loaded into the database. The second survey was undertaken by GA in 2005 using an EM300 and loaded into the database as a CSAR file directly from HIPS. Figure 3-3: Combined surveys around Fraser Island The surface differencing tool has also been used to perform a comparison between the depth values of the two surveys (see Figure 3-4).

8 Figure 3-4: Difference surface of Fraser Island Surveys Both of these operations can be performed either locally on a desktop PC, or directly on the database to utilize the processing power of the server. 3.3 APPLICATION OF TIDES The BASE Manager client application has also been used to assist with the application of tides to surveys. Previously, a single tide station solution would be used for an entire survey, which could be problematic for surveys spanning over large or very long areas. BASE Manager was used to create and digitize tide zones (see Figure 3-5). This allowed GA to calculate load weighted estimates for tide in their surveys, providing much more accurate results (see Figure 3-5). As GA only use tide stations for surveys on or near the continental shelf, this could be taken into account in the zdf by defining an outer polygon that employs a zero tide rather than a weighted average from tide stations. These zdf files can also be used when processing raw survey data in the CARIS HIPS and SIPS application.

9 Figure 3-5: Digitized Tide Zones using BASE Manager
10 Figure 3-6: ZDF comparison using Tide Zones created in BASE Manager 3.4 CARIS SPATIAL ARCHIVE TECHNOLOGY To efficiently manage the increasing file sizes of modern day bathymetric data, CARIS redeveloped its data structures for gridded and point data using the CARIS Spatial Archive (CSAR) framework. The CSAR framework was designed to efficiently read, write and process the large volumes of data produced by modern survey sensors and methods. The CSAR framework works by partitioning data into pieces, called "chunks". Each chunk is given a unique key that can be used to retrieve it from a storage device such as a file or database (Masry, Collins et al., 2008). The division of data into chunks allows the efficient storage and visualization of high volumes of multi-dimensional data. Both gridded and point CSAR data structures are stored at multiple levels of resolution to facilitate rapid access. With the multiresolution structure, the data in a dataset is always available, although it is not always displayed. For example, if viewing a surface that is zoomed out, the surface displayed will be a coarse representation of the surface, appearing smooth and generalized. This coarse display will always include the shoalest depths. As you zoom in, the appearance of the surface will change as higher resolution data is brought into view. At any point, if you were to make a selection of points on the surface, you would get the same results whether zoomed in or out.
11 Proceedings of the Shallow Survey 2012 Conference CSAR data structures are created with a coverage polygon representing the boundaries of the data. This polygon is accessible through the bounding polygon layer available when a CSAR dataset is opened. The polygon includes the outer boundary of all data. The polygon can be edited, redigitized or removed. In 2005, Geoscience Australia and the National Oceans Office undertook a join project to produced a consistent, high-quality 9 arc second (approximately 250m at the equator) bathymetric grid for Australian waters (Whiteway, T., 2009). An updated version of the grid was released in 2009 incorporating a number of new datasets to ensure the most up to date data is available. The final grid is provided in a number of different formats, including a grid in ASCII XYZ format. This is made up of 16 tiles, with each tile containing 4 parts. In total, the grid contains 665,547,201 data points. As a test, the grid was imported into Bathy DataBASE as a point cloud to see how the CSAR framework would cope with the immense file size. The resulting CSAR file is approximately 25.5 Gb in size, and can be seen in 2D plan view (see Figure 3-7), as well as in 3D view (see Figure 3-8). Point clouds can also be interrogated in Subset Editor, allowing the user to reject, re-accept and designate soundings where required (see Figure 3-9). Figure 3-7: 2D Plan view of the Australian Bathymetry and Topography Grid 2009


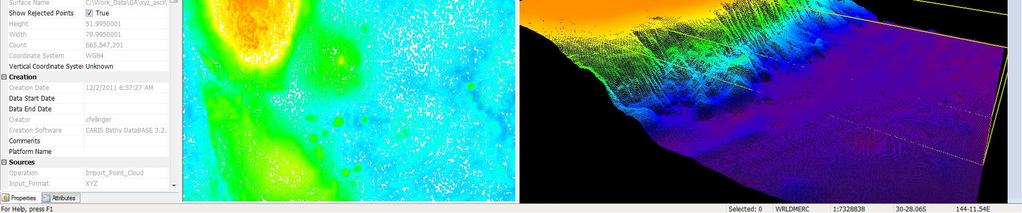
12 Figure 3-8: 3D view of the Australian Bathymetry and Topography Grid 2009 Figure 3-9: Australian Bathymetry and Topography Grid 2009 in Subset Editor
13 4 CONCLUSION By migrating to a database solution, Geoscience Australia has greatly improved its ability to manage its bathymetric data. Through the use of an extensible metadata catalogue, the data has been made much more discoverable and easy to locate. Note: Geoscience Australia does not promote or endorse any specific software developer or hardware manufacturer such as CARIS or Kongsberg. The material in this presentation has been put forward as a case study. REFERENCES Masry, M., Collins, C., 2008, Scaling Bathymetry: Data handling for large volumes Whiteway, T., 2009, Australian Bathymetry and Topography Grid, June 2009,
- West Africa. Abuja, Nigeria May Fredericton Canada Heeswijk The Netherlands Washington DC United States Adelaide Australia
 A Case Study in Land and Sea Data Interoperability Patricia GASPAR(Netherlands), Andrew HOGGARTH(Canade), Gordon JOHNSTON(UK), Charles de JONG(Netherlands) - West Africa Abuja, Nigeria - 6-10 May 2013
Spatial Data Availability Energizes Florida s Citizens
 NASCIO 2016 Recognition Awards Nomination Spatial Data Availability Energizes Florida s Citizens State of Florida Agency for State Technology & Department of Environmental Protection Category: ICT Innovations
Australia Government Geospatial Capacity Building Efforts in Asia and the Pacific. Dr John Dawson
 Australia Government Geospatial Capacity Building Efforts in Asia and the Pacific Dr John Dawson Presentation Overview About Geoscience Australia Examples of Geospatial Capacity Building Activity Geodesy
The Canadian Ceoscience Knowledge Network. - A Collaborative Effort for Unified Access to Ceoscience Data
 The Canadian Ceoscience Knowledge Network - A Collaborative Effort for Unified Access to Ceoscience Data The Canadian Geoscience Knowledge Network A Collaborative Effort for Unified Access to Geoscience
Geological Survey of Canada Lands and Minerals Sector Natural Resources Canada OneGeology, June 2018
 Geological Survey of Canada Lands and Minerals Sector Natural Resources Canada OneGeology, June 2018 Geological Survey of Canada Mission The Geological Survey of Canada provides public geoscience knowledge
The route towards a new GEBCO grid
 The route towards a new GEBCO grid Pauline Weatherall, GEBCO Digital Atlas Manager British Oceanographic Data Centre (BODC) GEBCO TSCOM/SCRUM meeting, Monaco, October 2012 The route towards a new GEBCO
DP Project Development Pvt. Ltd.
 Dear Sir/Madam, Greetings!!! Thanks for contacting DP Project Development for your training requirement. DP Project Development is leading professional training provider in GIS technologies and GIS application
DATA SOURCES AND INPUT IN GIS. By Prof. A. Balasubramanian Centre for Advanced Studies in Earth Science, University of Mysore, Mysore
 DATA SOURCES AND INPUT IN GIS By Prof. A. Balasubramanian Centre for Advanced Studies in Earth Science, University of Mysore, Mysore 1 1. GIS stands for 'Geographic Information System'. It is a computer-based
Efficiencies in Data Acquisition and Transformation
 Efficiencies in Data Acquisition and Transformation Andrew LEYZACK Canada Key words: Hydrography, IHO S-57, Nautical Chart SUMMARY For many hydrographic offices, the introduction of electronic nautical
Managing bathymetric data in a hydrographic survey company
 Managing bathymetric data in a hydrographic survey company Overview Brief Introduction to MMT How MMT use GIS Why we need to manage bathy data The BIS Inputting Data to the BIS Using the BIS GIS Product
Road Ahead: Linear Referencing and UPDM
 Road Ahead: Linear Referencing and UPDM Esri European Petroleum GIS Conference November 7, 2014 Congress Centre, London Your Work Making a Difference ArcGIS Is Evolving Your GIS Is Becoming Part of an
Introduction to EMODnet
 Introduction to EMODnet Antonio Novellino Torino, 14-15 Ottobre 2015 What is EMODnet? Initiated by the European Commission in response to the EU Future Maritime Policy and Blue Growth, launched in June
A BASE SYSTEM FOR MICRO TRAFFIC SIMULATION USING THE GEOGRAPHICAL INFORMATION DATABASE
 A BASE SYSTEM FOR MICRO TRAFFIC SIMULATION USING THE GEOGRAPHICAL INFORMATION DATABASE Yan LI Ritsumeikan Asia Pacific University E-mail: yanli@apu.ac.jp 1 INTRODUCTION In the recent years, with the rapid
STATUS OF MARINE SPATIAL DATA INFRASTRUCTURE
 STATUS OF MARINE SPATIAL DATA INFRASTRUCTURE IN PACIFIC ISLAND COUNTRIES 26 th January, 2016 7 th IHO Marine Spatial Data Infrastructure Working Group Meeting Tokyo Sachindra Singh Senior Geospatial Systems
GIS for the Beginner on a Budget
 GIS for the Beginner on a Budget Andre C. Bally, RLA, GIS Coordinator, Harris County Public Infrastructure Department Engineering Division This presentation, GIS for Beginners on a Budget. will briefly
Desktop GIS for Geotechnical Engineering
 Desktop GIS for Geotechnical Engineering Satya Priya Deputy General Manager (Software) RMSI, A-7, Sector 16 NOIDA 201 301, UP, INDIA Tel: +91-120-2511102 Fax: +91-120-2510963 Email: Satya.Priya@rmsi.com
Bathymetric Attributed Grids (BAGs): Discovery of Marine Datasets and Geospatial Metadata Visualization
: Discovery of Marine Datasets and Geospatial Metadata Visualization") University of New Hampshire University of New Hampshire Scholars' Repository Center for Coastal and Ocean Mapping Center for Coastal and Ocean Mapping 2010 Bathymetric Attributed Grids (BAGs): Discovery
University of New Hampshire University of New Hampshire Scholars' Repository Center for Coastal and Ocean Mapping Center for Coastal and Ocean Mapping 2010 Bathymetric Attributed Grids (BAGs): Discovery
NOAA Nautical Charts and Coastal and Marine Spatial Planning. Meredith Westington Chief Geographer NOAA/NOS/Office of Coast Survey
 NOAA Nautical Charts and Coastal and Marine Spatial Planning Meredith Westington Chief Geographer NOAA/NOS/Office of Coast Survey Ocean Policy Task Force What is CMSP? A comprehensive, adaptive, integrated,
Information System as a Tool for Marine Spatial Planning The SmartSea Vision and a Prototype
 Information System as a Tool for Marine Spatial Planning The SmartSea Vision and a Prototype Ari Jolma Marine Research Centre Finnish Environment Institute May 10, 2017 ISESS 2017, Zadar, Croatia Contents
The AMGI project: A Brief Overview
 The AMGI project: A Brief Overview World Bank Group (Energy & Extractives Global Practice) GEEDR Francisco Igualada (figualada@worldbank.org) Presented by Ash Johnson, Geosoft Inc. The AMGI Project: Vision
Topographic Strategy National Topographic Office March 2015
 www.linz.govt.nz Topographic Strategy National Topographic Office March 2015 >> Foreword Topographic information is vital to understanding our country and its assets, and for supporting economic development.
ArcGIS. for Server. Understanding our World
 ArcGIS for Server Understanding our World ArcGIS for Server Create, Distribute, and Manage GIS Services You can use ArcGIS for Server to create services from your mapping and geographic information system
Spatially Enabled Society
 International Seminar on Land Administration Trends and Issues in Asia and the Pacific Region Spatially Enabled Society Abbas Rajabifard Vice Chair PCGIAP-WG3 Vice-President (President Elect), GSDI Association
CLICK HERE TO KNOW MORE
 CLICK HERE TO KNOW MORE GENERALIZATION OF TOPOGRAPHIC DATABASE FOR SERVING GEOSPATIAL DATA FOR MILITARY AND SOCIO-ECONOMIC TASKS IN VIETNAM Speaker: Lieutenant Colonel, Nguyen Dinh Minh GENERAL STAFF -
Management of Geological Information for Mining Sector Development and Investment Attraction Examples from Uganda and Tanzania
 Mineral Wealth Conference 2016 Kampala / Uganda Management of Geological Information for Mining Sector Development and Investment Attraction Examples from Uganda and Tanzania Andreas Barth 1, Andreas Knobloch
CHAPTER 22 GEOGRAPHIC INFORMATION SYSTEMS
 CHAPTER 22 GEOGRAPHIC INFORMATION SYSTEMS PURPOSE: This chapter establishes the administration and use of to improve the quality and accessibility of Department s spatial information and support graphical
Terje Pedersen Product Manager Software / Hydrography Hydroacoustics Division
 Terje Pedersen Product Manager Software / Hydrography Hydroacoustics Division WORLD CLASS through people, technology and dedication WORLD CLASS through people, technology and dedication 1 2 HYDROFEST 2005
The File Geodatabase API. Craig Gillgrass Lance Shipman
 The File Geodatabase API Craig Gillgrass Lance Shipman Schedule Cell phones and pagers Please complete the session survey we take your feedback very seriously! Overview File Geodatabase API - Introduction
Automated Seabed Mapping and Data Delivery in the Cloud
 Automated Seabed Mapping and Data Delivery in the Cloud London, 2nd November 2017 11/20/2017 1 2 WE CALL IT SEABED INTELLIGENCE Ocean Infinity are explorers. We go to unmapped locations to survey the seabed
GEOGRAPHIC INFORMATION SYSTEMS Session 8
 GEOGRAPHIC INFORMATION SYSTEMS Session 8 Introduction Geography underpins all activities associated with a census Census geography is essential to plan and manage fieldwork as well as to report results
A national 3D geological model of Denmark: Condensing more than 125 years of geological mapping
 A national 3D geological model of Denmark: Condensing more than 125 years of geological mapping Peter B.E. Sandersen Thomas Vangkilde-Pedersen Geological Survey of Denmark and Greenland Flemming Jørgensen
Pacific Islands Regional Maritime Boundaries Project
 Pacific Islands Regional Maritime Boundaries Project 31 st Star Conference, Nadi, FIJI 6-8 June 2016 Jens Kruger Head of Ocean & Coastal Geoscience Sector Andrick Lal Project Officer (Surveying) Emily
Integrating GIS and Traditional Databases with MapObjects Technology
 Danielle Berman Integrating GIS and Traditional Databases with MapObjects Technology The expanding presence of geographic information system (GIS) offices within organizations has helped to enhance the
NEW TOOLS TO IMPROVE DESKTOP SURVEYS
 NEW TOOLS TO IMPROVE DESKTOP SURVEYS Pablo Vengoechea (Telemediciones S.A.), Jorge O. García (Telemediciones S.A.), Email: Telemediciones S.A. / Cra. 46 94-17 Bogotá D.C.
Bathymetry Data and Models: Best Practices
 Bathymetry Data and Models: Best Practices Barry Eakins & Lisa Taylor The NOAA National Geophysical Data Center Over 600 data types - from the core of the Earth to the surface of the Sun NGDC Bathymetry
REPORT ON INVESTMENTS
 REPORT ON INVESTMENTS D.T2.3.3 Investments for technical equipment for the implementation of Web-GIS platform in Mantova 1 Local support group designing Mantova Web-GIS platform. Picture by Maria Giulia
INTRODUCTION TO GEOGRAPHIC INFORMATION SYSTEM By Reshma H. Patil
 INTRODUCTION TO GEOGRAPHIC INFORMATION SYSTEM By Reshma H. Patil ABSTRACT:- The geographical information system (GIS) is Computer system for capturing, storing, querying analyzing, and displaying geospatial
Applied Geoscience and Technology Division SOPAC. Joy Papao, Risk Information Systems Officer
 Joy Papao, Risk Information Systems Officer Secretariat of the Pacific Community SPC 22 Pacific Island States Head office in Noumea, New Caledonia 2 Regional offices (Pohnpei and Honiara) 600 staff 9 Technical
Geological information for Europe : Towards a pan-european Geological Data Infrastructure
 Geological information for Europe : Towards a pan-european Geological Data Infrastructure Integrating geoscientific information for EU competitiveness Co-funded by the European Union European societal
EMMA : ECDC Mapping and Multilayer Analysis A GIS enterprise solution to EU agency. Sharing experience and learning from the others
 EMMA : ECDC Mapping and Multilayer Analysis A GIS enterprise solution to EU agency. Sharing experience and learning from the others Lorenzo De Simone, GIS Expert/ EMMA Project Manager 2014 GIS Workshop,
Topographic Mapping in Australia: The Future State
 Topographic ping in Australia: The Future State Context Australia s geography and demography Greg Scott Group Leader National ping & Information Group Chair Permanent Committee for Topographic Information
Offshore Operations and Project Execution Geophysical Site Surveys
 Offshore Operations and Project Execution Geophysical Site Surveys Chris Almond Senior Geophysicist Fugro Survey Limited 22/04/2015 Presentation Summary: Office-based Personnel Project Awarded Pre Offshore
GIS-T 2010 Building a Successful Geospatial Data Sharing Framework: A Ohio DOT Success Story
 GIS-T 2010 Building a Successful Geospatial Data Sharing Framework: A Ohio DOT Success Story ODOT District 2 GIS John Puente District 1 GIS Coordinator\ Planning Administrator 2 Interoperability 3 District
Outline Brief Overview MapPlace Website Data Delivery & Map Themes Digital Geology
 BRITISH COLUMBIA GEOLOGICAL SURVEY Kirk Hancock Pat Desjardins Nick Massey BRITISH COLUMBIA Ministry of Energy and Mines Ward Kilby acknowledged developer of MapPlace Outline Brief Overview MapPlace Website
Leveraging Web GIS: An Introduction to the ArcGIS portal
 Leveraging Web GIS: An Introduction to the ArcGIS portal Derek Law Product Management DLaw@esri.com Agenda Web GIS pattern Product overview Installation and deployment Configuration options Security options
DRAFT PROGRAM Registration of participants, welcome coffee, exhibition tour
 DRAFT PROGRAM 20 Feb 2018 09.00-10.00 Registration of participants, welcome coffee, exhibition tour 10.00 12.00 ROUND TABLE: INTERNATIONAL COOPERATION IN THE ARCTIC PROJECTS: CHALLENGES AND OPPORTUNITIES
Bentley Map Advancing GIS for the World s Infrastructure
 Bentley Map Advancing GIS for the World s Infrastructure Presentation Overview Why would you need Bentley Map? What is Bentley Map? Where is Bentley Map Used? Why would you need Bentley Map? Because your
EEOS 381 -Spatial Databases and GIS Applications
 EEOS 381 -Spatial Databases and GIS Applications Lecture 5 Geodatabases What is a Geodatabase? Geographic Database ESRI-coined term A standard RDBMS that stores and manages geographic data A modern object-relational
Options in Capacity Building. Underpinning the Blue Economy. Slide 1/78. Derrick R. Peyton. 14 th MACHC Meeting. IIC Technologies. December 9-13, 2013
 Options in Capacity Building Underpinning the Blue Economy Derrick R. Peyton IIC Technologies 14 th MACHC Meeting December 9-13, 2013 Slide 1/78 Overview Blue Economy Defined Challenges (SDI, MSDI, Standards)
2015 NYS Geospatial Applications Awards Competition Entry Form
 2015 NYS Geospatial Applications Awards Competition Entry Form Please use the below template to submit your entry for the 2015 NYS Geospatial Applications Awards Competition. By entering the competition,
GIS Geographical Information Systems. GIS Management
 GIS Geographical Information Systems GIS Management Difficulties on establishing a GIS Funding GIS Determining Project Standards Data Gathering Map Development Recruiting GIS Professionals Educating Staff
Reprint of article that appeared in Hydro INTERNATIONAL November 2006 Volume 10 Issue 9
 Reprint of article that appeared in Hydro INTERNATIONAL November 2006 Volume 10 Issue 9 While Google Earth is the best known 3D web-mapping viewer currently in the public domain, there are alternative
Oregon Department of Transportation. Geographic Information Systems Strategic Plan
 Oregon Department of Transportation Geographic Information Systems Strategic Plan Adopted May, 2000 By the GIS Steering Committee Last printed 10/2/2012 4:20:00 PM Page Geographic Information Systems Strategic
USGS Hydrography Overview. May 9, 2018
 + 1 USGS Hydrography Overview May 9, 2018 + 2 The National Geospatial Program Provides the geospatial baseline of the Nation s topography, natural landscape and built environment through The National Map,
You are Building Your Organization s Geographic Knowledge
 You are Building Your Organization s Geographic Knowledge And Increasingly Making it Available Sharing Data Publishing Maps and Geo-Apps Developing Collaborative Approaches Citizens Knowledge Workers Analysts
Analysis of Regional Fundamental Datasets Questionnaire
 Permanent Committee on GIS Infrastructure for Asia and the Pacific Working Group 2 Regional Fundamental Data Summary Report on Analysis of Regional Fundamental Datasets Questionnaire ABBAS RAJABIFARD and
Large Scale Mapping Policy for the Province of Nova Scotia
 Large Scale Mapping Policy for the Province of Nova Scotia December, 2005 Version 1.0 TABLE OF CONTENTS PAGE BACKGROUND...3 POLICY...5 Policy 1.0 Large Scale Mapping Program...5 Policy 2.0 Service Offering...5
AUTOMATED METERED WATER CONSUMPTION ANALYSIS
 AUTOMATED METERED WATER CONSUMPTION ANALYSIS Shane Zhong 1, Nick Turich 1, Patrick Hayde 1 1. Treatment and Network Planning, SA Water, Adelaide, SA, Australia ABSTRACT Water utilities collect and store
Integration Activities in Indonesia: The Integration of Land and Marine Spatial Data Sets as Part of Indonesian SDI Development
 Integration Activities in Indonesia: The Integration of Land and Marine Spatial Data Sets as Part of Indonesian SDI Development M. Arief Syafi i National Coordination Agency for Surveys and Mapping (B
a system for input, storage, manipulation, and output of geographic information. GIS combines software with hardware,
 Introduction to GIS Dr. Pranjit Kr. Sarma Assistant Professor Department of Geography Mangaldi College Mobile: +91 94357 04398 What is a GIS a system for input, storage, manipulation, and output of geographic
ISO Series Standards in a Model Driven Architecture for Landmanagement. Jürgen Ebbinghaus, AED-SICAD
 ISO 19100 Series Standards in a Model Driven Architecture for Landmanagement Jürgen Ebbinghaus, AED-SICAD 29.10.2003 The Company 100% SIEMENS PTD SIEMENS Business Services Shareholder & Strategic Business
Statewide Topographic Mapping Program
 Statewide Topographic Mapping Program February 28, 2018 www.dotd.la.gov Outline Purpose of the Statewide Topographic Mapping Program History Breakdown of R.S. 48:36 - Topographic Mapping Statewide Topographic
Introduction to ArcGIS Server Development
 Introduction to ArcGIS Server Development Kevin Deege,, Rob Burke, Kelly Hutchins, and Sathya Prasad ESRI Developer Summit 2008 1 Schedule Introduction to ArcGIS Server Rob and Kevin Questions Break 2:15
MARINE SPATIAL PLANNING & MARINE CADASTRE: CHALLENGES AND ISSUES
 MARINE SPATIAL PLANNING & MARINE CADASTRE: CHALLENGES AND ISSUES Roger Longhorn Secretary General, GSDI Association rlonghorn@gsdi.org Member, IHO Marine SDI Working Group ral@alum.mit.edu Member, UNESCO
Overview. Everywhere. Over everything.
 Cadenza Desktop Cadenza Web Cadenza Mobile Cadenza Overview. Everywhere. Over everything. The ultimate GIS and reporting suite. Provide, analyze and report data efficiently. For desktop, web and mobile.
One platform for desktop, web and mobile
 One platform for desktop, web and mobile Search and filter Get access to all data thematically filter data in context factually and spatially as well as display it dynamically. Export a selection or send
Integrating information, HPC and organisations for Earth Science innovation
 Integrating information, HPC and organisations for Earth Science innovation Dr Robert Woodcock Exploration and Mining Lesley Wyborn Geoscience Australia The Components of Auscope AuScope Infrastructure
Geoíndex: a public data dissemination service from the IGC. Geoíndex IGC Team Reporter: Carme Puig
 Geoíndex: a public data dissemination service from the IGC Geoíndex IGC Team Reporter: Carme Puig 2 Brief IGC introduction The IGC was created through the Law 19/2005 of the Catalan Parliament. The IGC
A Spatial Data Infrastructure for Landslides and Floods in Italy
 V Convegno Nazionale del Gruppo GIT Grottaminarda 14 16 giugno 2010 A Spatial Data Infrastructure for Landslides and Floods in Italy Ivan Marchesini, Vinicio Balducci, Gabriele Tonelli, Mauro Rossi, Fausto
Working with ArcGIS Online
 Esri International User Conference San Diego, CA Technical Workshops July 12, 2011 Working with ArcGIS Online Bern Szukalski, Deane Kensok Topics for this Session ArcGIS Online Overview ArcGIS Online Content
Among various open-source GIS programs, QGIS can be the best suitable option which can be used across partners for reasons outlined below.
 Comparison of Geographic Information Systems (GIS) software As of January 2018, WHO has reached an agreement with ESRI (an international supplier of GIS software) for an unlimited use of ArcGIS Desktop
indigeo Consultants Pvt Ltd Geophysical Surveys Geological Surveys GIS & Data Solutions Image Processing indigeo Company Profile, Page 1
 indigeo Consultants Pvt Ltd Geophysical Surveys Geological Surveys GIS & Data Solutions Image Processing MM Corner, 3 rd Floor #58, Banaswadi Main Road Bangalore 560033 INDIA Ph: +91 80 41638310 Mob: +91
Overview of Geospatial Open Source Software which is Robust, Feature Rich and Standards Compliant
 Overview of Geospatial Open Source Software which is Robust, Feature Rich and Standards Compliant Cameron SHORTER, Australia Key words: Open Source Geospatial Foundation, OSGeo, Open Standards, Open Geospatial
Drillworks. DecisionSpace Geomechanics DATA SHEET
 DATA SHEET Drillworks overview DecisionSpace Geomechanics Key features Pre-drill, real-time, and post-drill analyses are all easily performed in one application using the latest data from across the field
Bathymetry. EMODnet Stakeholder Conference & Sea-basin Workshops February Bathymetry
 EMODnet Stakeholder Conference & Sea-basin Workshops 14-15 February 2017 Arctic checkpoint Belinda Kater On behalf of all Checkpoints http://www.emodnet.eu 1 ? is the study of the "beds" or "floors" of
Pan American Institute of Geography and History. 12th MACHC 5-9 December 2011
 Pan American Institute of Geography and History 12th MACHC 5-9 December 2011 1 PAIGH Mission and Objectives To encourage, coordinate, and publicize cartographical, geographical, geophysical and historical
The Challenge of Geospatial Big Data Analysis
 288 POSTERS The Challenge of Geospatial Big Data Analysis Authors - Teerayut Horanont, University of Tokyo, Japan - Apichon Witayangkurn, University of Tokyo, Japan - Shibasaki Ryosuke, University of Tokyo,
Introduction of the Asia-Oceania Global Earth Observation System of Systems (AOGEOSS) GEO Initiative(GI-22 )
 GEO Initiative(GI-22 )") Introduction of the Asia-Oceania Global Earth Observation System of Systems (AOGEOSS) GEO Initiative(GI-22 ) Prof. Xiang ZHOU Institute of Remote Sensing and Digital Earth, CAS 11 May 2017 Kunming, China
Introduction of the Asia-Oceania Global Earth Observation System of Systems (AOGEOSS) GEO Initiative(GI-22 ) Prof. Xiang ZHOU Institute of Remote Sensing and Digital Earth, CAS 11 May 2017 Kunming, China
USING GIS IN WATER SUPPLY AND SEWER MODELLING AND MANAGEMENT
 USING GIS IN WATER SUPPLY AND SEWER MODELLING AND MANAGEMENT HENRIETTE TAMAŠAUSKAS*, L.C. LARSEN, O. MARK DHI Water and Environment, Agern Allé 5 2970 Hørsholm, Denmark *Corresponding author, e-mail: htt@dhigroup.com
NOAA Surface Weather Program
 NOAA Surface Weather Program Maintenance Decision Support System Stakeholder Meeting #9 Jim O Sullivan NOAA Surface Weather Program Manager NWS Office of Climate, Water, and Weather Services September
Introduction. Elevation Data Strategy. Status and Next Steps
 1 2 Introduction Elevation Data Strategy Status and Next Steps 3 Canada is the 2nd largest country in the world - 9.9 million sq km Surrounded by 3 oceans with 202 000 km of coastline Population over 35
SPATIAL INFORMATION GRID AND ITS APPLICATION IN GEOLOGICAL SURVEY
 SPATIAL INFORMATION GRID AND ITS APPLICATION IN GEOLOGICAL SURVEY K. T. He a, b, Y. Tang a, W. X. Yu a a School of Electronic Science and Engineering, National University of Defense Technology, Changsha,
Future Ocean Floor Mapping: Ocean Stewardship & Initial Industry Contributions. U.S Hydro Galveston, TX March 23, 2017 David Millar - Fugro
 Future Ocean Floor Mapping: Ocean Stewardship & Initial Industry Contributions U.S Hydro 2017 - Galveston, TX March 23, 2017 David Millar - Fugro Presentation Outline The Need for Ocean Mapping GEBCO GEBCO
GIS-Based Sediment Quality Database for the St. Louis River Area of Concern (AOC): Overview Presentations and Demonstration
: Overview Presentations and Demonstration") GIS-Based Sediment Quality Database for the St. Louis River Area of Concern (AOC): Overview Presentations and Demonstration Judy L. Crane 1 and Dawn E. Smorong 2 1 Minnesota Pollution Control Agency, St.
GIS-Based Sediment Quality Database for the St. Louis River Area of Concern (AOC): Overview Presentations and Demonstration Judy L. Crane 1 and Dawn E. Smorong 2 1 Minnesota Pollution Control Agency, St.
Land-Line Technical information leaflet
 Land-Line Technical information leaflet The product Land-Line is comprehensive and accurate large-scale digital mapping available for Great Britain. It comprises nearly 229 000 separate map tiles of data
Canadian Board of Examiners for Professional Surveyors Core Syllabus Item C 5: GEOSPATIAL INFORMATION SYSTEMS
 Study Guide: Canadian Board of Examiners for Professional Surveyors Core Syllabus Item C 5: GEOSPATIAL INFORMATION SYSTEMS This guide presents some study questions with specific referral to the essential
These modules are covered with a brief information and practical in ArcGIS Software and open source software also like QGIS, ILWIS.
 Online GIS Training and training modules covered are: 1. ArcGIS, Analysis, Fundamentals and Implementation 2. ArcGIS Web Data Sharing 3. ArcGIS for Desktop 4. ArcGIS for Server These modules are covered
Time Series Analysis with SAR & Optical Satellite Data
 Time Series Analysis with SAR & Optical Satellite Data Thomas Bahr ESRI European User Conference Thursday October 2015 harris.com Motivation Changes in land surface characteristics mirror a multitude of
Collaborative Geotechnical BIM technologies. Carl Grice Software Development Director (Keynetix) Holger Kessler - Team Leader Modelling Systems (BGS)
 Holger Kessler - Team Leader Modelling Systems (BGS)") Collaborative Geotechnical BIM technologies Carl Grice Software Development Director (Keynetix) Holger Kessler - Team Leader Modelling Systems (BGS) 1 2 3 Current Challenges R&D Project Proposed Solution
Collaborative Geotechnical BIM technologies Carl Grice Software Development Director (Keynetix) Holger Kessler - Team Leader Modelling Systems (BGS) 1 2 3 Current Challenges R&D Project Proposed Solution
Reducing Complex Spatial Data Management Needs in and Upstream Oil and Gas Operations Team. Jason Wilson GIS Business Analyst SM Energy
 Reducing Complex Spatial Data Management Needs in and Upstream Oil and Gas Operations Team Jason Wilson GIS Business Analyst SM Energy Agenda About Myself and SM Energy The Challenge The Goal Solution
STEREO ANALYST FOR ERDAS IMAGINE Stereo Feature Collection for the GIS Professional
 STEREO ANALYST FOR ERDAS IMAGINE Stereo Feature Collection for the GIS Professional STEREO ANALYST FOR ERDAS IMAGINE Has Your GIS Gone Flat? Hexagon Geospatial takes three-dimensional geographic imaging
Data Aggregation with InfraWorks and ArcGIS for Visualization, Analysis, and Planning
 Data Aggregation with InfraWorks and ArcGIS for Visualization, Analysis, and Planning Stephen Brockwell President, Brockwell IT Consulting, Inc. Join the conversation #AU2017 KEYWORD Class Summary Silos
G EOSPAT I A L ERDAS IMAGINE. The world s most widely-used software package for creating information from geospatial data
 G EOSPAT I A L ERDAS IMAGINE The world s most widely-used software package for creating information from geospatial data ERDAS IMAGINE Geographic imaging professionals need to process vast amounts of
Creation of an Internet Based Indiana Water Quality Atlas (IWQA)
") Department of Environmental Management Creation of an Internet Based Water Quality Atlas (IWQA) May 4, 2005 IUPUI 1200 Waterway Blvd., Suite 100 polis, 46202-5140 Water Quality Atlas John Buechler, Neil
Department of Environmental Management Creation of an Internet Based Water Quality Atlas (IWQA) May 4, 2005 IUPUI 1200 Waterway Blvd., Suite 100 polis, 46202-5140 Water Quality Atlas John Buechler, Neil
4. GIS Implementation of the TxDOT Hydrology Extensions
 4. GIS Implementation of the TxDOT Hydrology Extensions A Geographic Information System (GIS) is a computer-assisted system for the capture, storage, retrieval, analysis and display of spatial data. It
The SAB Medium Term Sales Forecasting System : From Data to Planning Information. Kenneth Carden SAB : Beer Division Planning
 The SAB Medium Term Sales Forecasting System : From Data to Planning Information Kenneth Carden SAB : Beer Division Planning Planning in Beer Division F Operational planning = what, when, where & how F
Basics of GIS reviewed
 Basics of GIS reviewed Martin Breunig Karlsruhe Institute of Technology martin.breunig@kit.edu GEODETIC INSTITUTE, DEPARTMENT OF CIVIL ENGINEERING, GEO AND ENVIRONMENTAL SCIENCES, CHAIR IN GEOINFORMATICS
Bridging the Gap between Engineering and GIS
 Bridging the Gap between Engineering and GIS Presented by: Karen Stewart, B.Tech, GISP Manager of Geomatics Township of Langley February 13, 2006 Agenda Introduction History Goals Implementation Benefits
Portal for ArcGIS: An Introduction. Catherine Hynes and Derek Law
 Portal for ArcGIS: An Introduction Catherine Hynes and Derek Law Agenda Web GIS pattern Product overview Installation and deployment Configuration options Security options and groups Portal for ArcGIS
Orbital Insight Energy: Oil Storage v5.1 Methodologies & Data Documentation
 Orbital Insight Energy: Oil Storage v5.1 Methodologies & Data Documentation Overview and Summary Orbital Insight Global Oil Storage leverages commercial satellite imagery, proprietary computer vision algorithms,