North Wales PRP for Wissahickon Creek Nutrients
|
|
|
- Jeffrey King
- 5 years ago
- Views:
Transcription
1 North Wales PRP for Wissahickon Creek Nutrients July 14, 2017 Revised September 7, 2017 Revised August 9, 2018 Prepared for: North Wales Borough 300 School Street North Wales, PA Corporate Headquarters 1456 Ferry Road, Bldg. 500 Doylestown, PA (215) Regional Office 2738 Rimrock Drive Stroudsburg, PA (570) Regional Office 559 Main Street, Suite 230 Bethlehem, PA (610)
2 TABLE OF CONTENTS INTRODUCTION... 1 PUBLIC PARTICIPATION... 1 MAPPING... 2 POLLUTANT OF CONCERN... 2 DETERMINE EXISTING LOAD... 2 REQUIRED REDUCTION IN POLLUTANT LOADING / BMP SELECTION... 3 FUNDING MECHANISMS... 4 IMPLEMENTATION... 4 OPERATIONS AND MAINTENANCE... 4 APPENDIX I APPENDIX II APPENDIX III MAPPING MS4 REQUIREMENTS TABLE PUBLIC NOTIFICATION / PUBLIC COMMENTS APPENDIX IV EXISTING LOAD CALCULATIONS / PARSED LOAD CALCULATIONS / EXISTING BMP LOAD REDUCTIONS CALCULATIONS / SUB BASIN LOAD CALCULATION APPENDIX V POLLUTANT LOAD REDUCTION REFERENCE M:\MS4s\PRP\PRP Data - North Wales - Wissahickon\Report - Wissahickon Creek\PRP-Wissahickon Creek-August 2018.docx
3 INTRODUCTION Permittees with coverage under a Municipal Separate Storm Sewer System (MS4) that discharge to certain impaired waters are required to implement Pollutant Reduction Plans (PRP) as specified in the Pennsylvania Department of Environmental Protection s (PA DEP) MS4 Requirements Table. The applicable section of the Requirements Table is included in Appendix I. The table requires North Wales Borough to develop a PRP for the Wissahickon Creek watershed for nutrients. Overall a five percent reduction in the current nutrient load is required. A PRP is a planning document prepared by the permittee which guides the selection and implementation of specific BMPs to reduce pollutant loading to surface waters. The objective of a PRP is to improve the condition of surface waters such that the waters eventually attain water quality standards and its designated and existing uses in accordance with 25 Pa. Code Chapter 93. The pollutant reducing BMPs are to be completed within 5 years of DEP s permit approval. PUBLIC PARTICIPATION The PA DEP requires public participation as part of the development of a PRP. The requirements for the public participation are: The permittee shall make a complete copy of the PRP available for public review. The permittee shall publish, in a newspaper of general circulation in the area, a public notice containing a statement describing the plan, where it may be reviewed by the public, and the length of time the permittee will provide for the receipt of comments. The permittee must accept written comments for a minimum of 30 days from the date of public notice. The permittee must accept comments from any interested member of the public at a public meeting or hearing, which may include a regularly scheduled meeting of the governing body of the municipality or municipal authority that is the permittee. The permittee shall consider and make a record of the consideration of each timely comment received from the public during the public comment period concerning the plan, identifying any changes made to the plan in response to the comment. Modified PRPs submitted to DEP must include a copy of the newspaper notice, a copy of all written comments received from the public and a copy of the permittee s record of consideration of all timely comments received in the public comment period. 1
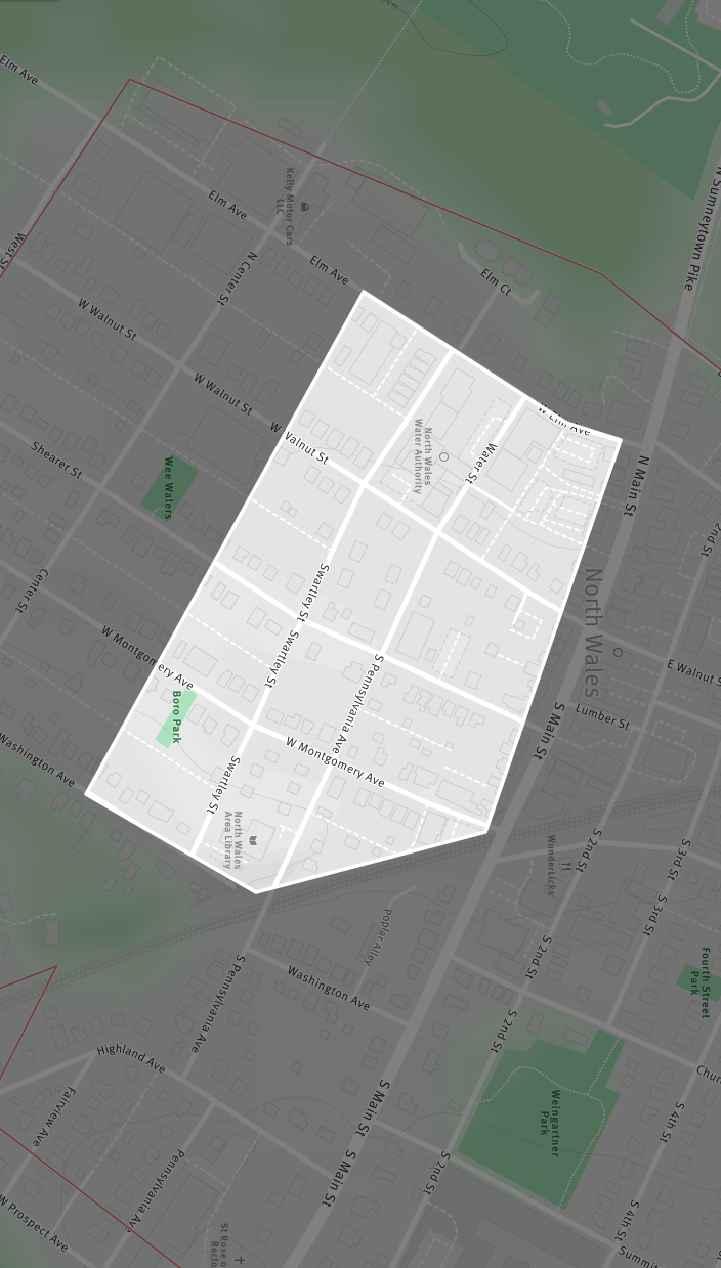
4 A complete copy of the PRP was available for public review at the municipal offices. A public notice was published in a local newspaper which included a description of the plan, where it could be reviewed, the 30-day comment period and the municipal meeting at which public comments would be received. Appendix II contains the public notification information. MAPPING Appendix III contains the PRP mapping for the borough. The appendix contains an overall map of the borough which includes the location of existing BMPs which can be used to reduce the WLA as well as parsed areas of the municipality. Separate maps of the stormwater drainage sub-basins within the borough which were used to calculate the potential nutrient reductions from potential BMPs are also included in Appendix III. POLLUTANT OF CONCERN The PA DEP MS4 Requirements Table specifies the pollutant of concern as nutrients. A minimum five percent reduction of nutrients (phosphorus) is required. DETERMINE EXISTING LOAD The Stroud Water Research Center Model My Watershed program was utilized to determine the watershed s land uses and loading rates. This information is compiled in Appendix IV on the Land Use Information and Pollutant Load Calculation table. The land use information is based on the current conditions in the watershed. Where recent land development has changed, the land use, as indicated in the Stroud program, differences are noted on the table. Seven areas of the borough were suitable for parsing. Tables calculating the parsed areas land uses are included in Appendix IV. The parsed area totals are included in the Land Use Information and Pollutant Load Calculation table. Mapping of the parsed areas is shown on the PRP Plan in Appendix III. The parse areas consist of non-municipally owned properties where stormwater flows out of the borough, into the neighboring township, without entering the North Wales stormwater system. The Land Use Information and Pollutant Load Calculation table also includes pollutant reduction for an existing BMP (North Wales Station) which reduces the 2
5 watershed s existing pollutant load. A spreadsheet calculating the net reduction from the existing BMP is included in Appendix IV. The overall calculated pollutant load for Wissahickon Creek is lbs/year of phosphorus. The PRP requires a five percent reduction in phosphorus. Therefore, the required phosphorus reduction is lbs/year. REQUIRED REDUCTION IN POLLUTANT LOADING / BMP SELECTION The borough was evaluated for the potential for phosphorus removal BMPs. This included retrofits of existing BMPs, such as older basin modifications and new projects such as stream restorations. When evaluating the potential BMPs the National Pollutant Discharge Elimination System (NPDES) Stormwater Discharges from Small Municipal Separate Storm Sewer Systems BMP Effectiveness Values and the Recommendations of the Expert Panel to Define Removal Rates for Urban Stormwater Retrofit Projects were used to determine the effectiveness of the proposed BMP. The built-out nature of the borough, as well as the lack of stormwater basins for potential modifications and few open channels due to past culverting, severely limits the ability of the borough to address the WLA. To determine the feasibility of addressing the WLA, five of the largest stormwater drainage sub-basins within the borough were mapped and the pollutant loads calculated. The sub-basins are designated D1 through D5. These sub-basins encompass the majority of the borough. Drainage from the sub-basins discharge separately to the surface along the northwest border of the borough. The outfalls are all located inside the borough near the municipal boundary or just within the adjoining township. Individual plans showing the stormwater drainage subareas are included in Appendix III. Treatment of the stormwater from one or more of the sub-basins is considered the best option for meeting the required pollutant load reductions. The chosen BMP would be installed near the sub-basin outfall within the borough limits, if possible. To document the potential to treat the required pollutant load, a table providing the pollutant load calculation for each of the sub-basins is included in Appendix IV. The table also includes pollutant removal rates in percentage (i.e. BMP Effectiveness Values) for a hypothetical BMP, in this case the removal rates for a Wet Ponds and Wetlands. This example shows that the required pollutant reduction can be addressed through a BMP associated with one or more of the outfalls. The pollutant removal rates or BMP Effectiveness Values were obtained from document 3800-PM-BCW0100m which is included in Appendix V. 3
6 Some stream channel restoration, associated with the outfalls for the above noted sub-basins, may also be undertaken although available channels are limited. In addition, the borough owns several properties in the neighboring Upper Gwynedd Township. These properties, mostly vacant land, were the location of the borough s former sewage treatment plant and are bisected by a stream. The use of these properties to treat stormwater is possible, however, additional study would be needed to confirm the effectiveness of BMP(s) on the properties. FUNDING MECHANISMS The borough will put money aside into their Capital Improvements Fund to pay for the proposed BMP(s). Grants, if available, may also be used to help fund the pollutant reduction measures. IMPLEMENTATION A minimum nutrient reduction of five percent is expected within the first permit term. If more than five percent is achieved, the excess would be considered credit towards additional reductions in the future, should it be required by the PA DEP. OPERATIONS AND MAINTENANCE The municipality will be responsible for operation and maintenance of the proposed BMP(s). As noted above, the example calculations show Wet Ponds and Wetlands could address the required pollutant reductions, however, other BMPs may also be appropriate. Complete operation and maintenance information will be included with specific plans for the chosen BMP(s). 4
7 APPENDIX I MS4 REQUIREMENTS TABLE
8 MS4 Name NPDES ID Individual Permit Required? Montgomery County NARBERTH BORO PAG No NEW HANOVER TWP PAG No NORRISTOWN BORO PAG No Reason Impaired Downstream Waters or Applicable TMDL Name Requirement(s) Other Cause(s) of Impairment East Branch Indian Creek Appendix C-PCB (5), Appendix E-Siltation (5) Cause Unknown (5), Other Habitat Alterations, Water/Flow Variability (4c) Gulley Run Water/Flow Variability (4c) Indian Creek Appendix C-PCB (5), Appendix E-Siltation (5) Cause Unknown (5), Other Habitat Alterations, Water/Flow Variability (4c) Cobbs Creek Appendix B-Pathogens (5), Appendix C-PCB (5), Appendix E- Siltation (5) Schuylkill River Schuylkill River Appendix C-PCB (4a) Appendix C-PCB (4a) Cause Unknown (5), Other Habitat Alterations, Water/Flow Variability (4c) Swamp Creek Appendix E-Siltation (5) Cause Unknown (5) Schuylkill River Appendix C-PCB (4a) Sawmill Run Appendix E-Siltation (5) Turbidity (5), Water/Flow Variability (4c) Schuylkill River PCB TMDL Appendix C-PCB (4a) Stony Creek Appendix E-Siltation (5) Turbidity (5), Water/Flow Variability (4c) Unnamed Tributaries to Stony Creek Cause Unknown (5) NORTH WALES BORO PAG Yes TMDL Plan PENNSBURG BORO PAG No PERKIOMEN TWP PAG No PLYMOUTH TWP PAG No POTTSTOWN BORO PAG No RED HILL BORO PAG No Wissahickon TMDL TMDL Plan-Siltation, Suspended Solids (4a) Cause Unknown (4a) Wissahickon Creek Appendix E-Nutrients (4a), Appendix B-Pathogens (5) Other Habitat Alterations, Water/Flow Variability (4c) Green Lane Reservoir Appendix E-Organic Enrichment/Low D.O. (4a) Unnamed Tributaries to Perkiomen Creek Appendix E-Siltation (5) Water/Flow Variability (4c) Schoolhouse Run Appendix E-Siltation (5) Perkiomen Creek Appendix B-Pathogens (5) Diamond Run Appendix E-Siltation (5) Water/Flow Variability (4c) Plymouth Creek Appendix E-Siltation (5) Water/Flow Variability (4c) Sawmill Run Appendix E-Siltation (5) Turbidity (5), Water/Flow Variability (4c) Schuylkill River Schuylkill River PCB TMDL Unnamed Tributaries to Manatawny Creek Schuylkill River Schuylkill River PCB TMDL Green Lane Reservoir Appendix C-PCB (4a) Appendix C-PCB (4a) Appendix E-Siltation (5) Appendix C-PCB (4a) Appendix C-PCB (4a) Appendix E-Organic Enrichment/Low D.O. (4a) Flow Alterations, Other Habitat Alterations (4c) Page 127 of 160 Revised 6/21/2017
9 APPENDIX II PUBLIC NOTIFICATION / PUBLIC COMMENTS
10 Wissahickon Creek, North Wales Borough Public Notification Notice is hereby given that North Wales Borough has prepared a Pollution Reduction Plan for nutrients and a TMDL plan for sediment for the Wissahickon Creek as required under the PA DEP MS4 program. The plans calculate pollutant loads and identifies strategies to reduce these loads by the prescribed amounts. The plans can be reviewed, and written comments accepted, at the municipal building located at 300 School Street, North Wales, PA during normal business hours. Comments will also be accepted at the Borough Council meeting on August 28 th, The 30-day public comment period extends from August 10, 2018 to September 9, 2018.
11 Public Notification The notification was published on August 10 th, 2018 in The Reporter, a local newspaper. This report will be updated with the proof of publication, any public comments and consideration of these comments when they are received. The updated information will also be forwarded to the PA DEP.
12 APPENDIX III MAPPING
13

14

15
16

17

18
19 APPENDIX IV EXISTING LOAD CALCULATIONS / PARSED LOAD CALCULATIONS / EXISTING BMP LOAD REDUCTIONS CALCULATIONS / SUB BASIN LOAD CALCULATION
20 Land Use Information and Pollutant Load Calculation Wissahickon Creek - North Wales Parsed Area (acres) Adjusted Area (acres) Nitrogen Loading Rate (lbs/acre/year) Nitrogen Load Phosphorus Loading Phosphorus Load Sediment Loading Rate (lbs/acre/year) Sediment Load Land Use Area (m 2 ) Area (acres) Barren Land (Rock/Sand/Clay) NA 0.0 NA 0.0 NA 0.0 Cultivated Crops NA 0.0 NA 0.0 NA 0.0 Deciduous Forest 65, , Developed, High Intensity 84, , , Developed, Low Intensity - Developed, Low Intensity (49% Impervious) 286, , , , Developed, Low Intensity (51% Pervious) 297, , , Developed, Medium Intensity - Developed, Medium Intensity (79% Impervious) 206, , , , Developed, Medium Intensity (21% Pervious) 55, , Developed, Open Space - Developed, Open Space (19% Impervious) 94, , , Developed, Open Space (81% Pervious) 403, , , Emergent Herbaceous Wetlands NA 0.0 NA 0.0 NA 0.0 Evergreen Forest NA 0.0 NA 0.0 NA 0.0 Grassland/Herbaceous NA 0.0 NA 0.0 NA 0.0 Mixed Forest NA 0.0 NA 0.0 NA 0.0 Open Water NA 0.0 NA 0.0 NA 0.0 Pasture/Hay NA 0.0 NA 0.0 NA 0.0 Perennial Ice/Snow NA 0.0 NA 0.0 NA 0.0 Shrub/Scrub NA 0.0 NA 0.0 NA 0.0 Woody Wetlands NA 0.0 NA 0.0 NA 0.0 Totals: 1,493, Total: Existing BMP Pollutant Reduction Reduced Existing Load Required Reduction: --- 5% --- Required Load Reduction : --- Required Load Reduction : Required Load Reduction : --- Notes: Existing BMP Pollutant Reduction based on qualifying, currently installed and maintained structural BMPs. See separate sheet(s) for calculation. Impairment for Nutrients, Excessive Algal Growth, Organic Enrichment / Low D.O. require a 5% Total Phosphorus reduction. Adjusted Developed Land Use - Take into account the National Land Cover Database from 2011: Developed, Open Space - 19% Impervious; Developed, Low Intensity - 49% Impervious; Developed, Medium Intensity - 79% Impervious; Developed, High Intensity - 100% Impervious Impervious developed land loading rates for nitrogen, phosphorus and sediment is 23.06, 2.28 and 1,839 lbs/acre/year, respectively. Pervious developed land loading rates for nitrogen, phosphorus and sediment is 20.72, 0.84 and lbs/acre/year, respectively. Undeveloped land (outside urbanized area) loading rates for nitrogen, phosphorus and sediment is 10, 0.33 and lbs/acre/year, respectively. Loading rates obtained from Attachment B - Developed Land Loading Rates for PA Counties (3800-PM-BCW0100k 5/2016). NA - Loading rate not applicable. The watershed does not have any of this type of Land Use. Land use areas obtained from the Stroud Water Research Center - Model My Watershed program.
21 Land Use Information and Pollutant Load Calculation Parse Area A - North Wales Borough - Wissahickon Creek Nitrogen Loading Rate (lbs/acre/year) Nitrogen Load Phosphorus Loading Phosphorus Load Sediment Loading Sediment Load Land Use Area (m 2 ) Area (acres) Barren Land (Rock/Sand/Clay) Cultivated Crops Deciduous Forest Developed, High Intensity 6, Developed, Low Intensity - Developed, Low Intensity (49% Impervious) Developed, Low Intensity (51% Pervious) Developed, Medium Intensity - Developed, Medium Intensity (79% Impervious) Developed, Medium Intensity (21% Pervious) Developed, Open Space - Developed, Open Space (19% Impervious) Developed, Open Space (81% Pervious) Emergent Herbaceous Wetlands Evergreen Forest Grassland/Herbaceous Mixed Forest Open Water Pasture/Hay Perennial Ice/Snow Shrub/Scrub Woody Wetlands Totals: 7, Total: Total: 1.74 Total: Notes: Adjusted Developed Land Use - Take into account the National Land Cover Database from 2011: Developed, Open Space - 19% Impervious; Developed, Low Intensity - 49% Impervious; Developed, Medium Intensity - 79% Impervious; Developed, High Intensity - 100% Impervious Impervious developed land loading rates for nitrogen, phosphorus and sediment is 23.06, 2.28 and 1,839 lbs/acre/year, respectively. Pervious developed land loading rates for nitrogen, phosphorus and sediment is 20.72, 0.84 and lbs/acre/year, respectively. Undeveloped land (outside urbanized area) loading rates for nitrogen, phosphorus and sediment is 10, 0.33 and lbs/acre/year, respectively. Loading rates obtained from Attachment B - Developed Land Loading Rates for PA Counties (3800-PM-BCW0100k 5/2016). Land use areas obtained from the Stroud Water Research Center - Model My Watershed program.
22 Land Use Information and Pollutant Load Calculation Parse Area B - North Wales Borough - Wissahickon Creek Nitrogen Loading Rate (lbs/acre/year) Nitrogen Load Phosphorus Loading Phosphorus Load Sediment Loading Sediment Load Land Use Area (m 2 ) Area (acres) Barren Land (Rock/Sand/Clay) Cultivated Crops Deciduous Forest 5, Developed, High Intensity 4, Developed, Low Intensity - Developed, Low Intensity (49% Impervious) 3, , Developed, Low Intensity (51% Pervious) 4, Developed, Medium Intensity - Developed, Medium Intensity (79% Impervious) 4, , Developed, Medium Intensity (21% Pervious) 1, Developed, Open Space - Developed, Open Space (19% Impervious) Developed, Open Space (81% Pervious) 3, Emergent Herbaceous Wetlands Evergreen Forest Grassland/Herbaceous Mixed Forest Open Water Pasture/Hay Perennial Ice/Snow Shrub/Scrub Woody Wetlands Totals: 28, Total: Total: 9.44 Total: 5, Notes: Adjusted Developed Land Use - Take into account the National Land Cover Database from 2011: Developed, Open Space - 19% Impervious; Developed, Low Intensity - 49% Impervious; Developed, Medium Intensity - 79% Impervious; Developed, High Intensity - 100% Impervious Impervious developed land loading rates for nitrogen, phosphorus and sediment is 23.06, 2.28 and 1,839 lbs/acre/year, respectively. Pervious developed land loading rates for nitrogen, phosphorus and sediment is 20.72, 0.84 and lbs/acre/year, respectively. Undeveloped land (outside urbanized area) loading rates for nitrogen, phosphorus and sediment is 10, 0.33 and lbs/acre/year, respectively. Loading rates obtained from Attachment B - Developed Land Loading Rates for PA Counties (3800-PM-BCW0100k 5/2016). Land use areas obtained from the Stroud Water Research Center - Model My Watershed program.
23 Land Use Information and Pollutant Load Calculation Parse Area C - North Wales Borough - Wissahickon Creek Nitrogen Loading Rate (lbs/acre/year) Nitrogen Load Phosphorus Loading Phosphorus Load Sediment Loading Sediment Load Land Use Area (m 2 ) Area (acres) Barren Land (Rock/Sand/Clay) Cultivated Crops Deciduous Forest Developed, High Intensity Developed, Low Intensity - Developed, Low Intensity (49% Impervious) 1, Developed, Low Intensity (51% Pervious) 1, Developed, Medium Intensity - Developed, Medium Intensity (79% Impervious) Developed, Medium Intensity (21% Pervious) Developed, Open Space - Developed, Open Space (19% Impervious) 1, Developed, Open Space (81% Pervious) 5, Emergent Herbaceous Wetlands Evergreen Forest Grassland/Herbaceous Mixed Forest Open Water Pasture/Hay Perennial Ice/Snow Shrub/Scrub Woody Wetlands Totals: 9, Total: Total: 3.00 Total: 1, Notes: Adjusted Developed Land Use - Take into account the National Land Cover Database from 2011: Developed, Open Space - 19% Impervious; Developed, Low Intensity - 49% Impervious; Developed, Medium Intensity - 79% Impervious; Developed, High Intensity - 100% Impervious Impervious developed land loading rates for nitrogen, phosphorus and sediment is 23.06, 2.28 and 1,839 lbs/acre/year, respectively. Pervious developed land loading rates for nitrogen, phosphorus and sediment is 20.72, 0.84 and lbs/acre/year, respectively. Undeveloped land (outside urbanized area) loading rates for nitrogen, phosphorus and sediment is 10, 0.33 and lbs/acre/year, respectively. Loading rates obtained from Attachment B - Developed Land Loading Rates for PA Counties (3800-PM-BCW0100k 5/2016). Land use areas obtained from the Stroud Water Research Center - Model My Watershed program.
24 Land Use Information and Pollutant Load Calculation Parse Area D - North Wales Borough - Wissahickon Creek Nitrogen Loading Rate (lbs/acre/year) Nitrogen Load Phosphorus Loading Phosphorus Load Sediment Loading Sediment Load Land Use Area (m 2 ) Area (acres) Barren Land (Rock/Sand/Clay) Cultivated Crops Deciduous Forest 6, Developed, High Intensity Developed, Low Intensity - Developed, Low Intensity (49% Impervious) 3, , Developed, Low Intensity (51% Pervious) 3, Developed, Medium Intensity - Developed, Medium Intensity (79% Impervious) Developed, Medium Intensity (21% Pervious) Developed, Open Space - Developed, Open Space (19% Impervious) 3, , Developed, Open Space (81% Pervious) 15, , Emergent Herbaceous Wetlands Evergreen Forest Grassland/Herbaceous Mixed Forest Open Water Pasture/Hay Perennial Ice/Snow Shrub/Scrub Woody Wetlands Totals: 33, Total: Total: 9.48 Total: 5, Notes: Adjusted Developed Land Use - Take into account the National Land Cover Database from 2011: Developed, Open Space - 19% Impervious; Developed, Low Intensity - 49% Impervious; Developed, Medium Intensity - 79% Impervious; Developed, High Intensity - 100% Impervious Impervious developed land loading rates for nitrogen, phosphorus and sediment is 23.06, 2.28 and 1,839 lbs/acre/year, respectively. Pervious developed land loading rates for nitrogen, phosphorus and sediment is 20.72, 0.84 and lbs/acre/year, respectively. Undeveloped land (outside urbanized area) loading rates for nitrogen, phosphorus and sediment is 10, 0.33 and lbs/acre/year, respectively. Loading rates obtained from Attachment B - Developed Land Loading Rates for PA Counties (3800-PM-BCW0100k 5/2016). Land use areas obtained from the Stroud Water Research Center - Model My Watershed program.
25 Land Use Information and Pollutant Load Calculation Parse Area E - North Wales Borough - Wissahickon Creek Nitrogen Loading Rate (lbs/acre/year) Nitrogen Load Phosphorus Loading Phosphorus Load Sediment Loading Sediment Load Land Use Area (m 2 ) Area (acres) Barren Land (Rock/Sand/Clay) Cultivated Crops Deciduous Forest Developed, High Intensity Developed, Low Intensity - Developed, Low Intensity (49% Impervious) 2, Developed, Low Intensity (51% Pervious) 2, Developed, Medium Intensity - Developed, Medium Intensity (79% Impervious) Developed, Medium Intensity (21% Pervious) Developed, Open Space - Developed, Open Space (19% Impervious) Developed, Open Space (81% Pervious) 2, Emergent Herbaceous Wetlands Evergreen Forest Grassland/Herbaceous Mixed Forest Open Water Pasture/Hay Perennial Ice/Snow Shrub/Scrub Woody Wetlands Totals: 8, Total: Total: 3.14 Total: 1, Notes: Adjusted Developed Land Use - Take into account the National Land Cover Database from 2011: Developed, Open Space - 19% Impervious; Developed, Low Intensity - 49% Impervious; Developed, Medium Intensity - 79% Impervious; Developed, High Intensity - 100% Impervious Impervious developed land loading rates for nitrogen, phosphorus and sediment is 23.06, 2.28 and 1,839 lbs/acre/year, respectively. Pervious developed land loading rates for nitrogen, phosphorus and sediment is 20.72, 0.84 and lbs/acre/year, respectively. Undeveloped land (outside urbanized area) loading rates for nitrogen, phosphorus and sediment is 10, 0.33 and lbs/acre/year, respectively. Loading rates obtained from Attachment B - Developed Land Loading Rates for PA Counties (3800-PM-BCW0100k 5/2016). Land use areas obtained from the Stroud Water Research Center - Model My Watershed program.
26 Land Use Information and Pollutant Load Calculation Parse Area F - North Wales Borough - Wissahickon Creek Nitrogen Loading Rate (lbs/acre/year) Nitrogen Load Phosphorus Loading Phosphorus Load Sediment Loading Sediment Load Land Use Area (m 2 ) Area (acres) Barren Land (Rock/Sand/Clay) Cultivated Crops Deciduous Forest 1, Developed, High Intensity Developed, Low Intensity - Developed, Low Intensity (49% Impervious) 3, , Developed, Low Intensity (51% Pervious) 4, Developed, Medium Intensity - Developed, Medium Intensity (79% Impervious) Developed, Medium Intensity (21% Pervious) Developed, Open Space - Developed, Open Space (19% Impervious) 1, Developed, Open Space (81% Pervious) 4, Emergent Herbaceous Wetlands Evergreen Forest Grassland/Herbaceous Mixed Forest Open Water Pasture/Hay Perennial Ice/Snow Shrub/Scrub Woody Wetlands Totals: 16, Total: Total: 5.38 Total: 3, Notes: Adjusted Developed Land Use - Take into account the National Land Cover Database from 2011: Developed, Open Space - 19% Impervious; Developed, Low Intensity - 49% Impervious; Developed, Medium Intensity - 79% Impervious; Developed, High Intensity - 100% Impervious Impervious developed land loading rates for nitrogen, phosphorus and sediment is 23.06, 2.28 and 1,839 lbs/acre/year, respectively. Pervious developed land loading rates for nitrogen, phosphorus and sediment is 20.72, 0.84 and lbs/acre/year, respectively. Undeveloped land (outside urbanized area) loading rates for nitrogen, phosphorus and sediment is 10, 0.33 and lbs/acre/year, respectively. Loading rates obtained from Attachment B - Developed Land Loading Rates for PA Counties (3800-PM-BCW0100k 5/2016). Land use areas obtained from the Stroud Water Research Center - Model My Watershed program.
27 Land Use Information and Pollutant Load Calculation Parse Area G - North Wales Borough - Wissahickon Creek Nitrogen Loading Rate (lbs/acre/year) Nitrogen Load Phosphorus Loading Phosphorus Load Sediment Loading Sediment Load Land Use Area (m 2 ) Area (acres) Barren Land (Rock/Sand/Clay) Cultivated Crops Deciduous Forest 1, Developed, High Intensity Developed, Low Intensity - Developed, Low Intensity (49% Impervious) Developed, Low Intensity (51% Pervious) Developed, Medium Intensity - Developed, Medium Intensity (79% Impervious) Developed, Medium Intensity (21% Pervious) Developed, Open Space - Developed, Open Space (19% Impervious) Developed, Open Space (81% Pervious) 1, Emergent Herbaceous Wetlands Evergreen Forest Grassland/Herbaceous Mixed Forest Open Water Pasture/Hay Perennial Ice/Snow Shrub/Scrub Woody Wetlands Totals: 4, Total: Total: 1.21 Total: Notes: Adjusted Developed Land Use - Take into account the National Land Cover Database from 2011: Developed, Open Space - 19% Impervious; Developed, Low Intensity - 49% Impervious; Developed, Medium Intensity - 79% Impervious; Developed, High Intensity - 100% Impervious Impervious developed land loading rates for nitrogen, phosphorus and sediment is 23.06, 2.28 and 1,839 lbs/acre/year, respectively. Pervious developed land loading rates for nitrogen, phosphorus and sediment is 20.72, 0.84 and lbs/acre/year, respectively. Undeveloped land (outside urbanized area) loading rates for nitrogen, phosphorus and sediment is 10, 0.33 and lbs/acre/year, respectively. Loading rates obtained from Attachment B - Developed Land Loading Rates for PA Counties (3800-PM-BCW0100k 5/2016). Land use areas obtained from the Stroud Water Research Center - Model My Watershed program.
28 Land Use Information and Pollutant Load Calculation / Reduction Calculation Sub-basin D1 Wissahickon Creek - North Wales Borough Nitrogen Loading Rate (lbs/acre/year) Nitrogen Load Phosphorus Loading Phosphorus Load Sediment Loading Sediment Load Land Use Area (m 2 ) Area (acres) Barren Land (Rock/Sand/Clay) NA 0.0 NA 0.0 NA 0.0 Cultivated Crops NA 0.0 NA 0.0 NA 0.0 Deciduous Forest NA 0.0 NA 0.0 NA 0.0 Developed, High Intensity Developed, Low Intensity - Developed, Low Intensity (49% Impervious) 11, , Developed, Low Intensity (51% Pervious) 11, Developed, Medium Intensity - Developed, Medium Intensity (79% Impervious) 7, , Developed, Medium Intensity (21% Pervious) 1, Developed, Open Space - Developed, Open Space (19% Impervious) 2, , Developed, Open Space (81% Pervious) 12, Emergent Herbaceous Wetlands NA 0.0 NA 0.0 NA 0.0 Evergreen Forest NA 0.0 NA 0.0 NA 0.0 Grassland/Herbaceous NA 0.0 NA 0.0 NA 0.0 Mixed Forest NA 0.0 NA 0.0 NA 0.0 Open Water NA 0.0 NA 0.0 NA 0.0 Pasture/Hay NA 0.0 NA 0.0 NA 0.0 Perennial Ice/Snow NA 0.0 NA 0.0 NA 0.0 Shrub/Scrub NA 0.0 NA 0.0 NA 0.0 Woody Wetlands NA 0.0 NA 0.0 NA 0.0 Totals: 48, Total: , Pollutant Removal Rate: 20.0% 45.0% 60.0% Load Reduction Load Reduction Load Reduction : : 7.95 : 6, Notes: Adjusted Developed Land Use - Take into account the National Land Cover Database from 2011: Developed, Open Space - 19% Impervious; Developed, Low Intensity - 49% Impervious; Developed, Medium Intensity - 79% Impervious; Developed, High Intensity - 100% Impervious Impervious developed land loading rates for nitrogen, phosphorus and sediment is 23.06, 2.28 and 1,839 lbs/acre/year, respectively. Pervious developed land loading rates for nitrogen, phosphorus and sediment is 20.72, 0.84 and lbs/acre/year, respectively. Undeveloped land (outside urbanized area) loading rates for nitrogen, phosphorus and sediment is 10, 0.33 and lbs/acre/year, respectively. Loading rates obtained from Attachment B - Developed Land Loading Rates for PA Counties (3800-PM-BCW0100k 5/2016). NA - Loading rate not applicable. The watershed does not have any of this type of Land Use. Land use areas obtained from the Stroud Water Research Center - Model My Watershed program.
29 Land Use Information and Pollutant Load Calculation / Reduction Calculations Sub-basin D2 Wissahickon Creek - North Wales Borough Nitrogen Loading Rate (lbs/acre/year) Nitrogen Load Phosphorus Loading Phosphorus Load Sediment Loading Sediment Load Land Use Area (m 2 ) Area (acres) Barren Land (Rock/Sand/Clay) NA 0.0 NA 0.0 NA 0.0 Cultivated Crops NA 0.0 NA 0.0 NA 0.0 Deciduous Forest NA 0.0 NA 0.0 NA 0.0 Developed, High Intensity 7, Developed, Low Intensity - Developed, Low Intensity (49% Impervious) 25, , Developed, Low Intensity (51% Pervious) 26, , Developed, Medium Intensity - Developed, Medium Intensity (79% Impervious) 14, , Developed, Medium Intensity (21% Pervious) 3, Developed, Open Space - Developed, Open Space (19% Impervious) 4, , Developed, Open Space (81% Pervious) 19, , Emergent Herbaceous Wetlands NA 0.0 NA 0.0 NA 0.0 Evergreen Forest NA 0.0 NA 0.0 NA 0.0 Grassland/Herbaceous NA 0.0 NA 0.0 NA 0.0 Mixed Forest NA 0.0 NA 0.0 NA 0.0 Open Water NA 0.0 NA 0.0 NA 0.0 Pasture/Hay NA 0.0 NA 0.0 NA 0.0 Perennial Ice/Snow NA 0.0 NA 0.0 NA 0.0 Shrub/Scrub NA 0.0 NA 0.0 NA 0.0 Woody Wetlands NA 0.0 NA 0.0 NA 0.0 Totals: 101, Total: , Pollutant Removal Rate: 20.0% 45.0% 60.0% Load Reduction Load Reduction Load Reduction : : : 14, Notes: Adjusted Developed Land Use - Take into account the National Land Cover Database from 2011: Developed, Open Space - 19% Impervious; Developed, Low Intensity - 49% Impervious; Developed, Medium Intensity - 79% Impervious; Developed, High Intensity - 100% Impervious Impervious developed land loading rates for nitrogen, phosphorus and sediment is 23.06, 2.28 and 1,839 lbs/acre/year, respectively. Pervious developed land loading rates for nitrogen, phosphorus and sediment is 20.72, 0.84 and lbs/acre/year, respectively. Undeveloped land (outside urbanized area) loading rates for nitrogen, phosphorus and sediment is 10, 0.33 and lbs/acre/year, respectively. Loading rates obtained from Attachment B - Developed Land Loading Rates for PA Counties (3800-PM-BCW0100k 5/2016). NA - Loading rate not applicable. The watershed does not have any of this type of Land Use. Land use areas obtained from the Stroud Water Research Center - Model My Watershed program.
30 Land Use Information and Pollutant Load Calculation / Reduction Calculation Sub-basin D3 Wissahickon Creek - North Wales Borough Nitrogen Loading Rate (lbs/acre/year) Nitrogen Load Phosphorus Loading Phosphorus Load Sediment Loading Sediment Load Land Use Area (m 2 ) Area (acres) Barren Land (Rock/Sand/Clay) NA 0.0 NA 0.0 NA 0.0 Cultivated Crops NA 0.0 NA 0.0 NA 0.0 Deciduous Forest NA 0.0 NA 0.0 NA 0.0 Developed, High Intensity 15, Developed, Low Intensity - Developed, Low Intensity (49% Impervious) 32, , Developed, Low Intensity (51% Pervious) 33, , Developed, Medium Intensity - Developed, Medium Intensity (79% Impervious) 34, , Developed, Medium Intensity (21% Pervious) 9, Developed, Open Space - Developed, Open Space (19% Impervious) 3, , Developed, Open Space (81% Pervious) 15, Emergent Herbaceous Wetlands NA 0.0 NA 0.0 NA 0.0 Evergreen Forest NA 0.0 NA 0.0 NA 0.0 Grassland/Herbaceous NA 0.0 NA 0.0 NA 0.0 Mixed Forest NA 0.0 NA 0.0 NA 0.0 Open Water NA 0.0 NA 0.0 NA 0.0 Pasture/Hay NA 0.0 NA 0.0 NA 0.0 Perennial Ice/Snow NA 0.0 NA 0.0 NA 0.0 Shrub/Scrub NA 0.0 NA 0.0 NA 0.0 Woody Wetlands NA 0.0 NA 0.0 NA 0.0 Totals: 143, Total: , Pollutant Removal Rate: 20.0% 45.0% 60.0% Load Reduction Load Reduction Load Reduction : : : 22, Notes: Adjusted Developed Land Use - Take into account the National Land Cover Database from 2011: Developed, Open Space - 19% Impervious; Developed, Low Intensity - 49% Impervious; Developed, Medium Intensity - 79% Impervious; Developed, High Intensity - 100% Impervious Impervious developed land loading rates for nitrogen, phosphorus and sediment is 23.06, 2.28 and 1,839 lbs/acre/year, respectively. Pervious developed land loading rates for nitrogen, phosphorus and sediment is 20.72, 0.84 and lbs/acre/year, respectively. Undeveloped land (outside urbanized area) loading rates for nitrogen, phosphorus and sediment is 10, 0.33 and lbs/acre/year, respectively. Loading rates obtained from Attachment B - Developed Land Loading Rates for PA Counties (3800-PM-BCW0100k 5/2016). NA - Loading rate not applicable. The watershed does not have any of this type of Land Use. Land use areas obtained from the Stroud Water Research Center - Model My Watershed program.
31 Land Use Information and Pollutant Load Calculation / Reduction Calculation Sub-basin D4 Wissahickon Creek - North Wales Borough Nitrogen Loading Rate (lbs/acre/year) Nitrogen Load Phosphorus Loading Phosphorus Load Sediment Loading Sediment Load Land Use Area (m 2 ) Area (acres) Barren Land (Rock/Sand/Clay) NA 0.0 NA 0.0 NA 0.0 Cultivated Crops NA 0.0 NA 0.0 NA 0.0 Deciduous Forest 7, Developed, High Intensity 39, , Developed, Low Intensity - Developed, Low Intensity (49% Impervious) 56, , Developed, Low Intensity (51% Pervious) 59, , Developed, Medium Intensity - Developed, Medium Intensity (79% Impervious) 94, , Developed, Medium Intensity (21% Pervious) 25, , Developed, Open Space - Developed, Open Space (19% Impervious) 9, , Developed, Open Space (81% Pervious) 39, , Emergent Herbaceous Wetlands NA 0.0 NA 0.0 NA 0.0 Evergreen Forest NA 0.0 NA 0.0 NA 0.0 Grassland/Herbaceous NA 0.0 NA 0.0 NA 0.0 Mixed Forest NA 0.0 NA 0.0 NA 0.0 Open Water NA 0.0 NA 0.0 NA 0.0 Pasture/Hay NA 0.0 NA 0.0 NA 0.0 Perennial Ice/Snow NA 0.0 NA 0.0 NA 0.0 Shrub/Scrub NA 0.0 NA 0.0 NA 0.0 Woody Wetlands NA 0.0 NA 0.0 NA 0.0 Totals: 330, Total: 1, , Pollutant Removal Rate: 20.0% 45.0% 60.0% Load Reduction Load Reduction Load Reduction : : : 50, Notes: Adjusted Developed Land Use - Take into account the National Land Cover Database from 2011: Developed, Open Space - 19% Impervious; Developed, Low Intensity - 49% Impervious; Developed, Medium Intensity - 79% Impervious; Developed, High Intensity - 100% Impervious Impervious developed land loading rates for nitrogen, phosphorus and sediment is 23.06, 2.28 and 1,839 lbs/acre/year, respectively. Pervious developed land loading rates for nitrogen, phosphorus and sediment is 20.72, 0.84 and lbs/acre/year, respectively. Undeveloped land (outside urbanized area) loading rates for nitrogen, phosphorus and sediment is 10, 0.33 and lbs/acre/year, respectively. Loading rates obtained from Attachment B - Developed Land Loading Rates for PA Counties (3800-PM-BCW0100k 5/2016). NA - Loading rate not applicable. The watershed does not have any of this type of Land Use. Land use areas obtained from the Stroud Water Research Center - Model My Watershed program.
32 Land Use Information and Pollutant Load Calculation / Reduction Calculation Sub-basin D5 Wissahickon Creek - North Wales Borough Nitrogen Loading Rate (lbs/acre/year) Nitrogen Load Phosphorus Loading Phosphorus Load Sediment Loading Sediment Load Land Use Area (m 2 ) Area (acres) Barren Land (Rock/Sand/Clay) NA 0.0 NA 0.0 NA 0.0 Cultivated Crops NA 0.0 NA 0.0 NA 0.0 Deciduous Forest 25, , Developed, High Intensity NA 0.0 NA 0.0 NA 0.0 Developed, Low Intensity - Developed, Low Intensity (49% Impervious) 87, , Developed, Low Intensity (51% Pervious) 91, , Developed, Medium Intensity - Developed, Medium Intensity (79% Impervious) 17, , Developed, Medium Intensity (21% Pervious) 4, Developed, Open Space - Developed, Open Space (19% Impervious) 35, , Developed, Open Space (81% Pervious) 151, , Emergent Herbaceous Wetlands NA 0.0 NA 0.0 NA 0.0 Evergreen Forest NA 0.0 NA 0.0 NA 0.0 Grassland/Herbaceous NA 0.0 NA 0.0 NA 0.0 Mixed Forest NA 0.0 NA 0.0 NA 0.0 Open Water NA 0.0 NA 0.0 NA 0.0 Pasture/Hay NA 0.0 NA 0.0 NA 0.0 Perennial Ice/Snow NA 0.0 NA 0.0 NA 0.0 Shrub/Scrub NA 0.0 NA 0.0 NA 0.0 Woody Wetlands NA 0.0 NA 0.0 NA 0.0 Totals: 414, Total: 2, , Pollutant Removal Rate: 20.0% 45.0% 60.0% Load Reduction Load Reduction Load Reduction : : : 49, Notes: Adjusted Developed Land Use - Take into account the National Land Cover Database from 2011: Developed, Open Space - 19% Impervious; Developed, Low Intensity - 49% Impervious; Developed, Medium Intensity - 79% Impervious; Developed, High Intensity - 100% Impervious Impervious developed land loading rates for nitrogen, phosphorus and sediment is 23.06, 2.28 and 1,839 lbs/acre/year, respectively. Pervious developed land loading rates for nitrogen, phosphorus and sediment is 20.72, 0.84 and lbs/acre/year, respectively. Undeveloped land (outside urbanized area) loading rates for nitrogen, phosphorus and sediment is 10, 0.33 and lbs/acre/year, respectively. Loading rates obtained from Attachment B - Developed Land Loading Rates for PA Counties (3800-PM-BCW0100k 5/2016). NA - Loading rate not applicable. The watershed does not have any of this type of Land Use. Land use areas obtained from the Stroud Water Research Center - Model My Watershed program.
33 Pollutant Load Reduction Wissahickon Creek PRP North Wales Borough Project: North Wales Station Date of Project: 2015 Pollutant: Phosphorus Pre-Development Conditions Land Use Area (acres) Loading Rate (lbs/ac/yr) Sub Totals Developed, Medium Intensity - 79% Impervious % Pervious Grassland / Herbaceous Total Pre-Development 1.95 Post-Development Conditions Developed, Medium Intensity - 79% Impervious % Impervious Total Post-Development Before BMP Reduction 2.41 Nutrient Reduction for Raingarden BMP 85% Total Post-Development 0.36 Net Nutrient Reduction (Pre minus Post) lbs/yr 1.59 Notes: Adjusted Developed Land Use - Take into account the National Land Cover Database from 2011: Developed, Open Space - 19% Impervious; Developed, Low Intensity - 49% Impervious; Developed, Impervious developed land loading rates for nitrogen, phosphorus and sediment is 23.06, 2.28 and 1,839 lbs/acre/year, respectively. Pervious developed land loading rates for nitrogen, phosphorus and sediment is 20.72, 0.84 and lbs/acre/year, respectively. Undeveloped land (outside urbanized area) loading rates for nitrogen, phosphorus and sediment is 10, 0.33 and lbs/acre/year, respectively. Loading rates obtained from Attachment B - Developed Land Loading Rates for PA Counties (3800-PM-BCW0100k 5/2016). Pre-development conditions determined from historic Google aerial photographs and plans prepared by the Southeastern Pennsylvania Transportation Authority (9/4/14)
34 APPENDIX V POLLUTANT LOAD REDUCTION REFERENCE
35 3800-PM-BCW0100m 5/2016 COMMONWEALTH OF PENNSYLVANIA BMP Effectiveness Values DEPARTMENT OF ENVIRONMENTAL PROTECTION BUREAU OF CLEAN WATER NATIONAL POLLUTANT DISCHARGE ELIMINATION SYSTEM (NPDES) STORMWATER DISCHARGES FROM SMALL MUNICIPAL SEPARATE STORM SEWER SYSTEMS BMP EFFECTIVENESS VALUES This table of BMP effectiveness values (i.e., pollutant removal efficiencies) is intended for use by MS4s that are developing and implementing Pollutant Reduction Plans and TMDL Plans to comply with NPDES permit requirements. The values used in this table generally consider pollutant reductions from both overland flow and reduced downstream erosion, and are based primarily on average values within the Chesapeake Assessment Scenario Tool (CAST) ( Design considerations, operation and maintenance, and construction sequences should be as outlined in the Pennsylvania Stormwater BMP Manual, Chesapeake Bay Program guidance, or other technical sources. The Department of Environmental Protection (DEP) will update the information contained in this table as new information becomes available. Interested parties may submit information to DEP for consideration in updating this table to DEP s MS4 resource account, RA-EPPAMS4@pa.gov. Where an MS4 proposes a BMP not identified in this document or in Chesapeake Bay Program expert panel reports, other technical resources may be consulted for BMP effectiveness values. Note TN = Total Nitrogen and TP = Total Phosphorus. BMP Name BMP Effectiveness Values TN TP Sediment Wet Ponds and Wetlands 20% 45% 60% Dry Detention Basins and Hydrodynamic Structures Dry Extended Detention Basins 5% 10% 10% 20% 20% 60% BMP Description A water impoundment structure that intercepts stormwater runoff then releases it to an open water system at a specified flow rate. These structures retain a permanent pool and usually have retention times sufficient to allow settlement of some portion of the intercepted sediments and attached nutrients/toxics. Until recently, these practices were designed specifically to meet water quantity, not water quality objectives. There is little or no vegetation living within the pooled area nor are outfalls directed through vegetated areas prior to open water release. Nitrogen reduction is minimal. Dry Detention Ponds are depressions or basins created by excavation or berm construction that temporarily store runoff and release it slowly via surface flow or groundwater infiltration following storms. Hydrodynamic Structures are devices designed to improve quality of stormwater using features such as swirl concentrators, grit chambers, oil barriers, baffles, micropools, and absorbent pads that are designed to remove sediments, nutrients, metals, organic chemicals, or oil and grease from urban runoff. Dry extended detention (ED) basins are depressions created by excavation or berm construction that temporarily store runoff and release it slowly via surface flow or groundwater infiltration following storms. Dry ED basins are designed to dry out between storm events, in contrast with wet ponds, which contain standing water permanently. As such, they are similar in construction and function to dry detention basins, except that the duration of detention of stormwater is designed to be longer, theoretically improving treatment effectiveness
MAIDENCREEK TOWNSHIP BOARD OF SUPERVISORS
 Maidencreek Township, Berks County POLLUTANT REDUCTION PLAN (PRP) Willow Creek MS4 Prepared for MAIDENCREEK TOWNSHIP BOARD OF SUPERVISORS 1 Quarry Road Blandon, PA 19510 Maidencreek Township, Berks County,
Lebanon County, PA Cooperative Restoration Strategy
 of Participating Municipalities Characteristics Appendix B Infrastructure Upgrade Assessment Form Appendix C Existing BMPs data sheet Appendix D Stormwater BMP Project Form Lebanon County, PA Cooperative
Stormwater Guidelines and Case Studies. CAHILL ASSOCIATES Environmental Consultants West Chester, PA (610)
") Stormwater Guidelines and Case Studies CAHILL ASSOCIATES Environmental Consultants West Chester, PA (610) 696-4150 www.thcahill.com Goals and Challenges for Manual State Stormwater Policy More Widespread
Stormwater Guidelines and Case Studies CAHILL ASSOCIATES Environmental Consultants West Chester, PA (610) 696-4150 www.thcahill.com Goals and Challenges for Manual State Stormwater Policy More Widespread
Appendix K.2: Sediment Management Excerpt from South Orange County Hydromodification Management Plan
 Appendix K.2: Sediment Management Excerpt from South Orange County Hydromodification Management Plan 4 Sediment Supply Management Requirements Permit Order R9-2013-0001 as amended by Order No. R9-2015-0001Section
ADDENDUM - APPENDIX G. Christina Basin MS4 TMDL Plan (Part 1 MS4 TMDL Strategy)
") ADDENDUM - APPENDIX G Christina Basin MS4 TMDL Plan (Part 1 MS4 TMDL Strategy) [bracketed italics text highlighted in grey are instructions to municipalities and/or text to be completed by Municipality;
ADDENDUM - APPENDIX G Christina Basin MS4 TMDL Plan (Part 1 MS4 TMDL Strategy) [bracketed italics text highlighted in grey are instructions to municipalities and/or text to be completed by Municipality;
Continuing Education Associated with Maintaining CPESC and CESSWI Certification
 Continuing Education Associated with Maintaining CPESC and CESSWI Certification Module 2: Stormwater Management Principles for Earth Disturbing Activities Sponsors: ODOTs Local Technical Assistance Program
ADDENDUM - APPENDIX F
 ADDENDUM - APPENDIX F Christina Basin TMDL Implementation Plan (C-TIP) Partnership Members, Meetings, and Communications and Correspondence with PADEP and EPA C-TIP Partnership Member Municipalities C-TIP
Section 4: Model Development and Application
 Section 4: Model Development and Application The hydrologic model for the Wissahickon Act 167 study was built using GIS layers of land use, hydrologic soil groups, terrain and orthophotography. Within
Assessment of Lake Forest Lake Sediment Trapping Efficiency and Capacity. Marlon R. Cook Groundwater Assessment Program Geological Survey of Alabama
 Assessment of Lake Forest Lake Sediment Trapping Efficiency and Capacity Marlon R. Cook Groundwater Assessment Program Geological Survey of Alabama Impacts of the Lake at Lake Forest on the connectivity
STORMWATER REPORT FRITO LAY SUBDIVISION NO. 3
 STORMWATER REPORT FRITO LAY SUBDIVISION NO. 3 May 2018 STORMWATER REPORT I. Subdivision Data a. The parcel is adjacent to the existing Frito Lay property in Topeka; and the subject plat application encompasses
Stone Outlet Sediment Trap
 3.12 Sediment Control Description: A stone outlet sediment trap is a small detention area formed by placing a stone embankment with an integral stone filter outlet across a drainage swale for the purpose
PONDNET.WK1 - Flow and Phosphorus Routing in Pond Networks
 PONDNET.WK1 - Flow and Phosphorus Routing in Pond Networks Version 2.1 - March 1989 William W. Walker, Jr. Ph.D., Environmental Engineer 1127 Lowell Road, Concord, Massachusetts 01742 508-369-8061 PONDNET.WK1
This site will utilize an infiltration berm to manage the two-year/24-hour volume increase.
 Gates TETRA TECH, INC. By: RH Date: 1/30/2017 Subject: Gates Road Checked By: JB Date: 2/1/2017 PCSM Design and Evaluation PURPOSE: The purpose of these calculations is to design a Post-Construction Stormwater
STREUVER FIDELCO CAPPELLI, LLC YONKERS DOWNTOWN DEVELOPMENT PHASE 1. DRAFT ENVIRONMENTAL IMPACT STATEMENT For: PALISADES POINT
 STREUVER FIDELCO CAPPELLI, LLC YONKERS DOWNTOWN DEVELOPMENT PHASE 1 DRAFT ENVIRONMENTAL IMPACT STATEMENT For: PALISADES POINT Prepared by: PAULUS, SOKOLOWSKI & SARTOR STORMWATER MANAGEMENT 1. Methodology
TPDES: Soil, Erosion and Sedimentation Methods
 SAWS TPDES: Soil, Erosion and Sedimentation Methods Philip Handley Supervisor-Resource Protection & Compliance August 25, 2014 TPDES: Soil, Erosion and Sedimentation Methods Soil Common term: Dirt Common
Suitable Applications Sediment traps should be considered for use:
 Categories EC Erosion Control SE Sediment Control TC Tracking Control WE Wind Erosion Control Non-Stormwater NS Management Control Waste Management and WM Materials Pollution Control Legend: Primary Objective
Materials. Use materials meeting the following.
 208.01 Section 208. SOIL EROSION AND SEDIMENTATION CONTROL 208.01 Description. Install and maintain erosion and sedimentation controls to minimize soil erosion and to control sedimentation from affecting
Title: ArcMap: Calculating Soil Areas for Storm Water Pollution Prevention Plans Authors: Brandy Woodcock, Benjamin Byars
 Title: ArcMap: Calculating Soil Areas for Storm Water Pollution Prevention Plans Authors: Brandy Woodcock, Benjamin Byars Introduction Abstract: The use of ArcMap to calculate soil areas for storm water
Template for Sediment and Erosion Control Plan General Instructions. Section Instructions
 Template for Sediment and Erosion Control Plan General Instructions Introduction: Soil erosion and sediment deposition from farmlands can contribute to degraded surface water quality. Sediment delivery
Gully Erosion Part 1 GULLY EROSION AND ITS CAUSES. Introduction. The mechanics of gully erosion
 Gully Erosion Part 1 GULLY EROSION AND ITS CAUSES Gully erosion A complex of processes whereby the removal of soil is characterised by incised channels in the landscape. NSW Soil Conservation Service,
Total Maximum Daily Load (TMDL) South Branch Codorus Creek Watershed York County
 South Branch Codorus Creek Watershed York County") Total Maximum Daily Load (TMDL) South Branch Codorus Creek Watershed York County Pennsylvania Department of Environmental Protection Central Office Office of Water Management July 9, 2003 Table of Contents
Total Maximum Daily Load (TMDL) South Branch Codorus Creek Watershed York County Pennsylvania Department of Environmental Protection Central Office Office of Water Management July 9, 2003 Table of Contents
Estimating Probability of Success Rate
 Estimating Probability of Success Rate Don Ferguson, PhD A member of Appalachian Search and Rescue Conference Objective Provide SAR planners with a tool to help optimize effort allocation based on a number
Sediment Trap. At multiple locations within the project site where sediment control is needed.
 Sediment Trap SE-3 Objectives EC Erosion Control SE Sediment Control TR Tracking Control WE Wind Erosion Control Non-Stormwater NS Management Control Waste Management and WM Materials Pollution Control
WELCOME Lake Wabukayne OPEN HOUSE
 WELCOME Lake Wabukayne Sediment Removal Project OPEN HOUSE We are here to: Update you, the community, on recent developments and activities at Lake Wabukayne Present the preferred alternative and receive
This site will utilize an infiltration berm to manage the two-year/24-hour volume increase.
 Gates TETRA TECH, INC. By: RH Date: 11/11/2016 Subject: Gates Road Checked By: JB Date: 11/13/2016 PCSM Design and Evaluation PURPOSE: The purpose of these calculations is to design a Post-Construction
Woodford County Erosion Prevention Plan and Permit. Application #
 Woodford County Erosion Prevention Plan and Permit Application # Date Instructions: Applicant will complete Parts A and B, and attach a proposed site diagram. This diagram must be completed in accordance
HISTORY OF CONSTRUCTION FOR EXISTING CCR SURFACE IMPOUNDMENT PLANT GASTON ASH POND 40 CFR (c)(1)(i) (xii)
(1)(i) (xii)") HISTORY OF CONSTRUCTION FOR EXISTING CCR SURFACE IMPOUNDMENT PLANT GASTON ASH POND 40 CFR 257.73(c)(1)(i) (xii) (i) Site Name and Ownership Information: Site Name: E.C. Gaston Steam Plant Site Location:
HISTORY OF CONSTRUCTION FOR EXISTING CCR SURFACE IMPOUNDMENT PLANT GASTON ASH POND 40 CFR 257.73(c)(1)(i) (xii) (i) Site Name and Ownership Information: Site Name: E.C. Gaston Steam Plant Site Location:
Section B - Chapter 13 Neuse River Subbasin Bay River and Pamlico Sound
 Section B - Chapter 13 Neuse River Subbasin 3-4-13 Bay River and Pamlico Sound 13.1 Subbasin Overview Subbasin 3-4-13 at a Glance Land and Water Area Total area: 277 mi 2 Land area: 145 mi 2 Water area:
Section B - Chapter 1 Tar-Pamlico River Subbasin Tar River, Fishing Creek, Cedar Creek, Coon Creek and Tabbs Creek
 Section B - Chapter 1 Tar-Pamlico River Subbasin 03-03-01 Tar River, Fishing, Cedar, Coon and Tabbs 1.1 Subbasin Overview Subbasin 03-03-01 at a Glance Land and Water Area Total area: 642 mi 2 Land area:
Template for Sediment and Erosion Control Plan General Instructions
 Template for Sediment and Erosion Control Plan General Instructions Introduction: Soil erosion and sediment deposition from farmlands can contribute to degraded surface water quality. Sediment delivery
Drainage Analysis. Appendix F
 Drainage Analysis Appendix F Golden View Drive Elizabeth Street LMORE CREEK Ricky Road Rabbit Creek Road LITTLE RABBIT CREEK East 156th Avenue MOA Project #10-026 Golden View Drive Intersection
HOTEL KANATA 160 HEARST WAY KANATA, ONTARIO SERVICING REPORT. Prepared for: David Johnston Architect. Prepared By:
 HOTEL KANATA 160 HEARST WAY KANATA, ONTARIO SERVICING REPORT Prepared for: David Johnston Architect Prepared By: BaseTech Consulting Inc. 309 Roywood Crescent Newmarket, Ontario L3Y 1A6 BCI Project No.
STORMWATER MANAGEMENT ASSESSMENT TECHNICAL MEMORANDUM DRAFT FINAL FOSTER DRIVE AREA SANITARY SERVICING AND STORMWATER MANAGEMENT CLASS EA
 The City of Committed to Total Service Excellence STORMWATER MANAGEMENT ASSESSMENT TECHNICAL MEMORANDUM DRAFT FINAL FOSTER DRIVE AREA SANITARY SERVICING AND STORMWATER MANAGEMENT CLASS EA April 2015 Revised
2013 Housing Units Built
 Montgomery County Data: Housing 2013 Housing Units Built Montgomery County, Pennsylvania New housing construction in Montgomery County increased in 2013 by 42% over the prior year, with growth in all three
SAN FRANCISCO DISTRICT INFORMATION REQUESTED FOR VERIFICATION OF CORPS JURISDICTION
 DEPARTMENT OF THE ARMY SAN FRANCISCO DISTRICT, U.S. ARMY CORPS OF ENGINEERS 1455 MARKET STREET SAN FRANCISCO, CALIFORNIA 94103-1398 SAN FRANCISCO DISTRICT INFORMATION REQUESTED FOR VERIFICATION OF CORPS
Chesapeake Bay Remote Sensing Pilot Executive Briefing
 Chesapeake Bay Remote Sensing Pilot Executive Briefing Introduction In his Executive Order 13506 in May 2009, President Obama stated The Chesapeake Bay is a national treasure constituting the largest estuary
Information for File # MMJ; Trunk Highway (TH) 7 / Louisiana Ave. Interchange Project
 7 / Louisiana Ave. Interchange Project") Information for File # 2013-00531-MMJ; Trunk Highway (TH) 7 / Louisiana Ave. Interchange Project Applicant: City of St. Louis Park Corps Contact: Melissa Jenny Address: U.S. Army Corps of Engineers Attn:
Information for File # 2013-00531-MMJ; Trunk Highway (TH) 7 / Louisiana Ave. Interchange Project Applicant: City of St. Louis Park Corps Contact: Melissa Jenny Address: U.S. Army Corps of Engineers Attn:
An Integrated Storm Surge, Hurricane Wave, Salinity and Sediment Transport Modeling System for Breton Sound, LA
 An Integrated Storm Surge, Hurricane Wave, Salinity and Sediment Transport Modeling System for Breton Sound, LA Q. Jim Chen Department of Civil and Environmental Engineering qchen@lsu.edu Acknowledgements
THE MINISTRY OF ENERGY AND ENERGY INDUSTRIES MINERALS DIVISION MINE DESIGN TEMPLATE OPERATOR NAME: OPERATOR ADDRESS: PHONE NUMBER: FACSIMILE:
 THE MINISTRY OF ENERGY AND ENERGY INDUSTRIES MINERALS DIVISION MINE DESIGN TEMPLATE 1.0 GENERAL INFORMATION OPERATOR NAME: OPERATOR ADDRESS: PHONE NUMBER: FACSIMILE: NAME OF CONTACT: CELLULAR PHONE: EMAIL
How Do Human Impacts and Geomorphological Responses Vary with Spatial Scale in the Streams and Rivers of the Illinois Basin?
 How Do Human Impacts and Geomorphological Responses Vary with Spatial Scale in the Streams and Rivers of the Illinois Basin? Bruce Rhoads Department of Geography University of Illinois at Urbana-Champaign
2016 Housing Units Built
 Montgomery County Data: HOUSING 2016 Housing Units Built Montgomery County, Pennsylvania The total number of units built in 2016 increased by 16% Housing construction in Montgomery County continued to
APPENDIX A: EROSION & SEDIMENT CONTROL FORMS
 APPENDIX A: EROSION & SEDIMENT CONTROL FORMS Croy Engineering # 1580.08 EROSION & SEDIMENT CONTROL FORMS Appendix-1 This page intentionally left blank. Croy Engineering # 1580.08 EROSION & SEDIMENT CONTROL
Statement of Impact and Objectives. Watershed Impacts. Watershed. Floodplain. Tumblin Creek Floodplain:
 Tumblin Creek Floodplain: Impacts Assessment and Conceptual Restoration Plan Casey A. Schmidt Statement of Impact and Objectives Urbanization has increased stormflow rate and volume and increased sediment,
9/12/2014 O V E RV I E W
 K E E P I N G T H E N E W M I S S I O N R E AC H C L E A N T R A S H & F L O ATA B L E S B M P S T U D Y Russell Persyn, P.E., Ph.D. (SARA) Cris Parker, P.E., CFM (HDR) September 4, 2014 O V E RV I E W»
Savannah District s Revised SOP: Moving Towards A Functional Approach. US Army Corps of Engineers BUILDING STRONG
 Savannah District s Revised SOP: Moving Towards A Functional Approach US Army Corps of Engineers Agenda SOP Revision Concept New Aquatic Resource Credit Types New Urban Mitigation Service Area Filter Background
NORTH DAKOTA DEPARTMENT OF TRANSPORTATION SPECIAL PROVISION TEMPORARY EROSION AND SEDIMENT BEST MANAGEMENT PRACTICES
 Page 1 of 5 NORTH DAKOTA DEPARTMENT OF TRANSPORTATION SPECIAL PROVISION TEMPORARY EROSION AND SEDIMENT BEST MANAGEMENT PRACTICES 1. GENERAL Install, maintain and remove appropriate Temporary Best Management
ARTICLE 5 (PART 2) DETENTION VOLUME EXAMPLE PROBLEMS
 DETENTION VOLUME EXAMPLE PROBLEMS") ARTICLE 5 (PART 2) DETENTION VOLUME EXAMPLE PROBLEMS Example 5.7 Simple (Detention Nomograph) Example 5.8 Offsite and Unrestricted Areas (HEC-HMS) Example 5.9 Ponds in Series w/ Tailwater (HEC-HMS) Example
ARTICLE 5 (PART 2) DETENTION VOLUME EXAMPLE PROBLEMS Example 5.7 Simple (Detention Nomograph) Example 5.8 Offsite and Unrestricted Areas (HEC-HMS) Example 5.9 Ponds in Series w/ Tailwater (HEC-HMS) Example
MARYLAND S LAND USE/LAND COVER MAP AND ASSOCIATED ANALYSIS
 MARYLAND S LAND USE/LAND COVER MAP AND ASSOCIATED ANALYSIS Maryland Department of Planning Daniel Baldwin Stephanie Martins November 19, 2012 http://www.planning.maryland.gov/ PURPOSE The primary purpose
2. There is evidence of oil field waste discharged to an unnamed tributary to Bad Luck Creek. This is a violation of 40 CFR Part
 September 10, 2008 Bill Fowler Chesapeake Energy Corporation P.O. Box 18496 Oklahoma City, OK 73154 RE: Cooper 7-9, 2-5H, Authorization #2008953 Dear Mr. Fowler: On, September 9, 2008, Eric Fleming and
MAPPING THE RAINFALL EVENT FOR STORMWATER QUALITY CONTROL
 Report No. K-TRAN: KU-03-1 FINAL REPORT MAPPING THE RAINFALL EVENT FOR STORMWATER QUALITY CONTROL C. Bryan Young The University of Kansas Lawrence, Kansas JULY 2006 K-TRAN A COOPERATIVE TRANSPORTATION
Critical Area Mapping Update Project St. Mary s County Town Hall April 8th, :30 p.m.
 Critical Area Mapping Update Project St. Mary s County Town Hall April 8th, 2019 6:30 p.m. Critical Area Commission for the Chesapeake and Atlantic Coastal Bays St. Mary s County What Is the Critical Area
Required Documents. Title: Number: AEP Administration 2017 No. 1. Provincial Wetlands and Water Boundaries Section. Effective Date: September 1, 2017
 Title: Number: Program Name: Provincial Wetlands and Water Boundaries Section Effective Date: September 1, 2017 This document was updated on: August 25, 2017 The Provincial Wetlands and Water Boundaries
Chapter 4 French Broad River Subbasin Including the: French Broad River, Little Ivy Creek (River), Ivy Creek, California Creek and Bull Creek
, Ivy Creek, California Creek and Bull Creek") Chapter 4 French Broad River Subbasin 04-03-04 Including the: French Broad River, Little Ivy Creek (River), Ivy Creek, California Creek and Bull Creek 4.1 Subbasin Overview Subbasin 04-03-04 at a Glance
Chapter 4 French Broad River Subbasin 04-03-04 Including the: French Broad River, Little Ivy Creek (River), Ivy Creek, California Creek and Bull Creek 4.1 Subbasin Overview Subbasin 04-03-04 at a Glance
FOR PROJECTS INITIATED AFTER NOVEMBER 1, 2008 ITEM 716 EMBANKMENT EARTH OUTLET SEDIMENT TRAP
 AFTER NOVEMBER 1, 2008 ITEM 716 EMBANKMENT EARTH OUTLET SEDIMENT TRAP 716.1 Description. This work shall consist of furnishing, installing, maintaining, and removing temporary erosion protection and sediment
Bathymetric Survey and Sediment Hydroacoustic Study of Canyon Lake. Michael Anderson UC Riverside
 Bathymetric Survey and Sediment Hydroacoustic Study of Canyon Lake Michael Anderson UC Riverside Introduction Canyon Lake was constructed in 1928 as the Railroad Canyon Reservoir as a result of the impoundment
The following procedures describe how application managers will review chemical additives during the permit application review phase.
 Bureau of Point and Non-Point Source Management Standard Operating Procedure (SOP) 1 for Clean Water Program Chemical Additives SOP No. BPNPSM-PMT-030 Final, November 9, 2012 Version 1.4 This SOP describes
Effects of input DEM data spatial resolution on Upstream Flood modeling result A case study in Willamette river downtown Portland
 Effects of input DEM data spatial resolution on Upstream Flood modeling result A case study in Willamette river downtown Portland By Hue Duong GEOG 593 Fall 2015 Digital Terrain Analysis Photo: Anh Duc
Sediment Control Practices. John Mathews Ohio Dept. of Natural Resources, Division of Soil and Water Resources
 Sediment Control Practices John Mathews Ohio Dept. of Natural Resources, Division of Soil and Water Resources Practices Treat the Largest Soil Particles Sand Sand Silt Clay Treated Untreated Settleable
3.11 Floodplains Existing Conditions
 Other stormwater control practices may be needed to mitigate water quality impacts. In addition to detention facilities, other practices such as vegetated basins/buffers, infiltration basins, and bioswales
Appendix E Guidance for Shallow Flooding Analyses and Mapping
 Appendix E Guidance for Shallow Flooding Analyses and Mapping E.1 Introduction Different types of shallow flooding commonly occur throughout the United States. Types of flows that result in shallow flooding
Sensitivity of AERSURFACE Results to Study Area and Location. Paper 2009-A-127-AWMA
 Sensitivity of AERSURFACE Results to Study Area and Location Paper 2009-A-127-AWMA Prepared by: Anthony J. Schroeder, CCM Senior Consultant George J. Schewe, CCM, QEP Principal Consultant Trinity Consultants
Rabbit River Turbidity Total Maximum Daily Load Report (Impaired River Reach AUID )
") Rabbit River Turbidity Total Maximum Daily Load Report (Impaired River Reach AUID 09020101-502) Submitted to: U.S. Environmental Protection Agency Region 5, Chicago, Illinois Submitted by: June 2010 Table
Rabbit River Turbidity Total Maximum Daily Load Report (Impaired River Reach AUID 09020101-502) Submitted to: U.S. Environmental Protection Agency Region 5, Chicago, Illinois Submitted by: June 2010 Table
Electronic Submission Format Guide Anthracite Preparation Plant Permit Application
 Electronic Submission Format Guide Anthracite Preparation Plant Permit Application Module 1: Application Section A through Section J, the Application Checklist, and all narrative responses Act 67 / 68
This site will utilize an infiltration berm to manage the two-year/24-hour volume increase.
 High Street TETRA TECH, INC. By: RH Date: 1/30/2017 Subject: High Street Checked By: JB Date: 2/1/2017 PCSM Design and Evaluation PURPOSE: The purpose of these calculations is to design a Post-Construction
low turbidity high turbidity
 What is Turbidity? Turbidity refers to how clear the water is. The greater the amount of total suspended solids (TSS) in the water, the murkier it appears and the higher the measured turbidity. Excessive
Technical Memorandum. City of Salem, Stormwater Management Design Standards. Project No:
 Technical Memorandum 6500 SW Macadam Avenue, Suite 200 Portland, Oregon, 97239 Tel: 503-244-7005 Fax: 503-244-9095 Prepared for: Project Title: City of Salem, Oregon City of Salem, Stormwater Management
Understanding the effects of roads in upland settings on hydrology, geomorphology and water quality
 Understanding the effects of roads in upland settings on hydrology, geomorphology and water quality Beverley Wemple Department of Geography and Rubenstein School of Environment & Natural Resources The
Sediment Control Log (SCL)
") Description A sediment control log is a linear roll made of natural materials such as straw, coconut fiber, or other fibrous material trenched into the ground and held with a wooden stake. Sediment control
Description A sediment control log is a linear roll made of natural materials such as straw, coconut fiber, or other fibrous material trenched into the ground and held with a wooden stake. Sediment control
73% of the units constructed in 2017 were attached or multifamily housing types.
 Montgomery County Data: HOUSING 2017 Housing Units Built Montgomery County, Pennsylvania 73% of the units constructed in 2017 were attached or multifamily housing types. Housing construction in Montgomery
Figure 0-18: Dendrogeomorphic analysis of streambank erosion and floodplain deposition (from Noe and others, 2015a)
") Appendix 9A: Stream to River During the development of the Phase 6 Watershed Model, multiple methods for determining coefficients were often attempted. In some cases, the methods are averaged or otherwise
Appendix 9A: Stream to River During the development of the Phase 6 Watershed Model, multiple methods for determining coefficients were often attempted. In some cases, the methods are averaged or otherwise
Black Gore Creek 2013 Sediment Source Monitoring and TMDL Sediment Budget
 Black Gore Creek 2013 Sediment Source Monitoring and TMDL Sediment Budget Prepared for: Prepared By: - I. Introduction The Black Gore Creek Total Maximum Daily Load (TMDL) was developed in collaboration
Instream Sediment Control Systems
 Instream Sediment Control Systems INSTREAM PRACTICES Photo 1 Photo 2 Modular sediment The information contained within this series of fact sheets deals only with the design of temporary instream sediment
MIDDLESEX COUNTY Department of Planning and Community Development P.O. Box 427, Saluda, VA Phone: Fax:
 MIDDLESEX COUNTY Department of Planning and Community Development P.O. Box 427, Saluda, VA 23149 Phone: 804-758-3382 Fax: 804-758-0061 LAND DISTURBANCE PERMIT SUBMISSION REQUIREMENTS In order to expedite
GOAL 7 AREAS SUBJECT TO NATURAL DISASTERS AND HAZARDS. To protect life and property from natural disasters and hazards.
 GOAL 7 AREAS SUBJECT TO NATURAL DISASTERS AND HAZARDS A. GOALS: To protect life and property from natural disasters and hazards. B. POLICIES: 1. Floodplains shall be maintained as natural drainage-ways.
March 31, Dear Ms. Shreve:
 March 31, 2005 Ms. Kathy Shreve Wyoming Department of Environmental Quality NPDES Permit Section 122 W. 25 th Street Herschler Building 4W Cheyenne, WY 82002 Subject: Response to Complete but Technically
NORTHUMBERLAND COUNTY, PA
 QUAKER RUN Stream and Wetland Restoration As-Built Completion Report and First Year Monitoring Data Coal Township NORTHUMBERLAND COUNTY, PA Upstream Before Upstream After Prepared for: COAL TOWNSHIP 805
PENNSYLVANIA DEPARTMENT OF TRANSPORTATION ENGINEERING DISTRICT 3-0
 PENNSYLVANIA DEPARTMENT OF TRANSPORTATION ENGINEERING DISTRICT 3-0 LYCOMING COUNTY S.R.15, SECTION C41 FINAL HYDROLOGIC AND HYDRAULIC REPORT STEAM VALLEY RUN STREAM RELOCATION DATE: June, 2006 REVISED:
Technical Memorandum. Stream Erosion Methodology. Consolidated TMDL Implementation Plan Comprehensive Baseline Analysis.
 Technical Memorandum Stream Erosion Methodology Table of Contents 1 Introduction...1 2 Purpose...1 3 Technical Approach...1 4 Results and Discussion... 8 References... 9 Attachments... 10 Consolidated
Nutrient and Sediment Cycling and Retention in Urban Floodplain Wetlands
 Nutrient and Sediment Cycling and Retention in Urban Floodplain Wetlands Greg Noe, Cliff Hupp, Nancy Rybicki, Ed Schenk, and Jackie Batson National Research Program, Reston VA U.S. Department of the Interior
Crows Landing Naval Base Easement
 1 of 15 West Stanislaus Resource Conservation District Crows Landing Naval Base Easement Annual Reserve Monitoring Report Jamie McFarlin 11/112012 2 of 15 West Stanislaus Resource Conservation District
Sediment and nutrient transport and storage along the urban stream corridor
 Sediment and nutrient transport and storage along the urban stream corridor Greg Noe, Cliff Hupp, Ed Schenk, Jackie Batson, Nancy Rybicki, Allen Gellis What is the role of floodplains everywhere? Noe 2013,
HYDROLOGIC AND HYDRAULIC REPORT FOR SR. 0522, SECTION 5BN ALONG BLACKLOG CREEK CROMWELL TOWNSHIP HUNTINGDON COUNTY. Prepared for:
 HYDROLOGIC AND HYDRAULIC REPORT FOR SR. 0522, SECTION 5BN ALONG BLACKLOG CREEK CROMWELL TOWNSHIP Prepared for: KCI Technologies, Inc. Mechanicsburg, PA and Pennsylvania Department of Transportation Engineering
Utility of National Spatial Data for Conservation Design Projects
 Utility of National Spatial Data for Conservation Design Projects Steve Williams Biodiversity and Spatial Information Center North Carolina State University PIF CDW St. Louis, MO April 11, 2006 Types of
Standards for Soil Erosion and Sediment Control in New Jersey May 2012
 STANDARD FOR SEDIMENT BASIN Definition A barrier, dam, excavated pit, or dugout constructed across a waterway or at other suitable locations to intercept and retain sediment. Basins created by construction
Appendix E: Cowardin Classification Coding System
 Appendix E: Cowardin Classification Coding System The following summarizes the Cowardin classification coding system and the letters and numbers used to define the USFWS NWI wetland types and subtypes:
NATIONAL VEGETATION CLASSIFICATION STANDARD, VERSION 2 WORKING DRAFT
 NATIONAL VEGETATION CLASSIFICATION STANDARD, VERSION 2 WORKING DRAFT Subcommittee Federal Geographic Data Committee SUMMMARY NatureServe version 31 August 2006 INTRODUCTION The United States Federal Geographic
Stream Geomorphology. Leslie A. Morrissey UVM July 25, 2012
 Stream Geomorphology Leslie A. Morrissey UVM July 25, 2012 What Functions do Healthy Streams Provide? Flood mitigation Water supply Water quality Sediment storage and transport Habitat Recreation Transportation
Identifying Trends in Exclusions and Feature Revisions to Promote Better Recon. Surface Water Status Monitoring Network
 Identifying Trends in Exclusions and Feature Revisions to Promote Better Recon Surface Water Status Monitoring Network Andy Woeber GIS Analyst Watershed Monitoring Section FDEP Tallahassee Surface water
Chapter 3 - White Oak River Subbasin Includes Bogue Sound and the Newport River
 Chapter 3 - White Oak River Subbasin 03-05-03 Includes Bogue Sound and the Newport River 3.1 Water Quality Overview Subbasin 03-05-03 at a Glance Land and Water Area (sq. mi.) Total area: 228 Land area:
RE: AFIN: ADEQ Reference #: WG-LA Well Site: Suarez-Gartner 8-12 No. 1-30H
 November 2, 2017 Rick Spicer Regulatory & Environmental Superintendent Operations BHP Billiton Petroleum, LLC Fayetteville Petroleum Unit 1686 Letona Rd Searcy, AR 72143 RE: AFIN: 23-00000 ADEQ Reference
YORK COUNTY REGIONAL CHESAPEAKE BAY POLLUTANT REDUCTION PLAN
 YORK COUNTY REGIONAL CHESAPEAKE BAY POLLUTANT REDUCTION PLAN DECEMBER 2014 (Prepared by the York County Planning Commission and Center for Watershed Protection in cooperation with the Regional CBPRP Steering
Watershed concepts for community environmental planning
 Purpose and Objectives Watershed concepts for community environmental planning Dale Bruns, Wilkes University USDA Rural GIS Consortium May 2007 Provide background on basic concepts in watershed, stream,
Rock & Aggregate Drop Inlet Protection
 Rock & Aggregate Drop Inlet Protection SEDIMENT CONTROL TECHNIQUE Type 1 System Sheet Flow Sandy Soils Type 2 System [1] Concentrated Flow Clayey Soils Type 3 System Supplementary Trap Dispersive Soils
APPENDIX E GREATER SPRINGFIELD RELIABILTIY PROJECT DRAINAGE ANALYSIS FOR THE NEWGATE/PHELPS ROAD AND THE HATCHETT HILL ROAD AREAS
 APPENDIX E GREATER SPRINGFIELD RELIABILTIY PROJECT DRAINAGE ANALYSIS FOR THE NEWGATE/PHELPS ROAD AND THE HATCHETT HILL ROAD AREAS New England East-West Solution (NEEWS) Greater Springfield Reliability
Guide to the use of the Erosion and Sediment Control Evaluation Tool
 Guide to the use of the Erosion and Sediment Control Evaluation Tool December 2017 If you require content in an alternate format please contact us at 905-895-1281 or by email at Accessibility@LSRCA.on.ca
B805 TEMPORARY EROSION AND SEDIMENT CONTROL MEASURES - OPSS 805
 B805 MEASURES - OPSS 805 805.1 GENERAL Construction activities frequently remove protective cover and expose soil to accelerated rates of erosion. Sediments generated thereby can be conveyed via runoff
One Hilltop, Three Major Watersheds!
 One Hilltop, Three Major Watersheds! Adapted from: An original Creek Connections activity. Creek Connections, Box E, Allegheny College, Meadville, Pennsylvania, 16335 Watersheds of PA/ Topo Map Review
APPENDIX E. GEOMORPHOLOGICAL MONTORING REPORT Prepared by Steve Vrooman, Keystone Restoration Ecology September 2013
 APPENDIX E GEOMORPHOLOGICAL MONTORING REPORT Prepared by Steve Vrooman, Keystone Restoration Ecology September 2 Introduction Keystone Restoration Ecology (KRE) conducted geomorphological monitoring in
CHAPTER 1 THE UNITED STATES 2001 NATIONAL LAND COVER DATABASE
 CHAPTER 1 THE UNITED STATES 2001 NATIONAL LAND COVER DATABASE Collin Homer*, Jon Dewitz, Joyce Fry, and Nazmul Hossain *U.S. Geological Survey (USGS) Center for Earth Resources Observation and Science
Electronic Submission Format Guide Bituminous Coal Surface Mine Permit Application (5600-PM-BMP0311)
") Electronic Submission Format Guide Bituminous Coal Surface Mine Permit Application (5600-PM-BMP0311) Module 1: Application Section A through Section J, the Application Checklist, and all narrative responses.
Electronic Submission Format Guide Bituminous Coal Surface Mine Permit Application (5600-PM-BMP0311) Module 1: Application Section A through Section J, the Application Checklist, and all narrative responses.