Multi-Dimensional Geometric Complexity in Urban Transportation Systems
|
|
|
- Noah Williams
- 5 years ago
- Views:
Transcription
1 Multi-Dimensional Geometric Complexity in Urban Transportation Systems Farideddin Peiravian a,1 and Sybil Derrible a a University of Illinois at Chicago, Complex and Sustainable Urban Networks (CSUN) Lab, Civil Engineering Department, 842 W. Taylor St. (MC246), Chicago, IL, US complex urban systems transportation networks statistical physics quantitative geography travel behavior Copyright: Farideddin Peiravian and Sybil Derrible, Distribution by arxiv.org, as well as citing with proper citation, are permitted. 1 address: fpeira2@uic.edu, Tel: Author contributions: F.P. and S.D. designed research, performed research, analyzed data, and wrote the paper. The authors declare no conflict of interest.
2 Abstract Transportation networks serve as windows into the complex world of urban systems. By properly characterizing a road network, we can therefore better understand its encompassing urban system. This study offers a geometrical approach towards capturing inherent properties of urban road networks. It offers a robust and efficient methodology towards defining and extracting three relevant indicators of road networks: area, line, and point thresholds, through measures of their grid equivalents. By applying the methodology to 50 U.S. urban systems, we successfully observe differences between eastern versus western, coastal versus inland, and old versus young, cities. Moreover, we show that many socio-economic characteristics as well as travel patterns within urban systems are directly correlated with their corresponding area, line, and point thresholds. Significance Statement Cities are complex systems, consisting of many interrelated components that have evolved over long periods of time. In particular, their transportation systems physically exhibit this evolutionary process. Much information can therefore be collected by studying the geometry of urban transportation systems. This study offers a simple yet robust method to capture three geometric characteristics of transportation networks. These characteristics are then calculated for 50 cities in the United States and related to their socio-economic properties and travel patterns. \body Transportation systems have geometric properties. While their topologic characteristics can be examined as graphs (1 4), complex analysis approaches and more specifically network topological methods (5 10) have recently been used extensively for that purpose (11, 12). Many researchers have focused on presenting a broader picture of transportation networks by showing that they possess general properties such as self-organization (13 17), fractal (18 20), scale-free or power-law distribution (21 25), Zipf s rank law (26 29), or other properties (30 35) to name a few. There are a number of studies of urban systems that have used simulated grid networks for different purposes (13 15, 36, 37). This work focuses on measuring inherent geometric characteristics of urban road networks through studying their grid equivalents, and it is further extended by studying the relationships between the results and their corresponding urban Page 2 of 42
3 systems socio-economic characteristics and travel patterns. We first develop the methodology to perform those measurements and then apply it to 50 urban areas in the United States to extract and analyze the characteristics of their road systems. Cities are complex systems, consisting of a variety of interacting elements. From the time of its inception, an urban settlement goes through an evolutionary process that affects all of its constituents, among them its transportation system. Since a road network grows, expands, and evolves along with and similar to its encompassing urban system, it offers a proper means to study the complexity of its corresponding urban system and to express it using meaningful indicators (38). As Samaniego and Moses have described it: understanding the topology of urban networks that connect people and places leads to insights into how cities are organized (39). Moreover, similar to other emerging (14) and self-organizing systems (40), the evolution of road networks is not a simple product of conscious design (15), but rather a complex and dynamic process (41) that is the result of the interaction of many different factors. Such influencing parameters include not only the system users and its infrastructure (40), but also topological, morphological, technical, economic, social, and political factors (41), all of which are also determinants of the changes in the road network s encompassing urban system. In fact, even for cities that look different, their transportation systems can demonstrate a variety of similarities (10, 21, 42 44). Based on the above argument, this study contributes to a better understanding of the complex nature of urban road networks by offering a robust and efficient approach that serves as a compliment to other existing methods. At the first glance, and from a network perspective, a road system is simply seen as a collection of connected segments or links. Understandably, this perspective shifts the main attention towards studying its links as a way of understanding the whole network. This link aspect of urban transportation systems is paramount in terms of geometry and perhaps more closely related to the concept of lines (although not related to Space Syntax (45)). We will therefore look for a line indicator that can represent the links in a road system. An urban road network, however, is more than the sum of its links or lines. Similar to the circulatory system that serves the whole body, a road system serves its encompassing urban area by dividing it into smaller blocks that make it easier to reach every corner of the system. The coverage area of the road network is therefore another important factor to be studied. Thus, we will also represent the coverage area of a given road system by an area indicator. Page 3 of 42
4 Moreover, the locations where the road segments cross, i.e. their intersections, also play an important role in the daily operation of a road network. For that, their representation should also be a part of any complete study of the complexity of their corresponding urban system. And that provides another objective for this study, which is to find a point indicator for a given road network. Based on the above arguments, an analysis of a road network, as a representative of the complexity of its encompassing urban system, requires three different yet related geometric indicators: area, line, and point. From a mathematical perspective, these three indicators also represent the three main geometric dimensions of an urban system, D 2, D 1, and D 0, respectively. This study offers a unified and systematic approach for the characterization of urban road networks through their area, line, and point indicators, later referred to as thresholds. Methodology In order to explain the methodology towards the development of the three geometric indicators of a given road network, Chicago s urban system is used as an example, for which the process can be summarized in the following three steps. Further details and information are provided in the Supplementary Materials. Step 1: As the first task, the extent of the urban system for the given city is determined. In the U.S., the commonly-used representation of such an influence area is the city s Metropolitan Statistical Area (MSA) 2. The choice of MSA not only provides a consistent means for the selection of the extents of an urban area, but it also makes data collection easier as the MSA boundaries are readily available in shapefile format. Figure 1a exhibits Chicago MSA and its road network. 2 MSA is defined as the geographical region with a relatively high population density at its core and close economic ties throughout the area (46). This means that a typical metropolitan area is centered on a single large city that wields substantial influence over the region (46), e.g. Chicago. More precisely, Metropolitan Statistical Areas have at least one urbanized area of 50,000 or more population, plus adjacent territory that has a high degree of social and economic integration with the core as measured by commuting ties. (47) Page 4 of 42
 Chicago MSA road network, b) Road polygons and 10x10 km grid network Instead of the entire MSA area, however, polygons are created wherever the road network within that area creates a closed loop.")
5 a) b) Figure 1. a) Chicago MSA road network, b) Road polygons and 10x10 km grid network Instead of the entire MSA area, however, polygons are created wherever the road network within that area creates a closed loop. The rationale for that is to exclude large peripheral areas without roads (see the Supplementary Materials for further information, where we highlight the example of Las Vegas, NV). In other words, the combination of these polygons represents the area serviced by the road segments within them, for which the total area is calculated. Moreover, for the given road network, the total road length and total number of intersections are also calculated. Step 2: This step involves successive creation of grids with varying cell sizes, overlaying them on the road network, and extracting the cells needed to cover all the road segments. Then, for each grid the total coverage area, total length of links, and total number of nodes are calculated. Figure 1b demonstrates the creation of such a grid with 10 km x 10 km cells that covers Chicago MSA road network. Note that this process resembles the box-counting methodology in fractal analysis, although here different information is collected from the results. Step 3: The final task involves a comparison of the values obtained from Steps 1 and 2. The goal is to find the specific grids that are equivalent to the given road network with respect to total coverage area, total road length, and total number of intersections. As mentioned before, those criteria represent the given road network s area, line, and point characteristics, successively. The idea is that while a given urban road system might have an irregular configuration, something which is a part of its complex identity, one should be able to find equivalent grid networks that possesses the same area, line, or point geometric characteristics. Page 5 of 42

6 Naturally, there are more than one equivalent grid network that satisfy the condition for any of the above geometric indicators. An additional condition must therefore be set to result in a unique grid network. For that, we require the coverage area of the grid network to cover all the road segments of the urban road network under study, which is essentially already achieved in Step 2. The block size of the equivalent grid network will then be considered as the indicator, or as called hereafter: the threshold, for its corresponding geometric characteristic (area or line or point). The procedure explained above is applied to the Chicago MSA road network. Due to its dense configuration, however, only a south-western section of the road network along with its equivalent grid networks are magnified and demonstrated in Figure 2. a) b) c) Chicago Road Network Grid Network km Figure 2. Comparison of Chicago road network and different grids with a) equal area, b) equal road length, and c) equal number of intersections. To explain their differences, the process involves overlaying grids with gradually decreasing block sizes over the original road system. At the beginning, the area covered by the grid is larger than the corresponding area of the road network under study. As the cell size of the grid is gradually reduced, at some point the two areas become equal (Figure 2a). At that very moment, the grid network crosses a threshold. Since it marks the point where the two networks are equivalent in an area dimensional perspective, the grid network s block size is then designated as the area threshold. After that point, the focus shifts to the comparison of the total road lengths of the two networks. As the grid network s block size becomes smaller and smaller, its total road length gradually increases, up to a point at which it becomes equal to the total road length of the original network (Figure 2b). That moment marks another threshold, at which the block size of the grid network is designated as the Page 6 of 42
7 line threshold, i.e. when the two networks are equivalent in a line dimensional sense. The same process continues further, until a point when the total numbers of intersections (points) in both networks become equal (Figure 2c). That marks the third threshold, at which the block size of the grid network is designated as the point threshold. At that very moment, the two networks are equivalent in a point dimensional sense. As discussed before, a given urban road network can be examined from different perspectives. One is the area it encompasses or serves. Another one is the links (lines) that facilitate the services it provides. And the third one is the intersections (points) that in turn facilitate the transfer of services between links (lines). Measuring these three components, and their corresponding thresholds (as explained above), can help better understand the characteristics of the urban system itself. In order to find the three area, line, and point thresholds accurately, the following approach is taken. For a given urban road network, its coverage area (A), total road length (L), and total number of intersections (P) can be calculated and extracted from its shapefile, easily obtainable from Census TIGER/Lines dataset (48). In comparison, for any chosen grid network with a block size of ε, the area it serves (a), the total road length it consists of (l), and the total number of intersections that it has (p), can also be extracted from its shapefile. Instead of comparing the two sets of numbers, the grid network values are normalized by dividing them by the road network s corresponding values and are then compared with the unity (one), i.e. plots of a/a, l/l, and p/p, are drawn and intersected with a horizontal line with the value of 1. At the point of intersection, the block size (ε) of the grid network is extracted and reported as the corresponding threshold. Examples of the diagrams for the area, line, and point thresholds for the Chicago MSA road network are presented in Figure 3. Page 7 of 42
 Area, b) Line, and c) Point Thresholds Results and Discussion Similar steps were executed for a total of 50 urban areas across the U.")
8 a) b) c) Figure 3. Determining the three thresholds for Chicago MSA road network: a) Area, b) Line, and c) Point Thresholds Results and Discussion Similar steps were executed for a total of 50 urban areas across the U.S. (see the Supplementary Materials for a complete list of cities as well as individual results). These cities cover a wide and diverse range of parameters such as road network structure, topology, morphology, history, size, population, area, and socio-economic conditions. The results of the analyses performed are presented in Figure 4 in the form of three maps, showing the geospatial variations of the three thresholds (area, line, and point) calculated for those urban areas. a) Page 8 of 42
9 b) c) Figure 4. a) Area, b) Line, and c) Point thresholds. Area threshold: this figure shows lower values for older cities (mostly in the north-eastern states) as compared to those for younger cities. This difference is related to the advent of the motorized transportation in the 20 th century. Older cities tend to be more walkable and have smaller blocks, while younger cities tend to have larger block sizes. A comparison between Phoenix, AZ with Chicago, IL that have the largest and medium area thresholds, respectively, sheds light on this fact (please refer to the Supplementary Materials). Line threshold: different from the previous figure, we see that the line thresholds for the cities along the costal line are smaller than for the cities inside the country. The reason is partly due to the fact that coastal Page 9 of 42
10 cities often perform as logistical hubs (e.g., ports) and thus are centers of import and export activities. As a result, their road networks are more compact and have more uniform road segments as compared to inland cities that have larger variations in their road segment lengths. A comparison of the length variations within the road networks of Salt Lake City, UT with Chicago, IL that have the largest and medium line thresholds, respectively, presents a visual explanation of this characteristic (please refer to the Supplementary Materials). Point threshold: while we might expect to see the same trend for the point threshold as the line threshold, since intersections are merely where the roads intersect, this is not always the case. A good example is Denver, Colorado, that has a mid-range line threshold, but a small point threshold. One of the factors affecting the point threshold is the way the intersections are created, i.e. 6- or 4- way intersections as compared to T- intersections or cul-du-sacs, each affecting the point-threshold differently. This means that cities with similar line thresholds could have different point threshold, and vice versa. The above figures demonstrate interesting and insightful aspects of the diversity of the inner complexity of the urban systems studied here. Of relevance, overall no single indicator can completely capture and describe the complexities at play. This emphasizes the fact that any given urban system has its own unique multi-dimensional complex characteristics, all of which are needed to gain a complete picture of its urban characteristics. In order to better present and visually compare the thresholds calculated for the cities studied in this work, all the values obtained are plotted in one diagram (Figure 5). The figure clearly shows that each threshold has its own variation and no two thresholds are behaving similarly, again a manifestation of the complex nature of urban systems and their road networks. Page 10 of 42

11 Figure 5. Area, line, and point thresholds for 50 U.S. urban areas. The significance of the three thresholds found in this work were further investigated through analyzing their relationships with several socio-economic parameters as well as travel patterns related to their corresponding urban areas are studied here. A plot of the area threshold versus age of the urban systems (49) studied here is presented in Figure 6. Figure 6. Relationship between the area threshold and the age of the urban system. The figure shows a power law trend (Area Threshold = Age , R 2 = 0.51, and t-score = 6.8), which means that the older a city is, the shorter its area threshold will be. This supports the fact that in older cities the polygons Page 11 of 42
12 created by road networks are smaller due to their more developed state, while in younger cities one would see larger polygon sizes. This figure is able to capture nearly two hundred years of urban and regional planning theory and the advent of motorized transportation as discussed earlier. From another perspective we witness a relationship between population density and line and point thresholds, as shown in Figure 7. This phenomenon is common and expected (52 54), since, if other conditions remain the same, neighborhoods with smaller blocks (i.e. higher road and intersection density, as compared to larger blocks) tend to create safer environments and thus attract more people, hence higher population density. Figure 7. Relationship between Population density and a) Line and b) Point thresholds. Figures 7a shows that an increase in line threshold, which means larger block size, has a negative power law impact on population density (Population density = 5x10 6 Line threshold , R 2 = 0.56, and t-score = 7.6). The reason is that longer road segments, i.e., larger block sizes, essentially translate into larger residential units. Similarly, population density is affected by point threshold (Population Density = 2x10 7 Point threshold , R 2 = 0.43, and t-score = 5.8), as shown in Figure 7b. This shows the fact that closer and denser intersections translate into city blocks that are smaller and thus more suitable for housing with higher concentration of people per area. Using the 2010 American Community Survey (ACS) data (50), we find that many travel patterns within the U.S. have power law relationships with the line threshold. Figure 8 exhibits the variations of the average travel time for all modes and also total transit travel time with respect to the line threshold. Other travel patterns found to possess similar trends, including allmodes total travel time, total number of trips, and total number of transit trips. Page 12 of 42
13 Figure 8. Relationship between the a) Average travel time for all modes, and b) Total transit travel time, and the Line threshold. The power law trend seen in Figure 8a (All-modes avg. travel time = Line threshold , R 2 = 0.38, and t-score = 5.2) shows that as the line threshold increases, the average travel time for all modes decreases. The reason is that an increase in the length of the road segments, which partially represents the existence of freeways and thus lower road density, results in a higher car use as the dominant choice of transportation mode in the U.S. A similar trend exists for the reduction in the use of public transit, shown in Figure 8b (Total transit travel time = 7x10 12 Line threshold , R 2 = 0.30, and t-score = 4.4). In this instance, we use total as opposed to average travel time since cities with denser road networks tend to generate more as well as longer transit trips. As a result the total number of transit trips and thus the total transit travel time drop as line threshold increases. As for the point threshold, studies (51, 52) have shown that denser road networks, which translate into closer and more compact intersections, support active modes of transportation, including walking. Walking data from 2010 American Community Survey (ACS) supports this idea, as shown in Figure 9. Page 13 of 42
14 Figure 9. Relationship between Walk time per capita and Point threshold. Based on this figure, urban areas with shorter point thresholds, i.e. with more and closer intersections, have higher walk time per capita (Walk time per capita = Point threshold , R 2 = 0.38, and t-score = 3.1). This result simply reflects that among other parameters the closer the intersections, the more encouraging and supportive the environment is for pedestrians. In other words, pedestrians are willing to walk longer distances. Conclusion This study offered a complementary perspective into the complex nature of urban systems via geometric properties of their road networks. By creating grid networks of varying block sizes and overlaying them on the road networks under study, three indicators were extracted, each representing an individual geometric property of the network. Together, the area, line, and point thresholds obtained through the method developed in this study succeed in capturing important and complex characteristics of an urban system. While two cities may share similarities for one of the thresholds, they may not be similar with respect to the other two, thus allowing us to capture their unique properties from different perspectives. In this study, we first developed a methodology to measure these three thresholds, which we then applied to 50 U.S. urban systems with a wide variety of characteristics. We also showed that there are correlations between the thresholds defined and extracted in this study and the socio-economic characteristics as well as travel patterns for a given urban area. Acknowledgments The authors would like to thank Mrs. Elham Peiravian for extensive help with data entry and data preparation. This research was partly funded by the Department of Civil and Materials Engineering at the University of Illinois at Chicago. Page 14 of 42
15 REFERENCES 1. Garrison WL, Marble DF (1962) The structure of transportation networks (Ft. Belvoir Defense Technical Information Center, Evanston, IL). 2. Kansky KJ (1963) Structure of transportation networks: relationships between network geometry and regional characteristics. Dissertation (The University of Chicago, Chicago, IL). 3. Haggett P, Chorley RJ (1969) Network Analysis in Geography (Edward Arnold, London). 4. Taaffe EJ (1973) Geography of transportation (Prentice Hall, Englewood Cliffs, New Jersey). 5. Watts DJ, Strogatz SH (1998) Collective Dynamics of Small-World Networks. Nature 393: Barabasi A-L, Albert R (1999) Emergence of Scaling in Random Networks. Science 286: Newman MEJ (2003) The Structure and Function of Complex Networks. SIAM Review 45: Derrible S, Kennedy C (2009) Network Analysis of World Subway Systems Using Updated Graph Theory. Transportation Research Record: Journal of the Transportation Research Board 2112: Antunes AL, Bavaud F, Mager C (2009) Handbook of theoretical and quantitative geography (Université de Lausanne, Faculté de géosciencies et de l environment). 10. Barthélemy M (2011) Spatial networks. Physics Reports 499: Buhl J et al. (2006) Topological patterns in street networks of self-organized urban settlements. The European Physical Journal B 49: Courtat T, Gloaguen C, Douady S (2011) Mathematics and morphogenesis of cities: A geometrical approach. Physical Review E 83. Available at: [Accessed June 30, 2014]. 13. Yerra B (2003) The Emergence of Hierarchy in Transportation Networks. Dissertation (University of Minnesota). 14. Yerra BM, Levinson DM (2005) The emergence of hierarchy in transportation networks. The Annals of Regional Science 39: Levinson D, Yerra B (2006) Self-Organization of Surface Transportation Networks. Transportation Science 40: Page 15 of 42
16 16. Samaniego H, Moses ME (2008) Cities as Organisms: Allometric Scaling of Urban Road Networks. Journal of Transport and Land Use 1. Available at: [Accessed June 29, 2014]. 17. Barthélemy M, Flammini A (2009) Co-evolution of Density and Topology in a Simple Model of City Formation. Networks and Spatial Economics 9: Batty M, Langley P (1994) Fractal Cities, A Geometry of Form and Function (Academic Press Inc.). 19. Li J (2002) Research on Fractal Characteristics of Urban Traffic Network Structure Based on GIS. Chinese Geographical Science 12: Batty M (2008) The Size, Scale, and Shape of Cities. Science 319: Lämmer S, Gehlsen B, Helbing D (2006) Scaling laws in the spatial structure of urban road networks. Physica A: Statistical Mechanics and its Applications 363: Porta S, Crucitti P, Latora V (2006) The network analysis of urban streets: A dual approach. Physica A: Statistical Mechanics and its Applications 369: Kalapala V, Sanwalani V, Clauset A, Moore C (2006) Scale invariance in road networks. Physical Review E 73. Available at: [Accessed June 30, 2014]. 24. Jiang B (2007) A topological pattern of urban street networks: Universality and peculiarity. Physica A: Statistical Mechanics and its Applications 384: Jiang B, Liu X (2012) Scaling of geographic space from the perspective of city and field blocks and using volunteered geographic information. International Journal of Geographical Information Science 26: Gabaix X (1999) Zipf s Law for Cities: An Explanation. The Quarterly Journal of Economics 114: Chen Y, Zhou Y (2004) Multi-fractal measures of city-size distributions based on the threeparameter Zipf model. Chaos, Solitons & Fractals 22: Gonzalez-Val R (2011) Deviations from Zipf s Law for American Cities: An Empirical Examination. Urban Studies 48: Chen Y, Wang J (2014) Recursive subdivision of urban space and Zipf s law. Physica A: Statistical Mechanics and its Applications 395: Scellato S, Cardillo A, Latora V, Porta S (2006) The backbone of a city. The European Physical Journal B 50: Page 16 of 42
17 31. Crucitti P, Latora V, Porta S (2006) Centrality in networks of urban streets. Chaos: An Interdisciplinary Journal of Nonlinear Science 16: Kurant M, Thiran P (2006) Extraction and analysis of traffic and topologies of transportation networks. Physical Review E 74. Available at: [Accessed June 30, 2014]. 33. Barthélemy M, Flammini A (2008) Modeling Urban Street Patterns. Physical Review Letters 100. Available at: [Accessed June 30, 2014]. 34. Levinson D (2012) Network Structure and City Size. PLoS ONE 7:e Louf R, Jensen P, Barthelemy M (2013) Emergence of hierarchy in cost-driven growth of spatial networks. Proceedings of the National Academy of Sciences 110: Xie F, Levinson D (2007) Measuring the Structure of Road Networks. Geographical Analysis 39: Masucci AP, Smith D, Crooks A, Batty M (2009) Random planar graphs and the London street network. The European Physical Journal B 71: Hillier B, Hanson J (1984) The social logic of space (Cambridge university press, Cambridge [Cambridgeshire] ; New York). 39. Samaniego H, Moses ME (2008) Cities as organisms: Allometric scaling of urban road networks. JTLU 1: Xie F, Levinson D (2009) Topological evolution of surface transportation networks. Computers, Environment and Urban Systems 33: Xie F, Levinson D (2009) Modeling the Growth of Transportation Networks: A Comprehensive Review. Networks and Spatial Economics 9: Cardillo A, Scellato S, Latora V, Porta S (2006) Structural properties of planar graphs of urban street patterns. Physical Review E 73. Available at: [Accessed May 18, 2014]. 43. Batty M (2005) Cities and complexity: understanding cities with cellular automata, agentbased models, and fractals (MIT Press, Cambridge, Mass). 44. Jiang B, Claramunt C (2004) Topological analysis of urban street networks. Environment and Planning B: Planning and Design 31: Hillier B (1999) Space is the Machine (Cambridge University Press, Cambridge, UK). 46. Metropolitan statistical area Wikipedia. Available at: Page 17 of 42
18 47. U.S. Office of Management and Budget (2008) Update of Statistical Area Definitions and Guidance on Their Uses. Available at: U.S. Census Bureau US Census Bureau TIGER/Lines. Available at: Wikipedia North American settlements by year of foundation. Available at: U.S. Census Bureau American Community Survey (ACS). Available at: Brown BB et al. (2013) Neighborhood Design for Walking and Biking. American Journal of Preventive Medicine 44: Peiravian F, Derrible S, Ijaz F (2014) Development and application of the Pedestrian Environment Index (PEI). Journal of Transport Geography 39: Jacobs J (1961) The Death and Life of Great American Cities (Vintage Books, New York). 54. Hanson S, Giuliano G eds. (2004) The geography of urban transportation (The Guilford Press, New York)3rd ed. Page 18 of 42
19 SUPPLEMENTARY INFORMATION A. List of 50 U.S. urban systems studied B. Rational for choosing road polygons over MSA polygon (Case study: Las Vegas, NV) C. Explanation for Step 2 of the Methodology (Case study: Chicago, IL) D. Road networks for 50 U.S. urban systems E. Discussion of area threshold F. Discussion of line threshold G. Area, point, and line thresholds for 50 U.S. road systems Page 19 of 42
20 A. List of 50 U.S. urban systems studied Urban Area, State Founded in 1 Population 2 Area (km 2 ) 3 Pop Density Road Length (km) 3 # of Intersections 3 Atlanta, GA Austin, TX Baltimore, MD Boston, MA Buffalo, NY Carson, NV Charlotte, NC Chicago, IL Cincinnati, OH Cleveland, OH Columbus, OH Dallas, TX Denver, CO Detroit, MI Grand Rapids, MI Hartford, CT Honolulu, HI Houston, TX Indianapolis, IN Jacksonville, FL Kansas City, KS Las Vegas, NV Lewiston, ID Los Angeles, CA Louisville, KY Memphis, TN Miami, FL Page 20 of 42
21 Urban Area, State Founded in 1 Population 2 Area (km 2 ) 3 Pop Density Road Length (km) 3 # of Intersections 3 Milwaukee, WI Minneapolis, MN Nashville, TN New Orleans, LA New York, NY Oklahoma, OK Orlando, FL Philadelphia, PA Phoenix, AZ Pittsburgh, PA Portland, OR Providence, RI Raliegh, NC Rochester, NY Sacramento, CA Salt Lake, UT San Antonio, TX San Diego, CA San Francisco, CA San Jose, CA St. Louis, MO Tampa, FL Washington D.C Wikipedia, Accessed : 2. U.S. Census Bureau American FactFinder, 2010: 3. Calculated from U.S. Census Bureau TIGER/Line Shapefiles, 2010: Page 21 of 42

22 B. Rational for choosing road polygons over the MSA polygon (Case study: Las Vegas, NV) Polygons are created for the area threshold analysis wherever the road network within that area created a closed loop. The rationale for that is to exclude outer road segments that extend beyond the built environment of a MSA that follows county boundaries. This is desirable since full MSA areas easily artificially inflate the area of an urban system instead of focusing on the area serviced by the road network. The figure below demonstrates the difference between the road polygons area created using the above approach versus the MSA area for the Las Vegas MSA, which makes a substantial difference in the service area to be analyzed. Figure B. Difference between the service area of the road system created by closed road polygons versus the MSA area for the city of Las Vegas. Page 22 of 42

23 C. Explanation for Step 2 of the Methodology (Case study: Chicago, IL) In Step 1 of the methodology, as explained before, at first the MSA of the given urban area was chosen as its extent. In Step 2, successive grids with varying block sizes were created and then overlaid on the road network, from which the cells needed to cover all the road segments within the MSA were extracted. Figures below demonstrate the creation of grids with cells ranging from 10 km to 100 m for Chicago MSA road network. They show how the grid network evolves towards the real road network. During this process, there are thresholds at which the grid network becomes equivalent to the road network from area, line, and point dimensional perspectives. The last figure demonstrates the real road network for visual comparison. a) 10 km Grid Network b) 9 km Grid Network c) 8 km Grid Network d) 7 km Grid Network e) 6 km Grid Network f) 5 km Grid Network Page 23 of 42
 800 m Grid Network m) 700 m Grid Network n) 600 m Grid Network 0) 500 m Grid Network Page 24")
24 g) 4 km Grid Network h) 3 km Grid Network i) 2 km Grid Network j) 1 km Grid Network k) 900 m Grid Network l) 800 m Grid Network m) 700 m Grid Network n) 600 m Grid Network 0) 500 m Grid Network Page 24 of 42
25 p) 400 m Grid Network q) 300 m Grid Network r) 250 m Grid Network s) 200 m Grid Network t) 150 m Grid Network u) 100 m Grid Network v) Chicago Road Network Figure C. Evolution of grid networks for Chicago MSA road network Page 25 of 42


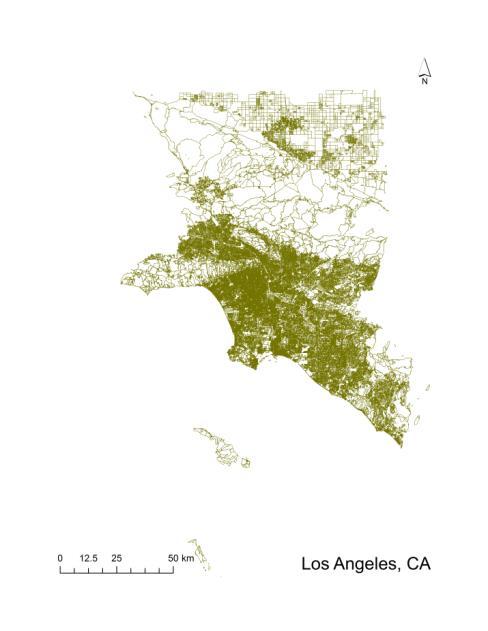
26 D. Road networks for 50 U.S. urban systems Page 26 of 42

27 Page 27 of 42

28 Page 28 of 42
29 Page 29 of 42
30 Page 30 of 42

31 Page 31 of 42
32 Page 32 of 42
33 Page 33 of 42


34 Page 34 of 42

35 Page 35 of 42


36 Page 36 of 42

37 Page 37 of 42

38 Figure D. Relative sizes and shapes of the 50 urban road polygons analyzed in this study. Page 38 of 42

 b) Figure E.")
39 E. Discussion of area threshold As we mentioned before, older cities with lower area thresholds tend to have smaller blocks and are hence more walkable, while in comparison younger cities in general tend to have larger block sizes and thus higher area thresholds, and hence are less walkable. Figure E below presents a comparative same-scale illustration of the road polygons in Phoenix, AZ versus Chicago, IL that have the largest and medium area thresholds, respectively. We can see that in general Chicago offers a more inviting environment towards walking than Phoenix. a) b) Figure E. a) Phoenix, and b) Chicago road polygons variations Page 39 of 42


40 F. Discussion of line threshold Figure F compares the length variations within the road networks of Salt Lake City, UT and Chicago, IL that have the largest and medium line thresholds, respectively. This is an example of the inland Salt Lake City versus a logistic hub coastal city like Chicago that is a center of freight activity. We see that as a result, Chicago s road network is more compact and has a more uniform distribution of road segments as compared to the non-coastal Salt Lake City that has larger variation in its road segment lengths. a) b) Figure F. a) Salt Lake City, and b) Chicago road length variations Page 40 of 42
41 G. Area, point, and line thresholds for 50 U.S. urban road systems Urban Area, State Area Threshold (m) Line Threshold (m) Point Threshold (m) Atlanta, GA Austin, TX Baltimore, MD Boston, MA Buffalo, NY Carson, NV Charlotte, NC Chicago, IL Cincinnati, OH Cleveland, OH Columbus, OH Dallas, TX Denver, CO Detroit, MI Grand Rapids, MI Hartford, CT Honolulu, HI Houston, TX Indianapolis, IN Jacksonville, FL Kansas City, KS Las Vegas, NV Lewiston, ID Los Angeles, CA Louisville, KY Page 41 of 42
42 Urban Area, State Area Threshold (m) Line Threshold (m) Point Threshold (m) Memphis, TN Miami, FL Milwaukee, WI Minneapolis, MN Nashville, TN New Orleans, LA New York, NY Oklahoma, OK Orlando, FL Philadelphia, PA Phoenix, AZ Pittsburgh, PA Portland, OR Providence, RI Raliegh, NC Rochester, NY Sacramento, CA Salt Lake, UT San Antonio, TX San Diego, CA San Francisco, CA San Jose, CA St. Louis, MO Tampa, FL Washington D.C Page 42 of 42
2/25/2019. Taking the northern and southern hemispheres together, on average the world s population lives 24 degrees from the equator.
 Where is the world s population? Roughly 88 percent of the world s population lives in the Northern Hemisphere, with about half north of 27 degrees north Taking the northern and southern hemispheres together,
North American Geography. Lesson 5: Barnstorm Like a Tennis Player!
 North American Geography Lesson 5: Barnstorm Like a Tennis Player! Unit Overview: As students work through the activities in this unit they will be introduced to the United States in general, different
Trends in Metropolitan Network Circuity
 Trends in Metropolitan Network Circuity David J. Giacomin Luke S. James David M. Levinson Abstract Because people seek to minimize their time and travel distance (or cost) when commuting, the circuity
Research Update: Race and Male Joblessness in Milwaukee: 2008
 Research Update: Race and Male Joblessness in Milwaukee: 2008 by: Marc V. Levine University of Wisconsin Milwaukee Center for Economic Development Briefing Paper September 2009 Overview Over the past decade,
NAWIC. National Association of Women in Construction. Membership Report. August 2009
 NAWIC National Association of Women in Construction Membership Report August 2009 Core Purpose: To enhance the success of women in the construction industry Region 1 67 Gr Washington, DC 9 16 2 3 1 0 0
Vibrancy and Property Performance of Major U.S. Employment Centers. Appendix A
 Appendix A DOWNTOWN VIBRANCY SCORES Atlanta 103.3 Minneapolis 152.8 Austin 112.3 Nashville 83.5 Baltimore 151.3 New Orleans 124.3 Birmingham 59.3 New York Midtown 448.6 Charlotte 94.1 Oakland 157.7 Chicago
Authors: Antonella Zanobetti and Joel Schwartz
 Title: Mortality Displacement in the Association of Ozone with Mortality: An Analysis of 48 US Cities Authors: Antonella Zanobetti and Joel Schwartz ONLINE DATA SUPPLEMENT Additional Information on Materials
Scaling in Biology. How do properties of living systems change as their size is varied?
 Scaling in Biology How do properties of living systems change as their size is varied? Example: How does basal metabolic rate (heat radiation) vary as a function of an animal s body mass? Mouse Hamster
Lesson 1 - Pre-Visit Safe at Home: Location, Place, and Baseball
 Lesson 1 - Pre-Visit Safe at Home: Location, Place, and Baseball Objective: Students will be able to: Define location and place, two of the five themes of geography. Give reasons for the use of latitude
Density and Walkable Communities
 Density and Walkable Communities Reid Ewing Professor & Chair City and Metropolitan Planning University of Utah ewing@arch.utah.edu Department of City & Metropolitan Planning, University of Utah MRC Research
The Elusive Connection between Density and Transit Use
 The Elusive Connection between Density and Transit Use Abstract: The connection between density and transportation is heralded by planners, yet results are often elusive. This paper analyzes two regions,
HI SUMMER WORK
 HI-201 2018-2019 SUMMER WORK This packet belongs to: Dear Dual Enrollment Student, May 7 th, 2018 Dual Enrollment United States History is a challenging adventure. Though the year holds countless hours
C) Discuss two factors that are contributing to the rapid geographical shifts in urbanization on a global scale.
 Discuss two factors that are contributing to the rapid geographical shifts in urbanization on a global scale.") AP Human Geography Unit VII. Cities and Urban Land Use Free Response Questions FRQ 1 Rapid urbanization in Least Developed Countries (LDCs) has many profound impacts for the world. Answer the following
AP Human Geography Unit VII. Cities and Urban Land Use Free Response Questions FRQ 1 Rapid urbanization in Least Developed Countries (LDCs) has many profound impacts for the world. Answer the following
Online Appendix for Inventory and Shipment Policies for the Online Movie DVD Rental Industry
 Online Appendix for Inventory and Shipment Policies for the Online Movie DVD Rental Industry Kyung Sung Jung, Casey Chung, Shun-Chen Niu, Chelliah Sriskandarajah e-mail: ksjung@ufl.edu, cxchung@caleres.com,
Inter and Intra Buffer Variability: A Case Study Using Scale
 Georgia State University ScholarWorks @ Georgia State University Art and Design Faculty Publications Ernest G. Welch School of Art and Design 2015 Inter and Intra Buffer Variability: A Case Study Using
Hotel Industry Overview. UPDATE: Trends and outlook for Northern California. Vail R. Brown
 Hotel Industry Overview UPDATE: Trends and outlook for Northern California Vail R. Brown Senior Vice President, Global Business Development & Marketing vbrown@str.com @vail_str 2016 STR, Inc. All Rights
Access Across America: Transit 2017
 Access Across America: Transit 2017 Final Report Prepared by: Andrew Owen Brendan Murphy Accessibility Observatory Center for Transportation Studies University of Minnesota CTS 18-12 1. Report No. CTS
Kathryn Robinson. Grades 3-5. From the Just Turn & Share Centers Series VOLUME 12
 1 2 From the Just Turn & Share Centers Series VOLUME 12 Temperature TM From the Just Turn & Share Centers Series Kathryn Robinson 3 4 M Enterprises WriteMath Enterprises 2303 Marseille Ct. Suite 104 Valrico,
A STRUCTURAL ANALYSIS OF THE STREETS NETWORK TO URBAN FABRIC CHARACTERIZATION
 CO-165 A STRUCTURAL ANALYSIS OF THE STREETS NETWORK TO URBAN FABRIC CHARACTERIZATION HAMAINA R., LEDUC T., MOREAU G. Centre d'études et recherches méthodologiques d'architecture, NANTES, FRANCE ABSTRACT
1. Evaluation of maximum daily temperature
 1. Evaluation of maximum daily temperature The cumulative distribution of maximum daily temperature is shown in Figure S1. Overall, among all of the 23 states, the cumulative distributions of daily maximum
Compact city policies: a comparative assessment
 Compact city policies: a comparative TADASHI MATSUMOTO Organisation for Economic Co-operation and Development (OECD) Presentation at the UNECE-OECD seminar September 26, 2012, Geneva Outline of the study
Speed. June Victor Couture (U. Toronto) Gilles Duranton (U. Toronto) Matt Turner (U. Toronto)
 Gilles Duranton (U. Toronto) Matt Turner (U. Toronto)") Speed June 2012 Victor Couture (U. Toronto) Gilles Duranton (U. Toronto) Matt Turner (U. Toronto) Objectives: Assess differences in driving speed across us metropolitan areas Explore their determinants
Speed June 2012 Victor Couture (U. Toronto) Gilles Duranton (U. Toronto) Matt Turner (U. Toronto) Objectives: Assess differences in driving speed across us metropolitan areas Explore their determinants
Chapter 4: Displaying and Summarizing Quantitative Data
 Chapter 4: Displaying and Summarizing Quantitative Data This chapter discusses methods of displaying quantitative data. The objective is describe the distribution of the data. The figure below shows three
22 cities with at least 10 million people See map for cities with red dots
 22 cities with at least 10 million people See map for cities with red dots Seven of these are in LDC s, more in future Fastest growing, high natural increase rates, loss of farming jobs and resulting migration
MEASURING RACIAL RESIDENTIAL SEGREGATION
 MEASURING RACIAL RESIDENTIAL SEGREGATION Race Relations Institute Fisk University 1000 Seventeenth Ave. North Nashville, Tennessee 37208 615/329-8575 WHERE WE LIVE: THE COLOR LINE The color line is carved
Your Galactic Address
 How Big is the Universe? Usually you think of your address as only three or four lines long: your name, street, city, and state. But to address a letter to a friend in a distant galaxy, you have to specify
Access Across America: Transit 2016
 Access Across America: Transit 2016 Final Report Prepared by: Andrew Owen Brendan Murphy Accessibility Observatory Center for Transportation Studies University of Minnesota David Levinson School of Civil
NCTCOG Regional GIS Meeting 6-Years and Going Strong. May 15, 2018 hosted by: Tarrant County
 NCTCOG Regional GIS Meeting 6-Years and Going Strong May 15, 2018 hosted by: Tarrant County Woolpert at a Glance 1911 Founded in Dayton, Ohio 25+ Offices across the nation 800+ Global employees 25+ OFFICES
Road Network Analysis as a Means of Socio-spatial Investigation the CoMStaR 1 Project
 Road Network Analysis as a Means of Socio-spatial Investigation the CoMStaR 1 Project F. Anders 1, R. König 1 1 Bauhaus-University Weimar, Faculty of Architecture, Chair Computer Science in Architecture,
A study of Spatial Analysis using Space Syntax. Table of Contents
 A study of Spatial Analysis using Space Syntax Oh, ChungWeon *, Hwang, Chulsue ** Table of Contents I. Introduction... 2 II. Spatial Structure... 2 1. Urban spatial structure... 2 2. New town development...
Using the ACS to track the economic performance of U.S. inner cities
 Using the ACS to track the economic performance of U.S. inner cities 2017 ACS Data Users Conference May 11, 2017 Austin Nijhuis, Senior Research Analyst Initiative for a Competitive Inner (ICIC) ICIC ICIC
Lab Activity: Weather Variables
 Name: Date: Period: Weather The Physical Setting: Earth Science Lab Activity: Weather Variables INTRODUCTION: A meteorologist is an individual with specialized education who uses scientific principles
Cluster Analysis. Part of the Michigan Prosperity Initiative
 Cluster Analysis Part of the Michigan Prosperity Initiative 6/17/2010 Land Policy Institute Contributors Dr. Soji Adelaja, Director Jason Ball, Visiting Academic Specialist Jonathon Baird, Research Assistant
New Partners for Smart Growth: Building Safe, Healthy, and Livable Communities Mayor Jay Williams, Youngstown OH
 New Partners for Smart Growth: Building Safe, Healthy, and Livable Communities Mayor Jay Williams, Youngstown OH The City of Youngstown Youngstown State University Urban Strategies Inc. Youngstown needed
Lecture 7: Cellular Automata Modelling: Principles of Cell Space Simulation
 SCHOOL OF GEOGRAPHY Lecture 7: Cellular Automata Modelling: Principles of Cell Space Simulation Outline Types of Urban Models Again The Cellular Automata Approach: Urban Growth and Complexity Theory The
Triangle-mapping Analysis on Spatial Competition and Cooperation of Chinese Cities
 Triangle-mapping Analysis on Spatial Competition and Cooperation of Chinese Cities arxiv:1801.00641v1 [physics.soc-ph] 2 Jan 2018 Pan Liu, Xiao-Pu Han, and Linyuan Lü, Alibaba Research Center for Complexity
Measures of Urban Patterns in Large Urban Areas in the U.S.,
 Measures of Urban Patterns in Large Urban Areas in the U.S., 1950-2010 Abstract John R. Ottensmann Indiana University-Purdue University Indianapolis john.ottensmann@gmail.com urbanpatternsblog.wordpress.com
Solving Quadratic Equations by Graphing 6.1. ft /sec. The height of the arrow h(t) in terms
 in terms") Quadratic Function f ( x) ax bx c Solving Quadratic Equations by Graphing 6.1 Write each in quadratic form. Example 1 f ( x) 3( x + ) Example Graph f ( x) x + 6 x + 8 Example 3 An arrow is shot upward
Quadratic Function f ( x) ax bx c Solving Quadratic Equations by Graphing 6.1 Write each in quadratic form. Example 1 f ( x) 3( x + ) Example Graph f ( x) x + 6 x + 8 Example 3 An arrow is shot upward
ASSESSING ACCURACY: HOTEL HORIZONS FORECASTS
 ASSESSING ACCURACY: HOTEL HORIZONS FORECASTS April 13, 2016 EXECUTIVE SUMMARY The US hotel industry had another strong year in 2015 with RevPAR up 6.3 percent over the prior year. In this report, we examine
Transferability of Household Travel Data Across Geographic Areas Using NHTS 2001
 Transferability of Household Travel Data Across Geographic Areas Using NHTS 2001 Jane Lin PhD Assistant Professor Department of Civil and Materials Engineering Institute for Environmental Science and Policy
Simulating urban growth in South Asia: A SLEUTH application
 Simulating urban growth in South Asia: A SLEUTH application Gargi Chaudhuri* 1 1 1725 State St., 2022 Cowley Hall, Department of Geography and Earth Science, University of Wisconsin-La Crosse *Email: gchaudhuri@uwlax.edu
COMMUTING ANALYSIS IN A SMALL METROPOLITAN AREA: BOWLING GREEN KENTUCKY
 Papers of the Applied Geography Conferences (2007) 30: 86-95 COMMUTING ANALYSIS IN A SMALL METROPOLITAN AREA: BOWLING GREEN KENTUCKY Caitlin Hager Jun Yan Department of Geography and Geology Western Kentucky
Investigation 11.3 Weather Maps
 Name: Date: Investigation 11.3 Weather Maps What can you identify weather patterns based on information read on a weather map? There have been some amazing technological advancements in the gathering and
Nursing Facilities' Life Safety Standard Survey Results Quarterly Reference Tables
 Nursing Facilities' Life Safety Standard Survey Results Quarterly Reference Tables Table of Contents Table 1: Summary of Life Safety Survey Results by State Table 2: Ten Most Frequently Cited Life Safety
JUPITER MILLER BUSINESS CENTER 746,400 SF FOR LEASE
 746,400 SF FOR LEASE Three LEED Certified Cross-Dock Buildings 54,600 Square Feet to 746,400 Square Feet Available Dallas City of Tax Incentives Available 36 Clear Height (Over 25% More Pallet Positions
Urban Revival in America
 Urban Revival in America Victor Couture 1 Jessie Handbury 2 1 University of California, Berkeley 2 University of Pennsylvania and NBER May 2016 1 / 23 Objectives 1. Document the recent revival of America
Lecture 7: Cellular Automata Modelling: Principles of Cell Space Simulation
 MRes in Advanced Spatial Analysis and Visualisation Lecture 7: Cellular Automata Modelling: Principles of Cell Space Simulation Outline Types of Urban Models Again The Cellular Automata Approach: Urban
Evolution Strategies for Optimizing Rectangular Cartograms
 Evolution Strategies for Optimizing Rectangular Cartograms Kevin Buchin 1, Bettina Speckmann 1, and Sander Verdonschot 2 1 TU Eindhoven, 2 Carleton University September 20, 2012 Sander Verdonschot (Carleton
34 ab ArchitectureBoston
 Postmodern theorists writing in the late 20th-century once surmised that, during an era of airplanes, cell phones, and the Internet, the importance of geographical space was quickly diminishing. The French
Spatial Thinking and Modeling of Network-Based Problems
 Spatial Thinking and Modeling of Network-Based Problems Presentation at the SPACE Workshop Columbus, Ohio, July 1, 25 Shih-Lung Shaw Professor Department of Geography University of Tennessee Knoxville,
Employment Decentralization and Commuting in U.S. Metropolitan Areas. Symposium on the Work of Leon Moses
 Employment Decentralization and Commuting in U.S. Metropolitan Areas Alex Anas Professor of Economics University at Buffalo Symposium on the Work of Leon Moses February 7, 2014 9:30-11:15am, and 2:30-4:30pm
The 3V Approach. Transforming the Urban Space through Transit Oriented Development. Gerald Ollivier Transport Cluster Leader World Bank Hub Singapore
 Transforming the Urban Space through Transit Oriented Development The 3V Approach Gerald Ollivier Transport Cluster Leader World Bank Hub Singapore MDTF on Sustainable Urbanization The China-World Bank
Exploration of the Complex Similarity of Urban System Components
 Exploration of the Complex Similarity of Urban System Components Farideddin Peiravian Matthieu de Lapparent Sybil Derrible 21 January 2015 Report TRANSP-OR 150121 Transport and Mobility Laboratory Ecole
The Americas Political Map Ng Country Region Maps
 We have made it easy for you to find a PDF Ebooks without any digging. And by having access to our ebooks online or by storing it on your computer, you have convenient answers with the americas political
APPENDIX C-3 Equitable Target Areas (ETA) Technical Analysis Methodology
 Technical Analysis Methodology") APPENDIX C-3 Equitable Target Areas (ETA) Technical Analysis Methodology Contents Introduction... 1 ETA Index Methodology... 1 ETA Index Development... 1 Other EJ Measures... 4 The Limited English Proficiency
APPENDIX C-3 Equitable Target Areas (ETA) Technical Analysis Methodology Contents Introduction... 1 ETA Index Methodology... 1 ETA Index Development... 1 Other EJ Measures... 4 The Limited English Proficiency
Encapsulating Urban Traffic Rhythms into Road Networks
 Encapsulating Urban Traffic Rhythms into Road Networks Junjie Wang +, Dong Wei +, Kun He, Hang Gong, Pu Wang * School of Traffic and Transportation Engineering, Central South University, Changsha, Hunan,
DEVELOPING DECISION SUPPORT TOOLS FOR THE IMPLEMENTATION OF BICYCLE AND PEDESTRIAN SAFETY STRATEGIES
 DEVELOPING DECISION SUPPORT TOOLS FOR THE IMPLEMENTATION OF BICYCLE AND PEDESTRIAN SAFETY STRATEGIES Deo Chimba, PhD., P.E., PTOE Associate Professor Civil Engineering Department Tennessee State University
Neighborhood Locations and Amenities
 University of Maryland School of Architecture, Planning and Preservation Fall, 2014 Neighborhood Locations and Amenities Authors: Cole Greene Jacob Johnson Maha Tariq Under the Supervision of: Dr. Chao
Lecture 26 Section 8.4. Mon, Oct 13, 2008
 Lecture 26 Section 8.4 Hampden-Sydney College Mon, Oct 13, 2008 Outline 1 2 3 4 Exercise 8.12, page 528. Suppose that 60% of all students at a large university access course information using the Internet.
The Building Blocks of the City: Points, Lines and Polygons
 The Building Blocks of the City: Points, Lines and Polygons Andrew Crooks Centre For Advanced Spatial Analysis andrew.crooks@ucl.ac.uk www.gisagents.blogspot.com Introduction Why use ABM for Residential
The Spatial Structure of Cities in the United States
 The Spatial Structure of Cities in the United States Gerrit-Jan Knaap, Rebecca Lewis and Jamie Schindewolf In recent years, the spatial structure of cities has become the subject of considerable interest,
Meteorology 110. Lab 1. Geography and Map Skills
 Meteorology 110 Name Lab 1 Geography and Map Skills 1. Geography Weather involves maps. There s no getting around it. You must know where places are so when they are mentioned in the course it won t be
Uncovering the Digital Divide and the Physical Divide in Senegal Using Mobile Phone Data
 Uncovering the Digital Divide and the Physical Divide in Senegal Using Mobile Phone Data Song Gao, Bo Yan, Li Gong, Blake Regalia, Yiting Ju, Yingjie Hu STKO Lab, Department of Geography, University of
transportation research in policy making for addressing mobility problems, infrastructure and functionality issues in urban areas. This study explored
 ABSTRACT: Demand supply system are the three core clusters of transportation research in policy making for addressing mobility problems, infrastructure and functionality issues in urban areas. This study
A Topological Pattern of Urban Street Networks: Universality and Peculiarity. Bin Jiang
 A Topological Pattern of Urban Street Networks: Universality and Peculiarity Bin Jiang Department of Land Surveying and Geo-informatics The Hong Kong Polytechnic University, Hung Hom, Kowloon, Hong Kong
Place Syntax Tool (PST)
") Place Syntax Tool (PST) Alexander Ståhle To cite this report: Alexander Ståhle (2012) Place Syntax Tool (PST), in Angela Hull, Cecília Silva and Luca Bertolini (Eds.) Accessibility Instruments for Planning
Place Syntax Tool (PST) Alexander Ståhle To cite this report: Alexander Ståhle (2012) Place Syntax Tool (PST), in Angela Hull, Cecília Silva and Luca Bertolini (Eds.) Accessibility Instruments for Planning
BROOKINGS May
 Appendix 1. Technical Methodology This study combines detailed data on transit systems, demographics, and employment to determine the accessibility of jobs via transit within and across the country s 100
Understanding the Impact of Weather for POI Recommendations
 S C I E N C E P A S S I O N T E C H N O L O G Y Understanding the Impact of Weather for POI Recommendations Christoph Trattner, Alex Oberegger, Lukas Eberhard, Denis Parra, Leandro Marinho, Know-Center@Graz
ASSOCIATION OF SCIENCE MUSEUM DIRECTORS OFFICER INFORMATION FROM INCEPTION IN 1959 TO TODAY
 ASSOCIATION OF SCIENCE MUSEUM DIRECTORS OFFICER INFORMATION FROM INCEPTION IN 1959 TO TODAY 2018 Sarah George, Natural History Museum of Utah, Salt Lake City Utah Vice- Julie Stein, Burke Museum, Seattle,
Invoice Information. Remittance Account Number: Invoice Number: Invoice Date: Due Date: Total Amount Due: PLEASE SEND PAYMENT TO:
 Easton Telecom Services, LLC PO Box 550 Richfield, OH 44286 Customer Service: 800-222-8122 Fax Number: 800-227-8420 custservice@eastontel.com Invoice Information Billing Summary Descriptions Charges /
Land-Use Controls, Natural Restrictions, and Urban Residential Land Prices
 Review of Regional Studies 1999, 29(2), 105-114 105 Land-Use Controls, Natural Restrictions, and Urban Residential Land Prices Krisandra Guidry, James D. Shilling, and C.F. Sirmans* Abstract: Research
15.0 Operations and Maintenance Cost Calculations
 15.0 Operations and Maintenance Cost Calculations 15.1 Introduction Operations and Maintenance (O&M) costs were calculated for each of the four alternatives being considered in the analysis. No Build Alternative
Neighborhood social characteristics and chronic disease outcomes: does the geographic scale of neighborhood matter? Malia Jones
 Neighborhood social characteristics and chronic disease outcomes: does the geographic scale of neighborhood matter? Malia Jones Prepared for consideration for PAA 2013 Short Abstract Empirical research
MULTIPLE CHOICE. Choose the one alternative that best completes the statement or answers the question.
 AP Test 13 Review Name MULTIPLE CHOICE. Choose the one alternative that best completes the statement or answers the question. 1) Compared to the United States, poor families in European cities are more
RNR 516A. Computer Cartography. Spring GIS Portfolio
 RNR 516A Computer Cartography Spring 2016 GIS Portfolio 1 Contents 1 Political and Locator Maps 3 2 Base Maps and Digitizing 4 3 Data Entry Report 5 4 Projections and Symbolization 6 5 Choropleth Mapping
The Vulnerable: How Race, Age and Poverty Contribute to Tornado Casualties
 The Vulnerable: How Race, Age and Poverty Contribute to Tornado Casualties Tyler Fricker Department of Geography, Florida State University February 28, 2018 Who Survives? Credit: Dayton Daily News Take-Home
Do Regions Matter for the Behavior of City Relative Prices in the U. S.?
 The Empirical Economics Letters, 8(11): (November 2009) ISSN 1681 8997 Do Regions Matter for the Behavior of City Relative Prices in the U. S.? Viera Chmelarova European Central Bank, Frankfurt, Germany
Parametric Test. Multiple Linear Regression Spatial Application I: State Homicide Rates Equations taken from Zar, 1984.
 Multiple Linear Regression Spatial Application I: State Homicide Rates Equations taken from Zar, 984. y ˆ = a + b x + b 2 x 2K + b n x n where n is the number of variables Example: In an earlier bivariate
Chapter 5. GIS The Global Information System
 Chapter 5 GIS The Global Information System What is GIS? We have just discussed GPS a simple three letter acronym for a fairly sophisticated technique to locate a persons or objects position on the Earth
Growth of Urban Areas. Urban Hierarchies
 Growth of Urban Areas Urban Hierarchies Directions: In your notebook, complete the following on the right: Create a chart to explain and analyze the gravity model, central place theory, bid-rent theory,
A Method to Reduce the Modifiable Areal Unit Problem in Measuring Urban Form Metrics
 A Method to Reduce the Modifiable Areal Unit Problem in Measuring Urban Form Metrics Dr. Abdul Naser Arafat Keywords: urban, modifiable Areal Unit Problem, Transportation planning, GIS ABSTRACT The relationship
Modeling Urban Sprawl: from Raw TIGER Data with GIS
 Modeling Urban Sprawl: from Raw TIGER Data with GIS Brady Foust University of Wisconsin-Eau Claire Lisa Theo University of Wisconsin-Stevens Point Modeling Urban Sprawl 1 Problem How to model & predict
Confeego: Tool Set for Spatial Configuration Studies
 14 Confeego: Tool Set for Spatial Configuration Studies Jorge Gil, Chris Stutz and Alain Chiaradia Space Syntax Limited, London, UK Abstract. Confeego is a suite of tools to understand and harness the
P. O. Box 5043, 2600 CR Delft, the Netherlands, Building, Pokfulam Road, Hong Kong,
 THE THEORY OF THE NATURAL URBAN TRANSFORMATION PROCESS: THE RELATIONSHIP BETWEEN STREET NETWORK CONFIGURATION, DENSITY AND DEGREE OF FUNCTION MIXTURE OF BUILT ENVIRONMENTS Akkelies van Nes 1, Yu Ye 2 1
Economic and Social Urban Indicators: A Spatial Decision Support System for Chicago Area Transportation Planning
 Economic and Social Urban Indicators: A Spatial Decision Support System for Chicago Area Transportation Planning Piyushimita Thakuriah (Vonu), P.S. Sriraj, Paul Metaxatos, Inshu Minocha & Tanushri Swarup
INTERNATIONAL JOURNAL OF GEOMATICS AND GEOSCIENCES Volume 2, No 2, 2011
 INTERNATIONAL JOURNAL OF GEOMATICS AND GEOSCIENCES Volume 2, No 2, 2011 Copyright 2010 All rights reserved Integrated Publishing services Research article ISSN 0976 4380 A Novel approach to the Identification
Móstoles, Spain. Keywords: complex networks, dual graph, line graph, line digraph.
 Int. J. Complex Systems in Science vol. 1(2) (2011), pp. 100 106 Line graphs for directed and undirected networks: An structural and analytical comparison Regino Criado 1, Julio Flores 1, Alejandro García
Heat and Health: Reducing the Impact of the Leading Weather-Related Killer
 Heat and Health: Reducing the Impact of the Leading Weather-Related Killer Laurence S. Kalkstein, Ph.D. Department of Public Health Sciences Miller School of Medicine University of Miami June, 2017 Quick
Problems In Large Cities
 Chapter 11 Problems In Large Cities Create a list of at least 10 problems that exist in large cities. Consider problems that you have read about in this and other chapters and/or experienced yourself.
Where Transit Use Is Growing: Surprising Results
 Where Transit Use Is Growing: Surprising Results Gregory L. Thompson, Jeffrey R. Brown, Rupa Sharma, and Samuel Scheib Florida State University Abstract This article investigates whether transit s fate
Map directions are broken down into 2 main types; Cardinal Directions and Intermediate Directions SW S
 ELEMENTS OF MAPS COMPASS ROSE AND DIRECTIONS When reading a map it s always important to know your directions. The Compass Rose is the tool to help you do that. Map directions are broken down into 2 main
A topological pattern of urban street networks: Universality and peculiarity
 Physica A 384 (27) 647 655 www.elsevier.com/locate/physa A topological pattern of urban street networks: Universality and peculiarity Bin Jiang Department of Land Surveying and Geo-informatics, The Hong
Sample Statistics 5021 First Midterm Examination with solutions
 THE UNIVERSITY OF MINNESOTA Statistics 5021 February 12, 2003 Sample First Midterm Examination (with solutions) 1. Baseball pitcher Nolan Ryan played in 20 games or more in the 24 seasons from 1968 through
Prepared for: San Diego Association Of Governments 401 B Street, Suite 800 San Diego, California 92101
 Activity-Based Travel Model Validation for 2012 Using Series 13 Data: Coordinated Travel Regional Activity Based Modeling Platform (CT-RAMP) for San Diego County Prepared for: San Diego Association Of
Appendixx C Travel Demand Model Development and Forecasting Lubbock Outer Route Study June 2014
 Appendix C Travel Demand Model Development and Forecasting Lubbock Outer Route Study June 2014 CONTENTS List of Figures-... 3 List of Tables... 4 Introduction... 1 Application of the Lubbock Travel Demand
I. Peterson Science News
 1006-3862 2017 12-0008 - 08 1 2 1. 100871 2. Department of Geography and Planning University at Albany State University of New York Albany NY USA urban agglomeration system of cities urban agglomeration
Five Themes of Geography Project Ms. Kiesel, Per 5. The United States of America
 Five Themes of Geography Project Ms. Kiesel, Per 5 The United States of America Location Absolute Location : The USA is located in the continent of North America in the northern and western hemispheres.
Optimizing Urban Modeling based on Road Network and Land Use/Cover Changes by Using Agent Base Cellular Automata Model
 Optimizing Urban Modeling based on Road Network and Land Use/Cover Changes by Using Agent Base Cellular Automata Model Yousef Khajavigodellou 1, A. A. Alesheikh 2, Farshad Hakimpour 3, Kamra Chapi 4 1
Cell-based Model For GIS Generalization
 Cell-based Model For GIS Generalization Bo Li, Graeme G. Wilkinson & Souheil Khaddaj School of Computing & Information Systems Kingston University Penrhyn Road, Kingston upon Thames Surrey, KT1 2EE UK
AGEC 603. Stylized Cited Assumptions. Urban Density. Urban Density and Structures. q = a constant density the same throughout
 AGEC 603 Urban Density and Structures Stylized Cited Assumptions q = a constant density the same throughout c = constant structures the same throughout Reality housing is very heterogeneous Lot size varies