Kathryn Robinson. Grades 3-5. From the Just Turn & Share Centers Series VOLUME 12
|
|
|
- Hillary Washington
- 6 years ago
- Views:
Transcription
1 1 2 From the Just Turn & Share Centers Series VOLUME 12 Temperature TM From the Just Turn & Share Centers Series Kathryn Robinson 3 4 M Enterprises WriteMath Enterprises 2303 Marseille Ct. Suite 104 Valrico, FL Grades
2 III Temperature is a great center in the Just Turn & Share Series. This series gives students daily practice in 16 math areas or a math topic of your preference. After gradually working in a center-based atmosphere, students can tackle all 16 centers in half an hour. This program can be used in conjunction with any regular math series. Some students have difficulty attaining proficiency in specific math areas due to the limited practice provided by a textbook. Just Turn & Share math centers provide realworld practice with mathematical concepts. The series is designed for center-based review of concepts or as whole-group overhead instruction. These lessons are designed to provide practice for 30 weeks of the school year. The program contains three-week sets worth of practice in each concept. Each concept is covered for three weeks before a new concept is introduced to the students. During each three-week period, only the numbers change - not the concepts. The first week is designed as a review of the concept, the second provides further practice, and the third is set apart for mastery of the concept. As your students become more proficient in one particular concept, you might choose to eliminate the third week set to move to a new concept. The third week then serves as a review during the last ten weeks of the year or intensive practice prior to standardized testing. The new concept for the week is listed in the Table of Contents. At the onset of a new concept, we recommend that teachers conduct a mini-lesson before releasing students to work the centers. Each center contains conceptinformation sheets with student-directions about how to perform individual concepts. These information sheets have a third-grade readability level. I recommend that the information sheets remain at the centers as long as possible to accommodate new students entering the class throughout the year. Many weeks in the series contain reference sheets that contain data that students will need to perform certain operations. Both the information sheets and reference sheets are located at the beginning of each week.

3 This center contains: 1. Information sheets designed to remain at the center. 2. Nine sets of maps and charts that list mathematical information to complete the activities. Suggestion: A Fahrenheit & Celsius thermometer that registers the temperature inside and outdoors will help the students with the concepts. Each center sheet should be placed in a plastic protective cover. IV Each center is designed for grades 3 through 5 as follows: (*) Grade 3 students calculate the single asterisk activities (**) Grade 4 students calculate the double asterisk activities (***) Grade 5 students calculate the triple asterisk activities If you are using more than five centers in the classroom, I recommend using the answer sheet to help students keep track of the completed centers. Accompanying each complete set is a set of corrected answer sheets that help students self-correct their responses. Students self-correct their answer sheets three out of the four days. Self-correction prevents embarrassment and allows students time to practice each concept before an assessment. I place a sign-up sheet in the classroom to allow students to sign up for assistance in their less proficient areas. I assist those that have signed up for help during the next day s Center Time. The fourth day of each week is teacher-corrected and entered in a grade book. If you have any questions please feel free to us on our website: I know that you will have as much fun employing this program as I have had designing it. Remember the program is as simple as turning each page and sharing the activities with your class. So go ahead just with your students.
4 VIII Introduction... III Blank Answer Sheet... VI Contents... VIII Weather Map #1 Information... 2 Temperature Across the Nation #1 Information... 3 Fahrenheit Thermometer... 4 Week 1: Freezing Temperature... 5 Boiling Temperature of Water Body Temperature Week 2: Using a Thermometer... 9 Judging Temperatures Week 3: Using a Thermometer Judging Temperatures Week 4: Concepts of Thermometer Readings Highest Temperature of the Day Week 5: Concepts of Thermometer Readings Lowest Temperature of the Day Week 6: Concepts of Thermometer Readings Increasing & Decreasing Temperatures Temperature Information Fahrenheit & Celsius Thermometer Weather Map #2 Information Temperatures Across the Nation #
5 IX Week 7: Concepts of Thermometer Readings Estimating Temperatures Comparing Temperatures Week 8: Concepts of Thermometer Readings Estimating Temperatures Comparing Temperatures Week 9: Concepts of Thermometer Readings Estimating Temperatures Comparing Temperatures Weather Map #3 Information Temperatures Across the Nation #3 Information Week 10: Precipitation Estimating Temperatures Comparing Temperatures Week 11 Precipitation Estimating Temperatures Comparing Temperatures Week 12:Precipitaion Estimating Temperatures Comparing Temperatures Weather Map #4 Information Temperatures Across the Nation #4 Information Week 13:Weather Conditions Estimating Temperatures
6 Week 14:Weather Conditions Estimating Temperatures Week 15:Weather Conditions Estimating Temperatures Weather Map #5 Information Temperatures Across the Nation #5 Information Week 16:Cold Front Information Estimating Temperatures Week 17:Cold Front Information Estimating Temperatures Week 18:Cold Front Information Estimating Temperatures Weather Map #6 Information Temperatures Across the Nation #6 Information Week 19:Comparing Temperatures Sky Conditions Week 20:Comparing Temperatures Sky Conditions X
7 Week 21:Comparing Temperatures Sky Conditions Weather Map #7 Information Temperatures Across the Nation #7 Information Week 22:Comparing Temperatures Sky Conditions Week 23:Comparing Temperatures Sky Conditions Week 24:Comparing Temperatures Sky Conditions Weather Map #8 Information Temperatures Across the Nation #8 Information Week 25:Estimating Temperatures Averaging Temperatures Week 26:Estimating Temperatures Averaging Temperatures Week 27:Estimating Temperatures Averaging Temperatures XI
8 1 2 Weather Map #9 Information Temperatures Across the Nation #9 Information Week 28:Estimating Temperatures Averaging Temperatures Week 29:Estimating Temperatures Averaging Temperatures Week 30:Estimating Temperatures Averaging Temperatures Answer Sheet XII 3 4 M 5 6 WriteMath Enterprises
9 Temperature: Week 7 29 is the measure of how hot or cold an object is in relation to a standard value (degrees). There are two common systems of measurement: Fahrenheit Celsius Water boils 212 F Water boils 100 C Normal Body Temperature 98.6 F Normal Body Temperature 37 C Water freezes 32 F Water freezes 0 C The is found commonly in the United States. The units of measure in this system are in Fahrenheit degrees. ( F ) The is becoming more common in the United States. The units of measure in this system are in Celsius degrees. ( C) In both systems a rise in temperature means that the weather (or object) is becoming warmer. (e.g.: A rise in temperature from 5 F to 10 F means that the weather has become warmer by 5 degrees.) The temperature dropping means that the object or weather is becoming colder. (e.g.: A fall in temperature from 10 F to 5 F means that the weather has become cooler by 5 degrees).
10 Temperature: Week Water boils 100 C Water boils 212 F Normal Body Temperature 37 C Normal Body Temperature 98.6 F Water freezes 0 C Water freezes 32 F


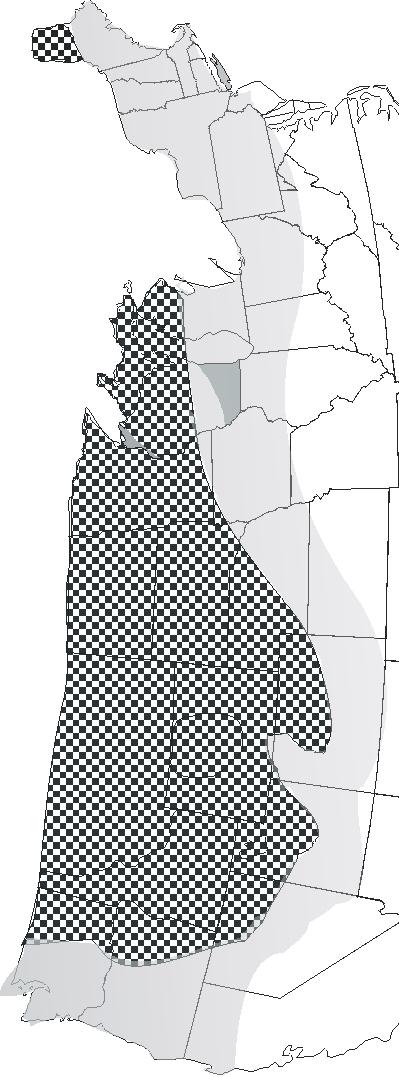

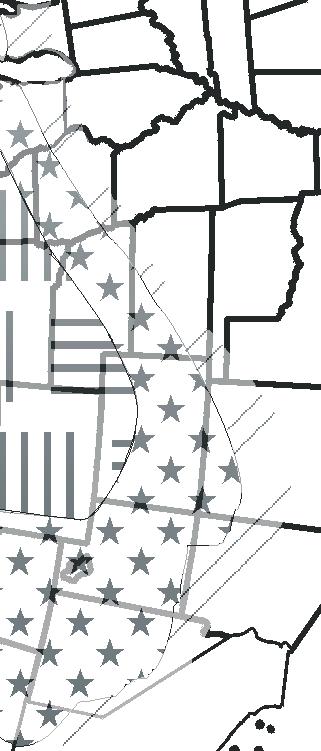
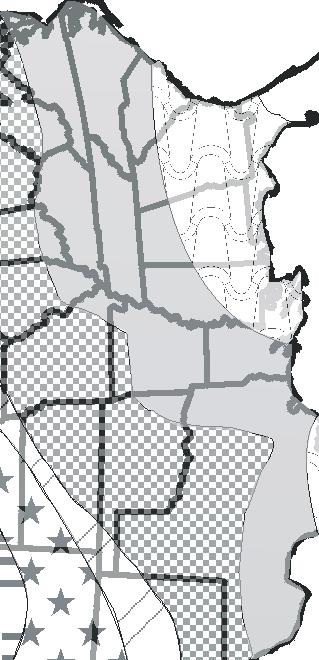
11 Temperature: Week 7 31 Below 0 80 s 90 s +100 s Predicted high temperatures 0 s 10 s 20 s 30 s 40 s 50 s 60 s 70 s

12 Temperature: Week 7 32 City H º L º P City H º L º P Albany Little Rock Albuquerque Los Angeles Amarillo Louisville Anchorage Memphis Asheville Miami Atlanta Milwaukee Atlantic City Minneapolis/St. Paul Baltimore Mobile Billings Nashville Birmingham New Orleans Bismarck New York Boise Norfolk Boston Oklahoma City Brownsville Omaha Buffalo Peoria Burlington, VT Philadelphia Casper Phoenix Charleston, SC Pittsburgh Charleston, WV Portland, ME Charlotte Portland. OR Chicago Providence Cincinnati Raleigh Cleveland Reno Columbus, OH Richmond Concord, NH Sacramento Dallas/Fort Worth St. Louis Denver Salt Lake City Des Moines San Diego Detroit San Francisco Duluth Sault Sainte Marie Fargo Seattle Fort Wayne Sioux Falls Hartford Spokane Honolulu Syracuse Houston Tallahassee Indianapolis Tucson Jackson, MS Washington Jacksonville West Palm Beach Kansas City Wichita Key West Wilkes-Barre Las Vegas Wilmington, DE


13 Temperature: Week 7 33 Look at Weather Map #2: Will the temperatures in Massachusetts be in the 90 F range? Look at the Temperature Across the Nation #2 chart: Was it warmer in West Palm Beach, Florida or Dallas, Texas? Look at the classroom thermometer: What is the temperature in Fahrenheit inside your classroom today? Write the temperature for in Celsius. Choose the most reasonable temperature for your classroom. -20 F 0 F 30 F 70 F * A, B, & E ** A, B, & C *** A, D, & E
14 Temperature: Week 7 34 Look at Weather Map #2: Will the temperatures in Alabama be in the 40 F range? Look at the Temperatures Across the Nation #2 chart: Was it warmer in Cleveland, Ohio or Casper, Wyoming? Look at the classroom thermometer: What is the temperature in Fahrenheit inside your classroom today? Write the temperature for in Celsius. Choose the most reasonable temperature for a bath: - 20 F 0 F 50 F 80 F * A, B, & C ** A, B, & E *** A, C, & D
15 Temperature: Week 7 36 Look at Weather Map #2: Will the temperatures in North Dakota be in the 50 F range? Look at the Temperatures Across the Nation #2 chart: Was it warmer in Charleston, South Carolina or Key West, Florida? Look at the classroom thermometer: What is the temperature in Fahrenheit inside your classroom today? Write the temperature for in Celsius. Choose the most reasonable temperature for an ice cube: 0 F 60 F 42 F 212 F * A, B, & C ** A, B, & E *** A, C, & D


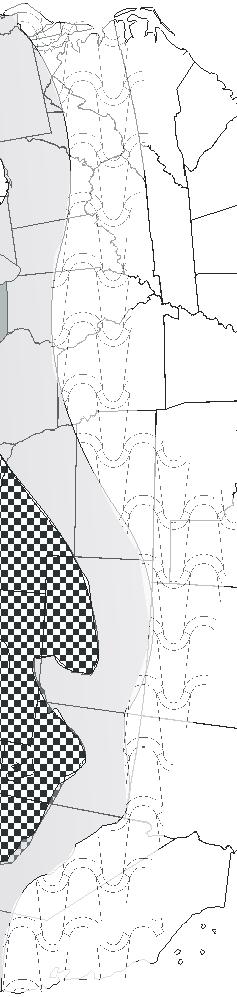
16 Temperature: Week Below 0 80 s 90 s +100 s Predicted high temperatures 0 s 10 s 20 s 30 s 40 s 50 s 60 s 70 s
17 Temperature: Week City H º L º P City H º L º P Albany Little Rock Albuquerque Los Angeles Amarillo Louisville Anchorage Memphis Asheville Miami Atlanta Milwaukee Atlantic City Minneapolis/St. Paul Baltimore Mobile Billings Nashville Birmingham New Orleans Bismarck New York Boise Norfolk Boston Oklahoma City Brownsville Omaha Buffalo Peoria Burlington, VT Philadelphia Casper Phoenix Charleston, SC Pittsburgh Charleston, WV Portland, ME Charlotte Portland. OR Chicago Providence Cincinnati Raleigh Cleveland Reno Columbus, OH Richmond Concord, NH Sacramento Dallas/Fort Worth St. Louis Denver Salt Lake City Des Moines San Diego Detroit San Francisco Duluth Sault Sainte Marie Fargo Seattle Fort Wayne Sioux Falls Hartford Spokane Honolulu Syracuse Houston Tallahassee Indianapolis Tucson Jackson, MS Washington Jacksonville West Palm Beach Kansas City Wichita Key West Wilkes-Barre Las Vegas Wilmington, DE
18 Temperature: Week Look at Weather Map #5: Which state s temperatures will be more than 20 higher than northern South Dakota? Idaho s Maine s Oklahoma s Does the map show a cold front moving through Colorado? Look at the Temperature Across the Nation #5 chart: How many degrees did the temperature drop in Albany, New York during one day? How much more did it rain in Boise, Idaho than in Buffalo, New York? Convert by looking at the Celsius-Fahrenheit Thermometer. What was the highest temperature in Pittsburgh, Pennsylvania on the Celsius scale? * A & E ** A, B, & D *** C, D, & E
19 Temperature: Week Look at Weather Map #5: Which state s temperatures will be at least 20 higher than Idaho s? eastern Washington s Arkansas Wisconsin s Does the map show a cold front moving through North Dakota? Look at the Temperature Across the Nation #5 chart: How many degrees did the temperature drop in Boise, Idaho during one day? How much more did it rain in Sacramento, California than in Tucson, Arizona? Convert by looking at the Celsius-Fahrenheit Thermometer. What was the highest temperature in Concord, New Hampshire on the Celsius scale? * A & C ** C, D, & E *** A, B, & E
20 Temperature: Week Look at Weather Map #5: Which state s temperatures will be at least 20 higher than Missouri s? Maine s Ohio s Florida s Does the map show a cold front moving through Arkansas? Look at the Temperature Across the Nation #4 chart: How many degrees did the temperature drop in Duluth, Minnesota during one day? How much more did it rain in Bismarck, North Dakota than in Charleston, West Virginia? Convert by looking at the Celsius-Fahrenheit Thermometer. What was the highest temperature in Salt Lake City, Utah on the Celsius scale? * A & E ** A, B, & D *** C, D, & E
21 Temperature: Week Look at Weather Map #5: Which state s temperatures will be at least 20 higher than eastern Oregon s? Texas New York s Idaho s Does the map show a cold front moving through Texas? Look at the Temperature Across the Nation #4 chart: How many degrees did the temperature drop in Fargo, North Dakota during one day? How much more did it rain in Casper, Wyoming than in Phoenix, Arizona? Convert by looking at the Celsius-Fahrenheit Thermometer. What was the highest temperature in Reno, Nevada on the Celsius scale? * A & B ** C, D, & E *** A, B, & E


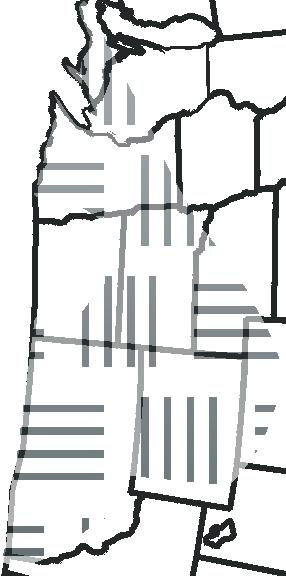
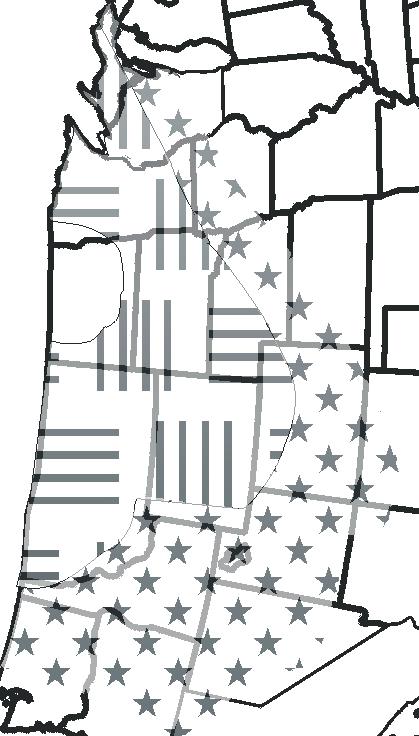
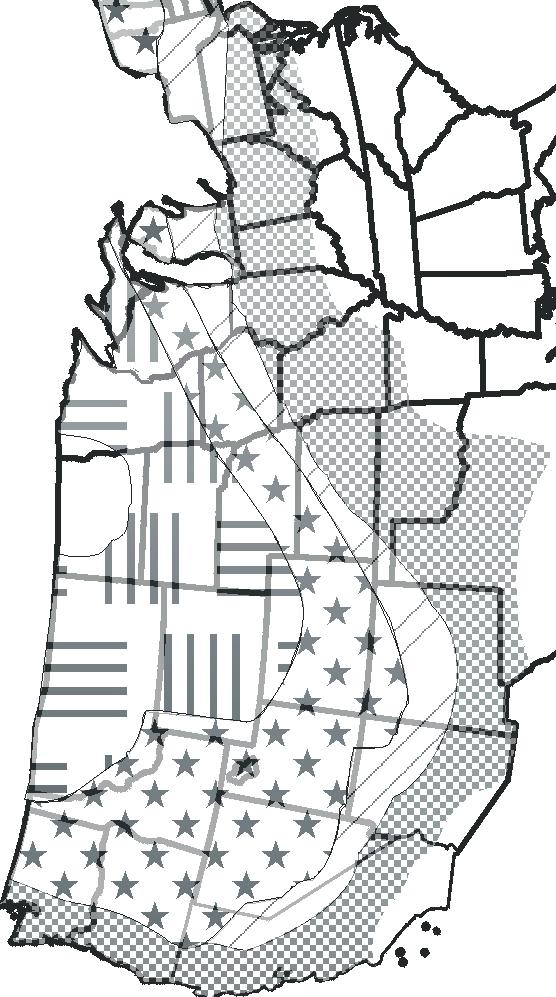
22 Temperature: Week Below 0 80 s 90 s +100 s Predicted high temperatures 0 s 10 s 20 s 30 s 40 s 50 s 60 s 70 s
23 Temperature: Week City H º L º Sky City H º L º Sky Albany s Little Rock s Albuquerque c Los Angeles pc Amarillo pc Louisville s Anchorage c Memphis s Asheville pc Miami pc Atlanta c Milwaukee s Atlantic City s Minneapolis/St. Paul s Baltimore s Mobile s Billings c Nashville s Birmingham s New Orleans pc Bismarck w New York s Boise pc Norfolk pc Boston s Oklahoma City pc Brownsville f Omaha s Buffalo s Peoria s Burlington, VT s Philadelphia s Casper f Phoenix pc Charleston, SC s Pittsburgh s Charleston, WV 20 6 fl Portland, ME s Charlotte pc Portland. OR sh Chicago s Providence s Cincinnati s Raleigh pc Cleveland s Reno pc Columbus, OH s Richmond f Concord, NH s Sacramento pc Dallas/Fort Worth pc St. Louis s Denver c Salt Lake City pc Des Moines s San Diego c Detroit s San Francisco pc Duluth s Sault Sainte Marie s Fargo c Seattle sh Fort Wayne s Sioux Falls s Hartford s Spokane c Honolulu pc Syracuse s Houston pc Tallahassee c Indianapolis s Tucson pc Jackson, MS s Washington s Jacksonville sh West Palm Beach pc Kansas City s Wichita f Key West pc Wilkes-Barre s Las Vegas c Wilmington, DE s
24 Temperature: Week Look at Weather Map #9: Which state will be more likely to have a thermometer reading of 24º C? Illinois Utah In which state should you bring an umbrella to work? North Carolina South Carolina Look at the Temperature Across the Nation #9 chart: How many degrees difference is there between a person s normal body temperature and the average temperature for the day in Spokane, Washington? Which city had a temperature change of 33º and sunny skies? Buffalo, New York Albany, New York Which is the most likely temperature for hot cocoa? 80º C 18º C 5º C * A & E ** A, B, & D *** C, D, & E
25 Temperature: Week Look at Weather Map #9: Which state will be more likely to have a thermometer reading of 24º C? Washington Florida In which state should you bring an umbrella to work? Texas Louisiana Look at the Temperature Across the Nation #9 chart: How many degrees difference is there between a person s normal body temperature and the average temperature for the day in St. Louis, Missouri? Which city had a temperature change of 7º and cloudy skies? Tucson, Arizona San Diego, California Which is the most likely temperature for a cold soda? 8º C 40º C 0º C * A & C ** C, D, & E *** A, B, & E
26 Temperature: Week Look at Weather Map #9: Which state will be more likely to have a thermometer reading of 24º C? North Carolina Alabama In which state should you bring an umbrella to work? New Mexico Colorado Look at the Temperature Across the Nation #9 chart: How many degrees difference is there between a person s normal body temperature and the average temperature for the day in Albuquerque, New Mexico? Which city had a temperature change of 22º and showers in the skies? Jacksonville, Florida Seattle, Washington Which is the most likely temperature for a warm bath? 15º C 55º C 25º C * A & E ** A, B, & D *** C, D, & E


27 Temperature: Week Look at Weather Map #9: Which state will be more likely to have a thermometer reading of 24º C? Wisconsin Idaho In which state should you bring an umbrella to work? Nevada Kansas Look at the Temperature Across the Nation #9 chart: How many degrees difference is there between a person s normal body temperature and the average temperature for the day in Peoria, Illinois? Which city had a temperature change of 20º and sunny skies? Washington, DC Memphis, Tennessee Which is the most likely temperature for a cold ham sandwich? 30º C 10º C 1º C * A & B ** C, D, & E *** A, B, & E
Chapter 4: Displaying and Summarizing Quantitative Data
 Chapter 4: Displaying and Summarizing Quantitative Data This chapter discusses methods of displaying quantitative data. The objective is describe the distribution of the data. The figure below shows three
, District of Columbia
 State Capitals These are the State Seals of each state. Fill in the blank with the name of each states capital city. (Hint: You may find it helpful to do the word search first to refresh your memory.),
NAWIC. National Association of Women in Construction. Membership Report. August 2009
 NAWIC National Association of Women in Construction Membership Report August 2009 Core Purpose: To enhance the success of women in the construction industry Region 1 67 Gr Washington, DC 9 16 2 3 1 0 0
Investigation 11.3 Weather Maps
 Name: Date: Investigation 11.3 Weather Maps What can you identify weather patterns based on information read on a weather map? There have been some amazing technological advancements in the gathering and
HI SUMMER WORK
 HI-201 2018-2019 SUMMER WORK This packet belongs to: Dear Dual Enrollment Student, May 7 th, 2018 Dual Enrollment United States History is a challenging adventure. Though the year holds countless hours
P1: OTA/XYZ P2: ABC JWBS077-fm JWBS077-Horstmeyer July 30, :18 Printer Name: Yet to Come THE WEATHER ALMANAC
 THE WEATHER ALMANAC THE WEATHER ALMANAC A reference guide to weather, climate, and related issues in the United States and its key cities TWELFTH EDITION Steven L. Horstmeyer A JOHN WILEY & SONS, INC.,
Standard Indicator That s the Latitude! Students will use latitude and longitude to locate places in Indiana and other parts of the world.
 Standard Indicator 4.3.1 That s the Latitude! Purpose Students will use latitude and longitude to locate places in Indiana and other parts of the world. Materials For the teacher: graph paper, globe showing
Summary of Terminal Master s Degree Programs in Philosophy
 Summary of Terminal Master s Degree Programs in Philosophy Faculty and Student Demographics All data collected by the ican Philosophical Association. The data in this publication have been provided by
Objective: Use station models to forecast conditions for weather stations in a region of the continental United States.
 The Atmosphere in Motion: How do meteorologists predict the weather? Weather refers to the present state of the atmosphere air pressure, wind, temperature, and humidity. Meteorologists study weather by
All-Time Conference Standings
 All-Time Conference Standings Pac 12 Conference Conf. Matches Sets Overall Matches Team W L Pct W L Pct. Score Opp Last 10 Streak Home Away Neutral W L Pct. Arizona 6 5.545 22 19.537 886 889 6-4 W5 4-2
North American Geography. Lesson 5: Barnstorm Like a Tennis Player!
 North American Geography Lesson 5: Barnstorm Like a Tennis Player! Unit Overview: As students work through the activities in this unit they will be introduced to the United States in general, different
Lab Activity: Weather Variables
 Name: Date: Period: Weather The Physical Setting: Earth Science Lab Activity: Weather Variables INTRODUCTION: A meteorologist is an individual with specialized education who uses scientific principles
MINERALS THROUGH GEOGRAPHY
 MINERALS THROUGH GEOGRAPHY INTRODUCTION Minerals are related to rock type, not political definition of place. So, the minerals are to be found in a variety of locations that doesn t depend on population
Division I Sears Directors' Cup Final Standings As of 6/20/2001
 1 Stanford (Cal.) 1359 2 90 9 75 20 62.5 0 0 0 0 0 0 3 75 1 100 5 60 8 76 4 80 0 0 2 70 2 California-Los Angeles 1138 0 0 5 78.5 17 67 0 0 0 0 0 0 2 90 9 50 5 60 2 0 33 48.5 2 70 1 100 3 Georgia 890.5
Rank University AMJ AMR ASQ JAP OBHDP OS PPSYCH SMJ SUM 1 University of Pennsylvania (T) Michigan State University
 Michigan State University") Rank University AMJ AMR ASQ JAP OBHDP OS PPSYCH SMJ SUM 1 University of Pennsylvania 4 1 2 0 2 4 0 9 22 2(T) Michigan State University 2 0 0 9 1 0 0 4 16 University of Michigan 3 0 2 5 2 0 0 4 16 4 Harvard
Rank University AMJ AMR ASQ JAP OBHDP OS PPSYCH SMJ SUM 1 University of Pennsylvania 4 1 2 0 2 4 0 9 22 2(T) Michigan State University 2 0 0 9 1 0 0 4 16 University of Michigan 3 0 2 5 2 0 0 4 16 4 Harvard
Research Update: Race and Male Joblessness in Milwaukee: 2008
 Research Update: Race and Male Joblessness in Milwaukee: 2008 by: Marc V. Levine University of Wisconsin Milwaukee Center for Economic Development Briefing Paper September 2009 Overview Over the past decade,
CHAPTER 6: AIR MASSES & WEATHER PATTERNS
 CHAPTER 6: AIR MASSES & WEATHER PATTERNS METEOROLOGY NAME: PERIOD: Chapter 6 - Air Masses & Weather Patterns 1 Mr. Mihalik, Room 442 YOUR SHOT AT FORECASTING The project we ve all been waiting for... you
Department of Veteran Affairs (VA) National Consult Delay Review Fact Sheet April 2014
 National Consult Delay Review Fact Sheet April 2014") Department of Veteran Affairs (VA) National Consult Delay Review Fact Sheet April 4 Summary: The Department of Veterans Affairs (VA) cares deeply for every Veteran we are privileged to serve. Our goal
Department of Veteran Affairs (VA) National Consult Delay Review Fact Sheet April 4 Summary: The Department of Veterans Affairs (VA) cares deeply for every Veteran we are privileged to serve. Our goal
Pima Community College Students who Enrolled at Top 200 Ranked Universities
 Pima Community College Students who Enrolled at Top 200 Ranked Universities Institutional Research, Planning and Effectiveness Project #20170814-MH-60-CIR August 2017 Students who Attended Pima Community
1. Evaluation of maximum daily temperature
 1. Evaluation of maximum daily temperature The cumulative distribution of maximum daily temperature is shown in Figure S1. Overall, among all of the 23 states, the cumulative distributions of daily maximum
American Tour: Climate Objective To introduce contour maps as data displays.
 American Tour: Climate Objective To introduce contour maps as data displays. www.everydaymathonline.com epresentations etoolkit Algorithms Practice EM Facts Workshop Game Family Letters Assessment Management
MINERALS THROUGH GEOGRAPHY. General Standard. Grade level K , resources, and environmen t
 Minerals through Geography 1 STANDARDS MINERALS THROUGH GEOGRAPHY See summary of National Science Education s. Original: http://books.nap.edu/readingroom/books/nses/ Concept General Specific General Specific
Meteorology 110. Lab 1. Geography and Map Skills
 Meteorology 110 Name Lab 1 Geography and Map Skills 1. Geography Weather involves maps. There s no getting around it. You must know where places are so when they are mentioned in the course it won t be
W-Women; M-Men; Bsb-Baseball; Lax-Lacrosse; Row-Rowing; SB-Softball; Ten-Tennis; TF-Track and Field; VB-Volleyball; WP-Water Polo Page 1 of 6
 1 Stanford 1455.00 0 0 40 x 20 54 0 0 0 0 1 100 9 64 9 64 9 64 43 x 7 72 0 0 3 72.5 394.00 570.50 490.50 2 North Carolina 1184.25 5 78 7 72 0 0 2 90 5 60 0 0 17 50 17 50 17 50 47 x 30 43.5 0 0 0 0 240.00
Nationality(s): Syria. State(s): All States. From: 20 Jan To: 04 Aug Nationality
: Syria. State(s): All States. From: 20 Jan To: 04 Aug Nationality") (s): Syria State(s): All States Syria 30 24 23 41 45 249 2,192 7,231 9,835 Arizona 0 0 0 0 0 15 168 590 773 Glendale 0 0 0 0 0 14 58 264 336 Phoenix 0 0 0 0 0 1 47 165 213 Tucson 0 0 0 0 0 0 63 161 224
(s): Syria State(s): All States Syria 30 24 23 41 45 249 2,192 7,231 9,835 Arizona 0 0 0 0 0 15 168 590 773 Glendale 0 0 0 0 0 14 58 264 336 Phoenix 0 0 0 0 0 1 47 165 213 Tucson 0 0 0 0 0 0 63 161 224
JUPITER MILLER BUSINESS CENTER 746,400 SF FOR LEASE
 746,400 SF FOR LEASE Three LEED Certified Cross-Dock Buildings 54,600 Square Feet to 746,400 Square Feet Available Dallas City of Tax Incentives Available 36 Clear Height (Over 25% More Pallet Positions
W-Women; M-Men; Lax-Lacrosse; Row-Rowing; Ten-Tennis; VB-Volleyball; WP-Water Polo Page 1 of 7
 1 Stanford Pac 12 FBS 1556.75 3 82.5 20 54 0 0 0 0 6 72 0 0 2 90 9 64 0 0 1 100 0 0 504.50 589.75 462.50 2 Ohio State Big Ten FBS 1376.75 5 72.75 49 22.5 0 0 2 90 5 75 49 25 3 83 3 83 1 100 0 0 0 0 187.50
Vibrancy and Property Performance of Major U.S. Employment Centers. Appendix A
 Appendix A DOWNTOWN VIBRANCY SCORES Atlanta 103.3 Minneapolis 152.8 Austin 112.3 Nashville 83.5 Baltimore 151.3 New Orleans 124.3 Birmingham 59.3 New York Midtown 448.6 Charlotte 94.1 Oakland 157.7 Chicago
Name Block. My Junior Meteorologist Packet
 Name Block My Junior Meteorologist Packet 1 1 WEATHER INSTRUMENTS TUESDAY WARM UP- WEATHER TOOLS MATCH UP Write the letter of the weather instrument in the blank to show the correction function. 2 WEDNESDAY
New Educators Campaign Weekly Report
 Campaign Weekly Report Conversations and 9/24/2017 Leader Forms Emails Collected Text Opt-ins Digital Journey 14,661 5,289 4,458 7,124 317 13,699 1,871 2,124 Pro 13,924 5,175 4,345 6,726 294 13,086 1,767
Challenge 1: Learning About the Physical Geography of Canada and the United States
 60ºN S T U D E N T H A N D O U T Challenge 1: Learning About the Physical Geography of Canada and the United States 170ºE 10ºW 180º 20ºW 60ºN 30ºW 1 40ºW 160ºW 50ºW 150ºW 60ºW 140ºW N W S E 0 500 1,000
Scaling in Biology. How do properties of living systems change as their size is varied?
 Scaling in Biology How do properties of living systems change as their size is varied? Example: How does basal metabolic rate (heat radiation) vary as a function of an animal s body mass? Mouse Hamster
Summary of Natural Hazard Statistics for 2008 in the United States
 Summary of Natural Hazard Statistics for 2008 in the United States This National Weather Service (NWS) report summarizes fatalities, injuries and damages caused by severe weather in 2008. The NWS Office
Authors: Antonella Zanobetti and Joel Schwartz
 Title: Mortality Displacement in the Association of Ozone with Mortality: An Analysis of 48 US Cities Authors: Antonella Zanobetti and Joel Schwartz ONLINE DATA SUPPLEMENT Additional Information on Materials
Weather FActors. May 8 4:15 PM. Analyzing AIR MASSES & THEIR MOVEMENT
 ` Weather FActors P: Analyze weather Q: What are the factors that cause weather? May 8 4:15 PM Analyzing AIR MASSES & THEIR MOVEMENT Read and take notes... Using pages 72-79: (IN YOUR JOURNAL!) - Identify
W-Women; M-Men; Bsb-Baseball; Lax-Lacrosse; Row-Rowing; SB-Softball; Ten-Tennis; TF-Track and Field; VB-Volleyball; WP-Water Polo Page 1 of 6
 X= lowest scoring point total removed due to scoring in more than the allotted 20 sports 1 Stanford Pac 12 FBS 1563.00 17 50 3 82.5 20 54 0 0 0 0 6 72 0 0 2 90 9 64 13 60.75 26 45.5 0 0 1 100 0 0 429.50
Solving Quadratic Equations by Graphing 6.1. ft /sec. The height of the arrow h(t) in terms
 in terms") Quadratic Function f ( x) ax bx c Solving Quadratic Equations by Graphing 6.1 Write each in quadratic form. Example 1 f ( x) 3( x + ) Example Graph f ( x) x + 6 x + 8 Example 3 An arrow is shot upward
Quadratic Function f ( x) ax bx c Solving Quadratic Equations by Graphing 6.1 Write each in quadratic form. Example 1 f ( x) 3( x + ) Example Graph f ( x) x + 6 x + 8 Example 3 An arrow is shot upward
Fall 2006 Enrollments in Portuguese, by State
 Fall 2006 Enrollments in, by State State Level University Graduate AL Samford U 6 0 6 0 6 U of Alabama, Tuscaloosa 12 0 12 0 12 Summary for level = (2 institutions) 18 0 18 0 18 Summary for state = AL
A Handbook of Statistical Analyses Using R 2nd Edition. Brian S. Everitt and Torsten Hothorn
 A Handbook of Statistical Analyses Using R 2nd Edition Brian S. Everitt and Torsten Hothorn CHAPTER 10 Scatterplot NA Air Pollution in the USA, and Risk Factors for Kyphosis 10.1 Introduction 10.2 Scatterplot
WEATHER MAPS NAME. Temperature: Dew Point: Wind Direction: Wind Velocity: % of Sky Covered: Current Pressure:
 NAME WEATHER MAPS For decades hundreds of weather stations throughout the United States have been making standard observations of temperature, moisture, air pressure and winds. The data are collected centrally
Integrated Science I: Locating earthquake epicenters. Name Per Date
 Integrated Science I: Locating earthquake epicenters. Name Per Date Whenever a significant earthquake occurs somewhere in the world, news media present reports about two issues; the size or magnitude of
North American Geography. Lesson 2: My Country tis of Thee
 North American Geography Lesson 2: My Country tis of Thee Unit Overview: As students work through the activities in this unit they will be introduced to the United States in general, different regions
Preview: Making a Mental Map of the Region
 Preview: Making a Mental Map of the Region Draw an outline map of Canada and the United States on the next page or on a separate sheet of paper. Add a compass rose to your map, showing where north, south,
Physical Therapist Centralized Application Service. COURSE PREREQUISITES SUMMARY Admissions Cycle
 Physical Therapist Centralized Application Service COURSE PREREQUISITES SUMMARY Report of the American Physical Therapy Association August 2011 2011-12 COURSE PREREQUISITES SUMMARY EXECUTIVE SUMMARY The
Physical Features of Canada and the United States
 I VIUAL Physical Features of Canada and the United tates 170 ARCTIC OCA Aleutian s 1 Bering ea ALAKA Yukon R. Mt. McKinley (20,320 ft. 6,194 m) Gulf of Alaska BROOK RAG RAG Queen Charlotte s R Vancouver
City Number Pct. 1.2 STEMS AND LEAVES
 1.2 STEMS AND LEAVES Think back on the preceding example. We dealt with a list of cities giving their populations and areas. Usually the science of statistics does not concern itself with identifying the
W-Women; M-Men; Bsb-Baseball; Lax-Lacrosse; Row-Rowing; SB-Softball; Ten-Tennis; TF-Track and Field; VB-Volleyball; WP-Water Polo Page 1 of 6
 Rank Institution Conference Division Total Pl. Pts. Pl. Pts. Pl. Pts. Pl. Pts. Pl. Pts. Pl. Pts. Pl. Pts. Pl. Pts. Pl. Pts. Pl. Pts. Pl. Pts. Pl. Pts. Pl. Pts. Pl. Pts. Total Total Total 9 Florida State
W-Women; M-Men; Bsb-Baseball; Lax-Lacrosse; Row-Rowing; SB-Softball; Ten-Tennis; TF-Track and Field; VB-Volleyball; WP-Water Polo Page 1 of 6
 Rank Institution Conference Division Total Pl. Pts. Pl. Pts. Pl. Pts. Pl. Pts. Pl. Pts. Pl. Pts. Pl. Pts. Pl. Pts. Pl. Pts. Pl. Pts. Pl. Pts. Pl. Pts. Pl. Pts. Pl. Pts. Total Total Total 1 Stanford Pac
Physical Features of Canada and the United States
 Physical Features of Canada and the United tates 170 ARCTIC OCA Aleutian s 1 1 Bering ea ALAKA Yukon R. Mt. McKinley (20,320 ft. 6,194 m) Gulf of Alaska BROOK RAG RAG Queen Charlotte s R Vancouver O C
COURSE PREREQUISITES SUMMARY
 COURSE PREREQUISITES SUMMARY The PTCAS Course Prerequisites Summary is a report of the American Physical Therapy Association (APTA). A total of 179 Doctor of Physical Therapist (DPT) education programs
Fall 2006 Enrollments in Modern Hebrew, by State
 Fall 2006 Enrollments in, by State State Level University Graduate AL U of Alabama, Tuscaloosa 13 0 13 0 13 Summary for level = (1 institution) 13 0 13 0 13 Summary for state = AL (1 institution) 13 0
Correction to Spatial and temporal distributions of U.S. winds and wind power at 80 m derived from measurements
 JOURNAL OF GEOPHYSICAL RESEARCH, VOL. 109,, doi:10.1029/2004jd005099, 2004 Correction to Spatial and temporal distributions of U.S. winds and wind power at 80 m derived from measurements Cristina L. Archer
Powder River Basin Coal Update
 Powder River Basin Coal Update Tom Kraemer Group Vice President Coal Southwest Power Pool Regional State Committee October 24, 2005 - Santa Fe, NM Discussion Topics BNSF coal transportation Historic PRB
A. Geography Students know the location of places, geographic features, and patterns of the environment.
 Learning Targets Elementary Social Studies Grade 5 2014-2015 A. Geography Students know the location of places, geographic features, and patterns of the environment. A.5.1. A.5.2. A.5.3. A.5.4. Label North
Guided Reading Activity
 Guided Reading Activity Lesson 1 Physical Features Essential Question: How does geography influence the way people live? A Vast Land Directions: Read the lesson and use your text to decide whether each
Trends in Metropolitan Network Circuity
 Trends in Metropolitan Network Circuity David J. Giacomin Luke S. James David M. Levinson Abstract Because people seek to minimize their time and travel distance (or cost) when commuting, the circuity
1. Which weather map symbol is associated with extremely low air pressure? A) B) C) D) 2. The diagram below represents a weather instrument.
 B) C) D) 2. The diagram below represents a weather instrument.") 1. Which weather map symbol is associated with extremely low air pressure? 2. The diagram below represents a weather instrument. Which weather variable was this instrument designed to measure? A) air pressure
1. Which weather map symbol is associated with extremely low air pressure? 2. The diagram below represents a weather instrument. Which weather variable was this instrument designed to measure? A) air pressure
ASSOCIATION OF SCIENCE MUSEUM DIRECTORS OFFICER INFORMATION FROM INCEPTION IN 1959 TO TODAY
 ASSOCIATION OF SCIENCE MUSEUM DIRECTORS OFFICER INFORMATION FROM INCEPTION IN 1959 TO TODAY 2018 Sarah George, Natural History Museum of Utah, Salt Lake City Utah Vice- Julie Stein, Burke Museum, Seattle,
Understanding the Impact of Weather for POI Recommendations
 S C I E N C E P A S S I O N T E C H N O L O G Y Understanding the Impact of Weather for POI Recommendations Christoph Trattner, Alex Oberegger, Lukas Eberhard, Denis Parra, Leandro Marinho, Know-Center@Graz
Lesson 1 - Pre-Visit Safe at Home: Location, Place, and Baseball
 Lesson 1 - Pre-Visit Safe at Home: Location, Place, and Baseball Objective: Students will be able to: Define location and place, two of the five themes of geography. Give reasons for the use of latitude
Monthly Long Range Weather Commentary Issued: February 04, 2012 Steven A. Root, CCM, President/CEO
 Monthly Long Range Weather Commentary Issued: February 04, 2012 Steven A. Root, CCM, President/CEO sroot@weatherbank.com Severe thunderstorms spawned tornadoes northeast of Birmingham, Alabama on January
Name: Date: Part I Weather Tools Match Directions: Correctly identify each weather tool by writing the name on the line.
 Name: Date: Part I Weather Tools Match Directions: Correctly identify each weather tool by writing the name on the line. rain gauge thermometer anemometer barometer Part II Important Vocabulary Directions:
Hourly Precipitation Data Documentation (text and csv version) February 2016
 February 2016") I. Description Hourly Precipitation Data Documentation (text and csv version) February 2016 Hourly Precipitation Data (labeled Precipitation Hourly in Climate Data Online system) is a database that gives
I. Description Hourly Precipitation Data Documentation (text and csv version) February 2016 Hourly Precipitation Data (labeled Precipitation Hourly in Climate Data Online system) is a database that gives
Signs in the Sky. by Michelle August
 Read the science passages. Then answer the questions that follow. Signs in the Sky by Michelle August 1 Today, every news channel has a weather person. They can predict the weather for days, even weeks
Name Block. My Junior Meteorologist Packet
 Name Block My Junior Meteorologist Packet 1 STATION MODEL PRACTICE Directions: Draw a station model using the following information. Right Now in Sterling, VA CLOUD COVER Partly cloudy WIND SPEED 15 mph
LAB G - ATMOSPHERE AND CLIMATE LAB I TEMPERATURE AND PRESSURE TEMPERATURE PORTION
 Introduction LAB G - ATMOSPHERE AND CLIMATE LAB I TEMPERATURE AND PRESSURE TEMPERATURE PORTION This lab will provide the student with the opportunity to become familiar with the concepts introduced in
ASSESSING ACCURACY: HOTEL HORIZONS FORECASTS
 ASSESSING ACCURACY: HOTEL HORIZONS FORECASTS April 13, 2016 EXECUTIVE SUMMARY The US hotel industry had another strong year in 2015 with RevPAR up 6.3 percent over the prior year. In this report, we examine
Stem-and-Leaf Displays
 3.2 Displaying Numerical Data: Stem-and-Leaf Displays 107 casts in your area? (San Luis Obispo Tribune, June 15, 2005). The responses are summarized in the table below. Extremely 4% Very 27% Somewhat 53%
Jakarta International School 6 th Grade Formative Assessment Graphing and Statistics -Black
 Jakarta International School 6 th Grade Formative Assessment Graphing and Statistics -Black Name: Date: Score : 42 Data collection, presentation and application Frequency tables. (Answer question 1 on
W-Women; M-Men; Bsb-Baseball; Lax-Lacrosse; Row-Rowing; SB-Softball; Ten-Tennis; TF-Track and Field; VB-Volleyball; WP-Water Polo Page 1 of 6
 X= lowest scoring point total removed due to scoring in more than the allotted 20 sports 1 Stanford Pac 12 FBS 1526.50 0 0 2 90 28 x 9 x 0 0 4 80 0 0 1 100 9 64 7 71.25 13 62.25 0 0 2 90 0 0 404.50 564.50
Deliverable 4-2: Assessment items. Activity-oriented Quiz for Weather or Not? Investigation in Exploring the Environment
 Deliverable 4-2: Assessment items Activity-oriented Quiz for Weather or Not? Investigation in Exploring the Environment In Weather or Not? you predicted the weather using satellite images and other kinds
Parametric Test. Multiple Linear Regression Spatial Application I: State Homicide Rates Equations taken from Zar, 1984.
 Multiple Linear Regression Spatial Application I: State Homicide Rates Equations taken from Zar, 984. y ˆ = a + b x + b 2 x 2K + b n x n where n is the number of variables Example: In an earlier bivariate
Intercity Bus Stop Analysis
 by Karalyn Clouser, Research Associate and David Kack, Director of the Small Urban and Rural Livability Center Western Transportation Institute College of Engineering Montana State University Report prepared
OUT-OF-STATE 965 SUBTOTAL OUT-OF-STATE U.S. TERRITORIES FOREIGN COUNTRIES UNKNOWN GRAND TOTAL
 Report ID: USSR8072-V3 Page No. 1 Jurisdiction: ON-CAMPUS IL Southern Illinois University - Carb 1 0 0 0 Black Hawk College Quad-Cities 0 0 1 0 John A Logan College 1 0 0 0 Rend Lake College 1 0 0 0 Aurora
What is the difference between weather and climate?
 Weather vs. Climate What is the difference between weather and climate? Weather vs. Climate WEATHER Weather is what condi7ons of the atmosphere are over a short period of 7me. CLIMATE Climate is how the
The Norwood Science Center
 The Norwood Science Center Weather Grade 5 Background information: The jet stream is a relatively narrow band of strong winds found in the upper part of the atmosphere called the troposphereapproximately
Monthly Long Range Weather Commentary Issued: March 06, 2012 Steven A. Root, CCM, President/CEO
 Monthly Long Range Weather Commentary Issued: March 06, 2012 Steven A. Root, CCM, President/CEO sroot@weatherbank.com Warmer than average temperatures dominated the northern and eastern regions of the
Osteopathic Medical Colleges
 Osteopathic Medical Colleges Matriculants by U.S. States and Territories Entering Class 0 Prepared by the Research Department American Association of Colleges of Osteopathic Medicine Copyright 0, AAM All
Cooperative Program Allocation Budget Receipts Southern Baptist Convention Executive Committee May 2018
 Cooperative Program Allocation Budget Receipts May 2018 Cooperative Program Allocation Budget Current Current $ Change % Change Month Month from from Contribution Sources 2017-2018 2016-2017 Prior Year
Cooperative Program Allocation Budget Receipts Southern Baptist Convention Executive Committee October 2017
 Cooperative Program Allocation Budget Receipts October 2017 Cooperative Program Allocation Budget Current Current $ Change % Change Month Month from from Contribution Sources 2017-2018 2016-2017 Prior
Cooperative Program Allocation Budget Receipts Southern Baptist Convention Executive Committee October 2018
 Cooperative Program Allocation Budget Receipts October 2018 Cooperative Program Allocation Budget Current Current $ Change % Change Month Month from from Contribution Sources 2018-2019 2017-2018 Prior
Printable Activity book
 Printable Activity book 16 Pages of Activities Printable Activity Book Print it Take it Keep them busy Print them out Laminate them or Put them in page protectors Put them in a binder Bring along a dry
Multivariate Statistics
 Multivariate Statistics Chapter 3: Principal Component Analysis Pedro Galeano Departamento de Estadística Universidad Carlos III de Madrid pedro.galeano@uc3m.es Course 2017/2018 Master in Mathematical
7,042 7, ETA'MBST io n THE PRESS
 ETA'MBST io n THE PRESS R e l e a s e d f o r p u b l i c a t i o n S t. 5 1 3 0 Sun d a y m o r n in g, D e c. 5j F e d e r a l fiessrva B o a rd, not e a r l i e r. D ec e m b er 4, 1 9 2 6. 3ANTC D
ARCH 1250 APPLIED ENVIRONMENTAL STUDIES. CLASS TWO - CLIMATE Macroclimate and Microclimate
 APPLIED ENVIRONMENTAL STUDIES CLASS TWO - Macroclimate and Microclimate Part 1: Climate Overview John Seitz, RA, LEED AP Assistant Adjunct Professor Professor Paul C. King, RA, AIA, ARA Assistant Professor
You Might Also Like. I look forward helping you focus your instruction while saving tons of time. Kesler Science Station Lab Activities 40%+ Savings!
 Thanks Connect Thank you for downloading my product. I truly appreciate your support and look forward to hearing your feedback. You can connect with me and find many free activities and strategies over
RNR 516A. Computer Cartography. Spring GIS Portfolio
 RNR 516A Computer Cartography Spring 2016 GIS Portfolio 1 Contents 1 Political and Locator Maps 3 2 Base Maps and Digitizing 4 3 Data Entry Report 5 4 Projections and Symbolization 6 5 Choropleth Mapping
Meteorology Lab Activity: Interpreting Surface Observation Symbols
 Meteorology Lab Activity: Interpreting Surface Observation Symbols Introduction: Routine surface meteorological observations are represented on weather maps by a standard notation of symbols and numbers.
What Lies Beneath: A Sub- National Look at Okun s Law for the United States.
 What Lies Beneath: A Sub- National Look at Okun s Law for the United States. Nathalie Gonzalez Prieto International Monetary Fund Global Labor Markets Workshop Paris, September 1-2, 2016 What the paper
Climate Uncovered: Media Fail to Connect Hurricane Florence to Climate Change
 September 18, 2018 Climate Uncovered: Media Fail to Connect Hurricane Florence to Climate Change One of the clearest and most devastating impacts of climate change has been the intensification of the harm
NITTY-GRITTY (THROUGH GAMES OF Jan. 7, 2018) Women's Basketball
 Women's Basketball") [] A&M-Corpus Christi [] Abilene Christian [] Air Force [] Akron [] Alabama [] Alabama A&M [] Alabama St. [] Albany (NY) [] Alcorn [] American [] Appalachian St. [] Arizona [] Arizona St. [] Ark.-Pine
[] A&M-Corpus Christi [] Abilene Christian [] Air Force [] Akron [] Alabama [] Alabama A&M [] Alabama St. [] Albany (NY) [] Alcorn [] American [] Appalachian St. [] Arizona [] Arizona St. [] Ark.-Pine
MO PUBL 4YR 2090 Missouri State University SUBTOTAL-MO
 Report ID: USSR8072-V3 Page No. 1 Jurisdiction: ON-CAMPUS IL American Intercontinental Universit 0 0 1 0 Northern Illinois University 0 0 4 0 Southern Illinois Univ - Edwardsvil 2 0 2 0 Southern Illinois
NITTY-GRITTY (THROUGH GAMES OF Dec. 30, 2018) Women's Basketball
 Women's Basketball") [] A&M-Corpus Christi [] Abilene Christian [] Air Force [] Akron [] Alabama [] Alabama A&M [] Alabama St. [] Albany (NY) [] Alcorn [] American [] Appalachian St. [] Arizona [] Arizona St. [] Ark.-Pine
[] A&M-Corpus Christi [] Abilene Christian [] Air Force [] Akron [] Alabama [] Alabama A&M [] Alabama St. [] Albany (NY) [] Alcorn [] American [] Appalachian St. [] Arizona [] Arizona St. [] Ark.-Pine
NITTY-GRITTY (THROUGH GAMES OF Jan. 11, 2019) Women's Basketball
 Women's Basketball") [] A&M-Corpus Christi [] Abilene Christian [] Air Force [] Akron [] Alabama [] Alabama A&M [] Alabama St. [] Albany (NY) [] Alcorn [] American [] Appalachian St. [] Arizona [] Arizona St. [] Ark.-Pine
[] A&M-Corpus Christi [] Abilene Christian [] Air Force [] Akron [] Alabama [] Alabama A&M [] Alabama St. [] Albany (NY) [] Alcorn [] American [] Appalachian St. [] Arizona [] Arizona St. [] Ark.-Pine
NITTY-GRITTY (THROUGH GAMES OF Jan. 2, 2019) Women's Basketball
 Women's Basketball") Sorted by Name [] A&M-Corpus Christi [] Abilene Christian [] Air Force [] Akron [] Alabama [] Alabama A&M [] Alabama St. [] Albany (NY) [] Alcorn [] American [] Appalachian St. [] Arizona [] Arizona St.
Sorted by Name [] A&M-Corpus Christi [] Abilene Christian [] Air Force [] Akron [] Alabama [] Alabama A&M [] Alabama St. [] Albany (NY) [] Alcorn [] American [] Appalachian St. [] Arizona [] Arizona St.
NITTY-GRITTY (THROUGH GAMES OF Dec. 16, 2018) Women's Basketball
 Women's Basketball") [] A&M-Corpus Christi [] Abilene Christian [] Air Force [] Akron [] Alabama [] Alabama A&M [] Alabama St. [] Albany (NY) [] Alcorn [] American [] Appalachian St. [] Arizona [] Arizona St. [] Ark.-Pine
[] A&M-Corpus Christi [] Abilene Christian [] Air Force [] Akron [] Alabama [] Alabama A&M [] Alabama St. [] Albany (NY) [] Alcorn [] American [] Appalachian St. [] Arizona [] Arizona St. [] Ark.-Pine
NITTY-GRITTY (THROUGH GAMES OF Jan. 6, 2019) Women's Basketball
 Women's Basketball") [] A&M-Corpus Christi [] Abilene Christian [] Air Force [] Akron [] Alabama [] Alabama A&M [] Alabama St. [] Albany (NY) [] Alcorn [] American [] Appalachian St. [] Arizona [] Arizona St. [] Ark.-Pine
[] A&M-Corpus Christi [] Abilene Christian [] Air Force [] Akron [] Alabama [] Alabama A&M [] Alabama St. [] Albany (NY) [] Alcorn [] American [] Appalachian St. [] Arizona [] Arizona St. [] Ark.-Pine
NITTY-GRITTY (THROUGH GAMES OF Jan. 13, 2019) Women's Basketball
 Women's Basketball") [] A&M-Corpus Christi [] Abilene Christian [] Air Force [] Akron [] Alabama [] Alabama A&M [] Alabama St. [] Albany (NY) [] Alcorn [] American [] Appalachian St. [] Arizona [] Arizona St. [] Ark.-Pine
[] A&M-Corpus Christi [] Abilene Christian [] Air Force [] Akron [] Alabama [] Alabama A&M [] Alabama St. [] Albany (NY) [] Alcorn [] American [] Appalachian St. [] Arizona [] Arizona St. [] Ark.-Pine
NITTY-GRITTY (THROUGH GAMES OF Feb. 12, 2019) Women's Basketball
 Women's Basketball") [] A&M-Corpus Christi [] Abilene Christian [] Air Force [] Akron [] Alabama [] Alabama A&M [] Alabama St. [] Albany (NY) [] Alcorn [] American [] Appalachian St. [] Arizona [] Arizona St. [] Ark.-Pine
[] A&M-Corpus Christi [] Abilene Christian [] Air Force [] Akron [] Alabama [] Alabama A&M [] Alabama St. [] Albany (NY) [] Alcorn [] American [] Appalachian St. [] Arizona [] Arizona St. [] Ark.-Pine
NITTY-GRITTY (THROUGH GAMES OF Feb. 17, 2019) Women's Basketball
 Women's Basketball") [] A&M-Corpus Christi [] Abilene Christian [] Air Force [] Akron [] Alabama [] Alabama A&M [] Alabama St. [] Albany (NY) [] Alcorn [] American [] Appalachian St. [] Arizona [] Arizona St. [] Ark.-Pine
[] A&M-Corpus Christi [] Abilene Christian [] Air Force [] Akron [] Alabama [] Alabama A&M [] Alabama St. [] Albany (NY) [] Alcorn [] American [] Appalachian St. [] Arizona [] Arizona St. [] Ark.-Pine