The Latest Mapping Developments and Technologies
|
|
|
- Wesley Bryant
- 5 years ago
- Views:
Transcription
1 The Latest Mapping Developments and Technologies Gian-Reto Schaad, Big 5 O Week 2015/2016, Kaapsehoop, South Africa
2 Contents About Me OCAD Software Orienteering Map History Mapping Technologies Special Maps, JWOC Project Future

3 About Me Grown up in an Orienteering family Starting mapping with 17 drawn with OCAD Survey Engineer and IT 2003 Software Engineer at company
4 About Me Member of Mapping Commission Swiss Orienteering Mapping smaller projects as spare-time job In charge of maps for Swiss O Week 2011, Flims/Laax Ski O European Champs Lenzerheide, January 2015 World Cup Final Arosa, Oktober 2015 JWOC Scuol, July 2016
5 Contents About Me OCAD Software Orienteering Map History Mapping Technologies Special Maps, JWOC Project Future
6 Company, OCAD Software Hans Steinegger (OLV Zug) started to develop OCAD in1988 in his spare time First OCAD drawn orienteering map «Schneitwald» used in Spring 1989 for a national event of OLV Zug Big success of OCAD started in the 90s OCAD leading orienteering mapping and course planning software 6 employees, based in Baar, Switzerland

7 OCAD Software OCAD 12 released October different editions for orienteering sport and publishing companies

8 OCAD Course Planning

9 OCAD Map Drawing
10 Contents About Me OCAD Software Orienteering Map History Mapping Technologies Special Maps, JWOC Project Future
11 Orienteering Map History International Orienteering Map Specifications ISOM since 1969 Slightly changed, current edition ISOM 2000
12 Milestones Base map: special photogrammetric base maps from arial images in 70s Map Drawing: first computer drawn maps in 1988 Field work: laser distance meter in 90s Field work: mapping with tablet computer and GPS around 2000 Base Map: Airborne Laserscanning (ALS) Data in 2005
13 General about Mapping We do not go in the terrain with white sheet The better your base map is the faster your field work It is important you always know your current position on the base map when doing field works It is worth to spend some time and money in a good base map
14 Contents About Me OCAD Software Orienteering Map History Mapping Technologies Special Maps, JWOC Project Future
15 Airborne Laserscanning Laserscanner mounted on air plan or helicopter, scans the terrain Capturing 3d data of large areas in short time Result: Point cloud with information about terrain and vegetation

16 Airborne Laserscanning Data Forest: Canopy, ground and intermediate points Point: Coordinate, elevation, return type and signal intensity Determinate classification (ground, vegetation, water, building, )
17 ALS Data in Switzerland Completely covered since 2004 up to 2000 m asl (purpose: agriculture and forestry), 1 point per 1 m 2, data is available ALS is new technology -> development is very fast Newest data from 2014 from Canton of Zurich (flood protection) 50 points per 1 m 2 in the forest (15 points on ground, 35 vegetation points) 5 km 2 forest: 250 M points, 8 GB data size Very high resolution

18 Contour Lines

19 Vegetation Height Map
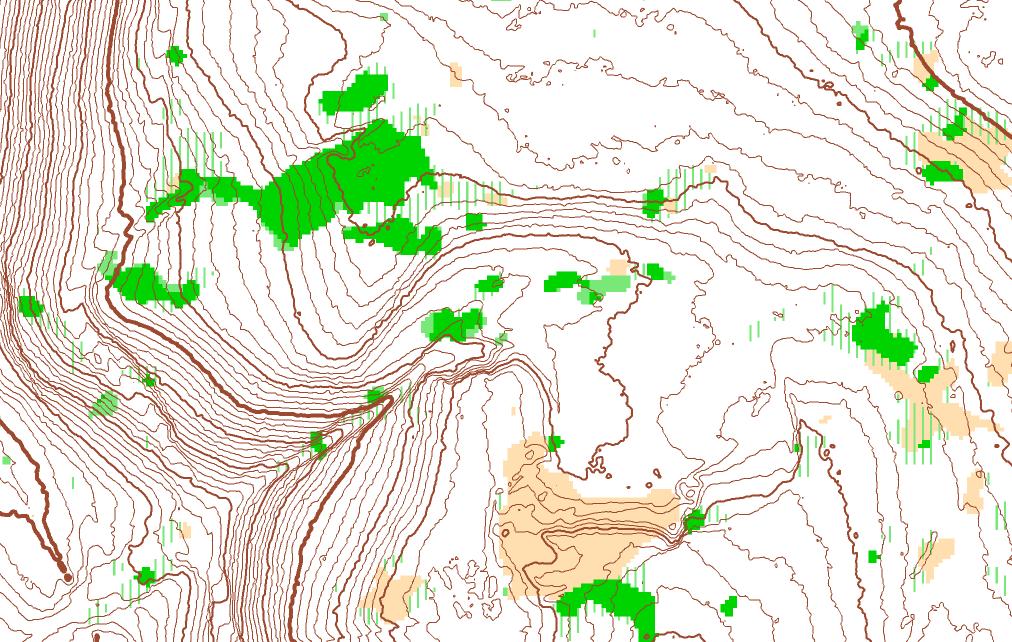
20 Vegetation Map

21 Intensity Map

22 Hill Shading

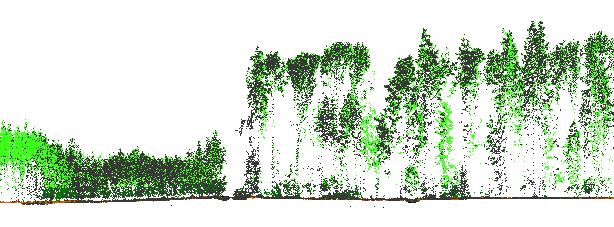
23 Cross Profile
24 Base Map Examples Urban sprint map «Ardez» using data from catastre data Forest map «Isenberg» based on ALS data
25 Contents About Me OCAD Software Orienteering Map History Mapping Technologies Special Maps, JWOC Project Future
26 Swiss O Week 2011 Flims-Laax 6 Days event with 4000 orienteers Terrain between 1000m and 2700m asl

27 Stage «Vorab», Start on 2600m

28 Snow Fields Stage «Vorab»: Snow fields mapped with light blue color How big are the snow fields at the competiion day? Snow melts Finally, we mapped one year before the event. Result was quite good.

29 Ski O European Champs Ski tracks mapped with GPS.

30 Ski O European Champs

31 Ski O European Champs.


32 Swiss O Long Champs «Got Grond».


33 Swiss O Long Champs «Got Grond».


34 JWOC / SOW weeks injuly 2016
 Costs: 200 000 $ Nearly all maps are ready JWOC trainings started in summer")
35 JWOC / SOW 2016 Totally 32 maps (training and competition maps) 5 different mappers (2 full time mappers) Costs: $ Nearly all maps are ready JWOC trainings started in summer 2015

36 SOW Training Map «Tais»
37 Contents About Me OCAD Software Orienteering Map History Mapping Technologies Special Maps, JWOC Project Future
38 Conclusion ALS data really improve the quality of the contour lines The mappers are faster with the field work, need less time Only up to date data helps for the time consuming vegetation mapping (at least in Switzerland)

39 WOC 2012 Switzerland Swiss Plateau Vegetation changes fast, small different green areas Solution?

40 Future Intergeo 2015: Leica Pegasus Backpack: Mapping with terrestial Laserscanner, GPS and video camera in the terrain
41 Thanks for your attention!
Integrating LiDAR data into the workflow of cartographic representation.
 Integrating LiDAR data into the workflow of cartographic representation. Cartographic Workflow I. 1 2 3 4 5 Surveying Vector (Nat. GDB) GPS, Laser Range Finder Yes/ No Scanning old maps LiDARflights Capture
Orienteering map. Contents
 Page 1 of 10 Orienteering map From Wikipedia, the free encyclopedia An orienteering map is a map specially prepared for use in orienteering competitions. It is a topographic map with extra details to help
Laserscanning for DEM generation Uwe Lohr TopoSys GmbH, Freiherr-vom-Stein-Str. 7, D Ravensburg,
 Laserscanning for DEM generation Uwe Lohr TopoSys GmbH, Freiherr-vom-Stein-Str. 7, D-88212 Ravensburg, Germany Email: toposys@w-4.de Abstract During the last years laserscanning has been accepted as a
Tatsuo Sekiguchi* and Hiroshi Sato*
 by Tatsuo Sekiguchi* and Hiroshi Sato* ABSTRACT Landslides induced by heavy rainfall and earthquakes may result in disaster by destroying homes and buildings. High-fluidity landslides caused by liquefied
Regional Centre for Mapping of Resources for Development (RCMRD), Nairobi, Kenya
, Nairobi, Kenya") Regional Centre for Mapping of Resources for Development (RCMRD), Nairobi, Kenya Introduction to GIS (2 weeks: 10 days) Intakes: 8 th January, 6 th February, 5th March, 3 rd. April 9 th, May 7 th, June
Regional Centre for Mapping of Resources for Development (RCMRD), Nairobi, Kenya Introduction to GIS (2 weeks: 10 days) Intakes: 8 th January, 6 th February, 5th March, 3 rd. April 9 th, May 7 th, June
08/01/2012. LiDAR. LiDAR Benefits. LiDAR-BASED DELINEATION OF WETLAND BORDERS. CCFFR-2012 Society for Canadian Limnologists:
 LiDAR CCFFR-2012 Society for Canadian Limnologists: Science for Wetland Policy and Management LiDAR-BASED DELINEATION OF WETLAND BORDERS Distance from laser to ground and back again: Determined as laser-pulse
Background. Points of Discussion. Hydrographic Models
 Airborne Laser Remote Sensing Technology: Providing Essential Hydrologic Information in the 21 st Century Warwick Hadley, Optech Incorporated Presented by: Warwick Hadley Sales Manager, Middle East and
Airborne Corridor-Mapping. Planning and documentation of company infrastructure: precise, rapid, and cost effective
 Airborne Corridor-Mapping Planning and documentation of company infrastructure: precise, rapid, and cost effective Technology Airborne Laser-Scanning, digital orthophotos and thermal imaging: one flight
Trimble s ecognition Product Suite
 Trimble s ecognition Product Suite Dr. Waldemar Krebs October 2010 Trimble Geospatial in the Image Processing Chain Data Acquisition Pre-processing Manual/Pixel-based Object-/contextbased Interpretation
Regional Centre for Mapping of Resources for Development (RCMRD), Nairobi, Kenya
, Nairobi, Kenya") Regional Centre for Mapping of Resources for Development (RCMRD), Nairobi, Kenya Introduction GIS ( 2 weeks: 10 days) Intakes: 7 th Jan, 4 th Feb,4 th March, 1 st April 6 th May, 3 rd June, 1 st July,
Regional Centre for Mapping of Resources for Development (RCMRD), Nairobi, Kenya Introduction GIS ( 2 weeks: 10 days) Intakes: 7 th Jan, 4 th Feb,4 th March, 1 st April 6 th May, 3 rd June, 1 st July,
Regional Centre for Mapping of Resources for Development (RCMRD), Nairobi, Kenya. Introduction GIS ( 2 weeks: 10 days)
, Nairobi, Kenya. Introduction GIS ( 2 weeks: 10 days)") Regional Centre for Mapping of Resources for Development (RCMRD), Nairobi, Kenya Introduction GIS ( 2 weeks: 10 days) Intakes: 8 th Jan, 6 th Feb,5 th March, 3 rd April 9 th, May 7 th, June 4 th, July
Regional Centre for Mapping of Resources for Development (RCMRD), Nairobi, Kenya Introduction GIS ( 2 weeks: 10 days) Intakes: 8 th Jan, 6 th Feb,5 th March, 3 rd April 9 th, May 7 th, June 4 th, July
Remote Sensing for Climate Change Effect on Lake Tahoe. Shobha Sriharan Professor of Environmental Science Virginia State University
 Remote Sensing for Climate Change Effect on Lake Tahoe Shobha Sriharan Professor of Environmental Science Virginia State University Table of Contents Lake Tahoe s Climate Issues Discussion on the issues
Chapter 1 Overview of Maps
 Chapter 1 Overview of Maps In this chapter you will learn about: Key points when working with maps General types of maps Incident specific maps Map legend and symbols Map sources A map is a navigational
Developing GIS Software to Process Photogrammetric Point Cloud Data for Inventory Production
 Developing GIS Software to Process Photogrammetric Point Cloud Data for Inventory Production Kevin Lim, Ph.D. President and CTO Lim Geomatics Inc. 343 Preston Street, Floor 11, Ottawa, ON, K1S 1N4 Enhanced
Imagery and the Location-enabled Platform in State and Local Government
 Imagery and the Location-enabled Platform in State and Local Government Fred Limp, Director, CAST Jim Farley, Vice President, Leica Geosystems Oracle Spatial Users Group Denver, March 10, 2005 TM TM Discussion
Surveyors, Cartographers, Photogrammetrists, and Surveying and Mapping Technicians
 http://www.bls.gov/oco/ocos040.htm Surveyors, Cartographers, Photogrammetrists, and Surveying and Mapping Technicians * Nature of the Work * Training, Other Qualifications, and Advancement * Employment
SUMMER WORK FOR RISING PRECALCULUS STUDENTS
 SUMMER WORK FOR RISING PRECALCULUS STUDENTS Solve part I in June, part II in July, part III in August. The Barrie School 2014 The idea of the review is to do little work (each of these 3 packets should
MOUNTAIN SKILLS: HOW TO REALLY READ THE AVALANCHE FORECAST
 Page 1 of 8 SEARCH THIS WEBSITE HOME GEAR PHOTOS BACKCOUNTRY TV STORIES MOUNTAIN SKILLS MAGAZINE SHOP BASECAMP SUBSCRIBE WIN FREE GEAR MOUNTAIN SKILLS: HOW TO REALLY READ THE AVALANCHE FORECAST BY SARAH
AirborneHydroMapping. New possibilities in bathymetric and topographic survey
 AirborneHydroMapping New possibilities in bathymetric and topographic survey NIRAS og AHM, projekt for Statens Kartverk Dataíndsamling i kystsonen med LiDAR system NIRAS, DANMARK Etablert i 1956 Ingeniørfirma
GEOMATICS. Shaping our world. A company of
 GEOMATICS Shaping our world A company of OUR EXPERTISE Geomatics Geomatics plays a mayor role in hydropower, land and water resources, urban development, transport & mobility, renewable energy, and infrastructure
Scaling Issues Related to Snow Storage and Measurements
 GENDIATUR, QUE REIUNT EXPLABO. UT ASINCTIIS DE VOLLACCAB ISUNT ET EOS QUATIANDANDI DELLECU LLUPTIIST Scaling Issues Related to Snow Storage and Measurements By Wolf Marchand, Sweco Norge AS 1 2017-12-12
Presented by: Ki r k Cont r ucci, CP Ayres Associates. Andy Faust, GISP North Central Wisconsin Regional Planning Commission.
 Andy Faust, GISP North Central Wisconsin Regional Planning Commission Presented by: Ki r k Cont r ucci, CP Ayres Associates Zach Nienow Ayres Associates Adam Derringer, GISP Ayres Associates Type questions
Regional Centre for Mapping of Resources for Development (RCMRD), Nairobi, Kenya. Introduction GIS (2 weeks: 10 days)
, Nairobi, Kenya. Introduction GIS (2 weeks: 10 days)") Regional Centre for Mapping of Resources for Development (RCMRD), Nairobi, Kenya Introduction GIS (: 10 days) Intake Dates: 9 th Jan, 6 th Feb, 6 th Mar, 3 rd April, 8 th May, 5 th June, 3 rd July, 2017
Regional Centre for Mapping of Resources for Development (RCMRD), Nairobi, Kenya Introduction GIS (: 10 days) Intake Dates: 9 th Jan, 6 th Feb, 6 th Mar, 3 rd April, 8 th May, 5 th June, 3 rd July, 2017
1994: JV formed for civil engineering consultancy COWI/KX A/s, Denmark(51%) IFU, Denmark (24% ) IL&FS Infrastructure Dev Corp, India(25%)
 IFU, Denmark (24% ) IL&FS Infrastructure Dev Corp, India(25%)") Company Profile 1994: JV formed for civil engineering consultancy COWI/KX A/s, Denmark(51%) IFU, Denmark (24% ) IL&FS Infrastructure Dev Corp, India(25%) 1998: Start of mapping as a new segment of Business.
Company Profile 1994: JV formed for civil engineering consultancy COWI/KX A/s, Denmark(51%) IFU, Denmark (24% ) IL&FS Infrastructure Dev Corp, India(25%) 1998: Start of mapping as a new segment of Business.
Introduction to GIS I
 Introduction to GIS Introduction How to answer geographical questions such as follows: What is the population of a particular city? What are the characteristics of the soils in a particular land parcel?
Geomorphologic Mapping by Airborne Laser Scanning in Southern Victoria Land
 Geomorphologic Mapping by Airborne Laser Scanning in Southern Victoria Land Bea Csatho, Terry Wilson, Tony Schenk, Garry McKenzie, Byrd Polar Research Center, The Ohio State University, Columbus, OH William
Spanish national plan for land observation: new collaborative production system in Europe
 ADVANCE UNEDITED VERSION UNITED NATIONS E/CONF.103/5/Add.1 Economic and Social Affairs 9 July 2013 Tenth United Nations Regional Cartographic Conference for the Americas New York, 19-23, August 2013 Item
Wayne E. Sirmon GEO 301 World Regional Geography
 Wayne E. Sirmon GEO 301 Geography 301 Geography 301 MAP: A graphic representation of a portion of the earth s surface dawn to scale, as seen from above. Types of Maps Climate maps give general information
P R O U D LY C A N A D I A N
 P R O U D LY C A N A D I A N 1.855.423.3185 info@rmegeomatics.com AERIAL SURVEYING IMAGING TERRAIN ANALYSIS WHO WE ARE HSE & REGULATORY CLIENT INDUSTRIES RME Geomatics (formerly NGF Geomatics) was founded
COST Action ES nd Snow Science Winter School February 2016, Preda, Switzerland STSM Report
 Süheyla Sena AKARCA BIYIKLI COST Action ES1404 2 nd Snow Science Winter School 14-20 February 2016, Preda, Switzerland STSM Report 1. Introduction I have attended 2nd Snow Science Winter School which was
Oregon Water Conditions Report May 1, 2017
 Oregon Water Conditions Report May 1, 2017 Mountain snowpack in the higher elevations has continued to increase over the last two weeks. Statewide, most low and mid elevation snow has melted so the basin
GIS sources for terrain analyses
 8.5. 11.5.2018 GIS sources for terrain analyses major Ing. Josef Rada University of Defence Brno Czech Republic 1 Introduction - Project of VGHMÚř and University of Defence; - objective: search for the
Mapping Earth. How are Earth s surface features measured and modeled?
 Name Mapping Earth How are Earth s surface features measured and modeled? Before You Read Before you read the chapter, think about what you know about maps Record your thoughts in the first column Pair
MONITORING AND MODELING NATURAL AND ANTHROPOGENIC TERRAIN CHANGE
 MONITORING AND MODELING NATURAL AND ANTHROPOGENIC TERRAIN CHANGE Spatial analysis and simulations of impact on landscape processess Helena MITASOVA, Russell S. HARMON, David BERNSTEIN, Jaroslav HOFIERKA,
Chapter 6 Mapping and Online Tools
 Chapter 6 Mapping and Online Tools The stream site you monitor is just part of a much larger system. When analyzing stream health, it is important to take a holistic view by considering the entire watershed.
Which graph best shows the relationship between intensity of insolation and position on the Earth's surface? A) B) C) D)
 B) C) D)") 1. The hottest climates on Earth are located near the Equator because this region A) is usually closest to the Sun B) reflects the greatest amount of insolation C) receives the most hours of daylight D)
1. The hottest climates on Earth are located near the Equator because this region A) is usually closest to the Sun B) reflects the greatest amount of insolation C) receives the most hours of daylight D)
Active Glacier Protection in Austria - An adaptation strategy for glacier skiing resorts
 in Austria - An adaptation strategy for glacier skiing resorts Presented by Marc Olefs Ice and Climate Group, Institute of Meteorology And Geophysics (IMGI), University of Innsbruck Centre for Natural
Exercise: guided tour
 Exercise: guided tour Yves Bühler & Lukas Stoffel Seminar in snow, slush- and debris flows RAMMS Demonstration, September 3 rd 2013, Longyearbyen, Norway Swiss Federal Institute for Forest, Snow and Landscape
CUYAHOGA COUNTY URBAN TREE CANOPY & LAND COVER MAPPING
 CUYAHOGA COUNTY URBAN TREE CANOPY & LAND COVER MAPPING FINAL REPORT M IKE GALVIN S AVATREE D IRECTOR, CONSULTING GROUP P HONE: 914 403 8959 E MAIL: MGALVIN@SAVATREE. COM J ARLATH O NEIL DUNNE U NIVERSITY
- World-wide cities are growing at a rate of 2% annually (UN 1999). - (60,3%) will reside in urban areas in 2030.
. - (60,3%) will reside in urban areas in 2030.") THE EFFECTIVENESS OF NEW TECHNOLOGIES FOR URBAN LAND MANAGEMENT BAHAAEDDINE I. AL HADDAD Centro de Política de Suelo y Valoraciones Universidad Politécnica de Cataluña Barcelona, España www.upc.es/cpsv
THE EFFECTIVENESS OF NEW TECHNOLOGIES FOR URBAN LAND MANAGEMENT BAHAAEDDINE I. AL HADDAD Centro de Política de Suelo y Valoraciones Universidad Politécnica de Cataluña Barcelona, España www.upc.es/cpsv
RURBANCE Project Territorial System Factsheet
 Territorial System Identification data Name: Zurich Main urban center: Zurich Country: Switzerland State / Region: Canton of Zurich Map 1: A Zurich Metropolitan Area Zurich (Zurich and greater surroundings)
Polar bears must swim further than before
 Polar bears in Baffin Bay are affected by climate changes (Article based on the summary of the report A reassessment of the polar bears in Baffin Bay and Kane Basin (2011-2014). Scientists have now proved
Empowering water/wastewater network management with GIS
 Empowering water/wastewater network management with GIS Ioannis Kavouras_GIS Manager Surveying Engineer, MSc, MBA The Company responsible for fresh water distribution & sanitation serving 1.500.000 citizens
Measures Also Significant Factors of Flood Disaster Reduction
 Non-Structual Measures Also Significant Factors of Flood Disaster Reduction Babiaková Gabriela, Leškov ková Danica Slovak Hydrometeorological Institute, Bratislava Hydrological Forecasts and Warning Department
Series and Sequences, Binomial Theorem Review Paper 2
 1. Use the binomial theorem to complete this expansion. (3x + 2y) 4 = 81x 4 + 216x 3 y +...... 2. Determine the constant term in the expansion of... 3. Find the term containing x 10 in the expansion of
GIS Techniques for Avalanche Path Mapping and Snow Science Observations. By Douglas D. Scott AVALANCHE MAPPING/IDEA INTEGRATION
 GIS Techniques for Avalanche Path Mapping and Snow Science Observations GIS Techniques for Avalanche Path Mapping and Snow Science Observations. By Douglas D. Scott AVALANCHE MAPPING/IDEA INTEGRATION For
A) usually less B) dark colored and rough D) light colored with a smooth surface A) transparency of the atmosphere D) rough, black surface
 usually less B) dark colored and rough D) light colored with a smooth surface A) transparency of the atmosphere D) rough, black surface") 1. Base your answer to the following question on the diagram below which shows two identical houses, A and B, in a city in North Carolina. One house was built on the east side of a factory, and the other
1. Base your answer to the following question on the diagram below which shows two identical houses, A and B, in a city in North Carolina. One house was built on the east side of a factory, and the other
NASA, partners track rain, snow in soggy Washington 10 November 2015, byphuong Le
 NASA, partners track rain, snow in soggy Washington 10 November 2015, byphuong Le David Wolff, a research scientist with NASA, poses for a photo Friday, Nov. 6, 2015, next to one of the large radar instruments
Canada s Natural Systems. Canadian Geography 1202 September/October 2014
 Canada s Natural Systems Canadian Geography 1202 September/October 2014 Canada s Natural Systems Natural System: A system found in nature Here are the four natural systems that we will explore in the next
UAV APPLICATIONS IN ENGINEERING. Presented By Wohnrade Civil Engineers, Inc.
 UAV APPLICATIONS IN ENGINEERING Presented By Wohnrade Civil Engineers, Inc. UAV BUSINESS STARTUP March 31, 2015 - Obtained DJI Inspire 1 Unmanned Aerial Vehicle (UAV) FAA requires Certificate of Authorization
GEOGRAPHY (GE) Courses of Instruction
 Courses of Instruction") GEOGRAPHY (GE) GE 102. (3) World Regional Geography. The geographic method of inquiry is used to examine, describe, explain, and analyze the human and physical environments of the major regions of the
GEOGRAPHY (GE) GE 102. (3) World Regional Geography. The geographic method of inquiry is used to examine, describe, explain, and analyze the human and physical environments of the major regions of the
Spatial Survey of Surface Soil Moisture in a Sub-alpine Watershed
 Spatial Survey of Surface Soil Moisture in a Sub-alpine Watershed Katherine E. Williams M.S. GISc Candidate Department of Geography, University of Denver October 7, 2010 Purpose 2 Introduction to Soil
AUTOMATIC GENERATION OF 3D CITY MODELS AND RELATED APPLICATIONS
 International Archives of the Photogrammetry, Remote Sensing and Spatial Information Sciences, Vol. XXXIV-5/W10 AUTOMATIC GENERATION OF 3D CITY MODELS AND RELATED APPLICATIONS Y. Takase a, *, N. Sho a,
AVALANCHE FORECASTER EXCHANGE PROGRAM U.S. SWITZERLAND
 AVALANCHE FORECASTER EXCHANGE PROGRAM U.S. SWITZERLAND Matt Hill* Mount Shasta Avalanche Center, USDA Forest Service, Mt. Shasta City, CA, U.S.A. Thomas Wiesinger Swiss Federal Institute for Snow and Avalanche
CHAPTER 9: Systems of Equations and Matrices
 From Section 1.4: Equations of Lines and Modeling Use a graphing calculator to model the data with a linear function. MAT 171 Precalculus Algebra Dr. Claude Moore Cape Fear Community College CHAPTER 9:
Lesson Plan 2 - Middle and High School Land Use and Land Cover Introduction. Understanding Land Use and Land Cover using Google Earth
 Understanding Land Use and Land Cover using Google Earth Image an image is a representation of reality. It can be a sketch, a painting, a photograph, or some other graphic representation such as satellite
European Spatial Data Research. EuroSDR. Prof. Dr. Ir. Joep Crompvoets. General Assembly CLGE Tirana 18 March
 EuroSDR Prof. Dr. Ir. Joep Crompvoets General Assembly CLGE - 2016 Tirana 18 March 2016 INTRODUCTORY QUESTIONS Who knows what is EuroSDR? Who does NOT know what is EuroSDR? Who is employed at mapping agencies?
Using Map and Compass Together
 Using Map and Compass Together In situations where you foresee a potential evacuation on foot, where there are no roads, and no indication as to the direction of travel (i.e., road signs), it is recommended
Watershed Delineation in GIS Environment Rasheed Saleem Abed Lecturer, Remote Sensing Centre, University of Mosul, Iraq
 Watershed Delineation in GIS Environment Rasheed Saleem Abed Lecturer, Remote Sensing Centre, University of Mosul, Iraq Abstract: The management and protection of watershed areas is a major issue for human
THE USE OF GEOMATICS IN CULTURAL HERITAGE AND ARCHAEOLOGY FOR VARIOUS PURPOSES
 THE USE OF GEOMATICS IN CULTURAL HERITAGE AND ARCHAEOLOGY FOR VARIOUS PURPOSES FEBRUARY 2013 AL BEIDA GEOPLAN CONTENT Company Profile Concept Objectives and Strategies Data Production Methods Data Samples
Remote Sensing and EO activities at the University of Turku
 Remote Sensing and EO activities at the University of Turku Niina Käyhkö Associate Professor Department of Geography and Geology GEO meeting/syke May 23rd, 2018 Geospatial competence at the University
Newsletter Spring 2016
 Newsletter Spring 2016 April and May There was great changes about hide area ownership, previously the hide area was on rent for the company, but in January 2016 Wild Brown Bear bought the hide area and
SURVEYING Chapter 1 Introduction
 PHILADELPHIA UNIVERSITY Faculty of Engineering. Department of Civil Engineering. SURVEYING Chapter 1 Introduction Surveying : the art or science of measuring and representing natural and artificial features
Flood Mapping Michael Durnin October 9 th
 Michael Durnin October 9 th 2014 Leading Surveyors Company Profile Est. 1983 Celebrating 30 Years in Business Six Offices in UK & Ireland Over 30 Specialised Survey Services ISO 9001:2008 Registered Over
Waterborne Environmental, Inc., Leesburg, VA, USA 2. Syngenta Crop Protection, LLC, North America 3. Syngenta Crop Protection, Int.
 Application of High Resolution Elevation Data (LiDAR) to Assess Natural and Anthropogenic Agricultural Features Affecting the Transport of Pesticides at Multiple Spatial Scales Josh Amos 1, Chris Holmes
As the light approached Rogne, it gradually became weaker and disappeared within a few seconds - as when a lamp is dimming down.
 We are home after spending the Easter holidays in Hessdalen. We feel like writing down some of our experiences. My wife and I arrived in Hessdalen at noon, Wednesday, March 28th. We d rented a cabin on
USING HYPERSPECTRAL IMAGERY
 USING HYPERSPECTRAL IMAGERY AND LIDAR DATA TO DETECT PLANT INVASIONS 2016 ESRI CANADA SCHOLARSHIP APPLICATION CURTIS CHANCE M.SC. CANDIDATE FACULTY OF FORESTRY UNIVERSITY OF BRITISH COLUMBIA CURTIS.CHANCE@ALUMNI.UBC.CA
6 Linear Equations: Real
 www.ck12.org CHAPTER 6 Linear Equations: Real World Applications Chapter Outline 6.1 WRITING EQUATIONS 6.2 RATIOS AND PROPORTIONS 6.3 SCALE AND INDIRECT MEASUREMENT 6.4 PERCENT PROBLEMS Algebra can be
Tim Loesch Minnesota Department of Natural Resources
 Tim Loesch Minnesota Department of Natural Resources Agenda Status of State Project Where to get data What types of data are available How to download and retrieve information What to do after you download
NATIONAL HYDROGRAPHY DATASET (NHD) UPDATE PROJECT FOR US FOREST SERVICE REGION 3
 UPDATE PROJECT FOR US FOREST SERVICE REGION 3") NATIONAL HYDROGRAPHY DATASET (NHD) UPDATE PROJECT FOR US FOREST SERVICE REGION 3 Allison Moncada California State University, Northridge February 2018 July 2018 Advisor: Joel Osuna Center for Geospatial
NATIONAL HYDROGRAPHY DATASET (NHD) UPDATE PROJECT FOR US FOREST SERVICE REGION 3 Allison Moncada California State University, Northridge February 2018 July 2018 Advisor: Joel Osuna Center for Geospatial
CRITERIA FOR SELECTING AREAS FOR ORIENTEERING MAPS
 Abstract CRITERIA FOR SELECTING AREAS FOR ORIENTEERING MAPS Dusan Petrovic University of Ljubljana, Faculty of Civil and Geodetic Engineering, Ljubljana, Slovenia dusan.petrovic@fgg.uni-lj.si The paper
Abstract. TECHNOFAME- A Journal of Multidisciplinary Advance Research. Vol.2 No. 2, (2013) Received: Feb.2013; Accepted Oct.
 Received: Feb.2013; Accepted Oct.") Vol.2 No. 2, 83-87 (2013) Received: Feb.2013; Accepted Oct. 2013 Landuse Pattern Analysis Using Remote Sensing: A Case Study of Morar Block, of Gwalior District, M.P. Subhash Thakur 1 Akhilesh Singh 2
Vol.2 No. 2, 83-87 (2013) Received: Feb.2013; Accepted Oct. 2013 Landuse Pattern Analysis Using Remote Sensing: A Case Study of Morar Block, of Gwalior District, M.P. Subhash Thakur 1 Akhilesh Singh 2
LECTURE #11: Volcanoes: Monitoring & Mitigation
 GEOL 0820 Ramsey Natural Disasters Spring, 2018 LECTURE #11: Volcanoes: Monitoring & Mitigation Date: 15 February 2018 I. What is volcanic monitoring? the continuous collection of one or more data sources
New opportunities for high-resolution countrywide tree type mapping
 New opportunities for high-resolution countrywide tree type mapping Lars T. Waser, Bronwyn Price, Nataliia Rehush, Marius Rüetschi, and David Small* Swiss National Forest Inventory Swiss Federal Research
Climate change in the U.S. Northeast
 Climate change in the U.S. Northeast By U.S. Environmental Protection Agency, adapted by Newsela staff on 04.10.17 Word Count 1,109 Killington Ski Resort is located in Vermont. As temperatures increase
MEP Y7 Practice Book B
 8 Quantitative Data 8. Presentation In this section we look at how vertical line diagrams can be used to display discrete quantitative data. (Remember that discrete data can only take specific numerical
CLIMATE READY BOSTON. Climate Projections Consensus ADAPTED FROM THE BOSTON RESEARCH ADVISORY GROUP REPORT MAY 2016
 CLIMATE READY BOSTON Sasaki Steering Committee Meeting, March 28 nd, 2016 Climate Projections Consensus ADAPTED FROM THE BOSTON RESEARCH ADVISORY GROUP REPORT MAY 2016 WHAT S IN STORE FOR BOSTON S CLIMATE?
GENERATION OF 3D CITY MODELS FROM TERRESTRIAL LASER SCANNING AND AERIAL PHOTOGRAPHY: A CASE STUDY
 GENERATION OF 3D CITY MODELS FROM TERRESTRIAL LASER SCANNING AND AERIAL PHOTOGRAPHY: A CASE STUDY Hakan KARABORK 1, Fatih SARI 1 1 Selcuk University in Konya, Faculty of Engineering and Architecture Konya,
Lesson 4b Remote Sensing and geospatial analysis to integrate observations over larger scales
 Lesson 4b Remote Sensing and geospatial analysis to integrate observations over larger scales We have discussed static sensors, human-based (participatory) sensing, and mobile sensing Remote sensing: Satellite
How to buy a telescope for your institution
 How to buy a telescope for your institution by Dr. Frank Melsheimer DFM Engineering, Inc. 1035 Delaware Avenue, Unit D Longmont, Colorado 80501 phone 303-678-8143 fax 303-772-9411 www.dfmengineering.com
UNITED NATIONS E/CONF.96/CRP. 5
 UNITED NATIONS E/CONF.96/CRP. 5 ECONOMIC AND SOCIAL COUNCIL Eighth United Nations Regional Cartographic Conference for the Americas New York, 27 June -1 July 2005 Item 5 of the provisional agenda* COUNTRY
MAP STUDY: INTERPRETATION OF SURVEY MAPS
 MAP STUDY: INTERPRETATION OF SURVEY MAPS Types and Elements of Maps Maps are drawn to represent the Earth on a piece of paper. Maps are used widely to represent the Earth. Maps use signs and symbols in
LESSON 2: INTRODUCTION TO TOPOGRAPHICAL MAPS
 LESSON 2: INTRODUCTION TO TOPOGRAPHICAL MAPS Finding your way if you become separated from a group. PURPOSE This lesson presents an overview of topographic maps. It describes their characteristics and
2 nd Japan and Republic of Korea LiDAR Survey Symposium
 2 nd Japan and Republic of Korea LiDAR Survey Symposium 2010 年 9 月 20 日 Prof. Woosug Cho wcho@inha.ac.kr Spacematics Lab Department of Civil Engineering Inha University Presentation on Current Status in
HKND Group Ltd Grand Canal Project
 HKND Group Ltd Grand Canal Project General Overview of Aerial Survey Project Managua, Nicaragua September 21 st 2015 Presented by: Jeff Elliott Managing Director CSA Global About CSA Global CSA Global
AS 410 Land Navigation. Chpt 4-1
 AS 410 Land Navigation Chpt 4-1 Overview Types of Maps Map Legends / Scales Latitude and Longitude Orienteering Why? Why important to learn how to read a compass and map? No cell phone coverage Mountain
Tenth Grade Mathematics TAKS Student s Edition. Diagnose Remediate. Practice Reinforce. Evaluate PASS
 Practice Reinforce Diagnose Remediate Evaluate PASS Tenth Grade Mathematics TAKS Student s Edition 2007 TripleNterprises Publishing This program is protected by copyright law and international treaties.
Mapping a Nation in 3D Singapore s Journey. Bryan Chew Registrar of Titles Assistant Chief Executive Singapore Land Authority
 Mapping a Nation in 3D Singapore s Journey Bryan Chew Registrar of Titles Assistant Chief Executive Singapore Land Authority Singapore Size - 719 sq km Population - 5.5 million Density 7,600/sq km Singapore
Leveraging Sentinel-1 time-series data for mapping agricultural land cover and land use in the tropics
 Leveraging Sentinel-1 time-series data for mapping agricultural land cover and land use in the tropics Caitlin Kontgis caitlin@descarteslabs.com @caitlinkontgis Descartes Labs Overview What is Descartes
Introduction. Elevation Data Strategy. Status and Next Steps
 1 2 Introduction Elevation Data Strategy Status and Next Steps 3 Canada is the 2nd largest country in the world - 9.9 million sq km Surrounded by 3 oceans with 202 000 km of coastline Population over 35
Climatic change in the Alps
 Climatic change in the Alps Prof. Martin Beniston Martin.Beniston@unige.ch Wengen-2006 Workshop Overview Introduction Current and future climate in the Alps Potential impacts Conclusions 1 Introduction
The 3D Elevation Program: Overview. Jason Stoker USGS National Geospatial Program ESRI 2015 UC
 + The 3D Elevation Program: Overview Jason Stoker USGS National Geospatial Program ESRI 2015 UC + 2 A little history USGS has a long, proud tradition of mapmaking (2009) + 3 The changing times Mapping
C O P E R N I C U S F O R G I P R O F E S S I O N A L S
 C O P E R N I C U S F O R G I P R O F E S S I O N A L S Downstream Applications MALTA 2017-06-26 Pascal Lory, EUROGI EU EU EU www.copernicus.eu S c o p e Identifying urban housing density: Stella Ofori-Ampofo,
Vermont Soil Climate Analysis Network (SCAN) sites at Lye Brook and Mount Mansfield
 sites at Lye Brook and Mount Mansfield") Vermont Soil Climate Analysis Network (SCAN) sites at Lye Brook and Mount Mansfield 13 Years of Soil Temperature and Soil Moisture Data Collection September 2000 September 2013 Soil Climate Analysis Network
Vermont Soil Climate Analysis Network (SCAN) sites at Lye Brook and Mount Mansfield 13 Years of Soil Temperature and Soil Moisture Data Collection September 2000 September 2013 Soil Climate Analysis Network
Producing Quick Orienteering Maps. Step by Step from Open Street Map To Open Orienteering Mapper (and if you prefer) To OCAD 8, 9, 10 and 11 DRAFT
 To OCAD 8, 9, 10 and 11 DRAFT") Producing Quick Orienteering Maps Step by Step from Open Street Map To Open Orienteering Mapper (and if you prefer) To OCAD 8, 9, 10 and 11 Open Street Map is a free program on the Internet where you can
Producing Quick Orienteering Maps Step by Step from Open Street Map To Open Orienteering Mapper (and if you prefer) To OCAD 8, 9, 10 and 11 Open Street Map is a free program on the Internet where you can
ORIENTEERING I.E.S. JUANA DE CASTILLA ORIENTEERING. 3rd E.S.O. SECOND TERM P.E. DEPARTMENT
 3rd E.S.O. SECOND TERM 1 Orientation is the set of systems that allows us to recognize at all times: The situation of the cardinal points The place where we are The direction to take to reach the desired
Annex 4. Mapping Accessibility Protocol
 Annex 4. Mapping Accessibility Protocol Protocol for mapping accessibility to show travel time required to transport agricultural commodities in the Southwest Region, Cameroon 1.1 Introduction Accessibility
What we are trying to accomplish during the winter season
 What we are trying to accomplish during the winter season Safety first None of this is worth getting hurt over. Change your observation time if you delay your normal observation for safety reasons. Accuracy
Vegetation Change Detection of Central part of Nepal using Landsat TM
 Vegetation Change Detection of Central part of Nepal using Landsat TM Kalpana G. Bastakoti Department of Geography, University of Calgary, kalpanagb@gmail.com Abstract This paper presents a study of detecting
New Directions in Catastrophe Risk Models
 New Directions in Catastrophe Risk Models World Bank Brown-Bag Lunch Presentation October 9, 2007 Richard J. Murnane Baseline Management Company, Inc. Overview! Background on reinsurance and cat models!