2010 KMPO Base Calibration Travel Demand Model Update
|
|
|
- Cornelius Bridges
- 5 years ago
- Views:
Transcription
1 250 Northwest Blvd Suite 250 Coeur d Alene, ID (208) KMPO Base Calibration Travel Demand Model Update Final Documentation March 20, 2013 (KMPO Board accepted on December 13, 2012, Minor change; added updated version file name change, page 10, Para. 4.2) With Limited Assistance from: & PTV America, Inc.
2 Table of Contents Introduction Model Geography KMPO Model Data Sources KMPO Model Background KMPO Model Procedures KMPO Calculate Procedures KMPO Calculate Procedures Parameter Files KMPO Final Model Version Output File KMPO Calculate Procedures Model Run Comments KMPO Python Scripting KMPO Trip Generation Adjustment KMPO Land Use Update Land Use Classification Changes Land Use Summary AM & PM Peak Hour Trip Generation Rate Update Traffic Analysis Zone (TAZ) Update KMPO Auto Network Enhancements Link Types/Capacities Update Node Types Update Node Control Types Node Capacities Network Link/Node Delay Function Calibration External Trip Update Link Traffic Count Update Model s External Traffic Analysis Zone (TAZ) Update Traffic Counts AM/PM Peak Hour Trip Generation AM Peak Hour Trip Generation Validation PM Peak Hour Trip Generation Validation AM/PM Peak Hour Trip Distribution
3 11.1 AM Peak Hour Gravity Model Parameters PM Peak Hour Gravity Model Parameters Gravity Model Calibration/Validation Results AM/PM Peak Hour Traffic Assignments AM/PM Peak Hour Traffic Screenline Validation Allowable Deviation Standards Model Limitations and Improvements
4 List of Tables Table KMPO Land Use Data Summary Table 2 Updated AM Peak Hour Trip Rates in 2010 KMPO AM Model Table 3 Updated PM Peak Hour Trip Rates in 2010 KMPO PM Model Table 4 KMPO Link Type Classifications & Capacities Table 5 KMPO Node Type Classifications & Capacity Factors Table 6 KMPO Node Control Types Table AM/PM Peak Hour Counts at External TAZs (Adj) Table AM Peak Hour External-External Through Traffic Volumes Table PM Peak Hour External-External Through Traffic Volumes Table AM Peak Hour Trip Generation Validation Results Table PM Peak Hour Trip Generation Validation Results Table 12 Trip Distribution Utility Paramters AM PK HR Table 13 Trip Distribution Utility Paramters PM PK HR Table AM Peak Hour Average Trip Time (Minutes) Model vs. Google Table PM Peak Hour Average Trip Time (Minutes) Model vs. Google Table KMPO Model AM/PM Peak Hour Screenline Summary Results List of Figures Figure 1 KMPO Calculate Procedures (Step by Step) Figure 2 KMPO Calculate Procedures Model Run Comments Figure 3 KMPO Land Use Classifications Figure 4 Link Volume-Delay Functions Figure 5 Node Volume-Delay Functions Figure 6 AM PK HR Home-Based Work Gravity Model Functions & Parameters Figure 7 AM PK HR Home-Based Retail Gravity Model Functions & Parameters Figure 8 AM PK HR Home-Based Other Gravity Model Functions & Parameters Figure 9 AM PK HR Non-Home-Based Gravity Model Functions & Parameters Figure 10 AM PK HR Home-Based School Gravity Model Functions & Parameters Figure 11 PM PK HR Home-Based Work Gravity Model Functions & Parameters Figure 12 PM PK HR Home-Based Retail Gravity Model Functions & Parameters Figure 13 PM PK HR Home-Based Other Gravity Model Function & Parameters Figure 14 PM PK HR Non-Home-Based Gravity Model Functions & Parameters Figure 15 PM PK HR Home-Based School Gravity Model Functions & Parameters Figure 16 Model Flow Bundle to Calculate Travel Time (TT) Figure KMPO VISUM Model AM Peak HourAssignment Results Figure KMPO VISUM Model PM Peak Hour Assignment Results Figure KMPO VISUM Model AM Peak Hour Traffic Forecast Screenline Results Figure KMPO VISUM Model PM Peak Hour Traffic Forecast Screenline Results Figure KMPO Model AM Peak Hour Screenline Error Range Figure KMPO Model PM Peak Hour Screenline Error Range
5 Appendices Attached Appendix 1A: KMPO Project dir file.pdf... A-2 KMPO Project directory file that directs the model to the proper file location Appendix 1B: UpdateNodeLinkCapTWTL.par ct dir file.pdf... A-3 A parameter file that updates the node/link capacity Appendix 1C: KMPO-Final Calculate Procedures File AM_PM.par... A-4 A combined parameter file for the AM & PM peak hour KMPO Models Appendix 1D: 2010 KMPO Model AM Peak Hour Screenline Validation Spreadsheets... A-7 Appendix 1E: 2010 KMPO Model PM Peak Hour Screenline Validation Spreadsheets... A-17 Appendix 1F: Final Model Results "Assignment Analysis" Comparison... A-30 5
6 Introduction In 2007, Kootenai County updated the 2007 KMPO (Kootenai Metropolitan Organization) Travel Demand Forecasting VISUM Model. This 2010 update has improved the previous 2007 base model. The KMPO Model provides the existing 2010 AM and PM peak hour traffic volumes and is used as a base model to project future traffic forecasts for the AM and PM peak hour traffic in the Kootenai County-wide area. KMPO staff performed the 2010 model update calibration/validation with some guidance and assistance from PTV America, Inc., and Eco Resource Management System Inc. The 2007 KMPO base model was updated to become the 2010 KMPO base model. The majority of the 2007 modeling components were left as they were in the last update. This documentation outlines what has been changed since the last 2007 model update. Travel demand forecasting models update the existing base year model every year or every other year or every five years depending on the land use growth and transportation improvements in the modeling area. This is because the traffic volume on streets and roadways change due to the changes in the land use and the transportation system. The 2010 KMPO model update is expected to revalidate the 2007 existing base year model to reflect the most current 2010 conditions. In addition, since the 2007 version, the 2010 KMPO model application added some enhancements that were found necessary to improve the 2010 KMPO model and forecasting capabilities. Basic technical information about the 2007 KMPO VISUM model is provided in the Kootenai County (KMPO) 2007 KMPO Base Calibration Travel Demand Model Update Documentation. This report is focused on the 2010 KMPO travel demand model update, including enhancements. In this KMPO 2010 model update, KMPO technical staff made the following changes, which are addressed in the fourteen sections of this report as shown below: Model Geography KMPO Model Data Sources KMPO Model Background 4. KMPO Model Procedures KMPO Land Use Update AM & PM Peak Hour Trip Generation Update Traffic Analysis Update (TAZ) KMPO Auto Network Enhancements 9. Traffic Counts 10. AM/PM Peak Hour Trip Generation 11. AM/PM Peak Hour Trip Distribution 12. AM/PM Peak Hour Traffic Assignments 13. AM/PM Peak Hour Traffic Screenline Validation 6
7 14. Model Limitations and Improvements More detailed technical specifications and model update descriptions are provided to assist the KMPO model users in their understanding of the model applications, data input and output, and validation results. Attached appendices illustrate even more technical information related to the VISUM model script and parameter files, and the 2010 AM/PM peak hour detailed screenline validation spreadsheets Model Geography Kootenai County Area County 2010 Population 138,494 Model Vehicle Miles Traveled (VMT) 332,273 miles, in the model network classified at the collector classification or higher Total 2010 Occupied Dwelling Units 54,199 7
8 KMPO Model Data Sources Data from many agencies are compiled and analyzed for input into the travel demand model. The model is used for transportation travel demand forecasting. Ensuring that the most accurate, reliable and available data is used as well as having a well calibrated and validated model, is vitally important for accurate travel demand forecasting. KMPO uses the following data sources for input into the model: A regional household survey is used to estimate current travel behavior. KMPO s most recent survey was performed in 2005 and can be found on our website ( listed under Maps/Data/Publications/Spokane and Kootenai County Regional Travel Survey Household surveys are typically done every 10 years US Census Bureau Decennial data (every 10 years) for population, housing and Transportation Analysis Zones (TAZ s) information based currently on the block level. The interim years are calculated based on historical growth Idaho Department of Labor for current employment data Kootenai County for current housing statistics and Geographical Information Systems (GIS) data Building Permits from local jurisdictions Additional information that is not readily available is obtained from local sources such as: school & college enrollment, number of rooms in hotels/motels, casino s parking spaces, recreation number of camping spaces, etc.) Comprehensive Plans from Kootenai County and Local Jurisdictions Traffic Counts Real Estate Reports and other verified published professional reports for reasonableness checks 8
9 KMPO Model Background The Kootenai Metropolitan Planning Organization (KMPO) was formed in The first KMPO traditional four step travel demand model for the AM Peak Hour and the PM Peak Hour was developed by KMPO staff and PTV of America in The typical gravity demand model is called a four step model and is based upon: Trip Generation, Trip Distribution, Mode Choice and Route Assignment. Mode choice is made up of private cars, public transit such as buses, and/or non-motorized travel. The KMPO model is currently a three step model, having only one mode choice which is private vehicles. This mode choice feature is planned to be expanded upon in the future adding other mode choices. The model was updated in 2005 by PTV of America. In 2007 the model was updated by HDR Inc. and recently has been updated for 2010 by KMPO staff with assistance from Eco Resource Management Systems Inc. and PTV of America. 9
 As shown in Figure 1, the KMPO Calculate Procedure (a step by step procedure) is used in lieu of the previous KMPO Graphic Users Interface (GUI) for output")
10 4.0 KMPO Model Procedures 4.1 KMPO Calculate Procedures (Step by Step) As shown in Figure 1, the KMPO Calculate Procedure (a step by step procedure) is used in lieu of the previous KMPO Graphic Users Interface (GUI) for output files for the AM and PM peak hour traffic forecasts in the Kootenai County area. Using the Calculate Procedures allows partial model runs (such as only the AM Peak hour) as well as visual checks to see and understand how each step is performing, which can be missed when running a GUI behind the scenes. Figure 1 KMPO Calculate Procedures (Step by Step) 4.2 KMPO Calculate Procedures Parameter Files Project directory KMPO Project dir file.pfd (shown in Appendix 1A) is a VISUM project directory file, which specifies where the model runs. Base Version KMPO_2010_FINAL DRAFT Base_ ver is a 2010 Base KMPO VISUM Model version file in the project directory. The base model was validated and later resaved in VISUM Version and renamed as KMPO_2010_FINAL_Base_ ver. This includes the updated 2010 land uses and 2010 existing roadway network. Node Link Capacity Update UpdateNodeLinkCapTWTL.par (shown in Appendix 1B) is a link and node capacity update parameter file. 10

11 AM & PM Peak Assignment Is included in the KMPO-Final Calculate Procedures File AM_PM.par (shown in Appendix 1C). This file combines the AM & PM peak hour model runs into one parameter file that feeds the trip generation, trip distribution, and trip assignment model run for each peak hour time period. AM/PM Peak Hour Trip Generation - The trip generation rates were updated using ITE trip generation rates. The trip generation rates are built-in to the Trip Generation assignment portion of the AM & PM Peak Calculate Procedures assignment.par file (mentioned above). The trip generation for household stratifications: HBW, HBR, HBO, HBS and NHB, match the 2005 Kootenai County Travel Survey trips (trips grown from 2005 to 2010). 4.3 KMPO Final Model Version Output File Final Version KMPO_2010_FINAL_Base_ is a final 2010 Base KMPO VISUM Model version file saved in the project directory after the completed AM/PM Peak Hour Model runs. 4.4 KMPO Calculate Procedures Model Run Comments After the completed final model run, the Calculate Procedures comment area displays comments shows whether the model executed properly with success along with; start time, end time, duration, and any comments showing changes found or errors encountered. The final base model ran correctly with no errors or comments as shown in Figure 2 below: Figure 2 KMPO Calculate Procedures Model Run Comments 4.5 KMPO Python Scripting The python model script file was omitted from this update since it was created to run the GUI, which was eliminated. 11
12 4.6 KMPO Trip Generation Adjustment The trip generation adjustment that was made to the 2007 model update was also eliminated. The adjustment was another methodology used to adjust the number of trips in the model. It was determined that it was unnecessary in the current model update. 12
13 KMPO Land Use Update After reviewing the statistical data reporting of the Idaho Department of Labor (DOL) and the 2007 KMPO AM and PM peak hour trip generation rates in Table 1 and Table 2 (page 5) of the Kootenai County (KMPO) 2007 KMPO Base Calibration Travel Demand Model Update Documentation, KMPO decided to re-classify the land use categories to more closely match the way that the Idaho DOL reports the employment data. This allows KMPO to more easily match up to the Idaho DOL labor statistics for comparisons. One difference noted is that the Idaho DOL reports a few unanticipated employees under government workers. This is noted under the land use documentation binder, 2010 Model Update Documentation. The trip generation rates remained the same, just moved to a different classification. The classifications that incurred changes are noted in 5.1 & 5.2 below: Land use data are important inputs to travel demand forecasting models because land uses generate travel activities and demands. To make accurate travel demand forecasts, modelers should strive to verify the accuracies of land use data in the traffic analysis zones (TAZ). KMPO staff took several rounds of land use reviews and verifications with local jurisdictions to ensure no errors exist in the land use data by TAZ. 5.1 Land Use Classification Changes In the previous 2007 KMPO model, sixteen land use categories were made based on NAICS codes. In the 2010 KMPO land use update, all of the previous land use classifications 1 through 6 remained the same. Some abbreviations were changed or added to simplify the coding in the model attributes. Land use categories were modified as outlined in 2.0 through 2.9, for a total of twenty three land use categories as shown in the following land use classifications were modified, added or changed from the last 2007 update: 13

14 Figure 3 KMPO Land Use Classifications 14
15 KMPO Land Use Updated Classifications (Continued) 15
16 Land Use Summary After KMPO staff updated the 2010 land use by TAZ, a control total check was made to ensure that the primary residential dwelling units match the local US Decennial census data. Table 1 shows the total 2010 land use data. As shown in Table 1, the 2010 household number should be less than the sum of SFDU + MFDU + OUTER SFDU, which is 30, ,105 = 54,199 total occupied dwelling units countywide. The 2010 US Decennial Census reported a total of 63,177 total housing units with an overall vacancy rate of 14.2%. The following is a summary of the land uses and totals obtained from the 2010 US Decennial Census, the Idaho Department of Labor and other sources manually obtained by KMPO staff through correspondence, phone calls or the internet: Table 1: 2010 KMPO Land Use Data Summary Land Use Type Total Units in KMPO Area Units of Measurement LU1: SFDU (Single Family Dwelling Units) 30,967 Dwelling Units LU2: MFDU (Multi-Family Dwelling Units) 8,127 Dwelling Units LU3: Retail 7,559 Employees LU4: Commercial (FIRES) Employees LU5: Industrial 5,392 Employees LU6: Schools 23,232 Students LU7: Accommodations 2,900 Rooms LU8: Arts, Entertainment &Recreation 19,266 Spaces LU9: Reserved for Outer Zone SFDU Dwelling Units LU10: Post Secondary Schools 11,833 Students LU11: Agriculture 783,898 Acres LU12: Waterfront Units Not Used Dwelling Units U13: Publicly owned lands 301,783 Acres LU14: Transportation & Warehousing 925 Employees LU15: Medical 7,907 Employees LU16: Government 2,824 Employees 16
17 Land Uses Added to correlate closer to the Idaho Department of Labor statistics reporting: LU 17: Administration & Support LU 18: Professional, Science & Technology LU19: Educational Services LU 20: Other Services LU 21: Information LU 22: Utilities & Construction LU 23: Food Services 3,346 Employees 2,210 Employees 3,804 Employees 1,187 Employees 714 Employees 3,844 Employees 4,228 Employees Note: FIRES stands for Finance, Insurance, Real Estate and Services 17
18 AM & PM Peak Hour Trip Generation Rate Update Table 2 shows the AM peak hour trip generation rates, based on ITE trip generation rates, which are applied in the calculate procedures parameter file under the 2010 KMPO AM Peak Hour Model Run. Table 3 shows the PM peak hour trip generation rates, based on ITE trip generation rates, which are applied in the calculate procedures parameter file under the 2010 KMPO PM Peak Hour Model Run. 18
19 Table 2: Updated AM Peak Hour Trip Rates in 2010 KMPO AM Model LU ATT HW-O HW-D WH-O WH-D HR-O HR-D RH-O RH-D HO-O HO-D OH-O OH-D HS-O HS-D SH-O SH-D NHB-O NHB-D Total-O Total-D TOT O+D 1 SFDU MFDU RETAIL FIRES INDUST SCH ACCOM AER OSFDU PSS AGRI Not Used POL TRNWH MED GOVT ASWMR PSTMC EDUSRV OTHER INFO UTLCONST FS XI O AM Note: Numbers rounded in table 19
20 Table 3: Updated PM Peak Hour Trip Rates in 2010 KMPO PM Model LU ATT HW-O HW-D WH-O WH-D HR-O HR-D RH-O RH-D HO-O HO-D OH-O OH-D HS-O HS-D SH-O SH-D NHB-O NHB-D Total-O Total-D TOT O+D 1 SFDU MFDU RETAIL FIRES INDUST SCH ACCOM AER OSFDU PSS AGRI WFRT POL TRNWH MED GOVT ASWMR PSTMC EDUSRV OTHER INFO UTLCONST FS XI-O-PM IX-D-PM Note: Numbers rounded in table 20
21 Traffic Analysis Zone (TAZ) Update Another major network update to the base model are the TAZ s and the centroid connector revisions. The 2010 US Decennial Census required MPO s to revise the TAZ boundaries based on certain requirements of population or employment densities and to match the block level. Due to this recommendation by the US Census Bureau, some TAZ s were split, some were added and some were re-numbered to meet the recommended criteria. Within each TAZ are centroid connectors extending out from the center of the TAZ to a point on the roadway that loads trips from all of land uses within that zone onto the roadway network. Centroid connectors are coded in travel demand models to emulate local driveways for vehicle trips to access and egress the TAZ centroid. Many of the connectors were affected by the revision of the TAZ s due to the 2010 US Census requirements. The jurisdictions reviewed the TAZ changes as well as the connectors and made changes to the connector locations and/or percentages where they felt it was necessary. 21
22 KMPO Auto Network Enhancements Between 2007 and 2010, several roadway improvement projects were made in the KMPO area. The 2010 roadway network should include these improvements to reflect what s on the ground in Updates were made to the project list by the jurisdictions and the changes were reflected in the base model network for any projects already existing in the year Link Types/Capacities Update The link capacities were updated in the network to simulate the travel patterns in the region. The link types and capacity ranges are listed in Table 4 below: Link Type # 2010 Base Model Link Capacities & Ranges NAME CAPPRT Range 1 Rural Freeway Urban Interstate Urban Principal Arterial I Urban Principal Arterial II Rural Principal Arterial Type II Rural Principal Arterial I Rural Minor Arterial I Rural Minor Arterial Local Street Rural Local Street Rural Minor Collector I Rural Major Collector I Urban Minor Arterial II Urban Minor Arterial I Urban Collector Arterials I Urban Collector Arterials II Ramps Rural Ramps Rural Highways Urban Ramp I 1600 Table 4: Link Type Classifications & Capacities 22
23 8.2 Node Types Update The node types were updated from the previous model versions. These were modified to represent current practice in Table 5 below: Node Type Node Description Node Capacity Equation (vph) C = K 1 + K 4 * (Ent. Capacity) K 1 K 4 1 Shape Nodes Centroid Connector Nodes Ramp Diverge Ramp Merge At-Grade Rail Crossing (UPRR 5-7 Trains/Day) At-Grade Rail Crossing (BNSF up to 70 Trains/Day) All Way Stop Partial Stop Control (Two Way Stop) Yield Control Uncontrolled Intersections Signalized Intersections Pedestrian Only Signal or Mid-Block Crosswalk with large volume 99 Future Intersections 1.00 Table 5: Node Type Classifications & Capacity Factors - Note: K 4 factor variances listed for the node types above are calculated and are dependent upon the incoming and outgoing link capacities within the intersection (see 8.4 below). The factors are calculated internally within the Calculate Procedures for links and nodes. 23
24 8.3 Node Control Types Control Type Description 0 Unknown 1 Uncontrolled 2 2 Way Stop 3 Signalized 4 All Way Stop Table 6: KMPO Node Control Types 8.4 Node Capacities Using capacities at all nodes is one of VISUM s three options to model delays based upon traffic congestion at the intersections. This feature has been incorporated into the KMPO model so that delays at these critical points on the network can be modeled to reflect the impacts upon traffic flow patterns. For this model, VISUM calculates preliminary node capacities using the following node equation: Cap. = K 1 + K 4 (Ent. Cap) where: Cap. = Intersection capacity K1 = Capacity Constant added or subtracted in computation K4 = Capacity Factor multiplied by sum of entering link capacities Entr. Cap. = Sum of entering Capacities from all links entering the node Node capacities for this model use the K 1 and K 4 constants. K 4 was used to simulate the effect that a green time-to-cycle length (G/C) ratio has at an intersection. Table 5 lists the capacity constraints for the VISUM node capacity equations. The capacities work with the node coefficients to compute the delay at each intersection depending on the volume of entering traffic. When adding or editing nodes it is important that the K 1 and K 4 constants be properly modified, for this reason, the calculation was built into the calculate procedures parameter file and is automatically updated at the beginning of each model run. 24


25 8.5 Network Link/Node Delay Function Calibration The link and node delay functions use the BPR function in this update as recommended by the ERMSI. Figure 4: Link Volume-Delay Functions Intersection node delay functions were revised, as shown in Figure 5 below, for the arterial and local street traffic turning volumes. Figure 5: Node Volume-Delay Functions 25
26 External Trip Update In the 2010 KMPO model, the trips coming from and to external areas are not based on the land use data for trip generation but instead are based on the existing 2010 directional traffic counts at the external stations. Fourteen external stations (TAZ 576 TAZ 591) were used in the 2010 KMPO model to conceptually represent external TAZs. Table 6 lists all of AM and PM peak hour directional traffic count data at each of the external TAZs. Note X-I stands for from External to Internal and vice versa. Table 7 and Table 8 respectively list the 2010 AM and PM peak hour external-external through trips, which were also extracted from the external traffic counts and adjusted using the VISUM T-Flow Fuzzy method as input to the 2010 KMPO model. (The VISUM T-Flow Fuzzy process adjusts the demand matrices to better match the actual traffic counts) Link Traffic Count Update The 2010 AM and PM peak hour traffic counts were coded by KMPO staff in the KMPO model for the purpose of model validation. Regression analyses can be directly performed by using the model volumes to compare with the peak hour traffic counts. Counts for other time periods were also coded by KMPO staff, such as: AM Peak Period (6 AM 9 AM), Mid-day Period (9 AM 3 PM), PM Peak Period (3 PM 6 PM), Night Period (6 PM 6 AM), and 24-Hour Daily Period (6 AM 6 AM), which will be used to verify the daily volume forecasts. 26
27 8.8 Model s External Traffic Analysis Zone (TAZ) Update The external stations exist at the model borders and are used to simulate traffic entering and exiting the travel demand model. Actual traffic counts were used at each external TAZ station and then adjusted using the VISUM T-Flow Fuzzy process to correct the internal model matrices to match the counts. A travel demand model uses matrices to calculate the trip generation and distribution from a trip origin to a trip destination. Table 6 shows the adjusted counts at the external to internal (X-I) and internal and external (I-X) count locations for both the AM PK Hr and PM PK Hr time frames. Tables 8 & 9 respectively show the internal matrices that correspond to the external to external TAZ s (travel beginning at one external TAZ and exiting at the other external TAZ location). TAZ # Location XI-O-AM IX-D-AM XI-O-PM IX-D-PM 576 State Hwy N. County Line US 95 - N. County Line Bayview Road - N. County Line E. Canyon Road - E. County Line I-90 - E. County Line Future State Hwy. 3 - S. County Line Heyburn Rd. - S. County Line US 95 - S. County Line W. Worley West Rd. - W. County Line State Hwy. 58 (E. Hoxie Rd.) - W. County Line W. Riverview Drive - W. County Line I-90 - W. County Line Seltice Way - W. County Line State Hwy. 53 (Trent Ave.) - W. County Line TOTALS Table 7: 2010 AM/PM Peak Hour Counts (Adjusted using T-Flow Fuzzy method) at External TAZs 2010 KMPO Travel Demand Model Enhancements 27 Draft Final Report
28 2010 AM Peak Hour External External Through Traffic Volumes TAZ No. Name State Hwy 41 North County Line US 95 North County Line Bayview Rd. North County Line East Canyon Rd. East County Line I 90 East County Line FUTURE (Not Used) State Hwy 3 South County Line Heyburn Rd. South County Line US 95 South County Line Worley West Road West County Line State Hwy 58 (East Hoxie Rd.) West County Line West Riverview Drive West County Line I 90 West County Line Seltice Way West County Line State Hwy 53 (Trent Ave.) West County Line Table 8: 2010 AM Peak Hour External-External Through Traffic Volumes 2010 KMPO Travel Demand Model Enhancements 28 Draft Final Report
29 2010 PM Peak Hour External External Through Traffic Volumes TAZ No. Name State Hwy 41 North County Line US 95 North County Line Bayview Rd. North County Line East Canyon Rd. East County Line I 90 East County Line FUTURE (Not Used) State Hwy 3 South County Line Heyburn Rd. South County Line US 95 South County Line Worley West Road West County Line State Hwy 58 (East Hoxie Rd.) West County Line West Riverview Drive West County Line I 90 West County Line Seltice Way West County Line State Hwy 53 (Trent Ave.) West County Line Table 9: 2010 PM Peak Hour External-External Through Traffic Volumes 2010 KMPO Travel Demand Model Enhancements 29 Draft Final Report
30 9.0 Traffic Counts Existing 2007 and 2008 traffic counts were grown up to the update year of 2010 to be used for the 2010 KMPO base model validation. The existing traffic count data had previously been collected during normal travel patterns, taken in 15 minutes increments, 24 hours a day, for a five day period (Monday through Friday), in the spring and/or fall of the years 2007 or Traffic counts are checked for errors and consistency to ensure they are accurate. Traffic counts taken exclude: weekends, holidays, vacation days, and construction. Three out of the five days of data are then averaged for each of the following model periods: AM period (6 AM 9AM), AM peak hour (7-8 AM), Midday (9 AM 3 PM), PM period (3 PM 6 PM), PM Peak hour (5 PM 6 PM) and the Nighttime period (6 pm 6 am), as previously mentioned in chapter 8.4. Any suspect counts (example: tube malfunctioned) during that time period are excluded and another day will be used to calculate the average. The AM Peak Hour, PM Peak Hour, AM Period and PM Period actual traffic counts are used to validate the modeled traffic volumes and are discussed later in the Screenline Validation section of this documentation. A traffic count analysis was also performed using the Idaho Transportation Department s (ITD) Automatic Traffic Recorder (ATR) data analysis, over the last 20 year period from 1990 to During the five year period from 2005 to 2010, the analysis showed an average growth rate of 2.34% per year and the more recent analysis between the years 2008 to 2010 showed an average growth rate of 1.06% per year. While the ATR count data reflects the mainline regional traffic growth, it may not accurately reflect local roadway network growth. An estimated 2% per year was used, as a fair and reasonable compromise to grow the existing 2007/2008 traffic counts to
31 10.0 AM/PM Peak Hour Trip Generation The KMPO VISUM model trip generation is categorized by four primary trip purposes. After the AM and PM peak hour trip generation model is run, the total KMPO region-wide trip productions and attractions are summarized to compare with the expanded travel survey samples reported in the Spokane and Kootenai County Regional Travel Survey Final Report. NuStats was contacted during this model update to separate out the actual AM Pk Hr, PM Pk Hr and School trip percentages from the 2005 travel survey that was done. Previously, the survey report excluded this specific peak hour information and was estimated in the prior 2007 model update. The calculated 2010 trip generation rates were then checked against the 2005 Kootenai County/Spokane County travel survey results for both the AM and PM Peak Hour time frames AM Peak Hour Trip Generation Validation Table 10 lists the 2010 AM peak hour trip generation model percentages results compared with the actual AM peak hour (7 AM 8 AM) trips as reported by NuStats. The AM peak hour model results show reasonable comparison with the survey results as the percentage of modeled vehicle trips that exclude the external inbound, outbound, and through trips. The 2005 Kootenai County/Spokane Travel survey percentages were used to calculate the trip generation rates in the model. AM PK HR % of Trips Modeled 2010 Base Model AM PK HR of 2005 Trips Reported by NuStats TRIP PURPOSE Home Based Work 24.1% 25.2% Home Based Retail 5.1% 5.3% Home Based Other 29.3% 28.2% Non Home Based 21.8% 20.7% School not included in other trip purposes 19.7% 20.6% Total 100% 100% Table 10: 2010 AM Peak Hour Trip Generation Validation Results 31
32 10.2 PM Peak Hour Trip Generation Validation Table 11 lists the 2010 PM peak hour trip generation model percentages results compared with the actual PM peak hour (5 PM 6 PM) trips as reported by NuStats. The PM peak hour model results show reasonable comparison with the survey results as the modeled vehicle trips that exclude the external inbound, outbound and through trips. The 2005 Kootenai County/Spokane Travel survey percentages were used to calculate the trip generation in the model. The trip generation rates were then checked against the 2005 Kootenai County/Spokane County travel survey results. PM PK HR % of Trips Modeled 2010 Base Model PM PK HR of 2005 Trips Reported by NuStats TRIP PURPOSE Home Based Work 13.4% 13.4% Home Based Retail 10.8% 10.6% Home Based Other 47.6% 48.1% Non Home Based 26.5% 26.2% Schools not included in other trip purposes 1.7% 1.7% Total 100% 100% Table 11: 2010 PM Peak Hour Trip Generation Validation Results 32

33 11.0 AM/PM Peak Hour Trip Distribution The KMPO VISUM model trip distributions by four primary trip purposes are based on Gravity Model functions. The a, b, and c parameters in the Gravity Model functions are re-calibrated in the 2010 KMPO model to fit the trip length distribution patterns in terms of frequencies and average travel times reported in the Spokane and Kootenai County Regional Travel Survey Final Report AM Peak Hour Gravity Model Parameters Figure 6 displays the AM PK HR home-based work gravity model function parameters and other trip distribution characteristics, such as: direction of the trip distribution balance to production; doubly constrained balancing by Multi procedure; multi-parameters with maximum number of iterations being 10 and quality factor being 3. Figure 6: AM PK HR Home-Based Work Gravity Model Functions 33

34 Figure 7 below, displays the AM PK HR Home-Based Retail gravity model function parameters and other trip distribution characteristics discussed above. Figure 7: AM PK HR Home-Based Retail Gravity Model Functions Figure 8 below, displays the AM Home-Based Other gravity model function parameters and other trip distribution characteristics. Figure 8: AM PK HR Home-Based Other Gravity Model Functions 34

35 Figure 9 below, displays the AM PK HR Non-Home-Based gravity model function parameters and other trip distribution characteristics. Figure 9: AM PK HR Non-Home-Based Gravity Model Functions Figure 10 below, displays the AM PK HR Home-Based School gravity model function parameters and other trip distribution characteristics. Figure 10: AM PK HR Home-Based School Gravity Model Functions 35
36 The trip distribution utility parameters are summarized in Table 12 below: Trip Distribution Parameter Trip Purpose a b c HB-Work HB-Retail HB-Other Non-Home Based HB-School Table 12: Trip Distribution Utility Parameters AM PK HR 11.2 PM Peak Hour Gravity Model Parameters Figure 11 displays the PM PK HR home-based work gravity model function parameters and other trip distribution characteristics, such as: direction of the trip distribution balance to production; doubly constrained balancing by Multi procedure; multi-parameters with maximum number of iterations being 10 and quality factor being 3. Figure 11: PM PK HR Home-Based Work Gravity Model Functions 36


37 Figure 12 displays the PM PK HR Home-Based Retail gravity model function parameters and other trip distribution characteristics discussed above. Figure 12: PM PK HR Home-Based Retail Gravity Model Functions Figure 13 displays the PM PK HR Home-Based Other gravity model function parameters and other trip distribution characteristics. Figure 13: PM PK HR Home-Based Other Gravity Model Functions Figure 14 displays the PM PK HR Non-Home-Based gravity model function parameters and other trip distribution characteristics. 37

38 Figure 14: PM PK HR Non-Home-Based Gravity Model Functions Figure 15 displays the PM PK HR Home-Based School gravity model function parameters and other trip distribution characteristics discussed above. Figure 15: PM PK HR Home-Based School Gravity Model Functions 38
39 The trip distribution utility parameters are summarized in Table 13 below: Trip Distribution Parameter Trip Purpose a b c HB-Work HB-Retail HB-Other Non-Home Based HB-School Table 13: Trip Distribution Utility Parameters PM PK HR 11.3 Gravity Model Calibration/Validation Results A random sampling of travel times from one traffic analysis zone (TAZ) to another were extracted from the model using flow bundles. The same path was input into google map to estimate actual travel times during the AM PK hour and PM PK hours. As shown in Table 14 and 15, the average model travel time roughly matches the average survey travel time for overall KMPO region-wide, despite some average travel time variations. Table 14: 2010 AM Peak Hour Average Travel Time (Minutes) 2010 Base Model Vs. Google Estimated Travel Times (In Current Traffic when available) O D From Difference Zone Zone Place To Place Length T0 TCur Google TT Cabelas Rathdrum 11.98mi 14min 16min 18min 2min Cabelas Silverwood Vic mi 25min 37min 37min 0min KMPO Silverwood Vic mi 23min 27min 27min 0min State Line Kootenai Medical Center 13.05mi 12min 14min 13min 1min State Line Kootenai East Border 43.88mi 37min 39min 40min 0min State Line E/O Worley 45.03mi 43min 48min 46min 2min E/O Worley Athol 50.10mi 52min 61min 57min 4min Hauser Lake Downtown CDA 16.07mi 17min 24min 23min 1min Legend: TT= Travel Time, O Zone = OriginZone, D Zone = Destination Zone, T0= Free flow TT, TCur (Congested TT). 39
 O D From Google Difference Zone Zone Place To Place Length T0 TCur TT 401 20 Cabelas Rathdrum 11.")
40 Table 15: 2010 PM Peak Hour Average Travel Time (Minutes) 2010 Base Model Vs. Google Estimated Travel Times (In Current Traffic when available) O D From Google Difference Zone Zone Place To Place Length T0 TCur TT Cabelas Rathdrum 11.98mi 15min 17min 19min 2min Cabelas Silverwood Vic mi 25min 37min 40min 3min KMPO Silverwood Vic mi 23min 29min 31min 2min State Line Kootenai Medical Center 13.05mi 12min 16min 15min 1min State Line Kootenai East Border 43.88mi 37min 41min 40min 1min State Line E/O Worley 45.03mi 43min 52min 48min 3min E/O Worley Athol 50.10mi 52min 65min 62min 3min Hauser Lake Downtown CDA 16.07mi 17min 24min 26min 2min Legend: TT= Travel Time, O Zone = OriginZone, D Zone = Destination Zone, T0= Free flow TT, TCur (Congested TT). Figure 16 : Model Flow Bundle to Calculate Travel Time The model flow bundle path to calculate the congested average travel time (tcur) from one TAZ zone to another. 40
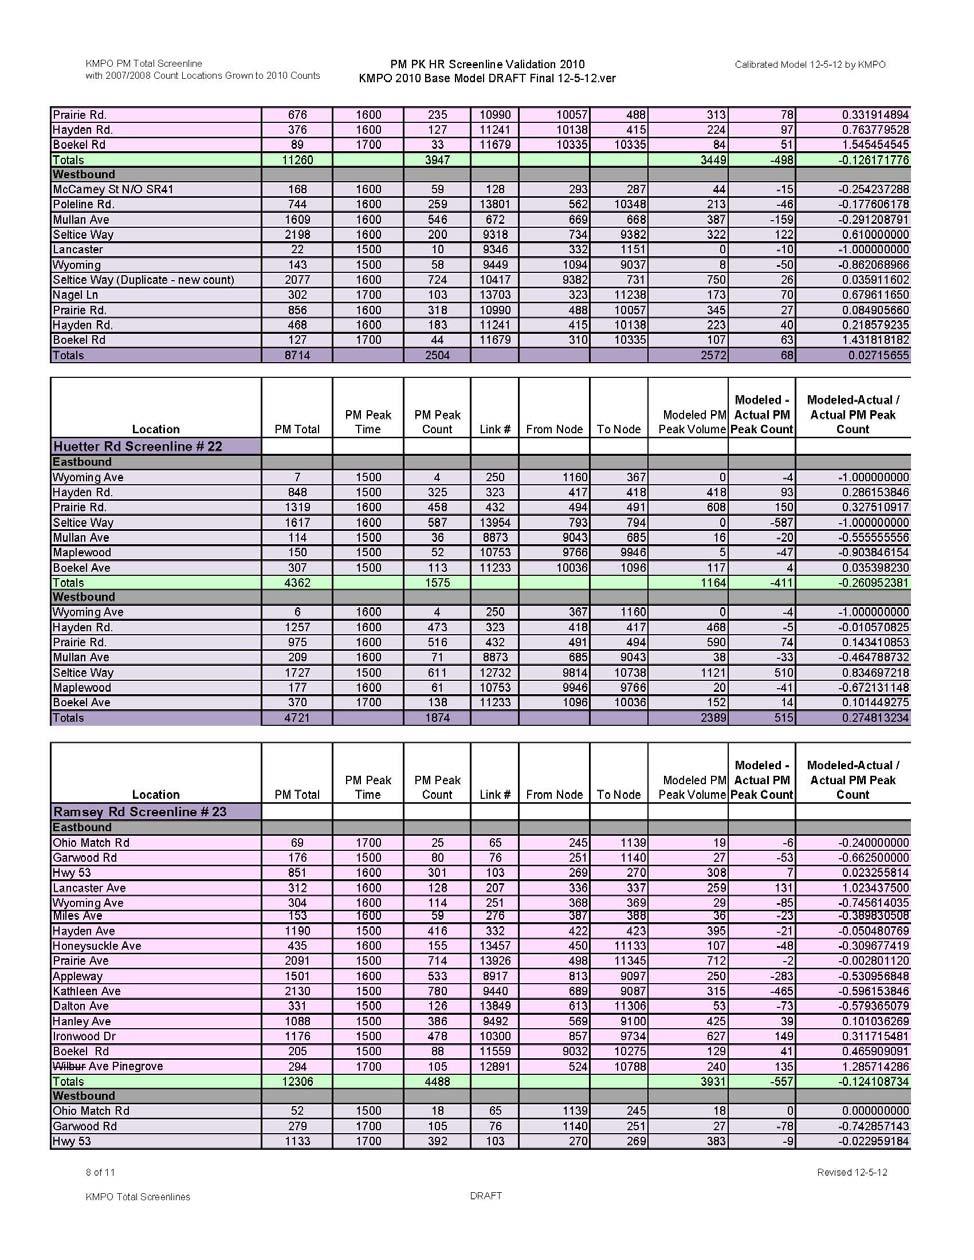
41 12.0 AM/PM Peak Hour Traffic Assignments The 2010 AM peak hour KMPO Model traffic assignments are displayed in Figure 17 and the 2010 PM peak hour KMPO Model traffic assignments are displayed in Figure 18. The traffic assignment figures, provide a snapshot of directional traffic volumes for the AM and PM peak hour in the urbanized KMPO area. Since the directional traffic forecasts need to be evaluated for statistical accuracy and confidence, screenline validation analysis is performed for both AM and PM peak hour conditions. Appendix 1D and Appendix 1E show the 2010 KMPO Model AM/PM peak hour screenline spreadsheets, respectively. 41
42 13.0 AM/PM Peak Hour Traffic Screenline Validation As shown in the following Figure 19 and Figure 20, twenty-eight screenlines are drawn to display ratios of the 2010 KMPO model AM and PM peak hour traffic modeled volumes over their corresponding traffic counts. Table 16 below, shows a summary of the screenline results. Table 16: 2010 KMPO Model AM/PM Peak Hour Screenline Summary Results Screenline Location and No. AM Peak Hour Model/Count Ratio PM Peak Hour Model/Count Ratio Spokane River Crossing Screenline # Seltice Screenline # Harrison Avenue Screenline # Appleway Ave/Best Screenline # Seltice/Mullan Rd/Kathleen Screenline # Poleline Rd Screenline # Prairie Rd. Screenline # Hayden Avenue Screenline # Lancaster Rd. Screenline # SH 53 US 95 Screenline # Twin Lakes to National Forest Screenline # US 95 to SH 3 South Screenline # SH 95 to LaTour Creek Rd Screenline # Spirit Lake Pend O Reille Screenline # Pleasant View Rd Screenline # McGuire Rd. Screenline # Chase Rd. Screenline # Spokane St. Screenline # Idaho St. Screenline # Greensferry Rd. Screenline # SH 41 Screenline # Huetter Rd. Screenline # Ramsey Rd. Screenline #
43 US 95 Screenline # West Side KMPO Screenline # East Side KMPO Screenline # Government Way Screenline # I-90 Ramps Screenline # Overall Avg. Screenline
44 13.1 Allowable Deviation Standards The closer the model/count ratios by screenlines approach 1.00, the better matches the screenline traffic volumes are compared with the traffic counts. The Federal Highway Administration (FHWA) developed a maximum allowable screenline validation error range and formula as shown below: % Allowable Deviation per TMIP FHA For volumes less than 100,000: Tol (%) = 1/100 * [( *(V)^ *(V)^ *(V) )] For over 100,000: Tol (%) = *(V)^ Where V is volume in thousands By using the formula, the screenlines can be evaluated to see if they meet the percent allowable deviation ranges. Figure 21 and Figure 22 display the screenline validations against FHWA Maximum Allowable Error Range (Source: Figure 7-2 Maximum Desirable Deviation in Total Screenline Volumes in the Model Validation and Reasonableness Checking Manual published by FHWA Travel Model Improvement Program). By the FHWA standards, the 2010 KMPO Model is validated for both AM peak hour and PM peak hour, and can be used to build future year travel demand models in KMPO areas. 44

45 Figure 17: 2010 KMPO VISUM Model AM Peak Hour Traffic Assignment Results 45
46 Figure 18: 2010 KMPO VISUM Model PM Peak Hour Traffic Assignment Results 46

47 Figure 19 : 2010 KMPO VISUM Model AM Peak Hour Traffic Forecast Screenline Results 47

48 Figure 20: 2010 KMPO VISUM Model PM Peak Hour Traffic Forecast Screenline Results 48
49 Figure 21: 2010 KMPO Model AM Peak Hour Screenline Error Range Assignment analysis, Network: KMPO_2010_FINAL DRAFT Base_PM PK RUN Model attribute (PM_PK_Hr_Model_Vol) Observed attribute (Count_Screenline_10_PMPKHR) Tolerances Regression Target value NumObs 513 AvgObs 353 %RMSE 39 % In 85 R Slope 0.97 YInt MeanRelError% 26 Figure 22: 2010 KMPO Model PM Peak Hour Screenline Error Range 2010 KMPO Travel Demand Model Enhancements 49 Draft Final Report
50 14.0 Model Limitations and Improvements The 2010 KMPO model has some limitations that lead to potential improvements in the future. The KMPO model is vehicle based travel demand forecasting model and does not have multimodal forecasting capability as the model only follows the three steps of the traditional four-step modeling procedures: trip generation, trip distribution, and trip assignment without the mode choice modeling step. The model trip generation rates are simply based on the ITE Trip Generation Manual but not based on the regional travel survey data, although the total trips generated by purpose are calibrated against the 2005 Kootenai/Spokane expanded travel survey results. The model produces better traffic forecasts in the urbanized area with higher traffic volume than in the rural area with lower traffic volumes possibly because of the larger zones and less street network in rural areas, or because the rural areas have lower trip generation rates than the ITE urban and suburban trip generation rates used in the KMPO model. Further statistical analysis of the rural and urban area travel behaviors will help evaluate this hypothesis. The trip distribution patterns roughly match with the 2005 regional travel survey; the statistical results were extracted from the travel survey for the AM and PM conditions, by NuStats as requested by KMPO staff during this 2010 model update; therefore, the statistical analysis results are based on the 2005 Spokane and Kootenai County Regional Travel Survey. Intersection level of service calculation can be implemented by using the VISUM module TRAFFIX based on the Highway Capacity Manual but was not done at this update and should be implemented for operational analysis in the future. Some local zonal details or network details may not be sufficient to reflect the traffic forecast conditions in the local sub-area transportation study and planning, or project specific sites and should be enhanced further to meet the local travel demand modeling needs in the future KMPO Travel Demand Model Enhancements 50 Draft Final Report
51 Appendices A-1

52 Appendix 1A: KMPO Project dir file.pfd KMPO Project directory file that directs the model to the proper file directory location. A-2


53 Appendix 1B: UpdateNodeLinkCapTWTL.par - A parameter file to update node/link capacity A-3

54 Appendix 1C: Final Calculate Procedures File AM_PM_ par - An AM/PM combined parameter file for the AM/PM peak hour KMPO Model (Procedures 1 39). A-4

55 Appendix 1C (Continued): Final Calculate Procedures File AM_PM_ par (Procedures ). A-5

56 Appendix 1C (Continued): Final Calculate Procedures File AM_PM_ par (Procedures ). A-6
57 Appendix 1D: 2010 KMPO Model AM Peak Hour Screenline Validation Spreadsheets A-7

58 A-8
59 A-9

60 A-10

61 A-11

62 A-12

63 A-13

64 A-14

65 A-15

66 A-16
67 Appendix 1E: 2010 KMPO Model PM Peak Hour Screenline Validation Spreadsheets A-17

68 A-18

69 A-19

70 A-20

71 A-21

72 A-22

73 A-23

74 A-24
75 A-25

76 A-26

77 A-27

78 A-28

79 A-29
 formula used was created by Geoffrey E.")
80 Appendix 1F : Final Model Results Assignment Analysis Comparison The 2010 KMPO Base Model PM PK HR assignment analysis is reported internally within the model and shows the final AM/ PM PK HR model results. The formula the program measures the observed traffic counts against the modeled traffic volumes. The (GEH) formula used was created by Geoffrey E. Havers, is a statistical mathematical formula that is used internally within the VISUM assignment analysis graph calculations that checks the model calibration. The assignment analysis uses this formula and graphs a plot that tells you how accurately the traffic volumes match the modeled volumes. This widely accepted approach compares the actual traffic counts taken in the field to the modeled output volumes using the GEH formula: For hourly flows, the GEH formula is: Notes: m = output traffic volume from the simulation model (vph) c = input traffic volume (vph) A-30

81 The graph below displays the final 2010 KMPO Base Model PM PK HR assignment analysis of the network reported inside the model for PM PK HR results KMPO AM PK HR Final Base Model Assignment Analysis Chart The final 2007 KMPO Base Model AM PK HR assignment analysis of the network is reported inside the model for AM PK HR results. This is used for comparison only to the previous 2007 model version. Comparison of the two assignment results shows that there is improvement from the previous 2007 base model to the updated 2010 base model KMPO Previous AM PK HR Final Base Model Assignment Analysis Chart (for comparison only) The final 2010 KMPO Base Model PM PK HR assignment analysis of the network is reported inside the model for PM PK HR results. A-31


82 2010 KMPO PM PK HR Final Base Model Assignment Analysis Chart The graph above is from the final 2007 KMPO Base Model PM PK HR assignment analysis of the network is reported inside the model for PM PK HR results. This is used for comparison only to the previous 2007 model version. Comparison of the two assignment results shows that there is improvement from the previous 2007 base model to the updated 2010 base model Previous PM PK HR Final Base Model Assignment Analysis Chart (for comparison only) A-32
2015 Grand Forks East Grand Forks TDM
 GRAND FORKS EAST GRAND FORKS 2015 TRAVEL DEMAND MODEL UPDATE DRAFT REPORT To the Grand Forks East Grand Forks MPO October 2017 Diomo Motuba, PhD & Muhammad Asif Khan (PhD Candidate) Advanced Traffic Analysis
APPENDIX IV MODELLING
 APPENDIX IV MODELLING Kingston Transportation Master Plan Final Report, July 2004 Appendix IV: Modelling i TABLE OF CONTENTS Page 1.0 INTRODUCTION... 1 2.0 OBJECTIVE... 1 3.0 URBAN TRANSPORTATION MODELLING
Appendixx C Travel Demand Model Development and Forecasting Lubbock Outer Route Study June 2014
 Appendix C Travel Demand Model Development and Forecasting Lubbock Outer Route Study June 2014 CONTENTS List of Figures-... 3 List of Tables... 4 Introduction... 1 Application of the Lubbock Travel Demand
Trip Generation Model Development for Albany
 Trip Generation Model Development for Albany Hui (Clare) Yu Department for Planning and Infrastructure Email: hui.yu@dpi.wa.gov.au and Peter Lawrence Department for Planning and Infrastructure Email: lawrence.peter@dpi.wa.gov.au
TRAVEL DEMAND MODEL. Chapter 6
 Chapter 6 TRAVEL DEMAND MODEL As a component of the Teller County Transportation Plan development, a computerized travel demand model was developed. The model was utilized for development of the Transportation
3.0 ANALYSIS OF FUTURE TRANSPORTATION NEEDS
 3.0 ANALYSIS OF FUTURE TRANSPORTATION NEEDS In order to better determine future roadway expansion and connectivity needs, future population growth and land development patterns were analyzed as part of
2014 Certification Review Regional Data & Modeling
 2014 Certification Review Regional Data & Modeling July 22, 2014 Regional Data Census Program Coordination PAG works with and for member agencies to ensure full participation in all Census Bureau programs
HORIZON 2030: Land Use & Transportation November 2005
 PROJECTS Land Use An important component of the Horizon transportation planning process involved reviewing the area s comprehensive land use plans to ensure consistency between them and the longrange transportation
BROOKINGS May
 Appendix 1. Technical Methodology This study combines detailed data on transit systems, demographics, and employment to determine the accessibility of jobs via transit within and across the country s 100
Douglas County/Carson City Travel Demand Model
 Douglas County/Carson City Travel Demand Model FINAL REPORT Nevada Department of Transportation Douglas County Prepared by Parsons May 2007 May 2007 CONTENTS 1. INTRODUCTION... 1 2. DEMOGRAPHIC INFORMATION...
Expanding the GSATS Model Area into
 Appendix A Expanding the GSATS Model Area into North Carolina Jluy, 2011 Table of Contents LONG-RANGE TRANSPORTATION PLAN UPDATE 1. Introduction... 1 1.1 Background... 1 1.2 Existing Northern Extent of
APPENDIX I: Traffic Forecasting Model and Assumptions
 APPENDIX I: Traffic Forecasting Model and Assumptions Appendix I reports on the assumptions and traffic model specifications that were developed to support the Reaffirmation of the 2040 Long Range Plan.
Prepared for: San Diego Association Of Governments 401 B Street, Suite 800 San Diego, California 92101
 Activity-Based Travel Model Validation for 2012 Using Series 13 Data: Coordinated Travel Regional Activity Based Modeling Platform (CT-RAMP) for San Diego County Prepared for: San Diego Association Of
Appendix C Final Methods and Assumptions for Forecasting Traffic Volumes
 Fairview Ave. and Main St. Improvements and Local Streets Plan Appendices Ada County Highway District Appendix C Final Methods and Assumptions for Forecasting Traffic Volumes January 3, 207 Appendices
Traffic Impact Study
 Traffic Impact Study Statham DRI One University Parkway Prepared for: Barrow County Prepared by: October 2012 Table of Contents Executive Summary i Section 1. Introduction 1 Project Description 1 Methodology
Traffic Demand Forecast
 Chapter 5 Traffic Demand Forecast One of the important objectives of traffic demand forecast in a transportation master plan study is to examine the concepts and policies in proposed plans by numerically
StanCOG Transportation Model Program. General Summary
 StanCOG Transportation Model Program Adopted By the StanCOG Policy Board March 17, 2010 What are Transportation Models? General Summary Transportation Models are technical planning and decision support
SBCAG Travel Model Upgrade Project 3rd Model TAC Meeting. Jim Lam, Stewart Berry, Srini Sundaram, Caliper Corporation December.
 SBCAG Travel Model Upgrade Project 3rd Model TAC Meeting Jim Lam, Stewart Berry, Srini Sundaram, Caliper Corporation December. 7, 2011 1 Outline Model TAZs Highway and Transit Networks Land Use Database
NATHAN HALE HIGH SCHOOL PARKING AND TRAFFIC ANALYSIS. Table of Contents
 Parking and Traffic Analysis Seattle, WA Prepared for: URS Corporation 1501 4th Avenue, Suite 1400 Seattle, WA 98101-1616 Prepared by: Mirai Transportation Planning & Engineering 11410 NE 122nd Way, Suite
III. FORECASTED GROWTH
 III. FORECASTED GROWTH In order to properly identify potential improvement projects that will be required for the transportation system in Milliken, it is important to first understand the nature and volume
Market Street PDP. Nassau County, Florida. Transportation Impact Analysis. VHB/Vanasse Hangen Brustlin, Inc. Nassau County Growth Management
 Transportation Impact Analysis Market Street PDP Nassau County, Florida Submitted to Nassau County Growth Management Prepared for TerraPointe Services, Inc. Prepared by VHB/Vanasse Hangen Brustlin, Inc.
Tier 2 Final Environmental Assessment I-66 Transportation Technical Report. Appendix E. Travel Demand Forecasting Model Validation Memorandum
 Tier 2 Final Environmental Assessment I-66 Transportation Technical Report Appendix E Travel Demand Forecasting Model Validation Memorandum FINAL AUGUST 216 MEMORANDUM To: Robert Josef, VDOT Northern Virginia
GIS ANALYSIS METHODOLOGY
 GIS ANALYSIS METHODOLOGY No longer the exclusive domain of cartographers, computer-assisted drawing technicians, mainframes, and workstations, geographic information system (GIS) mapping has migrated to
Transportation Statistical Data Development Report OKALOOSA-WALTON OUTLOOK 2035 LONG RANGE TRANSPORTATION PLAN
 Transportation Statistical Data Development Report OKALOOSA-WALTON OUTLOOK 2035 LONG RANGE TRANSPORTATION PLAN Prepared for the Okaloosa-Walton Transportation Planning Organization and The Florida Department
Data Collection. Lecture Notes in Transportation Systems Engineering. Prof. Tom V. Mathew. 1 Overview 1
 Data Collection Lecture Notes in Transportation Systems Engineering Prof. Tom V. Mathew Contents 1 Overview 1 2 Survey design 2 2.1 Information needed................................. 2 2.2 Study area.....................................
Technical Memorandum #2 Future Conditions
 Technical Memorandum #2 Future Conditions To: Dan Farnsworth Transportation Planner Fargo-Moorhead Metro Council of Governments From: Rick Gunderson, PE Josh Hinds PE, PTOE Houston Engineering, Inc. Subject:
PINELLAS COUNTY METROPOLITAN PLANNING ORGANIZATION FORECAST 2035 EMPLOYMENT SOCIOECONOMIC DATA FINAL REPORT
 PINELLAS COUNTY METROPOLITAN PLANNING ORGANIZATION FORECAST 2035 EMPLOYMENT SOCIOECONOMIC DATA FINAL REPORT PREPARED FOR: Pinellas County Metropolitan Planning Organization 600 Cleveland Street, Suite
STAFF REPORT. MEETING DATE: July 3, 2008 AGENDA ITEM: 7
 STAFF REPORT SUBJECT: Travel Models MEETING DATE: July 3, 2008 AGENDA ITEM: 7 RECOMMENDATION: Receive information on status of travel model development in Santa Barbara County and review factors to achieve
MEMORANDUM. Trip Generation Analysis
 MEMORANDUM To: RMC Architects From: Matthew Palmer, PE Subject: Trip Generation, Parking Analysis & Level of Service Project: Port of Everett, GTC #13-053 Date: August 25, 2014 The trip generation and
2040 MTP and CTP Socioeconomic Data
 SE Data 6-1 24 MTP and CTP Socioeconomic Data Purpose of Socioeconomic Data The socioeconomic data (SE Data) shows the location of the population and employment, median household income and other demographic
January 12, Mr. Ryan Granger TMGB Wilson, LLC 2221 Health Drive SW, Suite 2200 Wyoming, Michigan 49519
 January 12, 2018 Mr. Ryan Granger TMGB Wilson, LLC 2221 Health Drive SW, Suite 2200 Wyoming, Michigan 49519 Re: Proposed Reserve at Rivertown Mixed-Use Development Updated Trip Generation and Site Driveway
Cipra D. Revised Submittal 1
 Cipra D. Revised Submittal 1 Enhancing MPO Travel Models with Statewide Model Inputs: An Application from Wisconsin David Cipra, PhD * Wisconsin Department of Transportation PO Box 7913 Madison, Wisconsin
Appendix B. Land Use and Traffic Modeling Documentation
 Appendix B Land Use and Traffic Modeling Documentation Technical Memorandum Planning Level Traffic for Northridge Sub-Area Study Office of Statewide Planning and Research Modeling & Forecasting Section
WEBER ROAD RESIDENTIAL DEVELOPMENT Single Family Residential Project
 WEBER ROAD RESIDENTIAL DEVELOPMENT Single Family Residential Project WEBER ROAD RESIDENTIAL DEVELOPMENT TRAFFIC IMPACT STUDY TABLE OF CONTENTS 1.0 Executive Summary Page 2.0 Introduction 2.1 DEVELOPMENT
Travel Demand Model Report City of Peterborough Comprehensive Transportation Plan Update Supporting Document
 Travel Demand Model Report City of Peterborough Comprehensive Transportation Plan Update Supporting Document Prepared for: City of Peterborough and Morrison Hershfield June 2012 Paradigm Transportation
APPENDIX C-6 - TRAFFIC MODELING REPORT, SRF CONSULTING GROUP
 APPENDIX C-6 - TRAFFIC MODELING REPORT, SRF CONSULTING GROUP Scott County 2030 Comprehensive Plan Update Appendix C Scott County Traffic Model Final Report and Documentation March 2008 Prepared for: Scott
March 31, diversity. density. 4 D Model Development. submitted to: design. submitted by: destination
 March 31, 2010 diversity density 4 D Model Development submitted to: design submitted by: destination 4 D Model Development Team SANDAG: Mike Calandra Rick Curry Rob Rundle Parsons Brinckerhoff: Bill Davidson
TRAFFIC IMPACT STUDY. Platte Canyon Villas Arapahoe County, Colorado (Arapahoe County Case Number: Z16-001) For
 For") TRAFFIC IMPACT STUDY For Platte Canyon Villas Arapahoe County, Colorado (Arapahoe County Case Number: Z16-001) February 2015 Revised: August 2015 April 2016 July 2016 September 2016 Prepared for: KB Home
TRAFFIC IMPACT STUDY For Platte Canyon Villas Arapahoe County, Colorado (Arapahoe County Case Number: Z16-001) February 2015 Revised: August 2015 April 2016 July 2016 September 2016 Prepared for: KB Home
Typical information required from the data collection can be grouped into four categories, enumerated as below.
 Chapter 6 Data Collection 6.1 Overview The four-stage modeling, an important tool for forecasting future demand and performance of a transportation system, was developed for evaluating large-scale infrastructure
Figure 8.2a Variation of suburban character, transit access and pedestrian accessibility by TAZ label in the study area
 Figure 8.2a Variation of suburban character, transit access and pedestrian accessibility by TAZ label in the study area Figure 8.2b Variation of suburban character, commercial residential balance and mix
A Hybrid Approach for Determining Traffic Demand in Large Development Areas
 A Hybrid Approach for Determining Traffic Demand in Large Development Areas Xudong Chai Department of Civil, Construction, and Environmental Engineering Iowa State University 394 Town Engineering Ames,
6 th Line Municipal Class Environmental Assessment
 6 th Line Municipal Class Environmental Assessment County Road 27 to St John s Road Town of Innisfil, ON September 6, 2016 APPENDIX L: TRAVEL DEMAND FORECASTING MEMORANDUM Accessible formats are available
Economic Geography of the Long Island Region
 Geography of Data Economic Geography of the Long Island Region Copyright 2011 AFG 1 The geography of economic activity requires: - the gathering of spatial data - the location of data geographically -
April 10, Mr. Curt Van De Walle, City Manager City of Castle Hills 209 Lemonwood Drive Castle Hills, Texas 78213
 Mr. Curt Van De Walle, City Manager City of Castle Hills 209 Lemonwood Drive Castle Hills, Texas 78213 Subject: Revised Castle Hills BASIS Charter School Traffic Impact Analysis Review City of Castle Hills,
Mapping Accessibility Over Time
 Journal of Maps, 2006, 76-87 Mapping Accessibility Over Time AHMED EL-GENEIDY and DAVID LEVINSON University of Minnesota, 500 Pillsbury Drive S.E., Minneapolis, MN 55455, USA; geneidy@umn.edu (Received
Analysis and Design of Urban Transportation Network for Pyi Gyi Ta Gon Township PHOO PWINT ZAN 1, DR. NILAR AYE 2
 www.semargroup.org, www.ijsetr.com ISSN 2319-8885 Vol.03,Issue.10 May-2014, Pages:2058-2063 Analysis and Design of Urban Transportation Network for Pyi Gyi Ta Gon Township PHOO PWINT ZAN 1, DR. NILAR AYE
WOODRUFF ROAD CORRIDOR ORIGIN-DESTINATION ANALYSIS
 2018 WOODRUFF ROAD CORRIDOR ORIGIN-DESTINATION ANALYSIS Introduction Woodruff Road is the main road to and through the commercial area in Greenville, South Carolina. Businesses along the corridor have
CIV3703 Transport Engineering. Module 2 Transport Modelling
 CIV3703 Transport Engineering Module Transport Modelling Objectives Upon successful completion of this module you should be able to: carry out trip generation calculations using linear regression and category
Status Report: Ongoing review of O-D cellular data for the TPB modeled area
 Item #4 Status Report: Ongoing review of O-D cellular data for the TPB modeled area Presentation to the Travel Forecasting Subcommittee September 19, 2014 Ronald Milone, COG/TPB staff National Capital
APPENDIX G Halton Region Transportation Model
 APPENDIX G Halton Region Transportation Model Halton Region Transportation Master Plan Working Paper No. 1 - Legislative Context Working Paper No. 2 - Active Transportation Halton Transportation Model
SNOW CONTROL OPERATIONS 2017 PUBLIC SERVICES DEPARTMENT MAINTENANCE DIVISION
 SNOW CONTROL OPERATIONS 2017 PUBLIC SERVICES DEPARTMENT MAINTENANCE DIVISION 1 SNOW CONTROL OPERATIONS The following are the standard operating procedures f snow removal operations. 1. Plowing operations
Transit Modeling Update. Trip Distribution Review and Recommended Model Development Guidance
 Transit Modeling Update Trip Distribution Review and Recommended Model Development Guidance Contents 1 Introduction... 2 2 FSUTMS Trip Distribution Review... 2 3 Proposed Trip Distribution Approach...
Understanding Land Use and Walk Behavior in Utah
 Understanding Land Use and Walk Behavior in Utah 15 th TRB National Transportation Planning Applications Conference Callie New GIS Analyst + Planner STUDY AREA STUDY AREA 11 statistical areas (2010 census)
California Urban Infill Trip Generation Study. Jim Daisa, P.E.
 California Urban Infill Trip Generation Study Jim Daisa, P.E. What We Did in the Study Develop trip generation rates for land uses in urban areas of California Establish a California urban land use trip
Updating the Urban Boundary and Functional Classification of New Jersey Roadways using 2010 Census data
 Updating the Urban Boundary and Functional Classification of New Jersey Roadways using 2010 Census data By: Glenn Locke, GISP, PMP 1 GIS-T May, 2013 Presentation Overview Purpose of Project Methodology
Using GIS to Determine Goodness of Fit for Functional Classification. Eric Foster NWMSU MoDOT
 Using GIS to Determine Goodness of Fit for Functional Classification Eric Foster NWMSU MoDOT Northwest Missouri State Masters of GIScience Degree Program University All Online Coursework Missouri Department
FHWA Peer Exchange Meeting on Transportation Systems Management during Inclement Weather
 Travel Demand Modeling & Simulation at GBNRTC Matt Grabau Kimberly Smith Mike Davis Why Model? Travel modeling is a tool for transportation planners and policy makers, to observe impacts of a transportation
Forecasts for the Reston/Dulles Rail Corridor and Route 28 Corridor 2010 to 2050
 George Mason University Center for Regional Analysis Forecasts for the Reston/Dulles Rail Corridor and Route 28 Corridor 21 to 25 Prepared for the Fairfax County Department of Planning and Zoning Lisa
HALFF 16196? TRAFFIC MANAGEMENT PLAN. Richardson ISD Aikin Elementary School Dallas, Texas North Bowser Road Richardson, Texas 75081
 30280 16196? TRAFFIC MANAGEMENT PLAN Exhibit 572B Aikin Elementary School Planned Development District No. 572 Approved City Plan Commission October20, 2016 July 12, 2016 Prepared for HALFF AVO 31586 PHO1
I. M. Schoeman North West University, South Africa. Abstract
 Urban Transport XX 607 Land use and transportation integration within the greater area of the North West University (Potchefstroom Campus), South Africa: problems, prospects and solutions I. M. Schoeman
Palmerston North Area Traffic Model
 Palmerston North Area Traffic Model Presentation to IPWEA 7 November 2014 PNATM Presentation Overview Model Scope and type Data collected The model Forecasting inputs Applications PNCC Aims and Objectives
Changes in the Spatial Distribution of Mobile Source Emissions due to the Interactions between Land-use and Regional Transportation Systems
 Changes in the Spatial Distribution of Mobile Source Emissions due to the Interactions between Land-use and Regional Transportation Systems A Framework for Analysis Urban Transportation Center University
Appendix B. Durham Region Travel Demand Model Calibration
 Appendix B Durham Region Travel Demand Model Calibration AECOM 300 Water Street 905 668 9363 tel Whitby, ON, Canada L1N 9J2 905 668 0221 fax www.aecom.com To Ron Albright, Municipality of Clarington Page
Taming the Modeling Monster
 Taming the Modeling Monster Starring: Ellen Greenberg Scott McCarey Jim Charlier Audience Poll, part 1 Elected Officials Board Members Public Staff Consultants Journalists Other Audience Poll, part 2 Modeling
PLAZA MEXICO RESIDENCES
 PLAZA MEXICO RESIDENCES TRAFFIC STUDY PREPARED FOR: 3000 E. IMPERIAL, LLC. 6940 Beach Boulevard, D-501 Buena Park, California 90621 PREPARED BY: OCTOBER 5, 2017 translutions the transportatio n solutions
TRAFFIC FORECAST METHODOLOGY
 CHAPTER 5 TRAFFIC FORECAST METHODOLOGY Introduction Need for County-Level Traffic Forecasting 2030 HC-TSP Model Methodology Model Calibration Future Traffic Forecasts Hennepin County Transportation Systems
Table 3-1 Gallatin County Population and Employment Trends ( )
") 3.1 INTRODUCTION The method and process used to predict growth in the Bozeman area up to the year 030 is contained in this chapter of the Transportation Plan. By using population, employment and other
3.1 INTRODUCTION The method and process used to predict growth in the Bozeman area up to the year 030 is contained in this chapter of the Transportation Plan. By using population, employment and other
Honorable Mayor and Members of the City Council
 TO: ATTENTION: FROM: SUBJECT: Honorable Mayor and Members of the City Council Jeffrey L. Stewart, City Manager Len Gorecki, Director of Public Works Jerry Stock, City Engineer Public Hearing to Consider
Regional Performance Measures
 G Performance Measures Regional Performance Measures Introduction This appendix highlights the performance of the MTP/SCS for 2035. The performance of the Revenue Constrained network also is compared to
City of Hermosa Beach Beach Access and Parking Study. Submitted by. 600 Wilshire Blvd., Suite 1050 Los Angeles, CA
 City of Hermosa Beach Beach Access and Parking Study Submitted by 600 Wilshire Blvd., Suite 1050 Los Angeles, CA 90017 213.261.3050 January 2015 TABLE OF CONTENTS Introduction to the Beach Access and Parking
CVS Derwood. Local Area Transportation Review
 CVS Derwood Montgomery County, Maryland May 27, 2016 Local Area Transportation Review Prepared for: JC Bar Properties, Inc. Steve Fleming, PE 415 Fallowfield Road, Suite 301 Camp Hill, Pennsylvania 17011
Central Florida Regional Planning Model (CFRPM) Version 6.0
 Version 6.0") Central Florida Regional Planning Model (CFRPM) Version 6.0 Technical Memorandum: Year 2010 Model Calibration and Validation Prepared for: FLORIDA DEPARTMENT OF TRANSPORTATION DISTRICT 5 Prepared by: Leftwich
Central Florida Regional Planning Model (CFRPM) Version 6.0 Technical Memorandum: Year 2010 Model Calibration and Validation Prepared for: FLORIDA DEPARTMENT OF TRANSPORTATION DISTRICT 5 Prepared by: Leftwich
COMBINATION OF MACROSCOPIC AND MICROSCOPIC TRANSPORT SIMULATION MODELS: USE CASE IN CYPRUS
 International Journal for Traffic and Transport Engineering, 2014, 4(2): 220-233 DOI: http://dx.doi.org/10.7708/ijtte.2014.4(2).08 UDC: 656:519.87(564.3) COMBINATION OF MACROSCOPIC AND MICROSCOPIC TRANSPORT
King City URA 6D Concept Plan
 King City URA 6D Concept Plan King City s Evolution Among the fastest growing cities 2000 Census 1,949 2010 Census 3,111 60% increase 2016 Census estimate 3,817 23% increase Average annual rate 4.3% Surpassing
APPENDIX C-3 Equitable Target Areas (ETA) Technical Analysis Methodology
 Technical Analysis Methodology") APPENDIX C-3 Equitable Target Areas (ETA) Technical Analysis Methodology Contents Introduction... 1 ETA Index Methodology... 1 ETA Index Development... 1 Other EJ Measures... 4 The Limited English Proficiency
APPENDIX C-3 Equitable Target Areas (ETA) Technical Analysis Methodology Contents Introduction... 1 ETA Index Methodology... 1 ETA Index Development... 1 Other EJ Measures... 4 The Limited English Proficiency
Simplified Trips-on-Project Software (STOPS): Strategies for Successful Application
: Strategies for Successful Application") Simplified Trips-on-Project Software (STOPS): Strategies for Successful Application presented to Transit Committee Florida Model Task Force presented by Cambridge Systematics, Inc. John (Jay) Evans, AICP
Simplified Trips-on-Project Software (STOPS): Strategies for Successful Application presented to Transit Committee Florida Model Task Force presented by Cambridge Systematics, Inc. John (Jay) Evans, AICP
Wesley Chapel Area Roadway Needs Study Build-Out Analysis (Beardsley Dr/Oldwoods Ave Need Study) Project Progress Meeting 1
 Project Progress Meeting 1") Build-Out Analysis (Beardsley Dr/Oldwoods Ave Need Study) Project Progress Meeting 1 9:30 AM Pasco County Development Services Conference Room 1. Welcome/Introductions 2. Project Overview Purpose Major
Build-Out Analysis (Beardsley Dr/Oldwoods Ave Need Study) Project Progress Meeting 1 9:30 AM Pasco County Development Services Conference Room 1. Welcome/Introductions 2. Project Overview Purpose Major
Developing and Validating Regional Travel Forecasting Models with CTPP Data: MAG Experience
 CTPP Webinar and Discussion Thursday, July 17, 1-3pm EDT Developing and Validating Regional Travel Forecasting Models with CTPP Data: MAG Experience Kyunghwi Jeon, MAG Petya Maneva, MAG Vladimir Livshits,
A New Approach to Estimating Population Growth Along a Major Arterial Highway.
 . ABSTRACT In the last twenty years Texas has undergone extensive growth as people move across the country and relocate in the Lone Star State. Many of these new Texans choose suburbs outside major cities
MnDOT Method for Calculating Measures of Effectiveness (MOE) From CORSIM Model Output
 From CORSIM Model Output") MnDOT Method for Calculating Measures of Effectiveness (MOE) From CORSIM Model Output Rev. April 29, 2005 MnDOT Method for Calculating Measures of Effectiveness (MOE) From CORSIM Model Output Table of
MnDOT Method for Calculating Measures of Effectiveness (MOE) From CORSIM Model Output Rev. April 29, 2005 MnDOT Method for Calculating Measures of Effectiveness (MOE) From CORSIM Model Output Table of
Parking Regulations Dundas Street West, from Bathurst Street to Dovercourt Road
 STAFF REPORT ACTION REQUIRED Parking Regulations Dundas Street West, from Bathurst Street to Dovercourt Road Date: October 28, 2008 To: From: Toronto and East York Community Council Director, Transportation
محاضرة رقم 4. UTransportation Planning. U1. Trip Distribution
 UTransportation Planning U1. Trip Distribution Trip distribution is the second step in the four-step modeling process. It is intended to address the question of how many of the trips generated in the trip
Guidelines on Using California Land Use/Transportation Planning Tools
 Guidelines on Using California Land Use/Transportation Planning Tools 1. Selecting Ds Analysis Modules Appropriate to a Region In almost all cases, the appropriate Ds Analysis Module to use for analysis
JEP John E. Jack Pflum, P.E. Consulting Engineering 7541 Hosbrook Road, Cincinnati, OH Telephone:
 JEP John E. Jack Pflum, P.E. Consulting Engineering 7541 Hosbrook Road, Cincinnati, OH 45243 Email: jackpflum1@gmail.com Telephone: 513.919.7814 MEMORANDUM REPORT Traffic Impact Analysis Proposed Soccer
VALIDATING THE RELATIONSHIP BETWEEN URBAN FORM AND TRAVEL BEHAVIOR WITH VEHICLE MILES TRAVELLED. A Thesis RAJANESH KAKUMANI
 VALIDATING THE RELATIONSHIP BETWEEN URBAN FORM AND TRAVEL BEHAVIOR WITH VEHICLE MILES TRAVELLED A Thesis by RAJANESH KAKUMANI Submitted to the Office of Graduate Studies of Texas A&M University in partial
Regional Performance Measures
 G Performance Measures Regional Performance Measures Introduction This appendix highlights the performance of the MTP/SCS for 2035. The performance of the Revenue Constrained network also is compared to
GIS Analysis of Crenshaw/LAX Line
 PDD 631 Geographic Information Systems for Public Policy, Planning & Development GIS Analysis of Crenshaw/LAX Line Biying Zhao 6679361256 Professor Barry Waite and Bonnie Shrewsbury May 12 th, 2015 Introduction
GIS Geographical Information Systems. GIS Management
 GIS Geographical Information Systems GIS Management Difficulties on establishing a GIS Funding GIS Determining Project Standards Data Gathering Map Development Recruiting GIS Professionals Educating Staff
GIS and Remote Sensing Support for Evacuation Analysis
 GIS and Remote Sensing Support for Evacuation Analysis Presented to GIS for Transportation Symposium Rapid City, South Dakota March 28-31, 2004 Demin Xiong Oak Ridge National Laboratory 2360 Cherahala
Introduction of Information Feedback Loop To Enhance Urban Transportation Modeling System
 TRANSPORTATION RESEARCH RECORD 1493 81 Introduction of Information Feedback Loop To Enhance Urban Transportation Modeling System KYLE B. WINSLOW, ATHANASSIOS K. BLADIKAS, KENNETH J. HAUSMAN, AND LAZAR
FHWA Planning Data Resources: Census Data Planning Products (CTPP) HEPGIS Interactive Mapping Portal
 HEPGIS Interactive Mapping Portal") FHWA Planning Data Resources: Census Data Planning Products (CTPP) HEPGIS Interactive Mapping Portal Jeremy Raw, P.E. FHWA, Office of Planning, Systems Planning and Analysis August 2017 Outline Census
FHWA Planning Data Resources: Census Data Planning Products (CTPP) HEPGIS Interactive Mapping Portal Jeremy Raw, P.E. FHWA, Office of Planning, Systems Planning and Analysis August 2017 Outline Census
Appendix BAL Baltimore, Maryland 2003 Annual Report on Freeway Mobility and Reliability
 (http://mobility.tamu.edu/mmp) Office of Operations, Federal Highway Administration Appendix BAL Baltimore, Maryland 2003 Annual Report on Freeway Mobility and Reliability This report is a supplement to:
Transit Time Shed Analyzing Accessibility to Employment and Services
 Transit Time Shed Analyzing Accessibility to Employment and Services presented by Ammar Naji, Liz Thompson and Abdulnaser Arafat Shimberg Center for Housing Studies at the University of Florida www.shimberg.ufl.edu
Non-Motorized Traffic Exploratory Analysis
 Non-Motorized Traffic Exploratory Analysis --------------------------------------------------------------- Chao Wu Advisor: Professor Greg Lindsey Humphrey School of Public Affairs University of Minnesota
Kitsap County 2016 Comprehensive Plan Update. Appendix A: Growth Estimates
 Kitsap County 2016 Comprehensive Plan Update Appendix A: Growth Estimates Appendix A 1 April 2016 Kitsap County 2016 Comprehensive Plan Update Appendix A: Growth Estimates Land Capacity Land capacity
Visitor Flows Model for Queensland a new approach
 Visitor Flows Model for Queensland a new approach Jason. van Paassen 1, Mark. Olsen 2 1 Parsons Brinckerhoff Australia Pty Ltd, Brisbane, QLD, Australia 2 Tourism Queensland, Brisbane, QLD, Australia 1
City of Saginaw Right of Way Division Snow and Ice Removal Policy January 18, 2016
 Snow and Ice Removal Policy January 18, 2016 It is the policy of the to provide snowplowing and ice removal services in order to: Provide safe traveling conditions for motorists and pedestrians Assist
final report A Recommended Approach to Delineating Traffic Analysis Zones in Florida Florida Department of Transportation Systems Planning Office
 A Recommended Approach to Delineating Traffic Analysis Zones in Florida final report prepared for Florida Department of Transportation Systems Planning Office September 27, 2007 final report A Recommended
5.1 Introduction. 5.2 Data Collection
 Chapter 5 Traffic Analysis 5.1 Introduction This chapter of the EIS assesses the traffic impacts of the proposed N5 Westport to Turlough Road Project (the proposed scheme). The proposed scheme will provide
2014 Data Collection Project ITE Western District
 2014 Data Collection Project ITE Western District Project Completed By: Oregon State University OSU ITE Student Chapter 101 Kearney Hall Corvallis, OR 97331 Student Coordinator: Sarah McCrea (OSU ITE Student