A Primer on Visual Analytics Special focus: movement data
|
|
|
- Annabella Bennett
- 6 years ago
- Views:
Transcription


1 A Primer on Visual Analytics Special focus: movement data Gennady Andrienko Natalia Andrienko
2 Outline 1. Introduction to visual analytics 2. Data types and structures; spatio-temporal data 3. Fundamentals of visualization and interaction 4. Types of tasks in data analysis 5. Data transformations 6. Multi-perspective analysis of movement by example a) Trajectories b) Movement events c) Spatial situations d) Local time series 7. Concluding summary
3 Outline Visual Analytics 1. Introduction to visual analytics 2. Data types and structures; spatio-temporal data 3. Fundamentals of visualization and interaction 4. Types of tasks in data analysis 5. Data transformations 6. Multi-perspective analysis of movement by example a) Trajectories b) Movement events c) Spatial situations d) Local time series 7. Concluding summary

4 Visual Analytics: the science of analytical reasoning facilitated by interactive visual interfaces People use visual analytics tools and techniques to Synthesize information and derive insight from massive, dynamic, ambiguous, and often conflicting data Detect the expected and discover the unexpected Provide timely, defensible, and understandable assessments Communicate assessment effectively for action The book (IEEE Computer Society 2005) is available at Analytical reasoning = data information knowledge explanation (interpreted data) (for myself) (for others)
5 Visual Analytics: divide the labor between the computers and humans to use the best of each Computers can store and process great amounts of information are very fast in searching information are very fast in processing data can extend their capacities by linking with other computers can efficiently render high quality graphics, both static and dynamic Humans are flexible and inventive, can deal with new situations and problems can solve problems that are hard to formalise can reasonably act in cases of incomplete and/or inconsistent information can simply see things that are hard to compute can employ their previous knowledge and experience
6 Visual Analytics: the importance of visualization Visualize = make perceptible to human s mind Visualisation offers a method for seeing the unseen. B. McCormick, T. DeFanti, and M. Brown. Definition of Visualization. ACM SIGGRAPH Computer Graphics, 21(6), November 1987, p.3 An estimated 50 percent of the brain's neurons are associated with vision. Visualization < > aims to put that neurological machinery to work. (ibid.) An abstractive grasp of structural features is the very basis of perception and the beginning of all cognition. R. Arnheim. Visual Thinking. University of California Press, Berkeley 1969, renewed 1997, p. 161 (in other words: seeing already includes analyzing) Visualization is essential for enabling human analysts to use their inherent cognitive capabilities
7 Visual Analytics technology: combining methods for visual and computational analysis Goal: enable synergistic work of humans and computers
8 Visual Analytics: a summary description Visual Analytics is meant to enable people to make sense from complex data and solve complex problems Complexities: massive amounts, high dimensionality, heterogeneity, multiple facets, time variance, incompleteness, uncertainty, inconsistency Visual Analytics combines interactive visual interfaces with algorithmic methods for data pre-processing, transformation, feature/pattern extraction,... Interactive visual interfaces help analysts to utilize their perceptual and cognitive capabilities fully and effectively Computer technologies compensate for the natural limitations in human skills and abilities and augment the discovery process The goal is to enable synergistic collaboration of humans and computers where each side can utilize its capabilities in the best possible way
9 Outline Data 1. Introduction to visual analytics 2. Data types and structures; spatio-temporal data 3. Fundamentals of visualization and interaction 4. Types of tasks in data analysis 5. Data transformations 6. Multi-perspective analysis of movement by example a) Trajectories b) Movement events c) Spatial situations d) Local time series 7. Concluding summary
10 Types of components in data Types of values: Numeric Textual Predefined values (e.g., codes) Free text Spatial Coordinates Place names Addresses Temporal Other (image, video, audio,...) Scales of measurement*: Nominal ( order, distances) gender, nationality,... Ordinal (+ order, distances) evaluations: bad, fair, good, excellent Interval (+ order, + distances, ratios, meaningful zero) temperature, time,... Ratio (+ order, + distances, + ratios, + meaningful zero) any quantities * Stevens, S.S. (1946). "On the Theory of Scales of Measurement". Science 103 (2684):
11 Properties of data components Generalization of the scales of measurement Discrete or continuous Relations between the elements Mathematical relations Ordering (full or partial) Distances Ratios Semantic relations is-a part-of kinship... Examples: Statistical population (set of discrete entities): discrete, no relations Texts: discrete, no relations Evaluation scores: discrete, ordered Temperature values, times: continuous, ordered, have distances Amounts: continuous, ordered, have distances, have ratios Spatial locations (2D, 3D): continuous, have distances
12 Semantic roles of data components Reference: What is described? Object (physical or abstract) Place Time Object time Place time Generally: anything specified as a single element or combination Characteristic, or attribute: What is known about it?


13 Reference: time Reference: place Attributes......
14 Common classes of data structures Object-referenced data: attributes of objects Events: attributes include time of existence (moment or interval) Spatial objects: attributes include spatial location (point, area, or volume) Spatial events: attributes include existence time and location Time-referenced data, a.k.a. time series: attributes observed in different times (moments or intervals) Space-referenced data, a.k.a. spatial data: attributes observed in different places Object time series: attributes of objects observed in different times Trajectories of moving objects: time series of spatial locations Spatial time series: attributes observed in different places and times
15 Multidimensional data Data including multiple attributes May have various types of references: objects, places, times, combinations... Multiple attributes referring to times: multidimensional time series Multiple attributes referring to places: multidimensional spatial data Multiple attributes referring to places + times: multidimensional spatial time series
16 Classes of spatio-temporal data Include space and time as references or characteristics Reference: objects; attributes: existence time + location +... spatial events Earthquakes, mobile phone calls, public events,... References: places + times; attributes:... spatial time series Weather, population census data for different years, election results,... References: objects + times; attributes: location +... trajectories Trajectories of people, animals, vehicles, icebergs, hurricanes,...
17 Outline Visualization 1. Introduction to visual analytics 2. Data types and structures; spatio-temporal data 3. Fundamentals of visualization and interaction 4. Types of tasks in data analysis 5. Data transformations 6. Multi-perspective analysis of movement by example a) Trajectories b) Movement events c) Spatial situations d) Local time series 7. Concluding summary Interaction
18 Components of a visual display Display space (or visual space): set of positions Visual marks: points, geometric shapes, symbols positioned in the display space Types of marks: Points Lines Areas Surfaces Volumes Visual properties of marks: colour, shape, orientation, size, texture
19 Visual variables Jacques Bertin (1983): Semiology of Graphics. Diagrams, Networks, Maps. University of Wisconsin Press, Madison. Translated from Bertin, J.: Sémiologie graphique, Gauthier-Villars, Paris, Position in the display space (x, y) Size (length, area, volume) Shape Value, or degree of darkness (from light to dark) Colour (hue) Orientation Texture
20 Perceptual properties of visual variables Association: several marks with the same value of this visual variable can be easily grouped (perceived all together) despite differences in other visual variables Selection: easy to locate marks with a given value of the visual variable and perceive them separately from others Order: the values of the variable can be put in an order, e.g., from small to big, from light to dark,... Quantity: differences between two values of the variable can be interpreted numerically, e.g., how much bigger Perceptual length: number of different values of the variable that can be easily distinguished by an average human
21 Perceptual properties of visual variables Association Selection Order Quantity Length Position limited by display size Size Value (darkness) Texture + + +/- * Colour ** Orientation Shape * + : grain density or size; - : grain shape ** + for parts of the spectrum (e.g., cold hot)
22 The fundamental rule of visual mapping Visual mapping: the process of mapping data components to visual variables The fundamental rule: the perceptual properties of the visual variables must correspond to the properties of the data components they represent
23 Correspondence of visual variables to types of data components Nominal Ordinal Interval Ratio Spatial Temporal Position Size Value (darkness) Texture + + * Colour + + ** Orientation Shape * grain density or size ** parts of the spectrum (e.g., cold hot)
 Data components numeric attribute numeric attribute references (objects or times) numeric attribute references (typically times) numeric attribute spatial locations (references")
24 Common display types Scatter plot Bar chart Line chart Map Gantt chart Visual variables x-position y-position x- or y-position size (length) x-position y-position (x,y)-position other variables position size (length) Data components numeric attribute numeric attribute references (objects or times) numeric attribute references (typically times) numeric attribute spatial locations (references or attributes) space-referenced attributes event existence time (start, end) event duration


25 Visualization of relations The visual variables can represent mathematical relations between data elements: ordering, distances, ratios Semantic relations need to be represented explicitly by special marks and/or layouts Node-link diagram: objects are represented by nodes (point marks) and relations by links (linear marks) between nodes Matrix: objects are represented by horizontal and vertical positions and relations by marks in the cells Venn diagram: relations between sets Enclosing shapes: part-of relations...

")
26 Increasing the number of available visual variables Display space division (small multiples) Space embedding (e.g., diagram spaces within map space) Complementary displays

27 Additional variable: display time (animated displays)
28 Display time (animated displays) Theoretically suitable for representing a temporal component of data Problems: Does not support comparisons across times Change blindness Automatic animation: discouraged Interactive controlling of the display time: may be used
29 Basic interactions (video)
30 Purposes of interactive operations Access exact data values Link pieces of information from complementary displays Increase display expressiveness Decrease display clutter Focus on data portions Find particular pieces of information Compare...
31 Outline Tasks 1. Introduction to visual analytics 2. Data types and structures; spatio-temporal data 3. Fundamentals of visualization and interaction 4. Types of tasks in data analysis 5. Data transformations 6. Multi-perspective analysis of movement by example a) Trajectories b) Movement events c) Spatial situations d) Local time series 7. Concluding summary
32 Types of data analysis tasks Data analysis task: find an answer to a question concerning the data Jacques Bertin: There are as many types of questions as components in the information (Jacques Bertin (1983): Semiology of Graphics. Diagrams, Networks, Maps. University of Wisconsin Press, Madison. Translated from Bertin, J.: Sémiologie graphique, Gauthier-Villars, Paris, 1967). Type focus of interest (what is to be characterized by what) Reference: time Reference: place Attributes Example: spatial time series...
33 Example: spatial time series Data structure S l May be multidimensional V Set of locations T t Set of time moments v Set of thematic attribute values S T V Data record: (l, t, v)
34 Task types (= foci) for spatial time series Peuquet, Donna J. (2002) Representations of Space and Time, New York: Guilford. S S T l t V? T l? v V Where + when what? S What + where when? T? t v V What + when where?
35 Comparison tasks = questions about relations T l2 S t2 l1 t1 V? How is the value at (l1, t1) related to that at (l2, t2)? Most typical comparison tasks Same time, different places: At the time t, how does the value at location l1 differ from that at l2? Same place, different times: How did the value at location l change from time t1 to time t2? Relation type: same, different, greater than, less than, Relation metrics, e.g. difference, ratio, distance
36 Task type = focus + target Task focus: Which data component is characterized by which data component(s)? Task target: values or relations? Lookup tasks: address values of data components Comparison tasks: address relations between values of data components
37 Examples of tasks What was the property crime rate in California in 2000? When did the property crime rate in California exceed 6,000 crimes/ 100,000 population? Where was the property crime rate in 2000 below 2,500? Was the property crime rate in California in 2000 higher or lower than in 1995? Which states had in 2000 higher crime rates than California? Lookup tasks Comparison tasks
38 Task levels Elementary tasks address one or several individual values of data components, i.e., elements of the sets The previous examples are elementary tasks Synoptic tasks address whole sets or subsets considered in their entirety. These tasks require abstraction from specific to general. Examples: How did the property rate in California change over the period ? How similar or different were the evolutions of the property crime rates in California and in Texas? How were the values of the property crime rate distributed over the territory of the USA in 2000? How similar or different were the spatial distributions in 1960 and in 2000? How are different temporal evolution patterns distributed over the territory? How did the spatial distribution pattern evolve over the whole time period?
39 Synoptic analysis level (1) Tasks may be synoptic with regard to one component and elementary with regard to another Space as a whole Spatial behaviour (value distribution over the space) Specific time Specific place t Synoptic with regard to space but elementary with regard to time Temporal behaviour (value variation over the time) Time as a whole Synoptic with regard to time but elementary with regard to space
40 Synoptic analysis level (2) + Time as a whole Space as a whole Synoptic with regard to both space and time Aspect 1: Temporal variation of the spatial behaviour Spatio-temporal behaviour Aspect 2: Spatial variation of the temporal behaviour t1 t2 t3 40
41 General formulations of synoptic tasks Synoptic tasks are about behaviours of attributes (analogy to behaviours of functions) Behaviour: a generalization of the concepts of distribution (statistical, spatial, temporal), temporal evolution, and other kinds of variation Behaviour characterization task: What is the behaviour of the attribute(s) over the set of references? Behaviour comparison tasks: Compare the behaviours of the attribute(s) over two or more subsets of the reference set. Compare the behaviours of attributes A and B over the reference set. Behaviour search task: On which subsets of the reference set do the attributes behave in the given way?
42 Decomposing a complex behaviour Data with 2 referential components: X Y A (e.g., S T A) The overall behaviour analysis task: What is the behaviour of A over the set X Y? B X Y (A(x,y)) What was the spatio-temporal behaviour of the crime rates in the USA over ? Slices of the overall behaviour: B Y (A(x,y) x = const); B X (A(x,y) y = const) For a selected element from X, what is the behaviour of A over the set Y? What was the temporal behaviour of the crime rates in California over ? For a selected element from Y, what is the behaviour of A over the set X? What was the spatial behaviour (distribution) of the crime rates over the USA in 2000? Aspects of the overall behaviour: B X (B Y (A(x,y))); B Y (B X (A(x,y))) How are the temporal behaviours of the crime rates over distributed over the territory of the USA? How did the spatial behaviour of the crime rates over the territory of the USA evolve over the period ?


43 Decomposing a complex behaviour: slices Space as a whole Spatial behaviour at this time Selected time t Selected place Temporal behaviour in this place Time as a whole

44 Decomposing a complex behaviour: aspects + Time as a whole Space as a whole Spatio-temporal behaviour Aspect 2: Spatial variation of the temporal behaviour Aspect 1: Temporal variation of the spatial behaviour t1 t2 t3
45 Task levels and types in visual analytics Elementary tasks play a secondary role in analysis (analysts may sometimes need to look up for specific values or compare one with another). Elementary tasks need to be supported (e.g., by basic interactions), but they are not of main concern in VA. VA primarily aims at supporting synoptic analysis tasks. Depending on the task focus and target, different visual, interactive, and computational techniques may be suitable. Spatial variation of the temporal behaviour B S (B T (A(s,t))) Temporal variation of the spatial behaviour B T (B S (A(s,t))) t1 t2 t3
46 Task foci and data structures Tasks may require changing the data structure Example: spatial event data E S T A E: set of events (objects), e.g., earthquakes; S: space, i.e., set of locations; T: time, i.e., set of moments; A: thematic attributes, e.g., magnitude, depth, radius,... Synoptic task focusing on E: what is the behaviour of S, T, and/or A over E? What are the distributions of the spatio-temporal positions and thematic attributes over the set of the earthquakes? Synoptic tasks focusing on S T: what is the behaviour of E and A over S T? How are the earthquakes and their thematic attributes distributed over the space and time? A meaningful change of the viewpoint: S T is a universal container of events and everything Requires considering data as spatial time series S T P(E) A
47 Possible task foci in movement analysis Multi-perspective view of movement Moving objects Trajectories M (T S) Spatial events Spatio-temporal positions E (T S) Space (locations) Presence dynamics S (T P(M E)) Time (time units) Spatial situations T (S P(M E)) Data transformations can bring available data to a suitable form depending on the task focus
48 Outline Transformations 1. Introduction to visual analytics 2. Data types and structures; spatio-temporal data 3. Fundamentals of visualization and interaction 4. Types of tasks in data analysis 5. Data transformations 6. Multi-perspective analysis of movement by example a) Trajectories b) Movement events c) Spatial situations d) Local time series 7. Concluding summary
49 Transformations to support abstraction Simplification: reduce excessive detail and high-resolution fluctuations E.g., smoothing of time series, trajectories; spatial smoothing Generalization: transform to larger units E.g., time moments intervals; points in space areas; continuous range of numbers value intervals (discretization); individual nominal values semantic categories Grouping of similar and/or close items: elements subsets Close in space and/or in time Having similar values of thematic attributes Aggregation: summarize values by larger units or by groups of items E.g., mean, range, quartiles, percentiles; mode; centre and radius;...
50 Transformations for managing large data volumes Sampling Generalization and aggregation Grouping of similar and/or close items
51 Transformations for focusing on the relevant Filtering: spatial, temporal, attribute-based Extraction of features of interest From time series: increase/decrease, peaks/pits, values above/below a threshold,... events, spatial events From spatial distributions: peaks/pits, ridges, saddles,... static spatial objects, spatial events From trajectories: stops, slow movement, speed above a threshold,... spatial events
52 Transformations for adapting data structures to tasks Projection For example, spatial time series S T A: S (T A) set of local time series of A referring to different spatial locations T (S A) set (sequence) of spatial distributions of A referring to different times Aggregation For example, spatial events E S T A: Spatial time series S T P(E) A (obtained by aggregating the events by spatial and temporal units) Integration and disintegration For example, spatial events trajectories (O set of object identifiers): E O S T A O (T S A)

53 Transformations changing the data structure For example, spatio-temporal data: Spatial time series Projection Projection Local time series Spatial distributions Aggregation Extraction Extraction Aggregation Integration Spatial events Trajectories Extraction, disintegration
54 VA support to data transformations Example: generalization and spatio-temporal aggregation of trajectories
55 VA support to data transformations Example: extraction of spatial events from trajectories
56 Outline Example 1. Introduction to visual analytics 2. Data types and structures; spatio-temporal data 3. Fundamentals of visualization and interaction 4. Types of tasks in data analysis 5. Data transformations 6. Multi-perspective analysis of movement by example a) Trajectories b) Movement events c) Spatial situations d) Local time series 7. Concluding summary
57 Transformations enable multi-perspective analysis of movement data Moving objects Trajectories Spatial events Movement data Locations Local time series Spatial event data Spatial time series Times Spatial distributions
 Data structure: Car identifier Date and time Geographic coordinates Speed The trajectories from one day are drawn on a map with 5%")
58 Example dataset: trajectories of cars in Milan GPS-tracks of 17,241 cars in Milan, Italy Time period: from Sunday, the 1st of April, to Saturday, the 7th of April, 2007 Received from Comune di Milano (Municipality of Milan) Data structure: Car identifier Date and time Geographic coordinates Speed The trajectories from one day are drawn on a map with 5% opacity
59 Role of clustering in VA Grouping of similar or close items plays an essential role in VA as a tool supporting abstraction: elements subsets; the subsets may be considered as wholes as a tool to manage large data volumes as a tool to study the behaviour of attributes (i.e., distribution of attribute values) over the set of references, particularly, multiple attributes spatial and spatio-temporal positions of objects dynamic (time-variant) attributes, such as time series of numeric values trajectories of moving objects
60 Two major types of clustering Partition-based clustering: divide items into groups so that items within a group are similar (close) and items from different groups are less similar (more distant) Examples: k-means, self-organizing map Property of the result: each item belongs to some group Density-based clustering: find groups of highly similar (close) items and separate from them items that are less similar (more distant) to others Examples: DBScan, OPTICS Properties of the results: some items belong to groups, other items remain ungrouped and are treated as noise


61 Two major types of clustering: an example Partition-based: convex clusters including all objects Density-based: dense clusters of arbitrary shapes; many objects are treated as noise (gray)
62 Use of two types of clustering Partition-based: unites elements into subsets for abstraction reduction of analytical workload data aggregation integrates multiple attributes, allows comparison of items in terms of multiple attributes Density-based: separates what is common, frequent from what is specific, infrequent may be a tool for studying attribute behaviours (distributions) concentrations of close/similar objects may have special meanings e.g., spatio-temporal cluster of low speed events traffic jam
63 Outline Trajectories 1. Introduction to visual analytics 2. Data types and structures; spatio-temporal data 3. Fundamentals of visualization and interaction 4. Types of tasks in data analysis 5. Data transformations 6. Multi-perspective analysis of movement by example a) Trajectories b) Movement events c) Spatial situations d) Local time series 7. Concluding summary Movers Trajectories Movement data Spatial events Spatial event data Spatial time series Locations Local time series Times Spatial distributions
64 Diverse distance functions for trajectories Trajectories are time series of spatial positions and other movement attributes Trajectories are complex objects with heterogeneous properties: positions in space and in time, shape, dynamics of speed,... A single distance measure accounting for all properties would be hard to implement and results would be hard to interpret Trajectories can be explored using diverse distance measures addressing different properties Simple, easily interpretable, computationally efficient Allowing to answer different types of questions concerning trajectories


65 Interactive progressive clustering Applying different distance measures Data: trajectories of cars in Milan Step 1: clustering according to the spatial proximity of the end points Distance function: common ends Question: what are the most frequent destinations of car trips?
 selected cluster(s) from the previous step Step 2:")

66 Interactive progressive clustering Applying different distance measures (2) Data: one (or more) selected cluster(s) from the previous step Step 2: clustering according to the similarity of the routes (shapes) Distance function: route similarity Question: what routes are usually taken to get to the selected destination?
67 Interactive progressive clustering Purposes Controlled refinement of previously obtained clusters for reducing internal variation more detailed investigation of data subsets of interest Study of a set of complex objects with heterogeneous properties application of diverse distance measures addressing different properties incremental construction of multifaceted knowledge by progressively considering different properties
68 Where to read more S.Rinzivillo, D.Pedreschi, M.Nanni, F.Giannotti, N.Andrienko, G.Andrienko Visually driven analysis of movement data by progressive clustering Information Visualization, 2008, v.7 (3/4), pp
69 Clustering of very large sets of trajectories Problem: clustering of complex objects (such as trajectories) involving nontrivial distance functions (such as route similarity ) can only be done in RAM, i.e. for a relatively small dataset Our approach: 1. Take a subset (sample) of the objects suitable for processing in RAM. 2. Discover clusters in the subset. 3. Load the remaining objects into RAM by portions. Classify each object = identify to which of the discovered clusters the object belongs. Store the result of the classification in the database. 4. Take the objects that remained unclassified and apply steps 1 to 3 to them. Repeat the procedure until no meaningful new clusters can be discovered. Question: how to identify the cluster where an object belongs?
70 Classifier, the main idea From each cluster C i select one or more representative objects (prototypes) and respective distance thresholds: { (pt 1, d 1 ),, (pt n, d n ) } such that o C i k, 1 k n: distance (o, pt k ) < d k The set of all cluster prototypes with the respective distance thresholds defines the classifier A new object o may be ascribed to the cluster if the same condition holds for it. For each object from a large database: measure the distances to all prototypes; take the closest prototype among those with the distances below the thresholds and ascribe the object to the respective cluster; if no such prototypes found, label the object as unclassified. To select prototypes: Divide the cluster into round subclusters Take the medoid of each subcluster as one of the prototypes Take the maximum of the distances from the subcluster medoid to the subcluster members as the distance threshold for this prototype

71 Dividing a cluster into round sub-clusters: an illustration using points This can be done by a variant of the K-medoids clustering algorithm where the desired maximum radius of a subcluster is a parameter.


72 Division of a cluster of trajectories into round subclusters
73 To obtain meaningful results, the analyst may needs to review and, possibly, edit the classifier Some trajectories are not very similar to the others. Should such trajectories be in the cluster? Should I keep the three branches in one cluster? Or should I divide the cluster into two or three clusters? Is it good to have this prototype? This is not a core trajectory of the cluster.


74 Example of interactive editing
75 What are the most frequent routes on Wednesday? Result of clustering of single-day trajectories by route similarity

76 How frequent are these routes during the whole week? Result of building a classifier and applying it to the whole set of trajectories
77 Further analysis of the trajectories The analysis is continued by loading a subset of the unclassified trajectories ( noise ) to RAM, applying clustering to it, building a new classifier, and applying the classifier to the whole set of unclassified trajectories. Empirical experience: With each new iteration step, the number and the sizes of discovered clusters substantially decrease in comparison to the previous step. After 4-5 steps of the procedure, only very small clusters can be discovered. The analyst s effort needed for editing of the classifier also decreases. The editing effort is high for big clusters with high internal variation, which mostly appear in the first step; the following clusters are smaller and cleaner. Unfortunately, no formal criterion for terminating the procedure.
78 Where to read more G.Andrienko, N.Andrienko, S.Rinzivillo, M.Nanni, D.Pedreschi, F.Giannotti Interactive Visual Clustering of Large Collections of Trajectories IEEE Visual Analytics Science and Technology (VAST 2009) Proceedings, IEEE Computer Society Press, 2009, pp.3-10
79 Outline Events 1. Introduction to visual analytics 2. Data types and structures; spatio-temporal data 3. Fundamentals of visualization and interaction 4. Types of tasks in data analysis 5. Data transformations 6. Multi-perspective analysis of movement by example a) Trajectories b) Movement events c) Spatial situations d) Local time series 7. Concluding summary Movers Trajectories Movement data Spatial events Spatial event data Spatial time series Locations Local time series Times Spatial distributions

80 Example of analysis focusing on movement events Data: trajectories of cars in Milan Task: find places of traffic congestions and determine their characteristics (times of the congestions, durations, numbers of cars involved,...) Traffic congestion dense spatio-temporal cluster of low speed movement events Movement direction must be taken into account Places of interest: areas where at least one traffic congestion occurred areas containing the clusters Characteristics of places: time series of event counts, vehicle counts,... Data transformations: Trajectories Events Places Spatial time series


81 Step 1: extract low speed events from the trajectories Low speed := speed 10 km/h

82 Vertical dimension time
83 Step 2: density-based clustering of events by spatio-temporal positions and directions Distance function: neighbourhood defined as a cube neighbourhood defined as a sphere D s spatial distance threshold; D 0,D 1,,D N - distance thresholds for other attributes d s,d 0,d 1,,d N distances; d s distance in space Distance in time (t 1, t 2 are intervals): Distance for a cyclic attribute (V is the cycle length): E.g., direction: V = 360 ; d(5,355, 360 ) = 10
 with the distance thresholds 100 meters, 10 minutes, and 20 degrees and the minimum number of")
84 The result of the densitybased clustering of the slow movement events by their spatial positions, temporal positions, and movement directions (STD) with the distance thresholds 100 meters, 10 minutes, and 20 degrees and the minimum number of neighbors 5.

85 The STD-clusters, noise hidden


86 Step 3: unite STD-clusters in SD-clusters Cluster the events from the STD-clusters by the spatial positions and directions The result of the density-based clustering with the spatial distance threshold of 100 m and direction distance threshold of 20

87 Events that occurred in same or close places but in different times were formerly in different clusters, but now they are in the same clusters. One SD-cluster includes one or several STD-clusters.

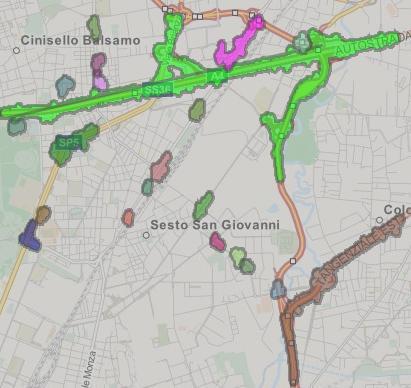
88 Step 4: outline the places of interest Build spatial buffers around the SD-clusters of events The places are painted according to the prevailing movement directions of the respective events.
89 Belt road north-south on the east of the city (A50) Extended areas of congested traffic directed to the south and southeast Smaller areas of obstructed movement directed to the north and northwest Belt road west-east on the north of the city (A4) Very long area of congested traffic directed to the east Long area of congested movements directed to the west

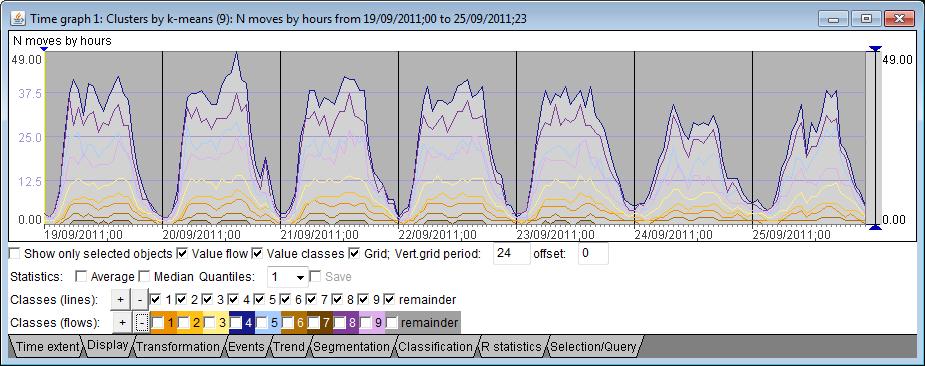
90 Step 5: aggregate data by the places and by suitable time intervals, e.g., hourly Place-referenced time series of the counts of slow movement events
 over time (horizontal")
91 The temporal diagrams show the variation of the attribute value (vertical dimension) over time (horizontal dimension).
 Congested traffic in the morning in the direction to the")
92 Map fragment (northwest) enlarged Congested traffic in the afternoon in the direction out of the city (northwest) Congested traffic in the morning in the direction to the south


93 Other map fragments enlarged East Northeast morning morning and midday morning and afternoon afternoon morning and afternoon morning afternoon morning
94 Where to read more IEEE VAST 2011 paper (best paper award) G.Andrienko, N.Andrienko, C.Hurter, S.Rinzivillo, S.Wrobel From Movement Tracks through Events to Places: Extracting and Characterizing Significant Places from Mobility Data IEEE Visual Analytics Science and Technology (VAST 2011), Proceedings, IEEE Computer Society Press, Extended version, covering also scalable clustering of events G.Andrienko, N.Andrienko, C.Hurter, S.Rinzivillo, S.Wrobel Scalable Analysis of Movement Data for Extracting and Exploring Significant Places IEEE Transactions on Visualization and Computer Graphics, 2013, 19(7),
95 Outline Situations 1. Introduction to visual analytics 2. Data types and structures; spatio-temporal data 3. Fundamentals of visualization and interaction 4. Types of tasks in data analysis 5. Data transformations 6. Multi-perspective analysis of movement by example a) Trajectories b) Movement events c) Spatial situations d) Local time series 7. Concluding summary Movers Trajectories Movement data Spatial events Spatial event data Spatial time series Locations Local time series Times Spatial distributions


96 Spatio-temporal aggregation of trajectories


, pp.205-219 http://doi.ieeecomputersociety.org/10.1109/tvcg.")
97 Division of the territory Characteristic points from the trajectories Spatial clusters of characteristic points Cluster centres seeds for Voronoi tessellation Details: Natalia Andrienko, Gennady Andrienko Spatial Generalization and Aggregation of Massive Movement Data IEEE Transactions on Visualization and Computer Graphics (TVCG), 2011, v.17 (2), pp

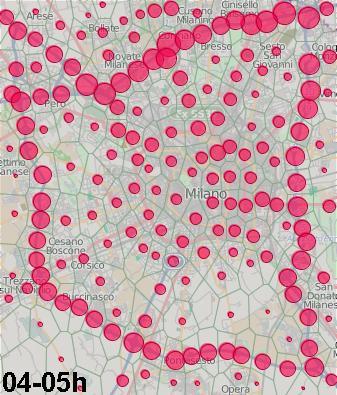

98 Spatial situations: presence

99 Spatial situations: flows


100 Clustering of spatial (flow) situations by similarity


101 Comparison of clusters of spatial situations Values for cluster 9 have been subtracted from values for all other clusters
102 Where to read more N.Andrienko, G.Andrienko, H.Stange, T.Liebig, D.Hecker Visual Analytics for Understanding Spatial Situations from Episodic Movement Data Künstliche Intelligenz, 2012, v.26 (3), pp
103 Outline Local time series 1. Introduction to visual analytics 2. Data types and structures; spatio-temporal data 3. Fundamentals of visualization and interaction 4. Types of tasks in data analysis 5. Data transformations 6. Multi-perspective analysis of movement by example a) Trajectories b) Movement events c) Spatial situations d) Local time series 7. Concluding summary Movers Trajectories Movement data Spatial events Spatial event data Spatial time series Locations Local time series Times Spatial distributions

104 An alternative view of spatial time series: a set of local time series

105 An alternative view of spatial time series : a set of local time series We wish to represent the essential characteristics of the ST-variation explicitly by a formal model or a set of models.
106 Methods for spatio-temporal modelling (e.g. STARIMA) Account for spatial and temporal dependencies Require prior specification of multiple weight matrices expressing impacts among locations for different temporal lags may be difficult (the impacts are not easy to quantify) Build a single global model of the entire spatio-temporal variation It does not necessarily perform better than a set of local temporal models Assume spatial smoothness of the modelled phenomenon, i.e., closer places are more similar than more distant ones May be not very suitable for spatially abrupt phenomena
107 Existing techniques for time series modelling + Widely available in numerous statistical packages and libraries can be applied to spatially referenced time series - The modelling methods are designed to deal with singular time series hard to use for a large number of time series - Separate consideration of each time series ignores the phenomenon of spatial dependence (relatedness and similarities among spatial locations or objects) - Separate consideration of each time series does not allow data abstraction and generalisation over space
108 Combination of spatial and temporal modelling Approach 1: 1. Model the temporal variation independently for each location 2. Model the spatial variation of the parameters of the temporal models, e.g., as a random field Assumes that the character of the temporal variation is the same everywhere and only the parameters differ Approach 2: Model the spatial variation independently for each time step, e.g., as a random field Model the temporal variation of the parameters of the spatial models at each location Both approaches assume spatial smoothness of the phenomenon
109 Our approach Step 0: Prepare data Step 1: Group time series Details: Natalia Andrienko, Gennady Andrienko A Visual Analytics Framework for Spatio-temporal Analysis and Modelling Data Mining and Knowledge Discovery, 27(1), 55-83, Clustering Progressive clustering Interactive re-grouping For each group: Step 2: Analyse and model Select method Set parameters Compute and view model Step 4: Store model set Step 3: Evaluate model Predict values and compute residuals Visualise and analyse residuals
 but may be another partition-based")

110 Step 1: Clustering of local TS Here: k-means (Weka) but may be another partition-based method Tried different k from 5 to 15 Immediate visual response facilitates choosing the most suitable k


111 Step 1: Re-grouping by progressive clustering
 Build the representative TS. D) Select the modelling method.")
112 Step 2: Analysis and modelling A) Check automatically detected time cycles in the data. B) Select the current class (cluster) for the analysis and modelling. C) Build the representative TS. D) Select the modelling method. E) View and modify model parameters (this section changes depending on the selected modelling method).
113 Step 2: Analysis and modelling

114 Step 2: Analysis and modelling

115 Step 2: Analysis and modelling
116 Step 3: Model evaluation (analysis of residuals) The goal is not to minimise the residuals The model should not reproduce all fluctuations and outliers present in the data This should be an abstraction capturing the characteristic features of the temporal variation High values of the residuals do not mean low model quality The goal is to have the residuals randomly distributed in space and time (no detectable patterns) This means that the model correctly captures the characteristic, nonrandom features of the temporal variation

117 Analysis of residuals (example) No systematic bias: approximately equal numbers of positive and negative errors in each time step No periodic increases and decreases at the level of the whole group However, we are not sure about individual objects


118 More detailed analysis by subgroups Periodic drops It may be reasonable to consider this subgroup separately -> back to re-grouping
119 Use of a model for prediction We obtain a common model for a group (cluster) of time series Predicts the same values for all objects/places of the group The statistical properties of the distribution of the predicted values in each place differ from the distribution of the original values Adjustment of the prediction for individual objects/places: Compute and store the basic statistics (quartiles) of the original values for each object/place i: Q1 i, M i, Q3 i Compute the statistics of the model-predicted values for the same time steps as the original values: Q1, M, Q3 (common for the cluster) Shift (level adjustment): S = M i M M i Q1 i Scale factors (amplitude adjustment): F low = F high = M Q1 Let v t be the model-predicted value for an arbitrary time step t and v t i the individually adjusted value for the place/object i v t i = Q3 i M i Q3 M M + F low (v t M) + S, if v t < M M + F high (v t M) + S, otherwise


120 Use of a model for prediction: example Common prediction for a cluster: Set of individually adjusted predictions for this cluster: median

121 Prediction based on the models

122 Predicted: Monday Saturday Original:


123 Comparison of actual values with predicted (e.g., in monitoring) Absolute differences Normalized differences

124 Analysis and modelling of relationships between two time-variant attributes flow magnitudes mean speeds

 Dependencies of maximal mean speed on flow magnitude Dependencies of maximal flow magnitude on")
125 Data transformation and clustering Dependency of attribute A(t) on attribute B(t): Divide the value range of B into intervals For each interval, collect all values of A that cooccur with the values of B from this interval Compute statistics of the values of A: minimum, maximum, median, mean, percentiles For each of these, there is a series B A, or A(B) Dependencies of maximal mean speed on flow magnitude Dependencies of maximal flow magnitude on mean speed

126 Dependency modelling: flow maximal mean speed

127 Dependency modelling: mean speed maximal flow


128 Graphical representation of the models built


129 Use of the models: simulation of extraordinary traffic from given places


130 The bottlenecks can be revealed even before the simulation


131 Simulated trajectories Some traffic re-routed to the south:

132 The speeds on the northern motorway

133 Animation of simulation results

134 Presence and flows for selected time intervals 20:00 20:10 21:00 21:10 21:30 21:40 00:00 00:10 22:00 Analyse- und Informationssysteme 22:10 IAIS 23:00 23:10
135 Multi-perspective analysis of movement Trip destinations, routes... Spatial events Moving objects Trajectories Movement data Periodic variation of flow volumes; Dependencies volume vs. speed Locations Local time series Spatial event data Spatial time series Times Spatial distributions Low speed events traffic jams Periodic (daily and weekly) variation of spatial situations


136 Movers Trajectories Spatial events Movement data Locations Local time series Spatial event data Spatial time series Times Spatial distributions Springer, June 2013 ISBN p. 200 illus., 178 in colour Ch.1. Introduction Ch.2. Conceptual framework Ch.3. Transformations of movement data Ch.4. Visual analytics infrastructure Ch.5. Visual analytics focusing on movers Ch.6. Visual analytics focusing on spatial events Ch.7. Visual analytics focusing on space Ch.8. Visual analytics focusing on time Ch.9. Discussion and outlook
137 Outline Summary 1. Introduction to visual analytics 2. Data types and structures; spatio-temporal data 3. Fundamentals of visualization and interaction 4. Types of tasks in data analysis 5. Data transformations 6. Multi-perspective analysis of movement by example a) Trajectories b) Movement events c) Spatial situations d) Local time series 7. Concluding summary
138 Concluding summary Visual analytics tools and techniques support human analysts in performing data analysis: Data Information Knowledge Explanation VA tools and techniques enable analysts to exploit effectively their visionbased cognitive capabilities Abstraction, grasping general, characteristic features, pattern detection and interpretation,... VA tools and techniques divide the analytical labour between humans and computers Use computer processing where human judgement is not needed Use computers to prepare data to human analysis Use computers to present data to analysts in the most suitable form
139 Design and use of VA techniques is based on data and task analysis Analyze data structure (components, types, references, attributes) Analyze the analysis task(s): what needs to be characterized in terms of what E.g., places in terms of traffic congestions Does the data structure correspond to the task(s)? Does it include necessary components? If no, find/design data transformations to obtain the structure needed E.g., extract events, find dense event clusters, outline places,... VA tools designer: provide support to analysts for performing the transformations Choose/design visual representations enabling the analyst to explore the data, fulfil the tasks, and thus obtain the required information and knowledge
140 Design of visual representations Following the rules of visual representation, select appropriate visual variables for representing data components Give primary attention to enabling synoptic analysis level Choose/design representations stimulating holistic perception and perceptual abstraction When necessary, involve computational data transformations supporting abstraction: generalization, aggregation, clustering,... Provide the possibility of focusing and obtaining details on demand through interactive operations: zoom, filter, drill down, get additional views,...
141 Enable effective use of computing power Support the use of algorithmic methods by visualizations and interactions Allow the analyst to investigate and understand the impact of algorithm parameters Support iterative analysis, returns to previous steps, trying alternative paths Support progressive refinement of analysis results Support progressive enrichment of obtained results by new facets and features
142 Thank you!
Scalable Analysis of Movement Data for Extracting and Exploring Significant Places
 IEEE TRANSACTIONS ON VISUALIZATION AND COMPUTER GRAPHICS, MANUSCRIPT ID 1 Scalable Analysis of Movement Data for Extracting and Exploring Significant Places Gennady Andrienko, Natalia Andrienko, Christophe
Implementing Visual Analytics Methods for Massive Collections of Movement Data
 Implementing Visual Analytics Methods for Massive Collections of Movement Data G. Andrienko, N. Andrienko Fraunhofer Institute Intelligent Analysis and Information Systems Schloss Birlinghoven, D-53754
Extracting Patterns of Individual Movement Behaviour from a Massive Collection of Tracked Positions
 Extracting Patterns of Individual Movement Behaviour from a Massive Collection of Tracked Positions Gennady Andrienko and Natalia Andrienko Fraunhofer Institute IAIS Schloss Birlinghoven, 53754 Sankt Augustin,
Visualization of Trajectory Attributes in Space Time Cube and Trajectory Wall
 Visualization of Trajectory Attributes in Space Time Cube and Trajectory Wall Gennady Andrienko, Natalia Andrienko, Heidrun Schumann and Christian Tominski Abstract Space time cube is often used as a visualization
Visual Analytics ofmovement
 Gennady Andrienko. Natalia Andrienko Peter Bak Daniel Keim Stefan Wrobel Visual Analytics ofmovement ~ Springer Contents 1 Introduction... 1 1.1 A Single Trajectory.....................................
Analysis of Flight Variability: a Systematic Approach
 Analysis of Flight Variability: a Systematic Approach Natalia Andrienko, Gennady Andrienko, Jose Manuel Cordero Garcia, and David Scarlatti Fig. 1. A: Planned flight trajectories are represented in an
Revealing Patterns and Trends of Mass Mobility through Spatial and Temporal Abstraction of Origin-Destination Movement Data
 Revealing Patterns and Trends of Mass Mobility through Spatial and Temporal Abstraction of Origin-Destination Movement Data Gennady Andrienko, Natalia Andrienko, Georg Fuchs, and Jo Wood Abstract Origin-destination
Visual Analytics for Transportation: State of the Art and Further Research Directions
 Visual Analytics for Transportation: State of the Art and Further Research Directions Gennady Andrienko, Natalia Andrienko, Wei Chen, Ross Maciejewski, and Ye Zhao Abstract Many cities and countries are
A Conceptual Framework and Taxonomy of Techniques for Analyzing Movement
 A Conceptual Framework and axonomy of echniques for Analyzing Movement G. Andrienko 1, N. Andrienko 1, P. Bak 2, D. Keim 3,. Kisilevich 3,. Wrobel 1 1 Fraunhofer Institute IAI - Intelligent Analysis and
VISUAL EXPLORATION OF SPATIAL-TEMPORAL TRAFFIC CONGESTION PATTERNS USING FLOATING CAR DATA. Candra Kartika 2015
 VISUAL EXPLORATION OF SPATIAL-TEMPORAL TRAFFIC CONGESTION PATTERNS USING FLOATING CAR DATA Candra Kartika 2015 OVERVIEW Motivation Background and State of The Art Test data Visualization methods Result
Interactive Cumulative Curves for Exploratory Classification Maps
 Interactive Cumulative Curves for Exploratory Classification Maps Gennady Andrienko and Natalia Andrienko Fraunhofer Institute AIS Schloss Birlinghoven, 53754 Sankt Augustin, Germany Tel +49-2241-142486,
ECLT 5810 Data Preprocessing. Prof. Wai Lam
 ECLT 5810 Data Preprocessing Prof. Wai Lam Why Data Preprocessing? Data in the real world is imperfect incomplete: lacking attribute values, lacking certain attributes of interest, or containing only aggregate
Geospatial Visual Analytics and Geovisualization in VisMaster (WP3.4)
") Geospatial Visual Analytics and Geovisualization in VisMaster (WP3.4) Gennady Andrienko Fraunhofer Institute IAIS Sankt Augustin Germany http://geoanalytics.net/and Heidrun Schumann University of Rostock
Geospatial Visual Analytics and Geovisualization in VisMaster (WP3.4) Gennady Andrienko Fraunhofer Institute IAIS Sankt Augustin Germany http://geoanalytics.net/and Heidrun Schumann University of Rostock
Mapcube and Mapview. Two Web-based Spatial Data Visualization and Mining Systems. C.T. Lu, Y. Kou, H. Wang Dept. of Computer Science Virginia Tech
 Mapcube and Mapview Two Web-based Spatial Data Visualization and Mining Systems C.T. Lu, Y. Kou, H. Wang Dept. of Computer Science Virginia Tech S. Shekhar, P. Zhang, R. Liu Dept. of Computer Science University
Representation of Geographic Data
 GIS 5210 Week 2 The Nature of Spatial Variation Three principles of the nature of spatial variation: proximity effects are key to understanding spatial variation issues of geographic scale and level of
CIVL 7012/8012. Collection and Analysis of Information
 CIVL 7012/8012 Collection and Analysis of Information Uncertainty in Engineering Statistics deals with the collection and analysis of data to solve real-world problems. Uncertainty is inherent in all real
KAAF- GE_Notes GIS APPLICATIONS LECTURE 3
 GIS APPLICATIONS LECTURE 3 SPATIAL AUTOCORRELATION. First law of geography: everything is related to everything else, but near things are more related than distant things Waldo Tobler Check who is sitting
SPATIAL DATA MINING. Ms. S. Malathi, Lecturer in Computer Applications, KGiSL - IIM
 SPATIAL DATA MINING Ms. S. Malathi, Lecturer in Computer Applications, KGiSL - IIM INTRODUCTION The main difference between data mining in relational DBS and in spatial DBS is that attributes of the neighbors
IV Course Spring 14. Graduate Course. May 4th, Big Spatiotemporal Data Analytics & Visualization
 Spatiotemporal Data Visualization IV Course Spring 14 Graduate Course of UCAS May 4th, 2014 Outline What is spatiotemporal data? How to analyze spatiotemporal data? How to visualize spatiotemporal data?
Applying Visual Analytics Methods to Spatial Time Series Data: Forest Fires, Phone Calls,
 Applying Visual Analytics Methods to Spatial Time Series Data: Forest Fires, Phone Calls, Dr. & Dr. Natalia Andrienko In collaboration with TU Darmstadt and Univ. Constance, DFG Priority Research Program
Classification in Mobility Data Mining
 Classification in Mobility Data Mining Activity Recognition Semantic Enrichment Recognition through Points-of-Interest Given a dataset of GPS tracks of private vehicles, we annotate trajectories with the
ADAPTABLE DASHBOARD FOR VISUALIZATION OF ORIGIN-DESTINATION DATA PATTERNS
 ADAPTABLE DASHBOARD FOR VISUALIZATION OF ORIGIN-DESTINATION DATA PATTERNS Ieva Dobrāja, PhD Candidate Prof. Dr. Menno-Jan Kraak Dr. Yuri Engelhardt NCG Symposium 2017 ADAPTABLE DASHBOARD FOR VISUALIZATION
ADAPTABLE DASHBOARD FOR VISUALIZATION OF ORIGIN-DESTINATION DATA PATTERNS
 ADAPTABLE DASHBOARD FOR VISUALIZATION OF ORIGIN-DESTINATION DATA PATTERNS Ieva Dobrāja, PhD Candidate Prof. Dr. Menno-Jan Kraak Dr. Yuri Engelhardt NCG Symposium 2017 ADAPTABLE DASHBOARD FOR VISUALIZATION
A MULTISCALE APPROACH TO DETECT SPATIAL-TEMPORAL OUTLIERS
 A MULTISCALE APPROACH TO DETECT SPATIAL-TEMPORAL OUTLIERS Tao Cheng Zhilin Li Department of Land Surveying and Geo-Informatics The Hong Kong Polytechnic University Hung Hom, Kowloon, Hong Kong Email: {lstc;
EXTRACTING SEMANTICS OF Individual PLACES FROM MOVEMENT DATA BY ANALYZING TEMPORAL PATTERNS OF VISITS
 EXTRACTING SEMANTICS OF Individual PLACES FROM MOVEMENT DATA BY ANALYZING TEMPORAL PATTERNS OF VISITS Gennady Andrienko 1,4, Natalia Andrienko 1,4, Georg Fuchs 1, Ana-Maria Olteanu Raimond 2, Juergen Symanzik
The prediction of passenger flow under transport disturbance using accumulated passenger data
 Computers in Railways XIV 623 The prediction of passenger flow under transport disturbance using accumulated passenger data T. Kunimatsu & C. Hirai Signalling and Transport Information Technology Division,
Clustering Analysis of London Police Foot Patrol Behaviour from Raw Trajectories
 Clustering Analysis of London Police Foot Patrol Behaviour from Raw Trajectories Jianan Shen 1, Tao Cheng 2 1 SpaceTimeLab for Big Data Analytics, Department of Civil, Environmental and Geomatic Engineering,
1. Write down the term 2. Write down the book definition 3. Put the definition in your own words 4. Draw an image and/or put a Real Life Example
 Unit 1 Vocabulary 1. Write down the term 2. Write down the book definition 3. Put the definition in your own words 4. Draw an image and/or put a Real Life Example Absolute Location Where Is It EXACTLY?
Outline. 15. Descriptive Summary, Design, and Inference. Descriptive summaries. Data mining. The centroid
 Outline 15. Descriptive Summary, Design, and Inference Geographic Information Systems and Science SECOND EDITION Paul A. Longley, Michael F. Goodchild, David J. Maguire, David W. Rhind 2005 John Wiley
CSC2524 L0101 TOPICS IN INTERACTIVE COMPUTING: INFORMATION VISUALISATION DATA MODELS. Fanny CHEVALIER
 CSC2524 L0101 TOPICS IN INTERACTIVE COMPUTING: INFORMATION VISUALISATION DATA MODELS Fanny CHEVALIER VISUALISATION DATA MODELS AND REPRESENTATIONS Source: http://www.hotbutterstudio.com/ THE INFOVIS
Three-Way Analysis of Facial Similarity Judgments
 Three-Way Analysis of Facial Similarity Judgments Daryl H. Hepting, Hadeel Hatim Bin Amer, and Yiyu Yao University of Regina, Regina, SK, S4S 0A2, CANADA hepting@cs.uregina.ca, binamerh@cs.uregina.ca,
VISUAL ANALYTICS APPROACH FOR CONSIDERING UNCERTAINTY INFORMATION IN CHANGE ANALYSIS PROCESSES
 VISUAL ANALYTICS APPROACH FOR CONSIDERING UNCERTAINTY INFORMATION IN CHANGE ANALYSIS PROCESSES J. Schiewe HafenCity University Hamburg, Lab for Geoinformatics and Geovisualization, Hebebrandstr. 1, 22297
Towards Privacy-Preserving Semantic Mobility Analysis
 EuroVis Workshop on Visual Analytics (2013) M. Pohl and H. Schumann (Editors) Towards Privacy-Preserving Semantic Mobility Analysis N. Andrienko 1, G. Andrienko 1 and G. Fuchs 1 1 Fraunhofer IAIS, Sankt
Geography for Life. Course Overview
 Geography for Life Description In Geography for Life students will explore the world around them. Using the six essential elements established by the National Geographic Society students will be able to
transportation research in policy making for addressing mobility problems, infrastructure and functionality issues in urban areas. This study explored
 ABSTRACT: Demand supply system are the three core clusters of transportation research in policy making for addressing mobility problems, infrastructure and functionality issues in urban areas. This study
Spatial-Temporal Analytics with Students Data to recommend optimum regions to stay
 Spatial-Temporal Analytics with Students Data to recommend optimum regions to stay By ARUN KUMAR BALASUBRAMANIAN (A0163264H) DEVI VIJAYAKUMAR (A0163403R) RAGHU ADITYA (A0163260N) SHARVINA PAWASKAR (A0163302W)
Data Science Unit. Global DTM Support Team, HQ Geneva
 NET FLUX VISUALISATION FOR FLOW MONITORING DATA Data Science Unit Global DTM Support Team, HQ Geneva March 2018 Summary This annex seeks to explain the way in which Flow Monitoring data collected by the
APC Part I Workshop. Mapping and Cartography. 14 November 2014
 APC Part I Workshop Mapping and Cartography 14 November 2014 Cartography Cartography is the discipline dealing with the conception, production, dissemination and study of maps in all forms (ICA) A holistic
Know Your Uncertainty
 April 2000 METROLOGY Know Your Uncertainty Understanding and documenting measurement uncertainty is key to gage calibration. By Henrik S. Nielsen, Ph.D. The process of developing uncertainty budgets requires
Encapsulating Urban Traffic Rhythms into Road Networks
 Encapsulating Urban Traffic Rhythms into Road Networks Junjie Wang +, Dong Wei +, Kun He, Hang Gong, Pu Wang * School of Traffic and Transportation Engineering, Central South University, Changsha, Hunan,
Detecting Origin-Destination Mobility Flows From Geotagged Tweets in Greater Los Angeles Area
 Detecting Origin-Destination Mobility Flows From Geotagged Tweets in Greater Los Angeles Area Song Gao 1, Jiue-An Yang 1,2, Bo Yan 1, Yingjie Hu 1, Krzysztof Janowicz 1, Grant McKenzie 1 1 STKO Lab, Department
Outline. Geographic Information Analysis & Spatial Data. Spatial Analysis is a Key Term. Lecture #1
 Geographic Information Analysis & Spatial Data Lecture #1 Outline Introduction Spatial Data Types: Objects vs. Fields Scale of Attribute Measures GIS and Spatial Analysis Spatial Analysis is a Key Term
Exploring the Patterns of Human Mobility Using Heterogeneous Traffic Trajectory Data
 Exploring the Patterns of Human Mobility Using Heterogeneous Traffic Trajectory Data Jinzhong Wang April 13, 2016 The UBD Group Mobile and Social Computing Laboratory School of Software, Dalian University
Geographic Analysis of Linguistically Encoded Movement Patterns A Contextualized Perspective
 Geographic Analysis of Linguistically Encoded Movement Patterns A Contextualized Perspective Alexander Klippel 1, Alan MacEachren 1, Prasenjit Mitra 2, Ian Turton 1, Xiao Zhang 2, Anuj Jaiswal 2, Kean
Understanding Travel Time to Airports in New York City Sierra Gentry Dominik Schunack
 Understanding Travel Time to Airports in New York City Sierra Gentry Dominik Schunack 1 Introduction Even with the rising competition of rideshare services, many in New York City still utilize taxis for
A Modified DBSCAN Clustering Method to Estimate Retail Centre Extent
 A Modified DBSCAN Clustering Method to Estimate Retail Centre Extent Michalis Pavlis 1, Les Dolega 1, Alex Singleton 1 1 University of Liverpool, Department of Geography and Planning, Roxby Building, Liverpool
Chapter 7: Making Maps with GIS. 7.1 The Parts of a Map 7.2 Choosing a Map Type 7.3 Designing the Map
 Chapter 7: Making Maps with GIS 7.1 The Parts of a Map 7.2 Choosing a Map Type 7.3 Designing the Map What is a map? A graphic depiction of all or part of a geographic realm in which the real-world features
Spatial Decision Tree: A Novel Approach to Land-Cover Classification
 Spatial Decision Tree: A Novel Approach to Land-Cover Classification Zhe Jiang 1, Shashi Shekhar 1, Xun Zhou 1, Joseph Knight 2, Jennifer Corcoran 2 1 Department of Computer Science & Engineering 2 Department
Why have so many measurement scales?
 Why have so many measurement scales? Blair Hall Measurement Standards Laboratory of New Zealand Industrial Research Ltd., PO Box 31-310, Lower Hutt, New Zealand. b.hall@irl.cri.nz Notes Presented (via
ST-DBSCAN: An Algorithm for Clustering Spatial-Temporal Data
 ST-DBSCAN: An Algorithm for Clustering Spatial-Temporal Data Title Di Qin Carolina Department First Steering of Statistics Committee and Operations Research October 9, 2010 Introduction Clustering: the
Geographers Perspectives on the World
 What is Geography? Geography is not just about city and country names Geography is not just about population and growth Geography is not just about rivers and mountains Geography is a broad field that
9/2/2010. Wildlife Management is a very quantitative field of study. throughout this course and throughout your career.
 Introduction to Data and Analysis Wildlife Management is a very quantitative field of study Results from studies will be used throughout this course and throughout your career. Sampling design influences
TOWARDS THE DEVELOPMENT OF A MONITORING SYSTEM FOR PLANNING POLICY Residential Land Uses Case study of Brisbane, Melbourne, Chicago and London
 TOWARDS THE DEVELOPMENT OF A MONITORING SYSTEM FOR PLANNING POLICY Residential Land Uses Case study of Brisbane, Melbourne, Chicago and London Presented to CUPUM 12 July 2017 by Claire Daniel Urban Planning/Data
Appendixx C Travel Demand Model Development and Forecasting Lubbock Outer Route Study June 2014
 Appendix C Travel Demand Model Development and Forecasting Lubbock Outer Route Study June 2014 CONTENTS List of Figures-... 3 List of Tables... 4 Introduction... 1 Application of the Lubbock Travel Demand
CONCEPTUAL DEVELOPMENT OF AN ASSISTANT FOR CHANGE DETECTION AND ANALYSIS BASED ON REMOTELY SENSED SCENES
 CONCEPTUAL DEVELOPMENT OF AN ASSISTANT FOR CHANGE DETECTION AND ANALYSIS BASED ON REMOTELY SENSED SCENES J. Schiewe University of Osnabrück, Institute for Geoinformatics and Remote Sensing, Seminarstr.
Spatial Data Science. Soumya K Ghosh
 Workshop on Data Science and Machine Learning (DSML 17) ISI Kolkata, March 28-31, 2017 Spatial Data Science Soumya K Ghosh Professor Department of Computer Science and Engineering Indian Institute of Technology,
Interactive Statistics Visualisation based on Geovisual Analytics
 Interactive Statistics Visualisation based on Geovisual Analytics Prof. Mikael Jern NCVA LiU and NComVA AB May 2010 - Spin-off company to focus on Interactive Statistics Visualization and Storytelling
Predicting MTA Bus Arrival Times in New York City
 Predicting MTA Bus Arrival Times in New York City Man Geen Harold Li, CS 229 Final Project ABSTRACT This final project sought to outperform the Metropolitan Transportation Authority s estimated time of
Introduction to statistics
 Introduction to statistics Literature Raj Jain: The Art of Computer Systems Performance Analysis, John Wiley Schickinger, Steger: Diskrete Strukturen Band 2, Springer David Lilja: Measuring Computer Performance:
A BASE SYSTEM FOR MICRO TRAFFIC SIMULATION USING THE GEOGRAPHICAL INFORMATION DATABASE
 A BASE SYSTEM FOR MICRO TRAFFIC SIMULATION USING THE GEOGRAPHICAL INFORMATION DATABASE Yan LI Ritsumeikan Asia Pacific University E-mail: yanli@apu.ac.jp 1 INTRODUCTION In the recent years, with the rapid
Visitor Flows Model for Queensland a new approach
 Visitor Flows Model for Queensland a new approach Jason. van Paassen 1, Mark. Olsen 2 1 Parsons Brinckerhoff Australia Pty Ltd, Brisbane, QLD, Australia 2 Tourism Queensland, Brisbane, QLD, Australia 1
Last Lecture. Distinguish Populations from Samples. Knowing different Sampling Techniques. Distinguish Parameters from Statistics
 Last Lecture Distinguish Populations from Samples Importance of identifying a population and well chosen sample Knowing different Sampling Techniques Distinguish Parameters from Statistics Knowing different
Research on Object-Oriented Geographical Data Model in GIS
 Research on Object-Oriented Geographical Data Model in GIS Wang Qingshan, Wang Jiayao, Zhou Haiyan, Li Bin Institute of Information Engineering University 66 Longhai Road, ZhengZhou 450052, P.R.China Abstract
GIS Test Drive What a Geographic Information System Is and What it Can Do. Alison Davis-Holland
 GIS Test Drive What a Geographic Information System Is and What it Can Do Alison Davis-Holland adavisholland@gmail.com WHO AM I? Geospatial Analyst M.S. in Geographic and Cartographic Sciences Use GIS
Part III: Unstructured Data. Lecture timetable. Analysis of data. Data Retrieval: III.1 Unstructured data and data retrieval
 Inf1-DA 2010 20 III: 28 / 89 Part III Unstructured Data Data Retrieval: III.1 Unstructured data and data retrieval Statistical Analysis of Data: III.2 Data scales and summary statistics III.3 Hypothesis
GIS Visualization Support to the C4.5 Classification Algorithm of KDD
 GIS Visualization Support to the C4.5 Classification Algorithm of KDD Gennady L. Andrienko and Natalia V. Andrienko GMD - German National Research Center for Information Technology Schloss Birlinghoven,
ADMS2320.com. We Make Stats Easy. Chapter 4. ADMS2320.com Tutorials Past Tests. Tutorial Length 1 Hour 45 Minutes
 We Make Stats Easy. Chapter 4 Tutorial Length 1 Hour 45 Minutes Tutorials Past Tests Chapter 4 Page 1 Chapter 4 Note The following topics will be covered in this chapter: Measures of central location Measures
Alexander Klippel and Chris Weaver. GeoVISTA Center, Department of Geography The Pennsylvania State University, PA, USA
 Analyzing Behavioral Similarity Measures in Linguistic and Non-linguistic Conceptualization of Spatial Information and the Question of Individual Differences Alexander Klippel and Chris Weaver GeoVISTA
Machine Learning! in just a few minutes. Jan Peters Gerhard Neumann
 Machine Learning! in just a few minutes Jan Peters Gerhard Neumann 1 Purpose of this Lecture Foundations of machine learning tools for robotics We focus on regression methods and general principles Often
Designing Interactive Graphics for Foraging Trips Exploration
 Designing Interactive Graphics for Foraging Trips Exploration R. Henkin 1, A. Slingsby 1 and E. E. van Loon 2 1 City University London, Northampton Square, London EC1V 0HB, UK Email: rafael.henkin.1@city.ac.uk,
Geog183: Cartographic Design and Geovisualization Winter Quarter 2017 Lecture 6: Map types and Data types
 Geog183: Cartographic Design and Geovisualization Winter Quarter 2017 Lecture 6: Map types and Data types Data types Data dimension: Point, Line, Area, Volume (Text) Data continuity: Discrete, Point, Polygon:
Generalisation and Multiple Representation of Location-Based Social Media Data
 Generalisation and Multiple Representation of Location-Based Social Media Data Dirk Burghardt, Alexander Dunkel and Mathias Gröbe, Institute of Cartography Outline 1. Motivation VGI and spatial data from
Building Blocks for Direct Sequential Simulation on Unstructured Grids
 Building Blocks for Direct Sequential Simulation on Unstructured Grids Abstract M. J. Pyrcz (mpyrcz@ualberta.ca) and C. V. Deutsch (cdeutsch@ualberta.ca) University of Alberta, Edmonton, Alberta, CANADA
2.0 Lesson Plan. Answer Questions. Summary Statistics. Histograms. The Normal Distribution. Using the Standard Normal Table
 2.0 Lesson Plan Answer Questions 1 Summary Statistics Histograms The Normal Distribution Using the Standard Normal Table 2. Summary Statistics Given a collection of data, one needs to find representations
Visualizing Geospatial Graphs
 Visualizing Geospatial Graphs An introduction to visualizing geospatial graph data with KeyLines Geospatial www.cambridge-intelligence.com USA: +1 (775) 842-6665 UK: +44 (0)1223 362 000 Cambridge Intelligence
Place Syntax Tool (PST)
") Place Syntax Tool (PST) Alexander Ståhle To cite this report: Alexander Ståhle (2012) Place Syntax Tool (PST), in Angela Hull, Cecília Silva and Luca Bertolini (Eds.) Accessibility Instruments for Planning
Place Syntax Tool (PST) Alexander Ståhle To cite this report: Alexander Ståhle (2012) Place Syntax Tool (PST), in Angela Hull, Cecília Silva and Luca Bertolini (Eds.) Accessibility Instruments for Planning
Maps as Tools for Visual Analysis of Geospatial Data. Dr. Claus Rinner Department of Geography and Environmental Studies Ryerson University
 Maps as Tools for Visual Analysis of Geospatial Data Dr. Claus Rinner Department of Geography and Environmental Studies Ryerson University 1 Geography and data analytics 80% of all datasets are said to
Visual Exploration of Sparse Traffic Trajectory Data
 IEEE TRANSACTIONS ON VISUALIZATION AND COMPUTER GRAPHICS, VOL. 20, NO. 12, DECEM BER 2014 1813 Visual Exploration of Sparse Traffic Trajectory Data Zuchao Wang, Tangzhi Ye, Min Lu, Xiaoru Yuan, Member,
Visualisation of Spatial Data
 Visualisation of Spatial Data VU Visual Data Science Johanna Schmidt WS 2018/19 2 Visual Data Science Introduction to Visualisation Basics of Information Visualisation Charts and Techniques Introduction
Geospatial Data Visualization
 Geospatial Data Visualization CS 7450 - Information Visualization October 19, 2016 John Stasko Guest speaker: Alex Godwin Learning Objectives Process of encoding Geospatial Visualization Common Geospatial
Spatial Analysis I. Spatial data analysis Spatial analysis and inference
 Spatial Analysis I Spatial data analysis Spatial analysis and inference Roadmap Outline: What is spatial analysis? Spatial Joins Step 1: Analysis of attributes Step 2: Preparing for analyses: working with
A cellular automata model for the study of small-size urban areas
 Context and Motivation A cellular automata model for the study of small-size urban areas Centre de Política de Sòl i Valoracions Barcelona 23 January 2007 Nuno Norte Pinto School of Technology and Management
Theory, Concepts and Terminology
 GIS Workshop: Theory, Concepts and Terminology 1 Theory, Concepts and Terminology Suggestion: Have Maptitude with a map open on computer so that we can refer to it for specific menu and interface items.
The Recognition of Temporal Patterns in Pedestrian Behaviour Using Visual Exploration Tools
 The Recognition of Temporal Patterns in Pedestrian Behaviour Using Visual Exploration Tools I. Kveladze 1, S. C. van der Spek 2, M. J. Kraak 1 1 University of Twente, Faculty of Geo-Information Science
Cartographic Skills. L.O. To be aware of the various cartographic skills and when to use them
 Cartographic Skills L.O. To be aware of the various cartographic skills and when to use them Cartographic Skills The term cartography is derived from two words: Carto = map graphy = write/draw Cartography
STAT 200 Chapter 1 Looking at Data - Distributions
 STAT 200 Chapter 1 Looking at Data - Distributions What is Statistics? Statistics is a science that involves the design of studies, data collection, summarizing and analyzing the data, interpreting the
Glossary. The ISI glossary of statistical terms provides definitions in a number of different languages:
 Glossary The ISI glossary of statistical terms provides definitions in a number of different languages: http://isi.cbs.nl/glossary/index.htm Adjusted r 2 Adjusted R squared measures the proportion of the
Intelligent GIS: Automatic generation of qualitative spatial information
 Intelligent GIS: Automatic generation of qualitative spatial information Jimmy A. Lee 1 and Jane Brennan 1 1 University of Technology, Sydney, FIT, P.O. Box 123, Broadway NSW 2007, Australia janeb@it.uts.edu.au
A route map to calibrate spatial interaction models from GPS movement data
 A route map to calibrate spatial interaction models from GPS movement data K. Sila-Nowicka 1, A.S. Fotheringham 2 1 Urban Big Data Centre School of Political and Social Sciences University of Glasgow Lilybank
Vocabulary: Samples and Populations
 Vocabulary: Samples and Populations Concept Different types of data Categorical data results when the question asked in a survey or sample can be answered with a nonnumerical answer. For example if we
Appendix BAL Baltimore, Maryland 2003 Annual Report on Freeway Mobility and Reliability
 (http://mobility.tamu.edu/mmp) Office of Operations, Federal Highway Administration Appendix BAL Baltimore, Maryland 2003 Annual Report on Freeway Mobility and Reliability This report is a supplement to:
Geography 360 Principles of Cartography. April 17, 2006
 Geography 360 Principles of Cartography April 17, 2006 Outlines Cartographic design principles Enhancing visual hierarchies on maps Kinds of numerical data and color scheme What is proportional symbol
Introduction to Information Visualization
 Introduction to Information Visualization Edward Tufte: References The Visual Display of Quantitative Information Envisioning Information Visual Explanation Dr. John Stasko s Information Visualization
Ø Set of mutually exclusive categories. Ø Classify or categorize subject. Ø No meaningful order to categorization.
 Statistical Tools in Evaluation HPS 41 Dr. Joe G. Schmalfeldt Types of Scores Continuous Scores scores with a potentially infinite number of values. Discrete Scores scores limited to a specific number
Tensor Visualisation and Information Visualisation
 Tensor Visualisation and Information Visualisation Computer Animation and Visualisation Lecture 18 Taku Komura tkomura@ed.ac.uk Institute for Perception, Action & Behaviour School of Informatics 1 K-means
Lecture 9: Geocoding & Network Analysis
 Massachusetts Institute of Technology - Department of Urban Studies and Planning 11.520: A Workshop on Geographic Information Systems 11.188: Urban Planning and Social Science Laboratory Lecture 9: Geocoding
STATISTICAL ANALYSIS OF LAW ENFORCEMENT SURVEILLANCE IMPACT ON SAMPLE CONSTRUCTION ZONES IN MISSISSIPPI (Part 1: DESCRIPTIVE)
") STATISTICAL ANALYSIS OF LAW ENFORCEMENT SURVEILLANCE IMPACT ON SAMPLE CONSTRUCTION ZONES IN MISSISSIPPI (Part 1: DESCRIPTIVE) Tulio Sulbaran, Ph.D 1, David Marchman 2 Abstract It is estimated that every
STATISTICAL ANALYSIS OF LAW ENFORCEMENT SURVEILLANCE IMPACT ON SAMPLE CONSTRUCTION ZONES IN MISSISSIPPI (Part 1: DESCRIPTIVE) Tulio Sulbaran, Ph.D 1, David Marchman 2 Abstract It is estimated that every
FROM DATA TO CARTOGRAPHIC PRESENTATION METHODS
 FROM DATA TO CARTOGRAPHIC PRESENTATION METHODS Jolanta Korycka-Skorupa Adress: Chair of Cartography, Warsaw University ul. Krakowskie Przedmiescie 30 00-927 Warsaw, POLAND tel: (4822) 55-20-632 fax: (4822)
Web Visualization of Geo-Spatial Data using SVG and VRML/X3D
 Web Visualization of Geo-Spatial Data using SVG and VRML/X3D Jianghui Ying Falls Church, VA 22043, USA jying@vt.edu Denis Gračanin Blacksburg, VA 24061, USA gracanin@vt.edu Chang-Tien Lu Falls Church,
ROBERTO BATTITI, MAURO BRUNATO. The LION Way: Machine Learning plus Intelligent Optimization. LIONlab, University of Trento, Italy, Apr 2015
 ROBERTO BATTITI, MAURO BRUNATO. The LION Way: Machine Learning plus Intelligent Optimization. LIONlab, University of Trento, Italy, Apr 2015 http://intelligentoptimization.org/lionbook Roberto Battiti