ROADWAY DESIGN CALCULATIONS
|
|
|
- Quentin Benson
- 5 years ago
- Views:
Transcription

1 ROADWAY DESIGN CALCULATIONS Interim Interchange at SR 400 (I-4) and Daryl Carter Parkway FPID: % (Phase II) Prepared by: AECOM Technical Services, Inc. 150 North Orange Avenue, Suite 200 Orlando, FL Certificate of Authorization No: 8115 Date: May 18, 2018 Notes: PRELIMINARY: NOT FOR CONSTRUCTION Bookmarks have been provided per Section and Subsection
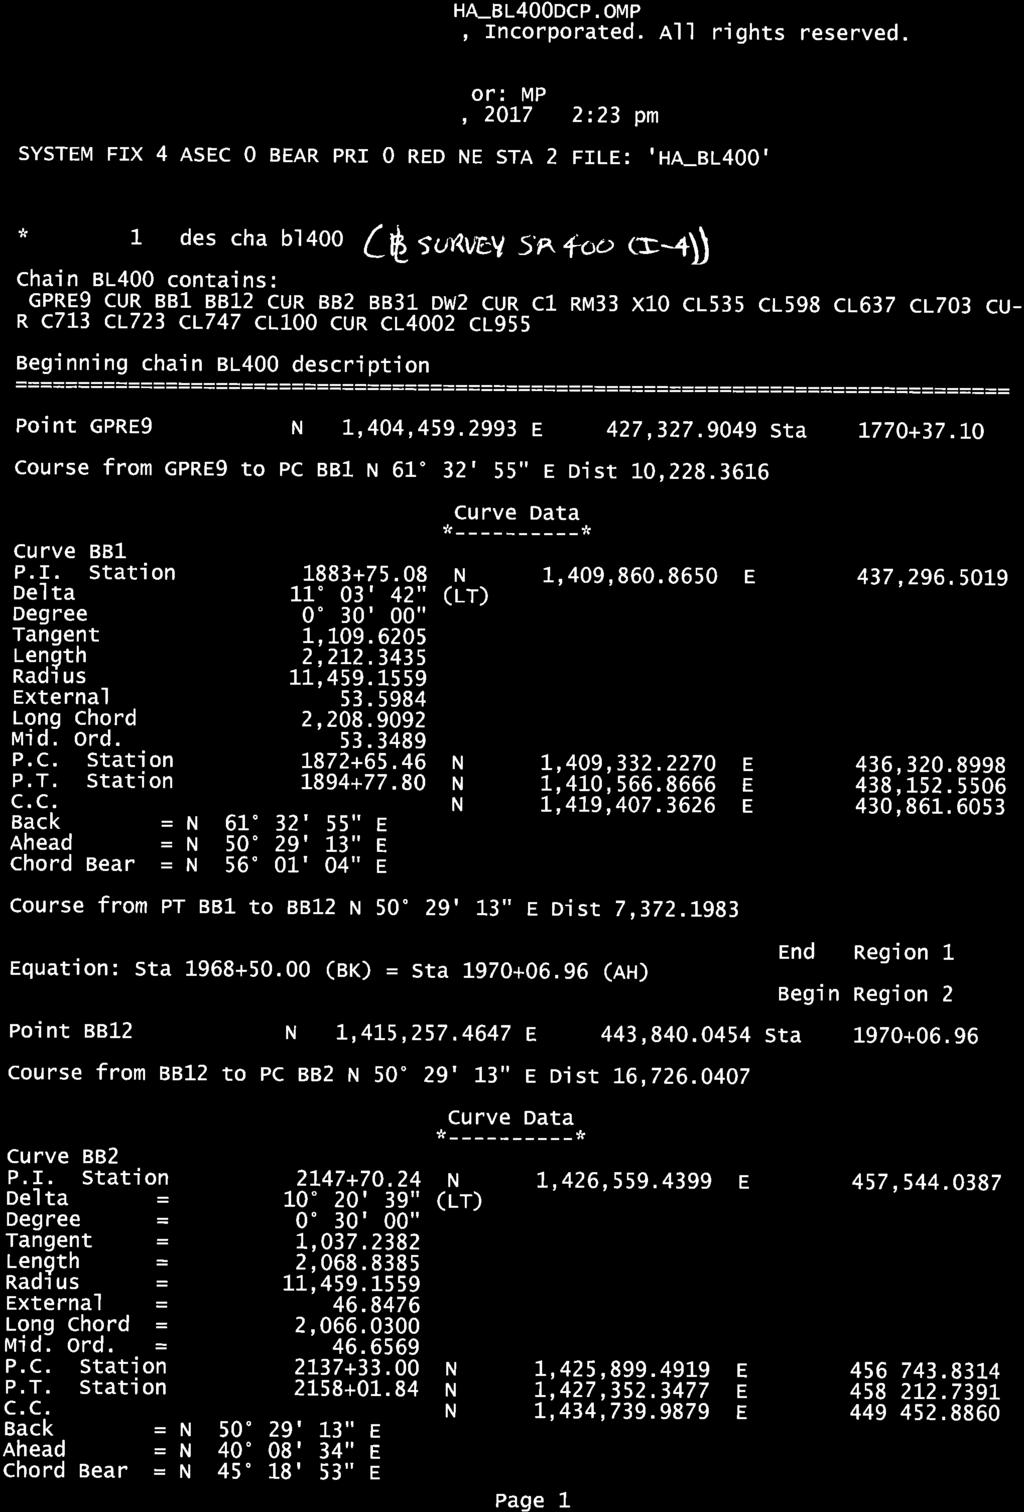
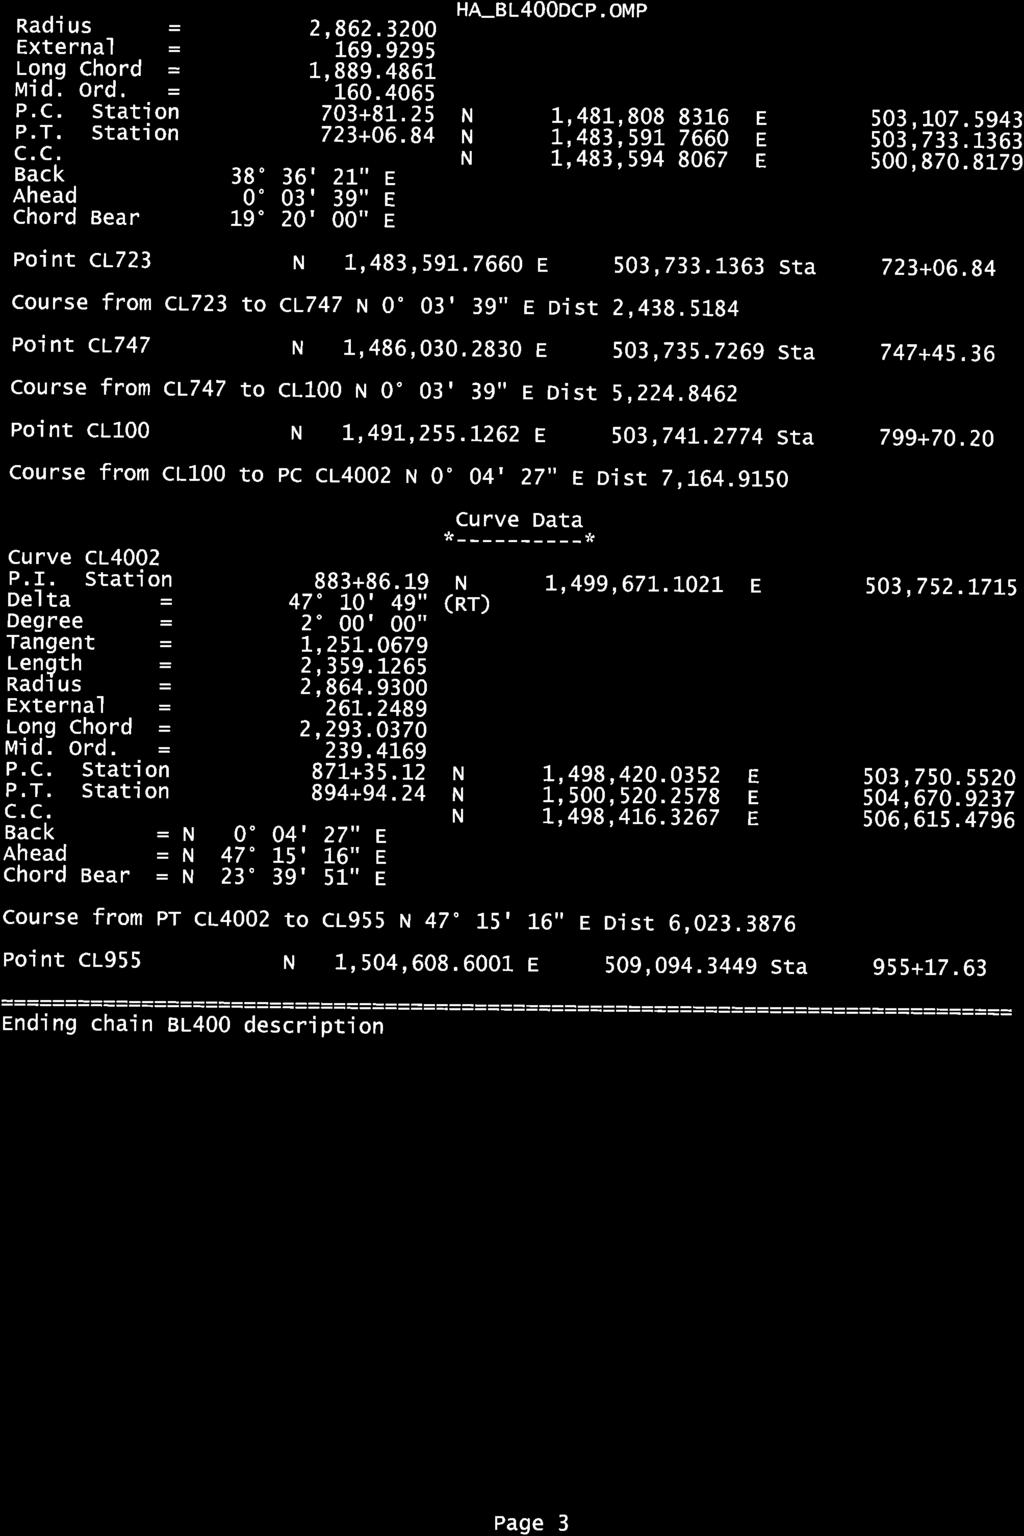
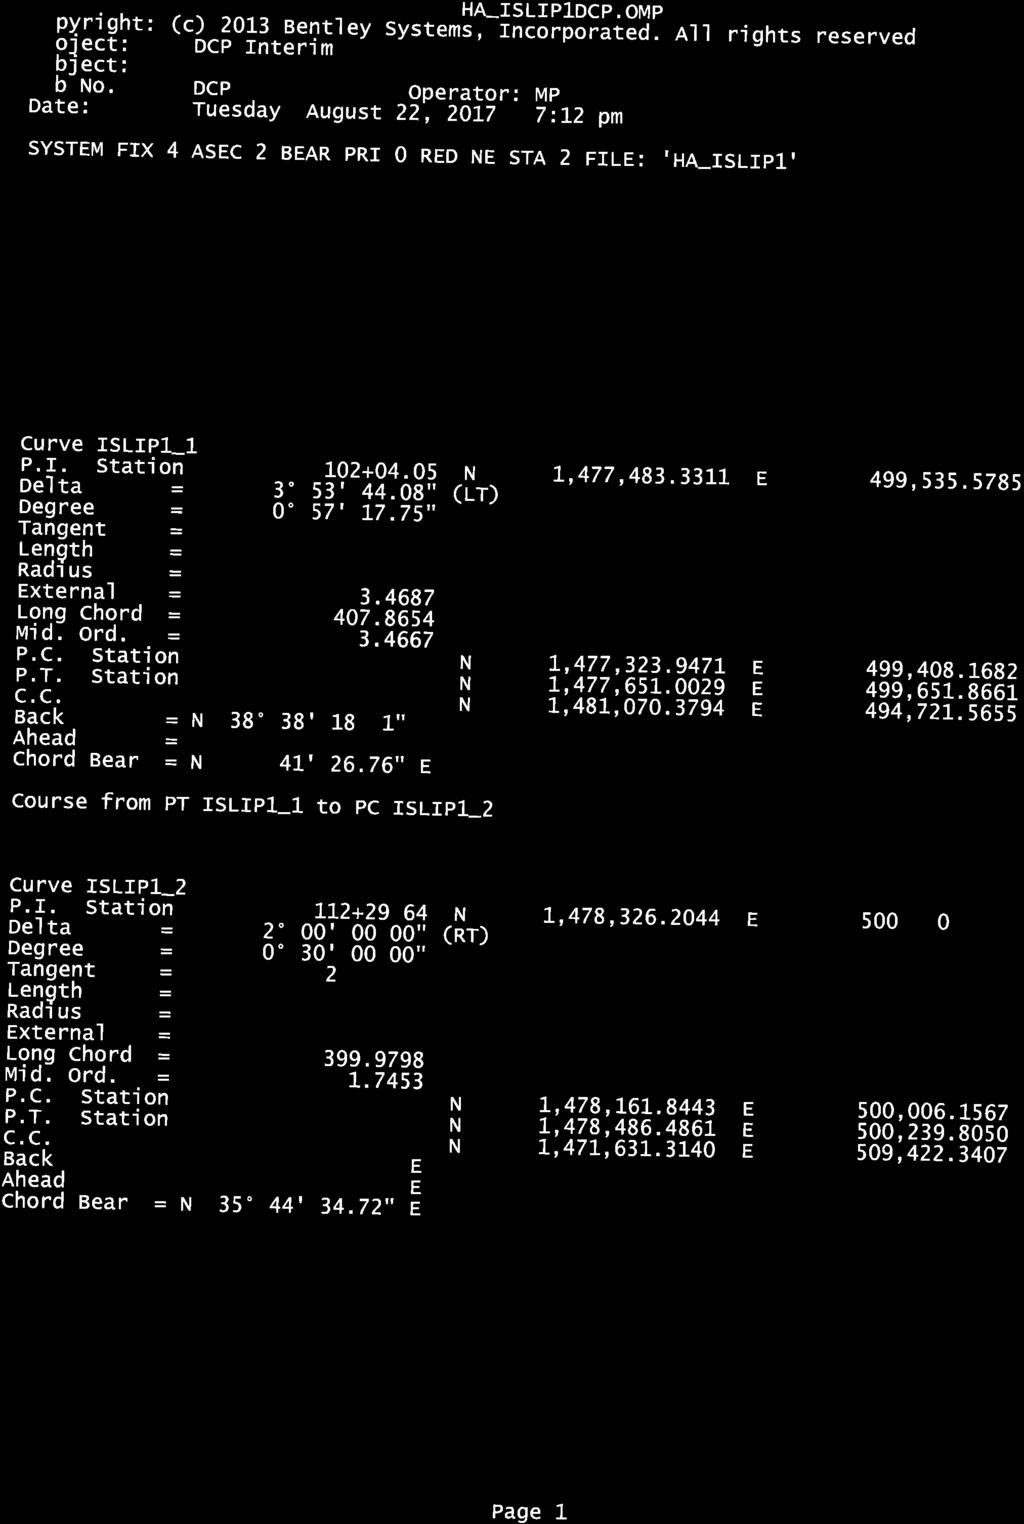
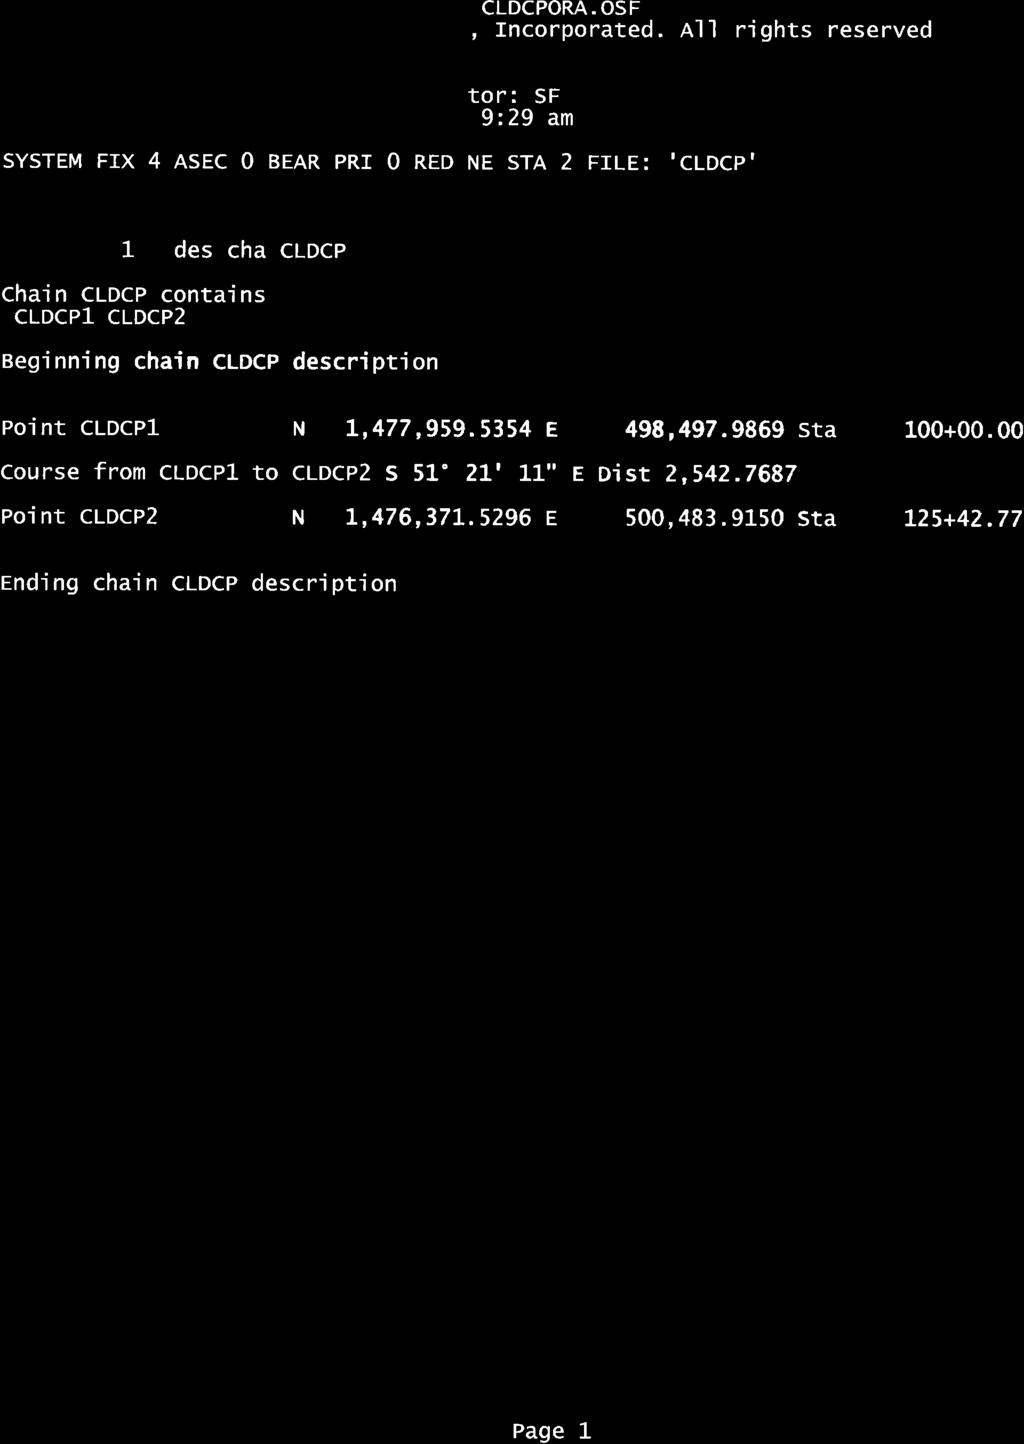
2 Interim Interchange at SR 400 (I-4) and Daryl Carter Parkway FPID: PRELIMINARY: NOT FOR CONSTRUCTION TABLE OF CONTENTS SECTION SUBSECTION 1. DESIGN CRITERIA ROADWAY DESIGN CRITERIA SHS FACILITIES ROADWAY DESIGN CRITERIA NON SHS FACILITIES SR 400 (I-4) 2.1 SR 400 (I-4) HORIZONTAL ALIGNMENT (BASELINE SURVEY) Westbound Collector Distributor (IWBCD2) HORIZONTAL ALIGNMENT STOPPING SIGHT DISTANCE SUPERELEVATION VERTICAL ALIGNMENT RAMP ISLIP1 (IWBCD2 TO WB I-4) HORIZONTAL ALIGNMENT STOPPING SIGHT DISTANCE SUPERELEVATION VERTICAL ALIGNMENT RAMP TERMINAL DETAILS (ISLIP1 & WB I-4) RAMP ISLIP2 (WB I-4 to IWBCD2 ) HORIZONTAL ALIGNMENT STOPPING SIGHT DISTANCE SUPERELEVATION VERTICAL ALIGNMENT RAMP TERMINAL DETAILS (ISLIP2 & WB I-4) (ISLIP2 & IWBCD2) SR 535 INTERCHANGE 3.1 RAMP IC1_535 (NB 535 TO EB I-4) HORIZONTAL ALIGNMENT STOPPING SIGHT DISTANCE SUPERELEVATION RAMP TERMINAL DETAILS (IC1_535 & EB I-4) Daryl Carter Pkwy INTERCHANGE 4.1 DARYL CARTER PARKWAY HORIZONTAL ALIGNMENT CLDCP HORIZONTAL ALIGNMENT EBDCP STOPPING SIGHT DISTANCE EBDCP SUPERELEVATION EBDCP
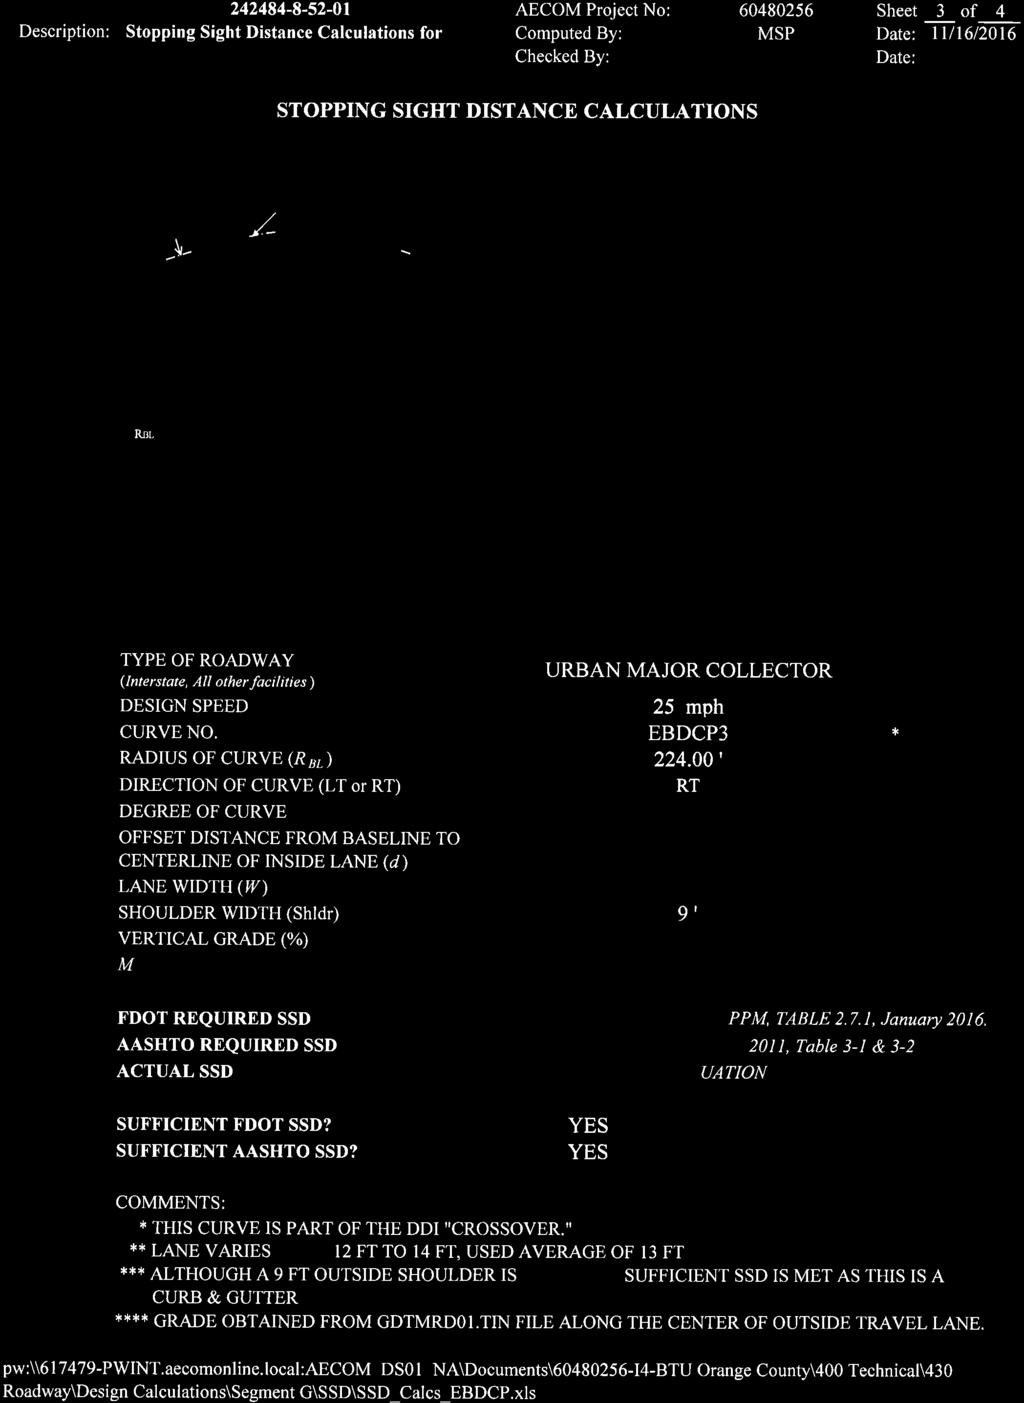
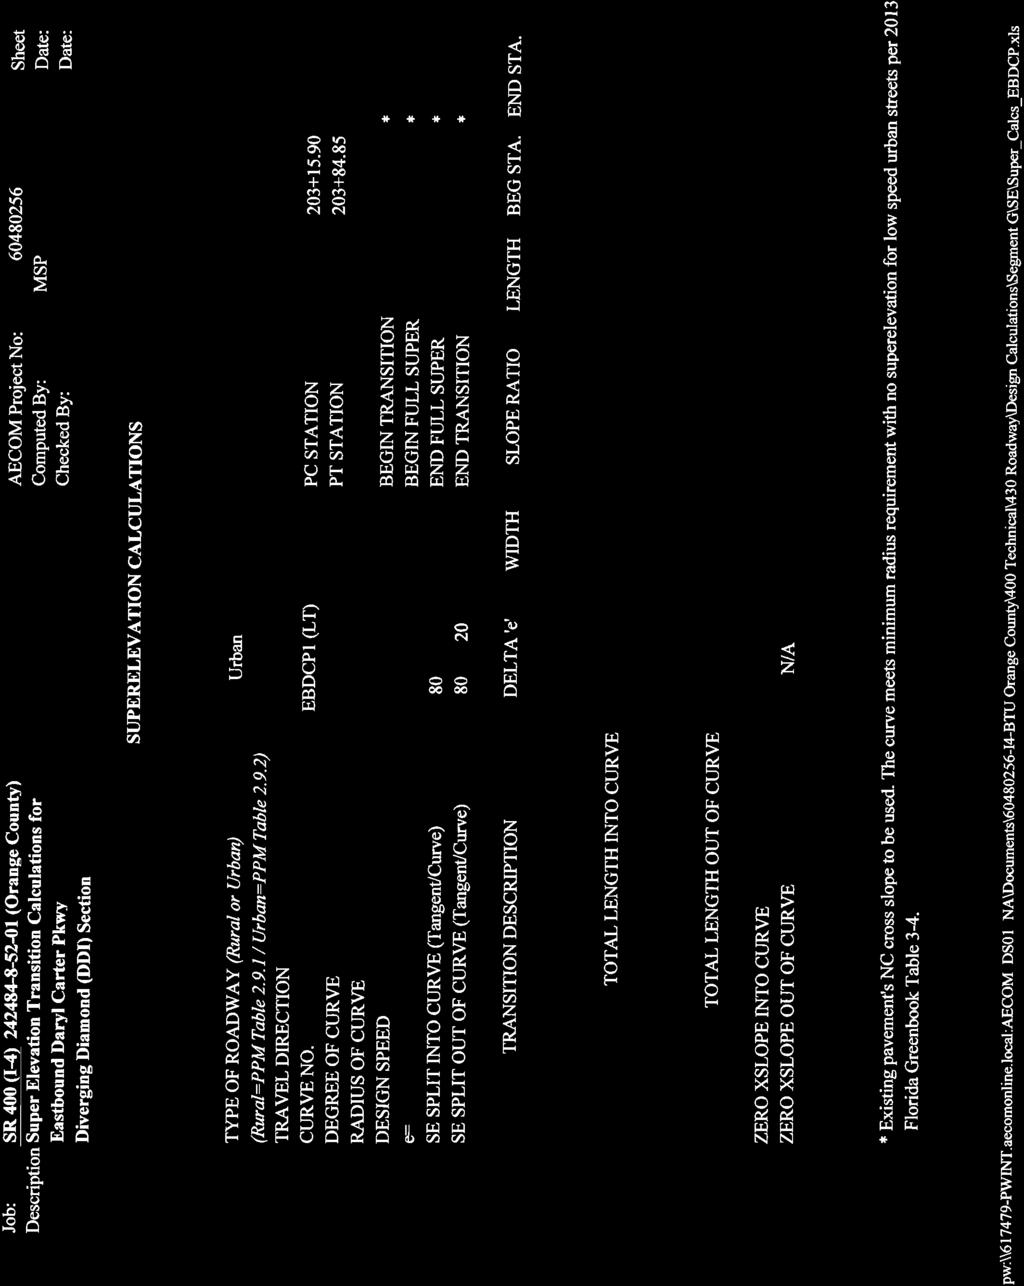
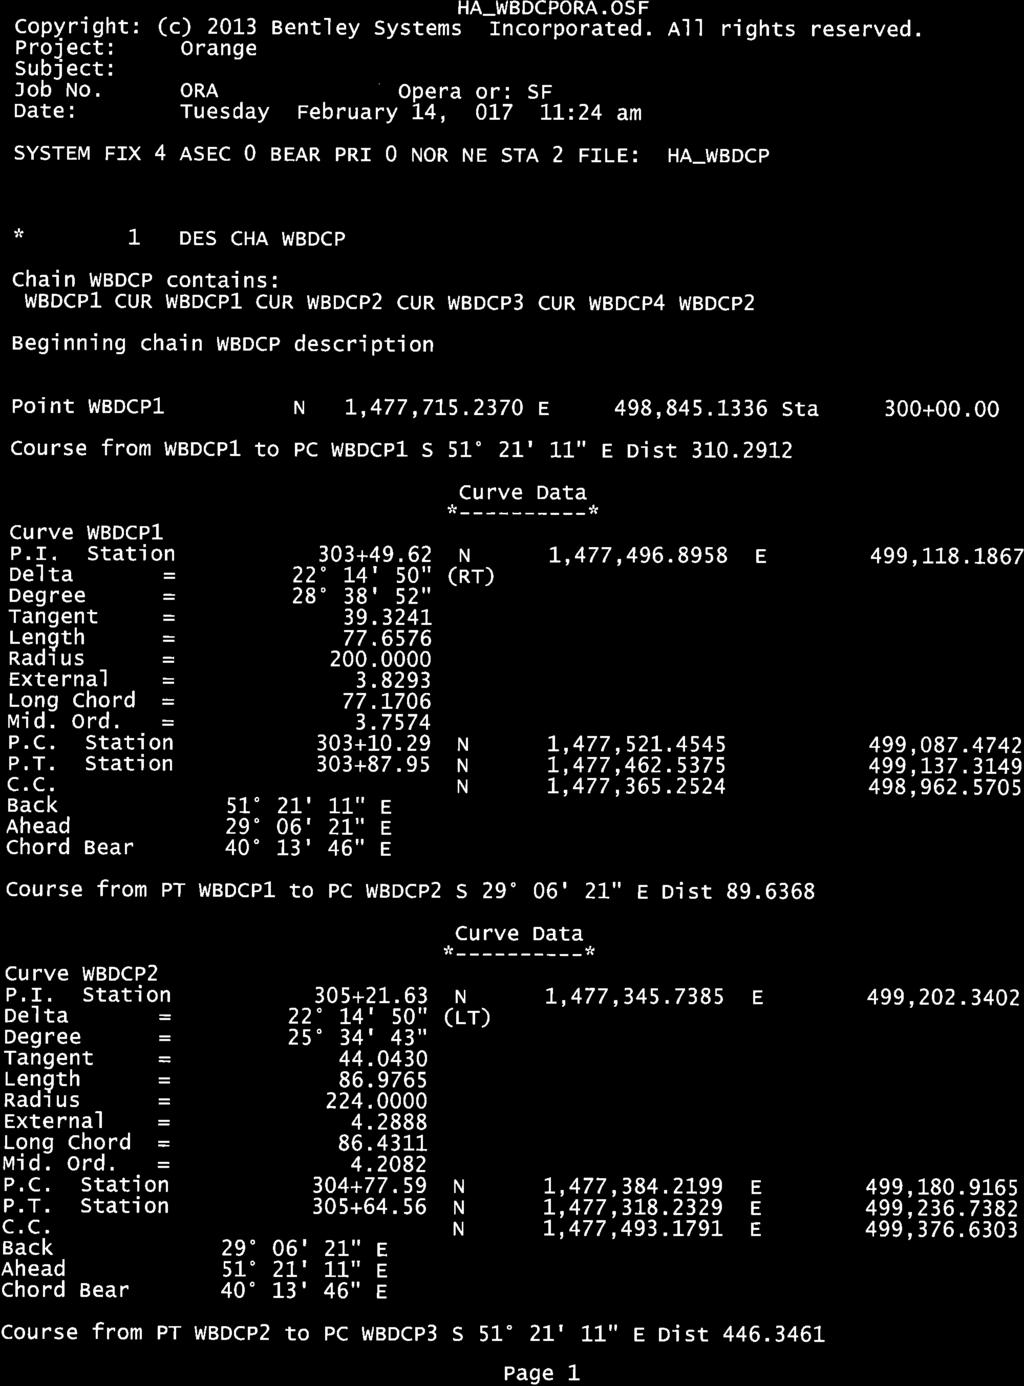
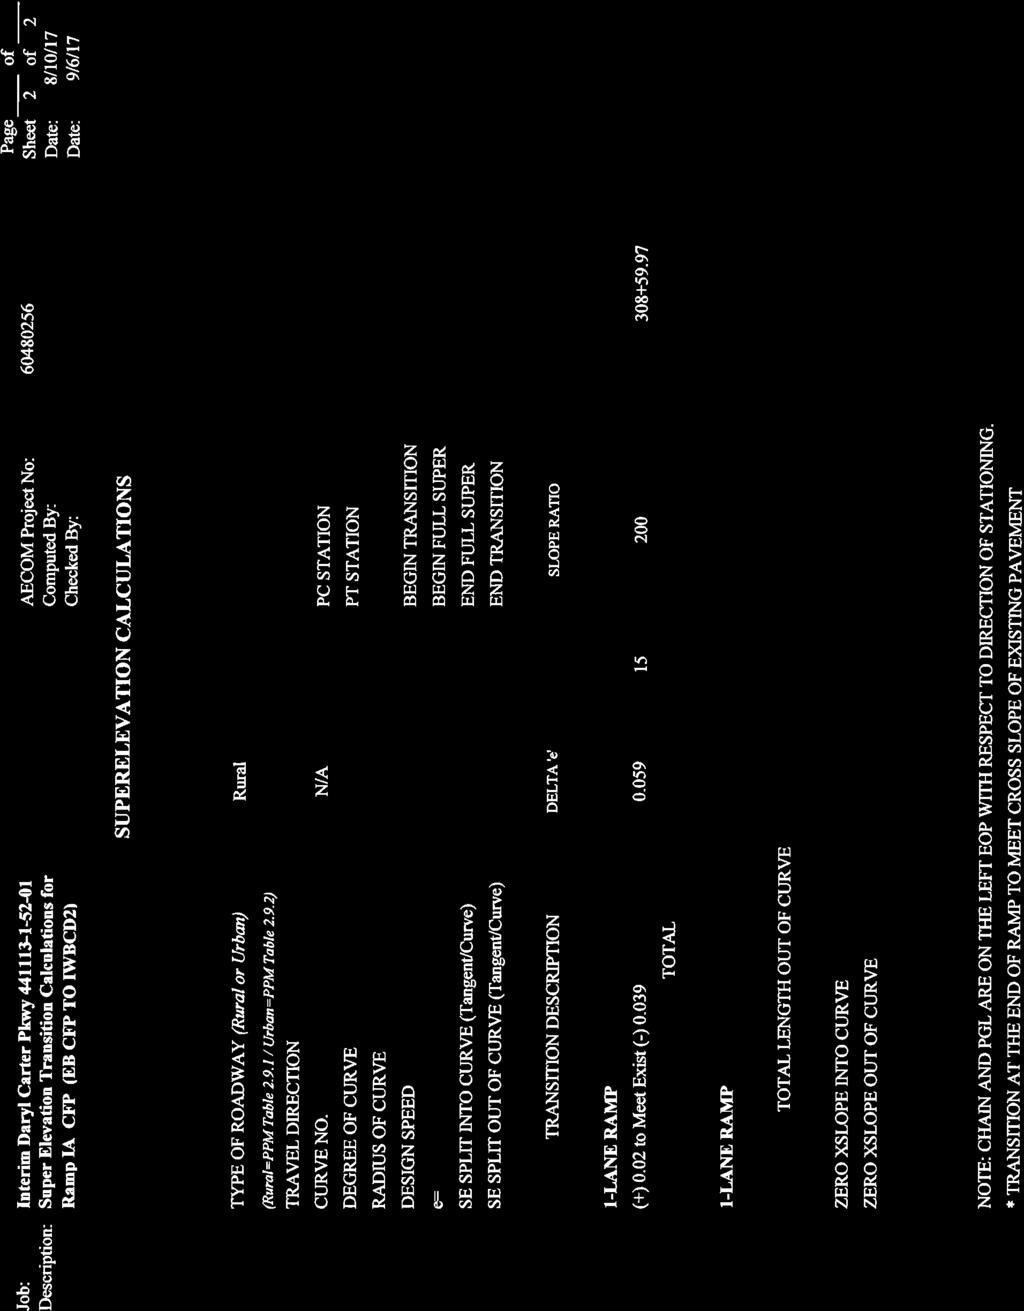
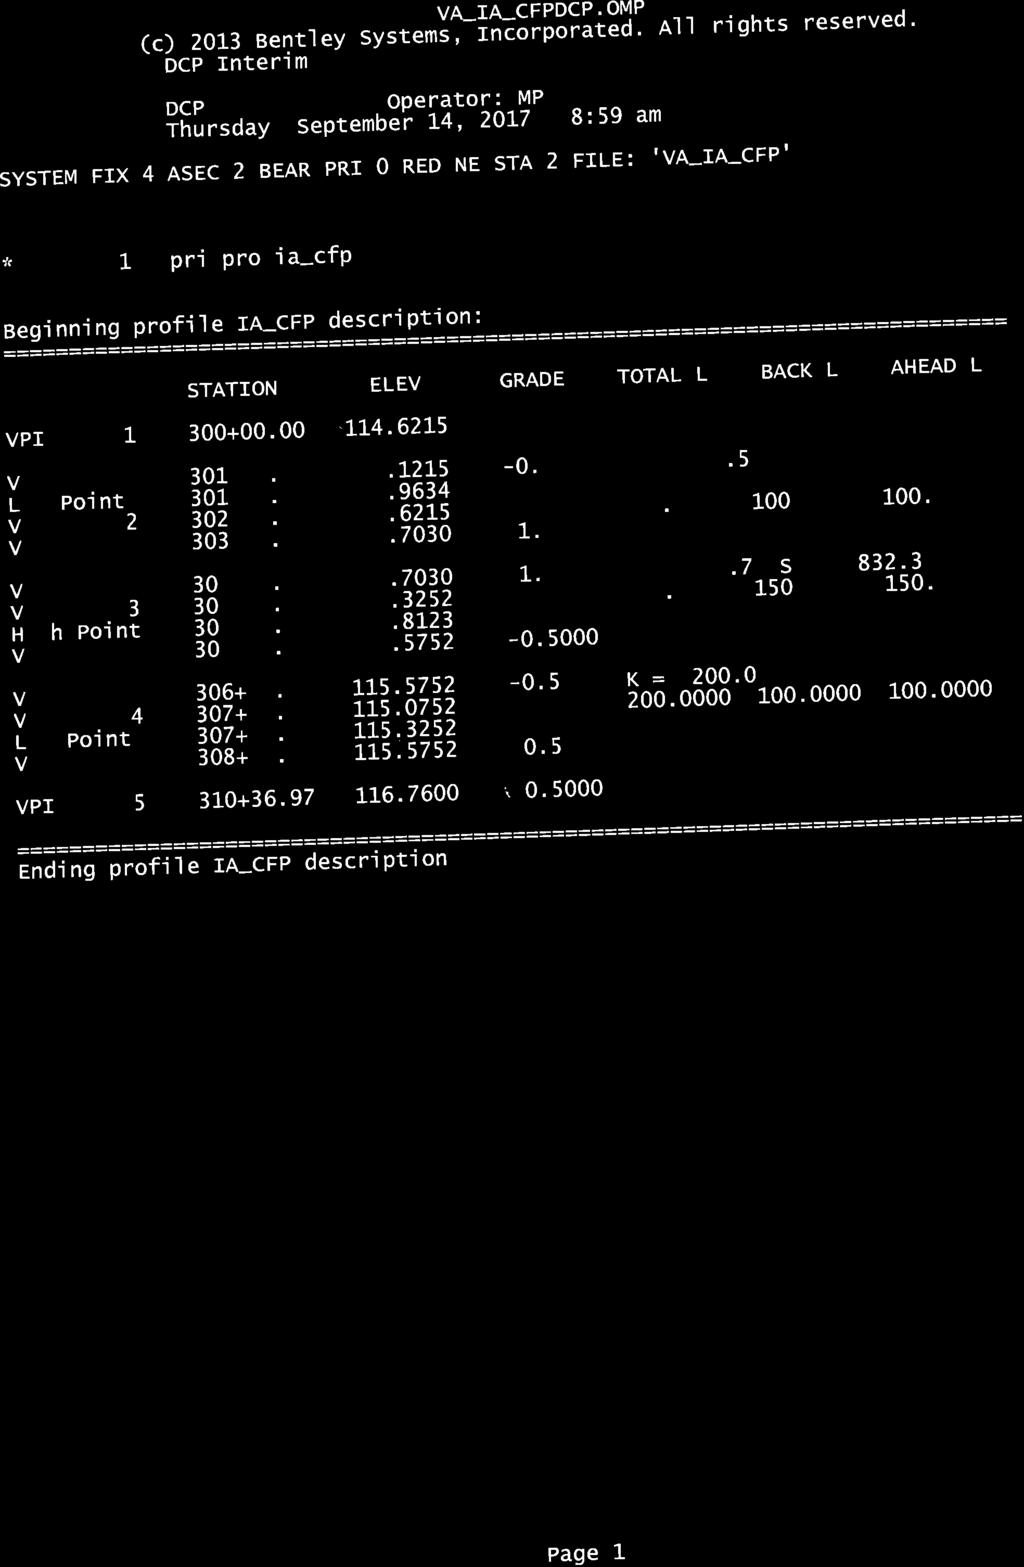
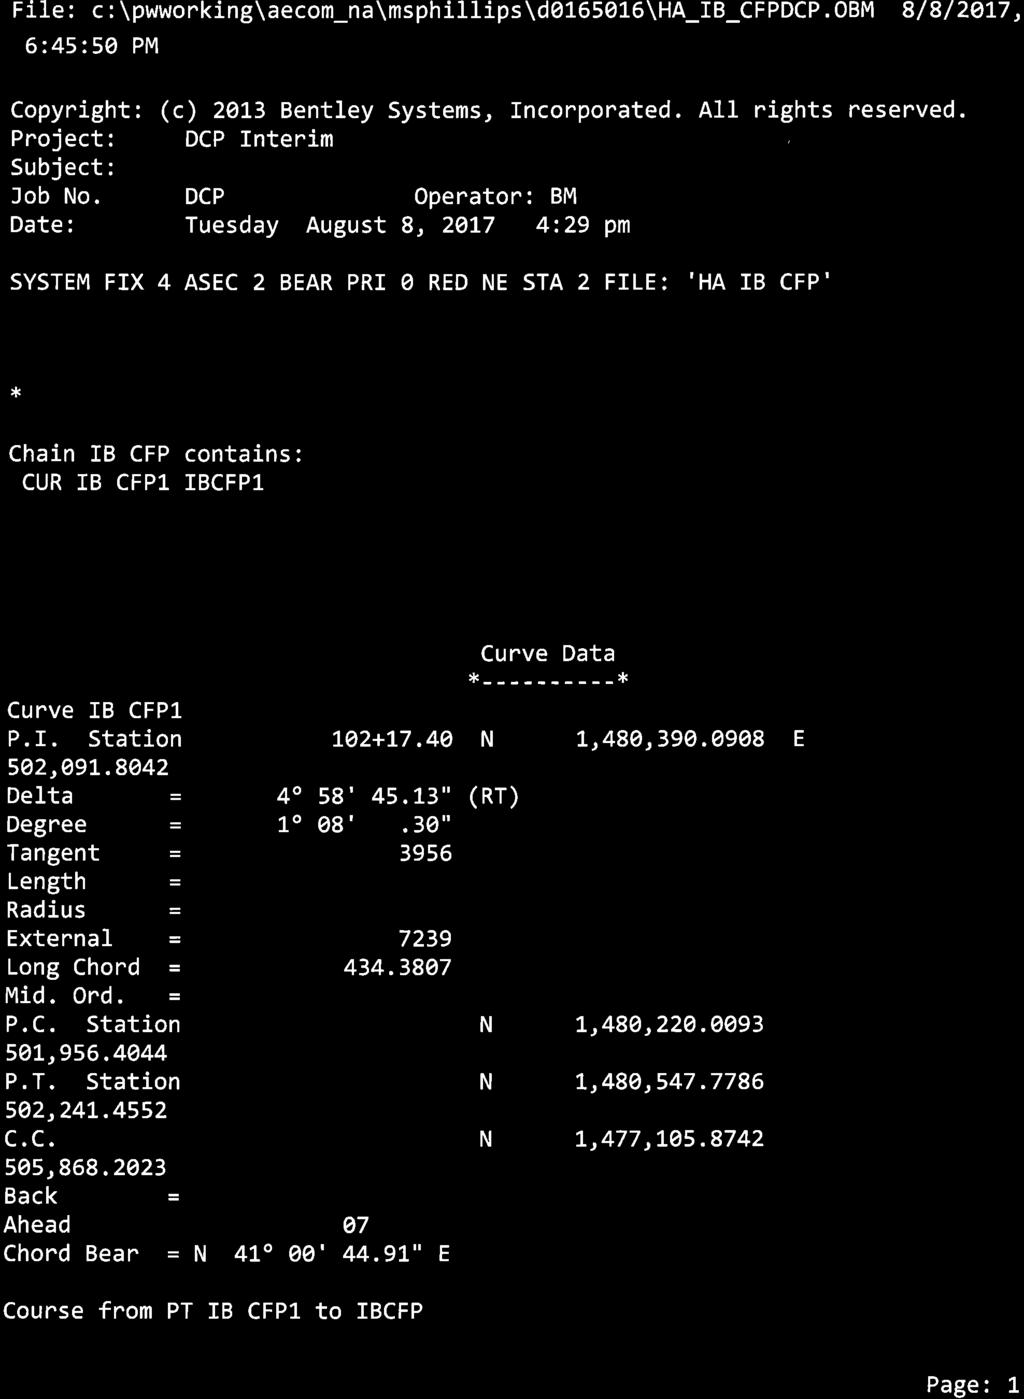
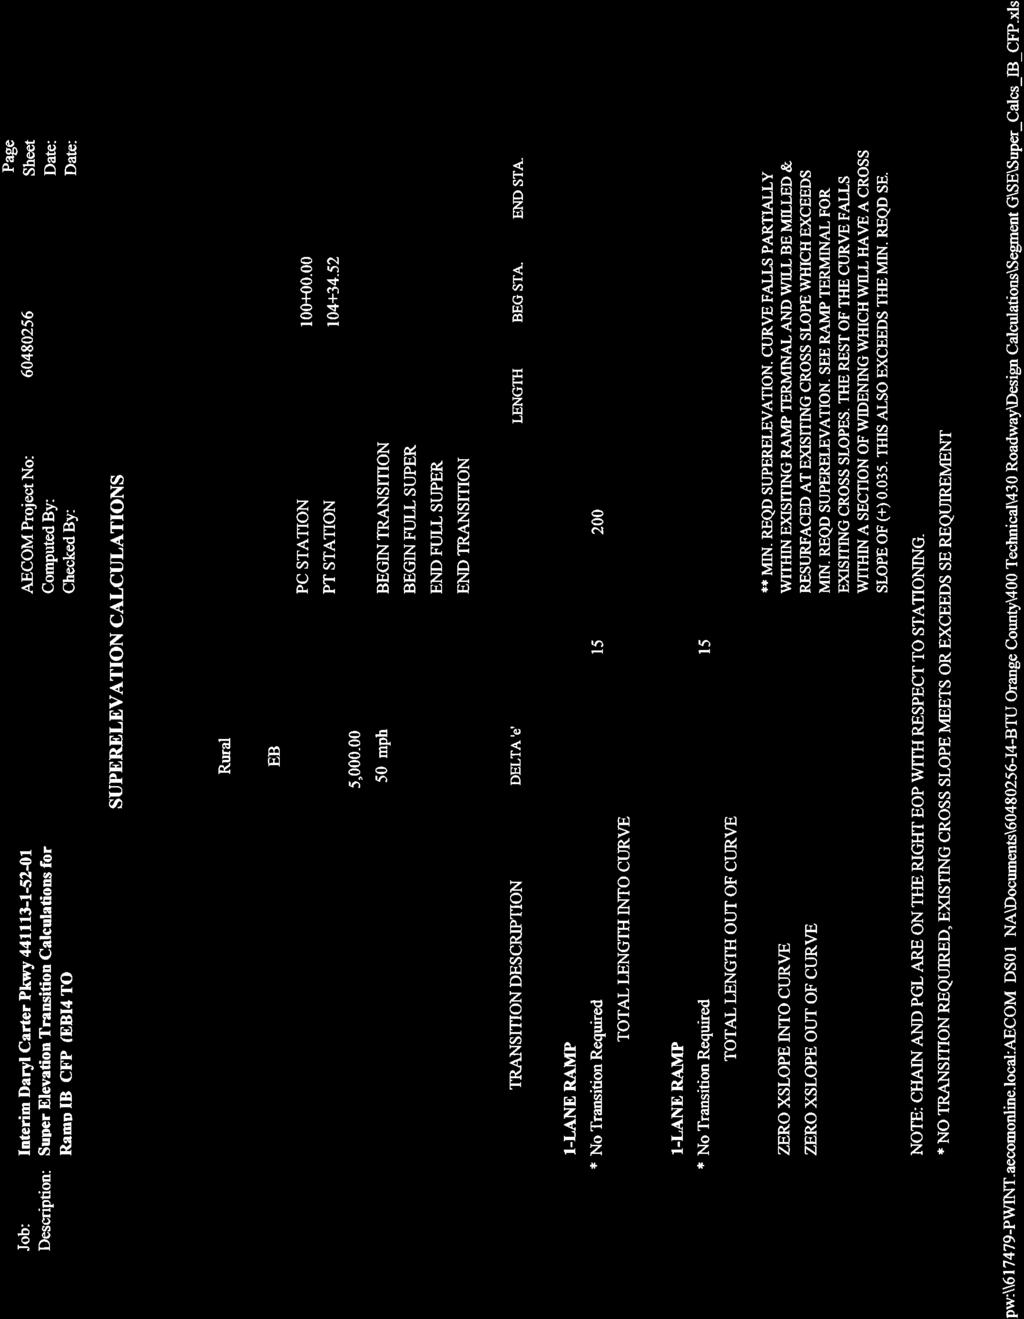
3 Interim Interchange at SR 400 (I-4) and Daryl Carter Parkway FPID: PRELIMINARY: NOT FOR CONSTRUCTION SECTION SUBSECTION HORIZONTAL ALIGNMENT WBDCP STOPPING SIGHT DISTANCE WBDCP SUPERELEVATION - WBDCP RAMP IB_DCP (EB I-4 TO DCP) HORIZONTAL ALIGNMENT STOPPING SIGHT DISTANCE SUPERELEVATION VERTICAL ALIGNMENT RAMP TERMINAL DETAILS (IB_DCP & EB I-4) RAMP IC_DCP (DCP TO EB I-4) HORIZONTAL ALIGNMENT STOPPING SIGHT DISTANCE SUPERELEVATION VERTICAL ALIGNMENT RAMP TERMINAL DETAILS (IC_DCP & EB I-4) RAMP D_DCP (IWBCD2 TO DCP) HORIZONTAL ALIGNMENT STOPPING SIGHT DISTANCE SUPERELEVATION VERTICAL ALIGNMENT RAMP TERMINAL DETAILS (D_DCP & IWBCD2) Central Florida Pkwy INTERCHANGE 5.1 RAMP IA_CFP (EB CFP TO WB I-4) HORIZONTAL ALIGNMENT STOPPING SIGHT DISTANCE SUPERELEVATION VERTICAL ALIGNMENT RAMP IB_CFP (EB I-4 TO CFP) HORIZONTAL ALIGNMENT STOPPING SIGHT DISTANCE SUPERELEVATION RAMP TERMINAL DETAILS (IB_CFP & EB I-4) RAMP IC_CFP (WB CFP TO WB I-4 (VIA IWBCD2)) HORIZONTAL ALIGNMENT STOPPING SIGHT DISTANCE SUPERELEVATION VERTICAL ALIGNMENT RAMP TERMINAL DETAILS (IC_CFP & IA_CFP)
4 Interim Interchange at SR 400 (I-4) and Daryl Carter Parkway FPID: PRELIMINARY: NOT FOR CONSTRUCTION SECTION SUBSECTION 6. Temporary Traffic Control Plan (TTCP) 6.1 DIVERSION 1 HORIZONTAL ALIGNMENT STOPPING SIGHT DISTANCE SUPERELEVATION VERTICAL ALIGNMENT VERTICAL CLEARANCE RAMP TERMINAL DETAILS (DIVERSION 1 & WB I-4)
5 SR 400/Interstate 4 (I-4) FPID Interim Daryl Carter Parkway Interchange Roadway Design Criteria SHS facilities Date: 5/18/18 Design Element Design Standard Sources/Notes Design Year 2040 Per Design Traffic Report in Project Scope Roadway Classification SR 400 (I-4) SR 535 Side Streets Interchange Type SR 400 (I-4)/US 27 SR 400 (I-4)/Daryl Center Pkwy. Urban Interstate, Strategic Intermodal System Urban Minor Arterial See separate document Service Interchange Service Interchange Per FDOT classification Per Typical Section Package (TSP) 2011 AASHTO, Page Design Vehicle WB-62FL 2018 FDM, Section Design Speed Mainline/Express Lanes CD Road Flyover/Diamond Ramps Loop Ramps SR mph 60 mph 50 mph 30 mph 45 mph 2018 FDM, AASHTO, Pages Per TSP Per TSP Per TSP HORIZONTAL ALIGNMENT Maximum Curvature (Degree of Curve) Mainline/Express Lanes - (70 mph) CD Roads (60 mph) Flyover/Diamond Ramps - (50 mph) Loop Ramps (30 mph) Urban Arterials (45 mph) FDM, Table Maximum Deflection without Horizontal Curve Mainline/Express Lanes CD Road Flyover/Diamond Ramps Loop Ramps Arterials w/curb & gutter ( 45 mph) Minimum Length of Horizontal Curve Mainline/Express Lanes CD Roads Ramps Arterials Desirable 30V 15V 15V 15V Minimum 15V 400 ft. 400 ft. 400 ft FDM, Section FDM, Table Minimum Stopping Sight Distance Mainline/Express Lanes CD Road Flyover/Diamond Ramps Loop Ramps Arterial DS=45 mph 820 ft. 570 ft. 425 ft. 200 ft. 360 ft FDM, Table , Table (adjustment for grades will be required) Decision Sight Distance Mainline/Express Lanes CD Road Flyover/Diamond Ramps Loop Ramps Arterial DS=45 mph 1,445 ft. 1,280 ft. 910 ft. 490 ft. 800 ft AASHTO, Table 3-3, Page 3-7 C:\pwworking\aecom_na\msphillips\d \I4BTU_Roadway Design Criteria_Interim DCP.docx Page 1 of 6
6 SR 400/Interstate 4 (I-4) FPID Interim Daryl Carter Parkway Interchange Roadway Design Criteria SHS facilities Date: 5/18/18 Design Element Design Standard Sources/Notes Lane Drop Taper Mainline/Express Lanes CD Road Arterial, DS 45 mph Add Lane Taper Freeway Auxiliary Lanes Tangent Curve Arterial, DS 45 mph Minimum Spacing Ramp Terminals Entrance to Exit (Weaving): System to Service Service to Service Exit to Entrance Entrance to Entrance Exit to Exit Turning Roadways: System Interchange Service Interchange Entrance and Exit Ramp Design Flyover/Diamond Ramps Entrance Exit Loop Ramps Entrance Exit Entrance Acceleration Lengths 50 mph to 70 mph 30 mph to 70 mph All Speeds Tapers Exit Deceleration Lengths 70 mph to 50 mph 70 mph to 30 mph Freeway 70:1 Des, 50:1 Min 50:1 Min L=WS 300 ft. 100 ft. L=WS CD Road 2000 ft ft ft ft. 500 ft. 400 ft ft. 800 ft ft. 800 ft. 800 ft. 600 ft. Taper Design with 50:1 (1200 ft.) Taper Design with 3 to 5 Parallel Design: 1,200 accel ft. Taper 800 decel ft. Taper 580 ft. +Taper (Single Lane)* 1350 ft. +Taper (Single Lane)* (Two Lane Entrance) - First lane drop, treat as single lane entrance with single lane taper. Second lane drop has an auxiliary lane taper and a tangent length that makes the total two-lane entrance length 2500 ft. min. (including a 300 ft. taper). Single Lane (Taper Design) 50:1 min Single Lane (Parallel Design) ft. min 340 ft. +Taper (Single Lane)* 520 ft. +Taper (Single Lane)* 2011 AASHTO, Page FDM, Section AASHTO, Figure (B1 & B2), Pages and FDM, Section AASHTO, Figure 10-68, Page /2019 FDOT Design Standard Index No. 525 Per Preliminary Engineering Report Per Preliminary Engineering Report 2011 AASHTO, Figure & Table 10-3, Pages and /2019 FDOT Design Standard Index No. 525 *All acceleration lengths will be adjusted according to grade per 2011 AASHTO Table 10-4, Page AASHTO, Figure 10-53, Page AASHTO, Figure 10-69, Page AASHTO, Figure & Table 10-5, Pages & All Speeds Tapers (Two Lane Exit) ft. min. (Includes 300 ft. Taper) Tapered Design, Single Lane: 2-5 Parallel Design, Single Lane: 250 ft. Min (15:1 to 25:1) 2018/2019 FDOT Design Standard Index No. 525 *All deceleration lengths will be adjusted according to grade per 2011 AASHTO Table 10-4, Page AASHTO, Figure 10-53, Page AASHTO, Page , Page C:\pwworking\aecom_na\msphillips\d \I4BTU_Roadway Design Criteria_Interim DCP.docx Page 2 of 6
7 SR 400/Interstate 4 (I-4) FPID Interim Daryl Carter Parkway Interchange Roadway Design Criteria SHS facilities Date: 5/18/18 Design Element Design Standard Sources/Notes Limited Access R/W at Interchanges Rural Urban Crossroad Overpass/No Interchange VERTICAL ALIGNMENT Maximum Profile Grade Mainline/Express Lanes/CD Roads Flyover/Diamond Ramps Loop Ramps Urban Arterials, DS=45 mph Maximum Change in Grade w/o Vertical Curve Mainline/Express Lanes CD Roads Flyover/Diamond Ramps 300 ft. min. beyond end of Accel./Decel. taper 100 ft. min. beyond end of taper or radius point of return 200 ft. from mainline R/W line along crossroad 3% 5% 7% 6% 0.2% 0.4% 0.6% 2018 FDM, Section FDM, Table FDM, Table Loop Ramps Urban Arterials, DS=45 mph 1.0% 0.7% Minimum Grade (shoulder gutter, barrier wall) Minimum Distance Between VPI s Minimum Grade 250 ft. 0.3% 2018 FDM, Section Crest Vertical Curve Mainline (Open Highway) Mainline (Within interchange) CD Roads Flyover/Diamond Ramps Loop Ramps Urban Arterials, DS=45 mph Sag Vertical Curve Mainline CD Roads Flyover/Diamond Ramps Loop Ramps Urban Arterials, DS=45 mph Minimum Vertical Clearance Bridges over I-4 I-4 Bridges over Cross Roads Pedestrian Facilities over Roadway Overhead Signs & Signals Roadway over Railroad Overhead DMS Structures Roadway Base Clearance Above Base Clearance Water Elevation Mainline/CD Roads Ramps (Proper) Low Point on Ramp at Cross Roads All other facilities (urban) CROSS SECTION K=506, Min Length=1000 ft. K=506, Min Length=1800 ft. K=245, Min Length=400 ft. K=136, Min Length=300 ft. K=31, Min Length=90 ft. K=98, Min Length=135 ft. K=206, Min Length=800 ft. K=136, Min Length=300 ft. K=96, Min Length=200 ft. K=37, Min Length=90 ft. K=79, Min Length=135 ft ft ft ft ft ft.* 19.5 ft. 3 ft. 2 ft.* 1 ft.* 1 ft.* 2018 FDM, Table , Table FDM, Table , Table FDM, Table *For new structures. Does not apply to existing structures to remain FDM, Section *Clearance requires reduction in the design resilient modulus. Notify Pavement Design Engineer that clearance is less than 3 ft. See Flexible Pavement Design Manual. C:\pwworking\aecom_na\msphillips\d \I4BTU_Roadway Design Criteria_Interim DCP.docx Page 3 of 6
8 SR 400/Interstate 4 (I-4) FPID Interim Daryl Carter Parkway Interchange Roadway Design Criteria SHS facilities Date: 5/18/18 Design Element Design Standard Sources/Notes Lane Widths Mainline/Express Lanes CD Roads 1-Lane Ramp 2-Lane Ramp Urban Arterial Median Width (Minimum) FREEWAYS Without Barrier Interstate Other Freeways (> 60 mph) Other Freeways (< 60 mph) With Barrier I-4 Mainline (Orange & Osceola Cos.) All other ARTERIAL AND COLLECTORS DS < 45 mph DS > 45 mph Shoulder Width, Roadway, Inside (or Left) Freeways Mainline (Barrier-Separated, Osceola & Orange Cos.) CD, 2-Lane CD, 3-Lane 1-Lane Ramp 2-Lane Ramp 3-Lane Ramp Arterials 4-Lane 3-Lane 2-Lane Shoulder Width, Roadway, Outside (or Right) Freeways Mainline Mainline (Barrier-Separated) CD, 3-Lane 1-Lane Ramp 2-Lane Ramp 3-Lane Ramp Arterials 4-Lane 3-Lane 2-Lane Shoulder Width on Bridge Structures Freeways and Divided Arterials (DS 50 mph) Mainline CD Roads (2-Lane) 1-Lane Ramp 2-Lane Ramp 3-Lane Ramp Divided Arterials and Collectors Flush shoulders on approach roadway with 3 or more lanes 12 ft. - Tangent 12 ft. - Tangent 15 ft. - Tangent 24 ft. - Tangent 11 ft. travel lane/7 ft. bicycle lane 64 ft. 60 ft. 40 ft. 52 ft. 26 ft. 22 ft. 40 ft. Total Paved 10 ft. 10 ft. 8 ft. 4 ft. 12 ft. 10 ft. 6 ft. 2 ft. 8 ft. 4 ft. 12 ft. 10 ft. 12 ft. 4 ft. 12 ft. 0 ft. 8 ft. 0 ft. Total Paved 12 ft. 10 ft. 12 ft. 12 ft. 12 ft. 10 ft. 6 ft. 4 ft. 12 ft. 10 ft. 12 ft. 10 ft. 12 ft. 5 ft. 12 ft. 5 ft. 12 ft. 5 ft. Inside Outside 10 ft. 10 ft. 6 ft. 10 ft. 6 ft. 6 ft. 6 ft. 10 ft. 10 ft. 10 ft. 10 ft. 10 ft FDM, Tables FDM, Table Per TSP and Preliminary Engineering Report. To provide 44 ft. rail corridor FDM, Table FDM, Table Per TSP 2018 FDM, Table FDM, Table FDM, Table FDM, Table FDM, Table FDM, Table FDM, Table FDM, Table FDM, Table FDM, Table FDM, Table FDM, Table FDM, Table Per TSP 2018 FDM, Table FDM, Table FDM, Table FDM, Figure C:\pwworking\aecom_na\msphillips\d \I4BTU_Roadway Design Criteria_Interim DCP.docx Page 4 of 6
9 SR 400/Interstate 4 (I-4) FPID Interim Daryl Carter Parkway Interchange Roadway Design Criteria SHS facilities Date: 5/18/18 Design Element Design Standard Sources/Notes Cross Slope Roadway 2-Lanes in Same Direction Roadway Additional Lane (Same Direction) Inside Shoulder Mainline (Barrier-Separated) Outside Shoulder Express Lanes (Barrier-Separated) (0.06 for 4 or more lanes) Same as travel lane 0.06 Same as travel lane 2018 FDM, Fig Per TSP Per TSP Max Lane Roll-Over Between Thru Lanes Maximum Shoulder Roll-Over Recoverable Terrain/Clear Zone Widths (min. from edge of travel way) Mainline/Express Lanes CD Roads Auxiliary Lane (>55mph) One-Lane Ramp (50mph) Multi-Lane Ramp (50mph) One-Lane Ramp (<45mph) Multi-Lane Ramp (<45mph) Urban Arterials, DS=45 mph 4% 2018 FDM, Figure % 36 ft. 36 ft. 24 ft. 14 ft. 24 ft. 10 ft. 18 ft. 24 ft. 2018/2019 FDOT Design Standard Index No FDM, Table Lateral Offset Criteria Urban Curb & Gutter, DS 45 mph Bridge Piers and Abutments High Mast Lighting Overhead Sign Supports Other Border Width Freeway & Ramps Urban Arterials Flush Shoulders DS > 45 mph DS 45 mph Curb & Gutter DS = 45 mph DS 40 mph Roadside Slopes Rural & Urban Freeways, Rural Arterials & Collectors, with projected 20 year AADT of 1500 or greater. Design Speed > 45 MPH The greater of the following: 16 ft. from edge of travel lane; or outside curb: 4 ft. from face of curb Median: 6 ft. from edge of traffic lane Outside Clear Zone Outside Clear Zone 4 ft. from face of curb 94 ft. from edge of travel lane* 15 min. *Width may be reduced in area of crossroad terminal as long as the design meets the requirements for clear zone, lateral offsets, drainage, maintenance access, etc. 40 ft. (from shoulder point) 33 ft. (from shoulder point) 14 ft. (from lip of gutter), 12 ft. w/bicycle or aux. lane 12 ft. (from lip of gutter), 10 ft. w/bicycle or aux. lane Fill Height Front slope 0 5 ft. 1: ft. 1:6 to CZ then 1: ft. 1:6 to CZ then 1:3 >20 ft. 1:2 w/guardrail Back Slope (All Fill Heights) 1:4 or 1:3 w/trapezoidal Ditch & 1:6 Front Slope 2018 FDM, Table FDM, Section Per TSP. Design Variation Required FDM, Table FDM, Table FDM, Table CZ= Clear Zone C:\pwworking\aecom_na\msphillips\d \I4BTU_Roadway Design Criteria_Interim DCP.docx Page 5 of 6

10 SR 400/Interstate 4 (I-4) FPID Interim Daryl Carter Parkway Interchange Roadway Design Criteria SHS facilities Date: 5/18/18 Design Element Design Standard Sources/Notes Urban Arterials and Collectors with Curb & Gutter, Design Speed 45 MPH Superelevation Transition Distribution Tangent* Curve * Superelevation Rates Mainline CD Roads Express Lanes Directional Ramps (50 mph) Loop Ramps (30 mph) Shoulders Urban Arterials Transverse Slope (All Fill Heights) 1:10 or flatter (Freeways) 1:4 (Other) Front and Back Slopes (All Fill Heights) 1:2 or to suit property owner. Not flatter than 1:6 Transverse Slopes (All Fill Heights) 1:4 Standard Min Max 80% 50% 20% 50% e Max Transition/Min L 0.10 ft. /ft. 1:200/100 ft ft. /ft. 1:225/100 ft ft. /ft. 1:250/100 ft ft. /ft. 1:200/100 ft ft. /ft. 1:150/50 ft ft. /ft. *1:150/100 ft ft. /ft. 1:150/75 ft FDM, Section 2.9 * Superelevation transitions shall have; 1) a minimum longitudinal slope of 0.5 % or 2) a minimum outside EOP grade of 0.2% (0.5% for curb & gutter), where the cross slope is less than 1.5 % FDM, Tables , , /2019 FDOT Design Standard Index Nos.510, 511 *This rate should be applied only where non- FDOT standard shoulder breaks are necessary. Transition example locations: bridges, high side retaining walls, special drainage locations. C:\pwworking\aecom_na\msphillips\d \I4BTU_Roadway Design Criteria_Interim DCP.docx Page 6 of 6
11 SR 400/Interstate 4 (I-4) FPID Interim Daryl Carter Parkway Interchange Roadway Design Criteria Non SHS facilities Date: 5/18/18 Design Element Design Standard Sources/Notes Design Year 2040 Per Design Traffic Report in Project Scope Governing Standards Orange County Florida Greenbook (2013) Per Orange County Roadway Classification Orange County Daryl Carter Pkwy. Urban Major Collector Per Orange County Design Speed Daryl Carter Pkwy. 40 mph Per Preliminary Engineering Report HORIZONTAL ALIGNMENT Maximum Curvature (Degree of Curve) Rural (40-55 mph), emax = 0.10 Urban - High-Speed Highways and Streets (30-45 mph), emax = 0.05 Urban - Low Speed Streets (20-30 mph) emax = 0.05 emax = 0.02 Maximum Deflection without Horizontal Curve Arterials and Collectors (w/o curb & gutter) Arterials and Collectors (w/curb & gutter) (V 45 mph), 2 00 (V 40 mph) 1 00 (V 45 mph), 2 00 (V 40 mph) Florida Greenbook (May 2013), Table 3-4, Pg FDM Minimum Length of Horizontal Curve Freeways Arterials and Collectors Desirable 30V 15V Minimum 15V 400 ft AASHTO, Section , Page FDM, Table Minimum Stopping Sight Distance V = mph ft. Florida Greenbook (May 2013), Table 3-3, Pg Maximum Deflection for Through Lanes Through Intersections V = 30 mph V = 35 mph V = 40 mph V = 45 mph Lane Drop Taper FDM, Table C:\pwworking\aecom_na\msphillips\d \I4BTU_Roadway Design Criteria_Interim DCP_Non_SHS.docx Page 1 of 4
12 SR 400/Interstate 4 (I-4) FPID Interim Daryl Carter Parkway Interchange Roadway Design Criteria Non SHS facilities Date: 5/18/18 Design Element Design Standard Sources/Notes V 45 mph V 40 mph L = WS L = WS 2 / FDM, Section Add Lane Taper 50 ft FDM, Section VERTICAL ALIGNMENT Maximum Profile Grade Freeway (50 55 mph) Arterial Urban (30 45 mph) Rural (40 45 mph) Rural (50 55 mph) Collector Urban (30 45 mph) 4% 8% - 6% 5% 4% 9% - 8% Florida Greenbook (May 2013), Table 3-6, Pg Maximum Change in Grade w/o Vertical Curve V = mph 1.0% 0.5% Florida Greenbook (May 2013), Table 3-7, Pg Minimum Grade (curb & gutter, shoulder gutter, barrier wall) 0.3% Florida Greenbook (May 2013), Pg Crest Vertical Curve Minimum Length L = AS 2 /1329 Where: A = Algebraic difference in grades in % S = Sight Distance Sag Vertical Curve Minimum Length Minimum Vertical Clearance Freeways and Major Arterials Other Streets and Highways Ped or Shared Use Bridge over Roadway Bridge over Railroad L = AS 2 /( S) Where: A = Algebraic difference in grades in % S = Sight Distance 16.5 ft. 16 ft. 17 ft ft. Florida Greenbook (May 2013), Figure 3-4, Pg Florida Greenbook (May 2013), Figure 3-6, Pg Florida Greenbook (May 2013), Section C.7.j.4.(b), Pg Per Preliminary Engineering Report Roadway Base Clearance Above Base Clearance Water Elevation Freeways and Rural Multilane Mainline Ramps (proper) Low Point on Ramps at Cross Roads Rural Two-lane with ADT>1500 vpd All Other Facilities Including Urban 3 ft. 2 ft.* 1 ft.* 2 ft.* 1 ft.* CROSS SECTION 2018 FDM, Section *Clearance requires reduction in the design resilient modulus. Notify Pavement Design Engineer that clearance is less than 3 ft. See Flexible Pavement Design Manual. Lane Widths (minimum) Freeways 12 ft. Florida Greenbook (May 2013), Table 3-8, C:\pwworking\aecom_na\msphillips\d \I4BTU_Roadway Design Criteria_Interim DCP_Non_SHS.docx Page 2 of 4
13 SR 400/Interstate 4 (I-4) FPID Interim Daryl Carter Parkway Interchange Roadway Design Criteria Non SHS facilities Date: 5/18/18 Design Element Design Standard Sources/Notes Major and Minor Arterials Major and Minor Collectors Local Roads and Auxiliary Lanes Bike Lanes 11 ft. 11 ft. 10 ft. 4 ft.* Pg Florida Greenbook (May 2013), Section C.10.b, Pg *At least 1 foot additional width is needed when the bicycle lane is adjacent to a curb or other barrier, on-street parking is present, there is substantial truck traffic (>10%), or posted speeds exceed 50 mph. Median Width (minimum) Freeways, V< 60 mph Rural Highways V 55 mph V < 55 mph Urban Streets V > 45 mph V 45 mph Shoulder Width (minimum) 2 lanes in each direction Roadway Bridge 3 or more lanes in each direction Roadway Bridge Cross Slope Roadway 2-Lanes in Same Direction Roadway Additional Lane (Same Direction) Lane Min/Max Outside 10 ft. 10 ft. 10 ft. 10 ft. 40 ft. 40 ft. 22 ft ft ft / / 0.08 Shoulder Min/Max Max Lane Roll-Over Between Thru Lanes 0.04 Maximum Shoulder Roll-Over Max Lane Roll-Over at Turning Roadway Terminals Design Speed of Entrance/Exit Curve < 20 mph 25 and 30 mph 35 mph Median 6 ft. 6 ft. 10 ft. 10 ft. Florida Greenbook (May 2013), Tables 3-11 & 3-12, Pg Florida Greenbook (May 2013), Table 3-10, Pg Florida Greenbook (May 2013), Section C.7.b.2, Section C.7.c.2 Florida Greenbook (May 2013), Section C.7.b.2 Florida Greenbook (May 2013), Section C.7.c.2 Florida Greenbook (May 2013), Table 3-23, Pg Clear Zone (minimum) Rural (measured from edge of travel) Collectors (30 40 mph) Arterials (30 40 mph) Arterials & Collectors (45 50 mph) Arterials & Collectors (55 mph) Arterials & Collectors ( 60 mph) Urban (measured from face of curb)* 10 ft. 14 ft. 18 ft. 24 ft. 30 ft. Florida Greenbook (May 2013), Table 3-13, Pg * Use rural values when no curb & gutter C:\pwworking\aecom_na\msphillips\d \I4BTU_Roadway Design Criteria_Interim DCP_Non_SHS.docx Page 3 of 4

 6 lane (45 60 mph) Urban Highways and High Speed Urban Streets")
 1:100 1:150/(50 75 ft.) Standard 80% 20% Florida Greenbook (May 2013), Section C.4.b and 2018/2019 FDOT Design Standard Index No. 510 2018/2019 FDOT Design Standard Index No.")
14 SR 400/Interstate 4 (I-4) FPID Interim Daryl Carter Parkway Interchange Roadway Design Criteria Non SHS facilities Date: 5/18/18 Design Element Design Standard Sources/Notes Roadside Slopes Fill slopes 25 mph and below mph Cut slopes and ditch backslopes 1.5 ft. 4 ft.** 1:4 or flatter, 1:3 max within clear zone 1:3 max within clear zone, 1:4 desirable **1.5 ft. min where 4 ft. deemed impractical Florida Greenbook (May 2013), Section C.7.f.2 Ditch bottom width Superelevation Rates Rural Highways, Urban Freeways and High Speed Urban Arterials 2 lane & 4 lane (45 60 mph) 6 lane (45 60 mph) Urban Highways and High Speed Urban Streets (30 50 mph) Superelevation Transition Distribution Tangent Curve Emax 0.10 ft/ft 0.10 ft/ft 0.05 ft/ft 4 ft. min. Transition rate/(min L) 1:200 1:225/(100 ft.) 1:160 1:180/(100 ft.) 1:100 1:150/(50 75 ft.) Standard 80% 20% Florida Greenbook (May 2013), Section C.4.b and 2018/2019 FDOT Design Standard Index No /2019 FDOT Design Standard Index No /2019 FDOT Design Standard Index Nos. 510 & 511 C:\pwworking\aecom_na\msphillips\d \I4BTU_Roadway Design Criteria_Interim DCP_Non_SHS.docx Page 4 of 4
15

16
17
18
19
20
21
22
23

24
25
26
27
28
29

30

31
32

33

34
35
36
37
38
39
40

41
42
43

44

45
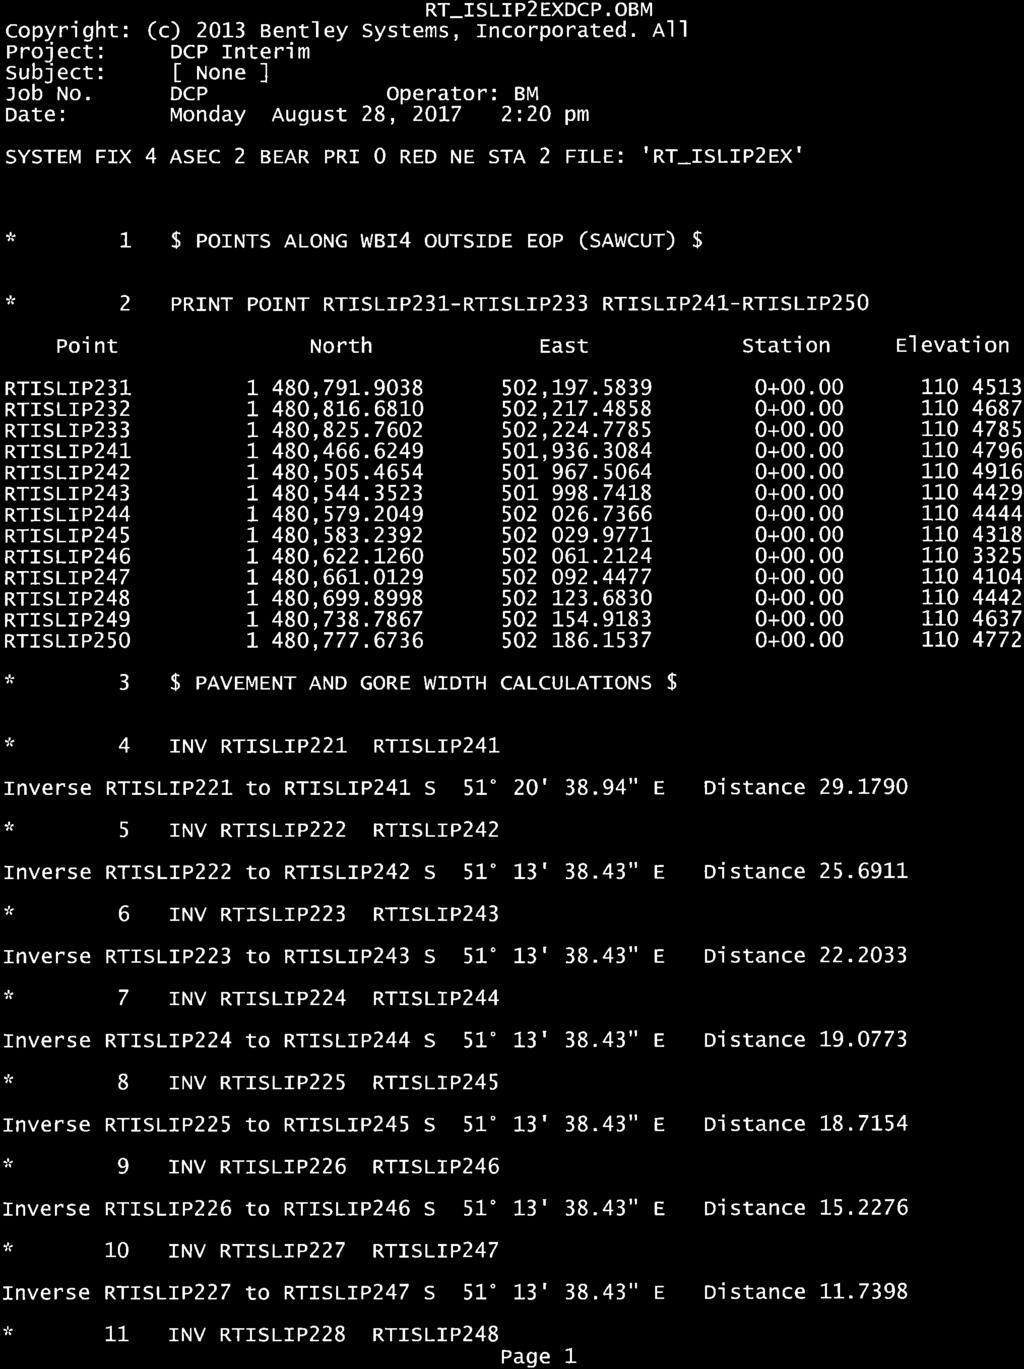
46 RT_ISLIP2EXDCP.OBM Inverse RTISLIP228 to RTISLIP248 S 51 13' 38.43" E Distance * 12 INV RTISLIP229 RTISLIP249 Inverse RTISLIP229 to RTISLIP249 S 51 13' 38.43" E Distance * 13 INV RTISLIP230 RTISLIP250 Inverse RTISLIP230 to RTISLIP250 S 51 13' 38.44" E Distance * 14 $ POINT ALONG RAMP INSIDE EOT $ * 15 LAY OFF CHA ISLIP2 RTISLIP221-RTISLIP232 Point North East Station Offset R RTISLIP221 1,480, , RTISLIP222 1,480, , RTISLIP223 1,480, , RTISLIP224 1,480, , RTISLIP225 1,480, , RTISLIP226 1,480, , RTISLIP227 1,480, , RTISLIP228 1,480, , RTISLIP229 1,480, , RTISLIP230 1,480, , RTISLIP231 1,480, , RTISLIP232 1,480, , Page 2
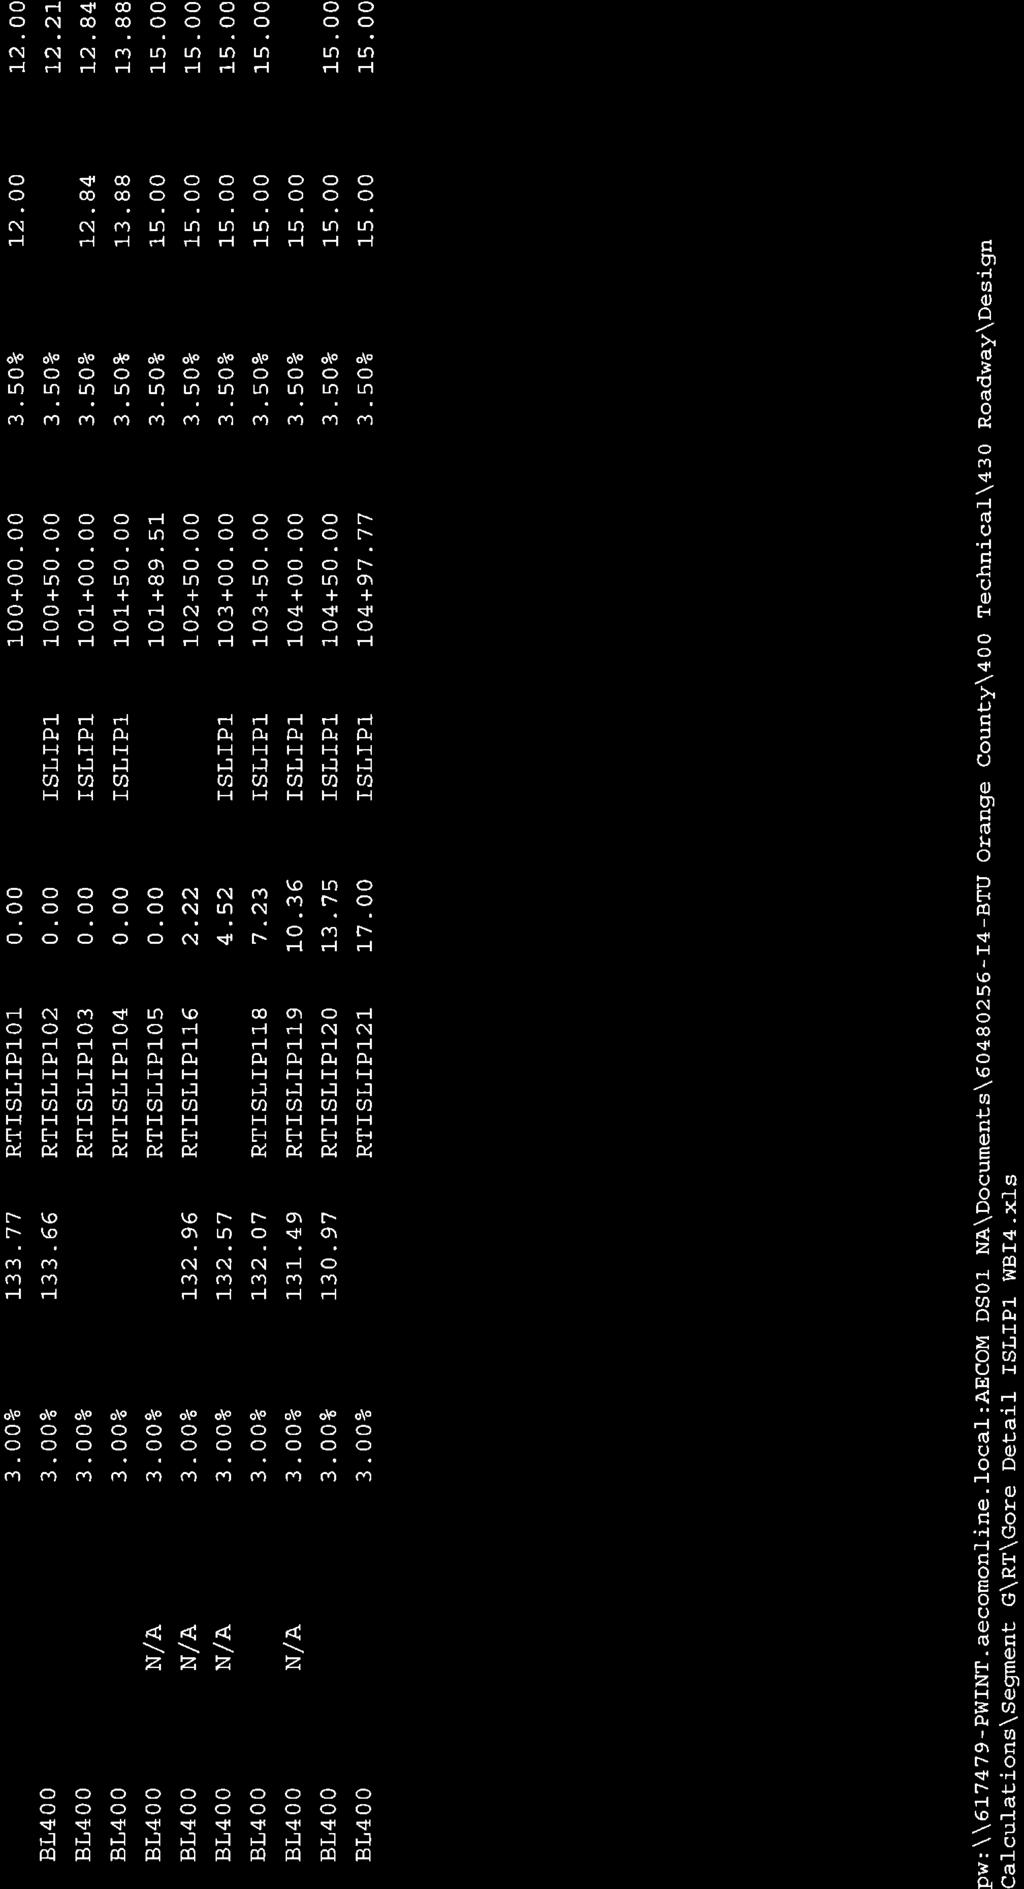
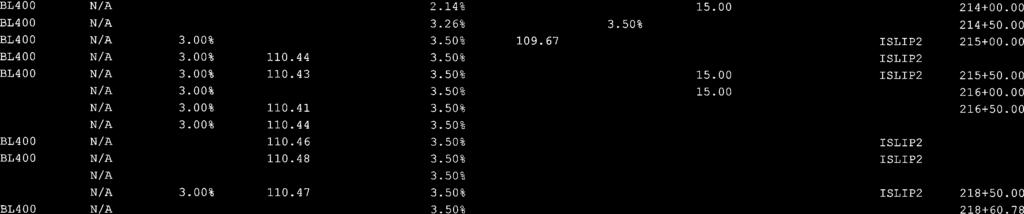
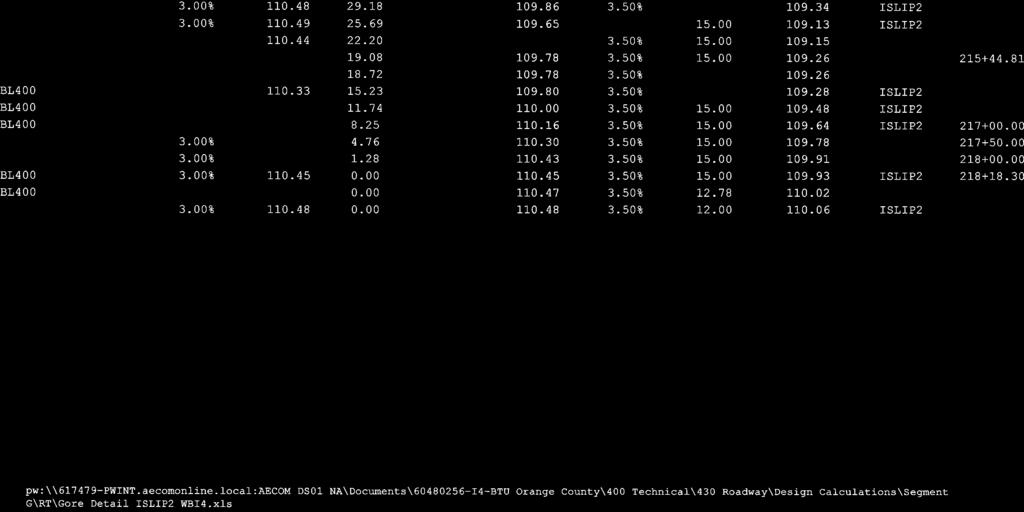
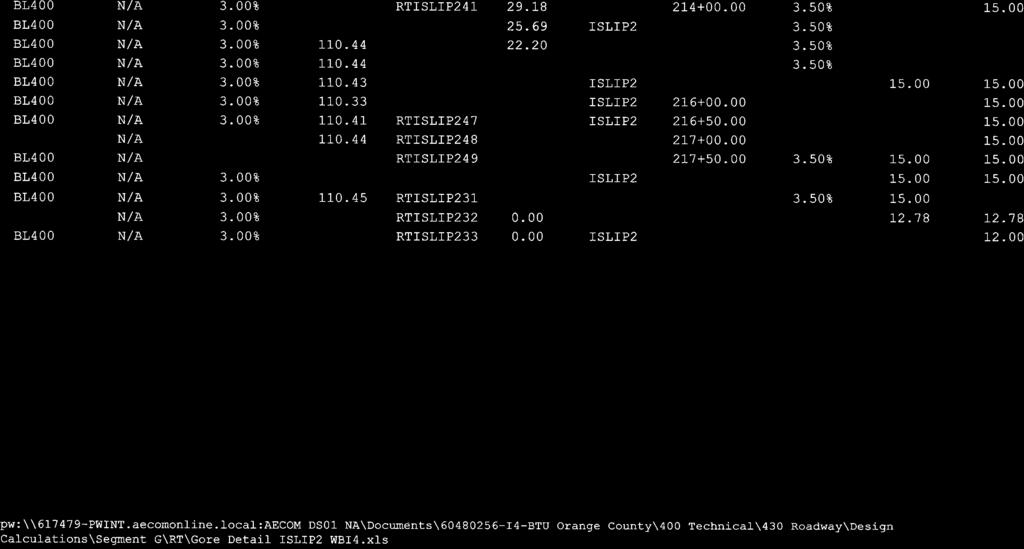
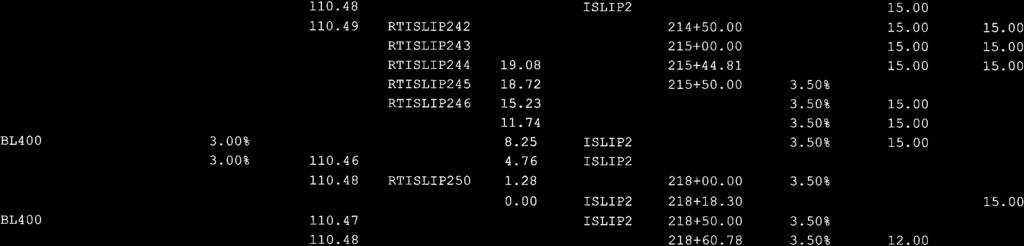
47 Ramp Terminal - Detail Sheet 1 of 4 Job: Interim Daryl Carter Pkwy (Orange County) AECOM Project No: Description: Ramp ISLIP2 and IWBCD2 Computed By: BM Date: 4/25/2018 Checked By: MSP Date: 4/25/2018 Baseline Mainline Station PGL Elev. MAINLINE GORE RAMP *Outside Travel Lane Slope(%) Outside EOT Offset Outside EOT Elev. Gore Width Gore Slope(%) Inside Elev. *Pavement Slope(%) Pavement Width Outside Elev. Baseline Ramp Station IWBCD % N/A % ISLIP IWBCD % N/A % ISLIP IWBCD % N/A % ISLIP IWBCD % N/A % ISLIP IWBCD % N/A % ISLIP IWBCD % N/A % ISLIP IWBCD % N/A % ISLIP IWBCD % N/A % ISLIP IWBCD % N/A % ISLIP IWBCD % N/A % ISLIP IWBCD % N/A % ISLIP IWBCD % % % ISLIP IWBCD % % % ISLIP IWBCD % % % ISLIP IWBCD % % % ISLIP IWBCD % % % ISLIP * The sign convention for the cross slope % is relative to the Mainline PGL. pw:\\ pwint.aecomonline.local:aecom_ds01_na\documents\ i4-btu Orange County\400 Technical\430 Roadway\Design Calculations\Segment G\RT\Gore_Detail_ISLIP2_IWBCD2.xls
48 Ramp Terminal - Data Sheet 2 of 4 Job: Interim Daryl Carter Pkwy (Orange County) AECOM Project No: Description: Ramp ISLIP2 and IWBCD2 Computed By: BM Date: 4/25/2018 Checked By: MSP Date: 4/25/2018 Baseline Mainline Station PGL Elev. PGL Offset Pavement Width 1 *Pavement Slope(%) 1 Pavemen t Width 2 *Pavem ent Slope( %) 2 Paveme nt Width 3 *Paveme nt Slope(% ) 3 Outside Travel Lane Width *Outside Travel Lane Slope(%) Outside EOT Offset Outside EOT Elev. IWBCD % % % % ISLIP % IWBCD % % % % ISLIP % IWBCD % % % % ISLIP % IWBCD % % % % ISLIP % IWBCD % % % % ISLIP % IWBCD % % % % ISLIP % IWBCD % % % % ISLIP % IWBCD % % % % ISLIP % IWBCD % % % % ISLIP % IWBCD % % % % ISLIP % IWBCD % % % % ISLIP % IWBCD % % % % ISLIP % IWBCD % % % % ISLIP % IWBCD % % % % ISLIP % IWBCD % % % % ISLIP % IWBCD % % % % ISLIP % * The sign convention for the cross slope % is relative to the Mainline PGL. COGO Distance Gore Width Baseline Ramp Station *Pavement Slope(%) COGO Width Pavement Width pw:\\ pwint.aecomonline.local:aecom_ds01_na\documents\ i4-btu Orange County\400 Technical\430 Roadway\Design Calculations\Segment G\RT\Gore_Detail_ISLIP2_IWBCD2.xls
49 Ramp Terminal - Graph Input Sheet 3 of 4 Job: Interim Daryl Carter Pkwy (Orange County) AECOM Project No: Description: Ramp ISLIP2 and IWBCD2 Computed By: BM Date: 4/25/2018 Checked By: MSP Date: 4/25/2018 Mainline Rollover MINIMUM ELEVATION FOR RAMP GRADE DESIRABLE ELEVATION FOR RAMP GRADE MAXIMUM ELEVATION FOR RAMP GRADE Gore Slope(%) Ramp Rollover Outside Ramp Elevation Inside Ramp Elevation Ramp Rollover Gore Slope(%) Mainline Rollover Outside Ramp Elevation Inside Ramp Elevation Ramp Rollover Gore Slope(%) Mainline Rollover Outside Ramp Elevation Inside Ramp Elevation 5.00% N/A 0.00% % N/A 0.00% % N/A 0.00% % N/A 0.00% % N/A 0.00% % N/A 0.00% % N/A 0.00% % N/A 0.00% % N/A 0.00% % N/A 0.00% % N/A 0.00% % N/A 0.00% % N/A 0.00% % N/A 0.00% % N/A 0.00% % N/A 0.00% % N/A 0.00% % N/A 0.00% % N/A 0.00% % N/A 0.00% % N/A 0.00% % N/A 0.00% % N/A 0.00% % N/A 0.00% % N/A 0.00% % N/A 0.00% % N/A 0.00% % N/A 0.00% % N/A 0.00% % N/A 0.00% % N/A 0.00% % N/A 0.00% % N/A 0.00% % -3.00% 5.00% % 2.00% 0.00% % 7.00% 5.00% % -3.00% 5.00% % 2.00% 0.00% % 7.00% 5.00% % -3.00% 5.00% % 2.00% 0.00% % 7.00% 5.00% % -3.00% 5.00% % 2.00% 0.00% % 7.00% 5.00% % -3.00% 5.00% % 2.00% 0.00% % 7.00% 5.00% pw:\\ pwint.aecomonline.local:aecom_ds01_na\documents\ i4-btu Orange County\400 Technical\430 Roadway\Design Calculations\Segment G\RT\Gore_Detail_ISLIP2_IWBCD2.xls
50 ELEVATION (FT) RAMP IWBCD2 SHEET 4 OF MAXIMUM ELEVATION FOR RAMP GRADE DESIRABLE ELEVATION FOR RAMP GRADE MINIMUM ELEVATION FOR RAMP GRADE PROPOSED RAMP GRADE RAMP ISLIP2 pw:\\ pwint.aecomonline.local:aecom_ds01_na\documents\ i4-btu Orange County\400 Technical\430 Roadway\Design Calculations\Segment G\RT\Gore_Detail_ISLIP2_IWBCD2.xls
51
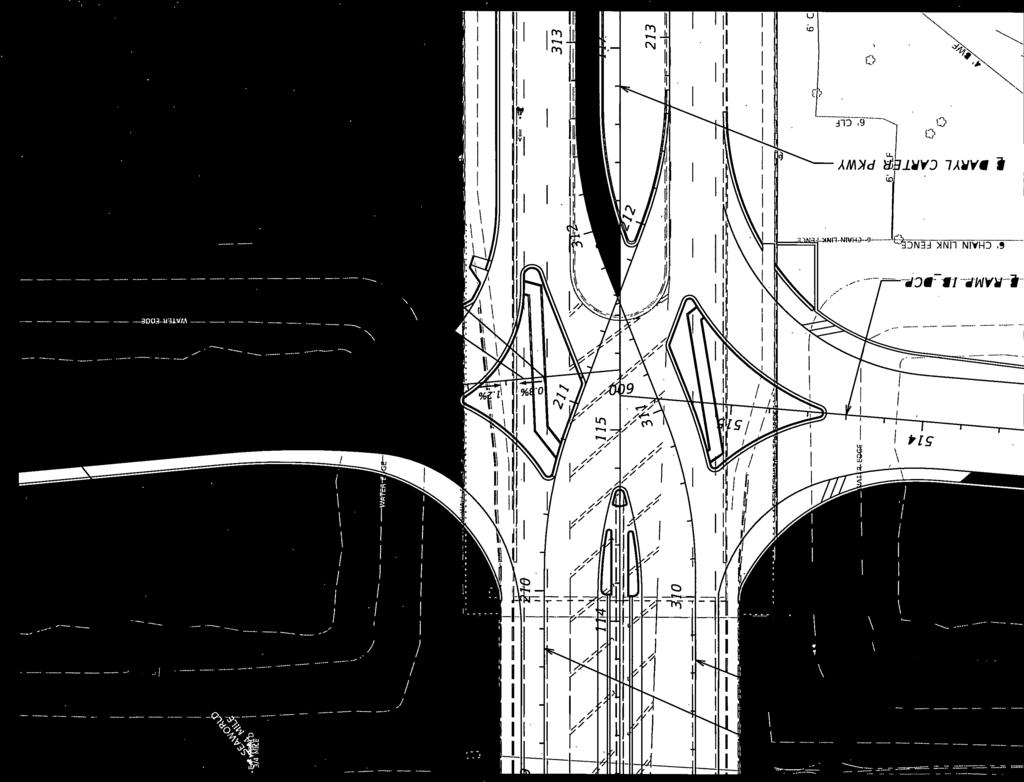
52 N Feet CONST IWBCD2 RTISLIP211 RTISLIP212 RTISLIP ' W OOD RTISLIP208 RTISLIP209 RTISLIP210 6' CLF 6' CLF 6' CLF 6' CLF RTISLIP214 6' CLF RTISLIP215 RTISLIP216 6' CLF ASPH RAMP ISLIP2 MERGE LEFT LANE ENDS SURVEY SR RAMP TERMINAL SKETCH MAINLINE: IWBCD2 RAMP: RAMP ISLIP2
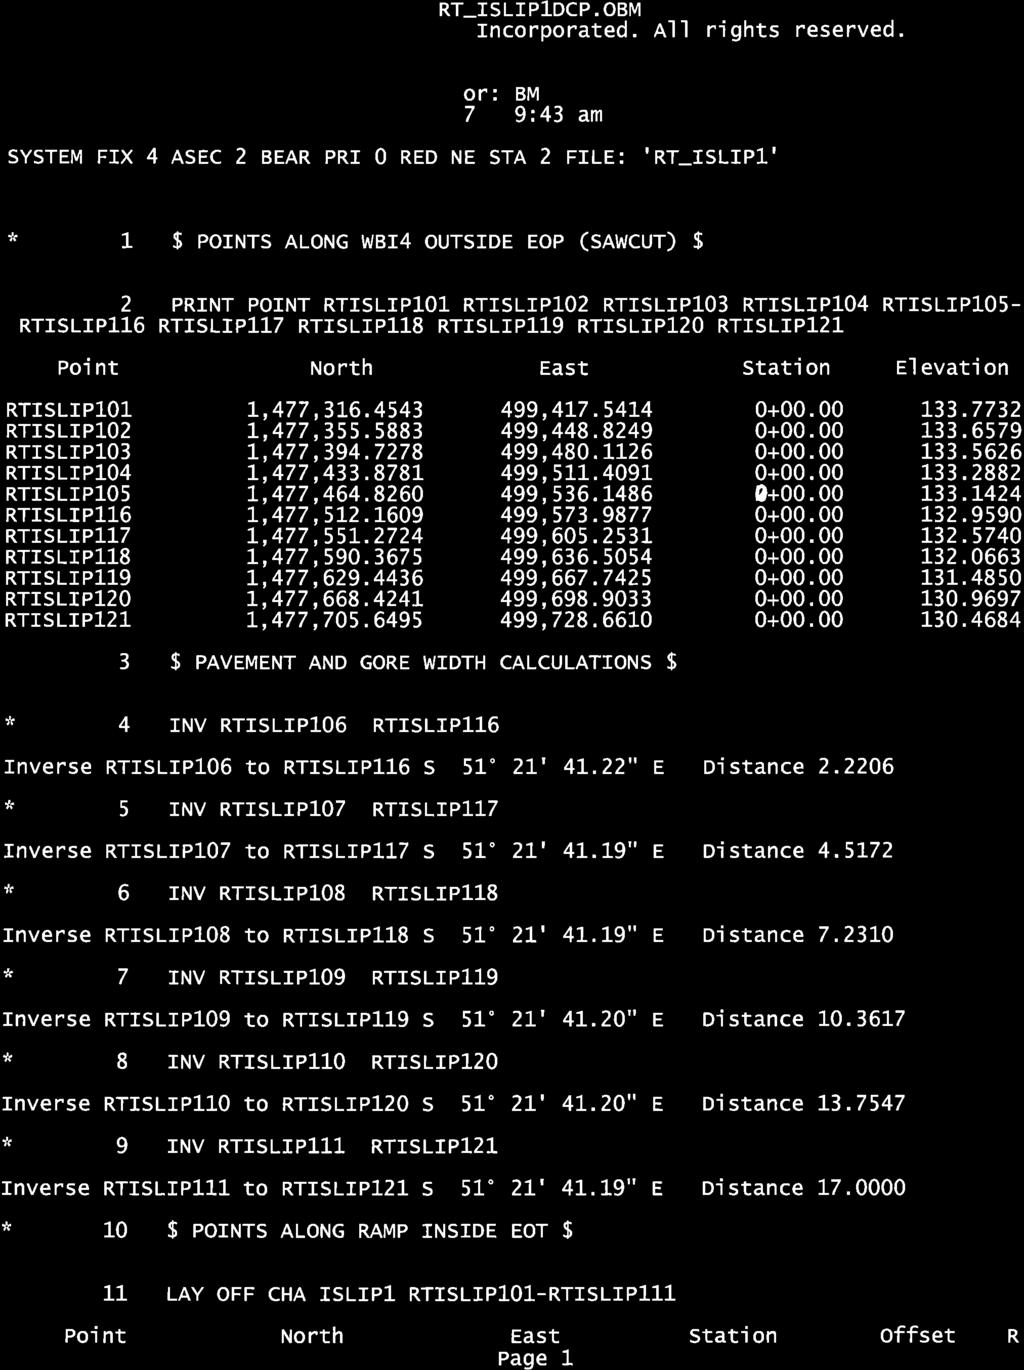
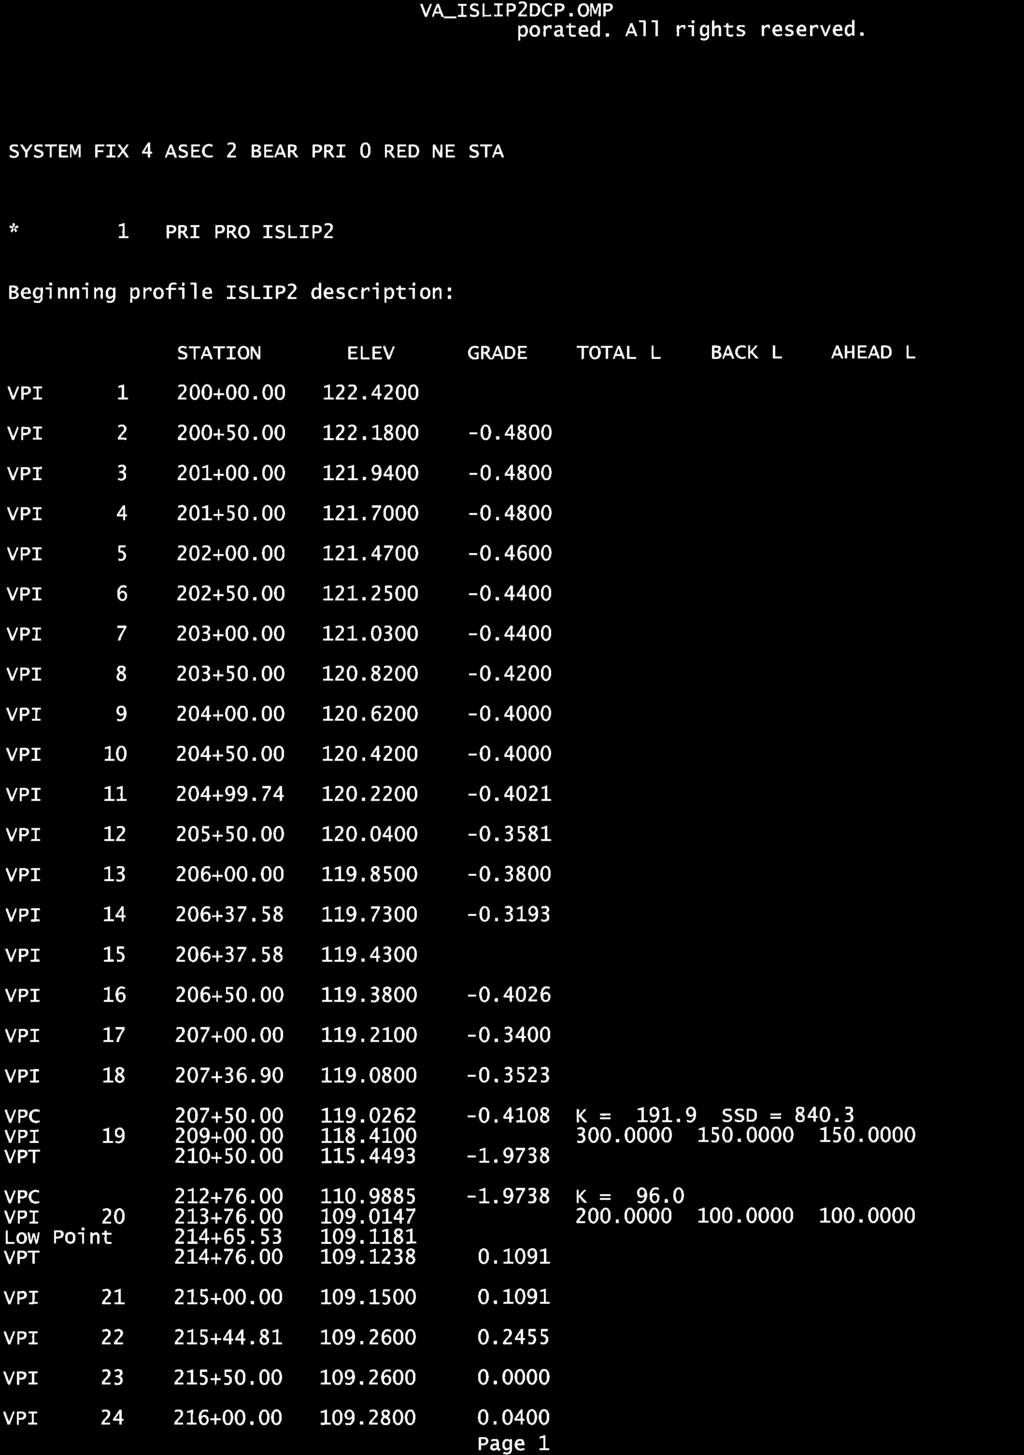
53 RT_ISLIP2DCP.OBM Copyright: (c) 2013 Bentley Systems, Incorporated. All rights reserved. Project: DCP Interim Subject: [ None ] Job No. DCP Operator: BM Date: Wednesday April 4, :21 pm SYSTEM FIX 4 ASEC 2 BEAR PRI 0 RED NE STA 2 FILE: 'RT_ISLIP2' * 1 LAY OFF CHA IWBCD2 RTISLIP201-RTISLIP216 Point North East Station Offset R RTISLIP201 1,479, , RTISLIP202 1,479, , RTISLIP203 1,479, , RTISLIP204 1,479, , RTISLIP205 1,479, , RTISLIP206 1,479, , RTISLIP207 1,479, , RTISLIP208 1,479, , RTISLIP209 1,479, , RTISLIP210 1,479, , RTISLIP211 1,479, , RTISLIP212 1,479, , RTISLIP213 1,479, , RTISLIP214 1,479, , RTISLIP215 1,479, , RTISLIP216 1,479, , * 2 EL PRO IWBCD Elev at = , grade = , On tang betw 1 & 2 Elev at = , grade = , On tang betw 1 & 2 Elev at = , grade = , On tang betw 1 & 2 Elev at = , grade = , On tang betw 1 & 2 Elev at = , grade = , On tang betw 1 & 2 Elev at = , grade = , On tang betw 1 & 2 Elev at = , grade = , On tang betw 1 & 2 Elev at = , grade = , On tang betw 1 & 2 Elev at = , grade = , On tang betw 1 & 2 Elev at = , grade = , On tang betw 1 & 2 Elev at = , grade = , On tang betw 1 & 2 Elev at = , grade = , On tang betw 1 & 2 Elev at = , grade = , On tang betw 1 & 2 Elev at = , grade = , On tang betw 1 & 2 Elev at = , grade = , On tang betw 1 & 2 Elev at = , grade = , On tang betw 1 & 2 * 3 LAY OFF CHA ISLIP2 RTISLIP201-RTISLIP216 Point North East Station Offset R RTISLIP201 1,479, , RTISLIP202 1,479, , RTISLIP203 1,479, , RTISLIP204 1,479, , RTISLIP205 1,479, , RTISLIP206 1,479, , RTISLIP207 1,479, , Page 1
54 RT_ISLIP2DCP.OBM RTISLIP208 1,479, , RTISLIP209 1,479, , RTISLIP210 1,479, , RTISLIP211 1,479, , RTISLIP212 1,479, , RTISLIP213 1,479, , RTISLIP214 1,479, , RTISLIP215 1,479, , RTISLIP216 1,479, , * 4 END Page 2
55

56
57
58
59
60

61
62

63
64

65
66

67
68

69
70
71
72
73
74

75
76
77
78
79
80
81
82
83
84
85
86
87
88
89

90
91
92

93
94
95

96
97
98
99
100
101
102
103

104


105

106
107
108
109
110
111
112
113
114
115
116


117
118


119


120
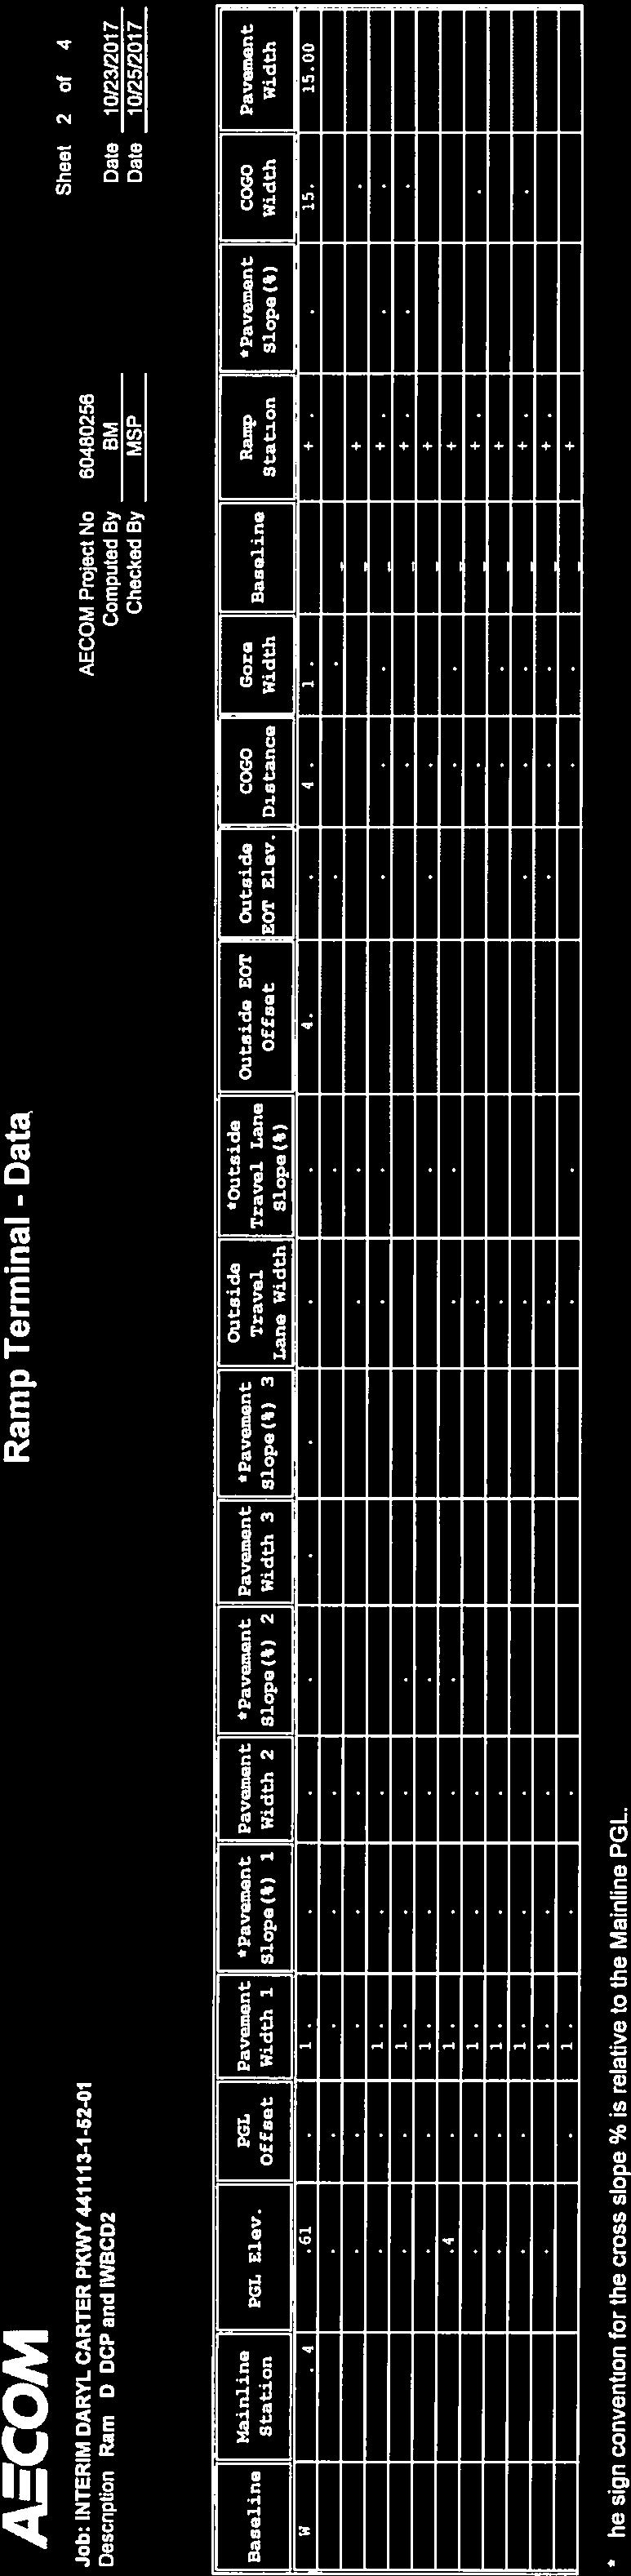
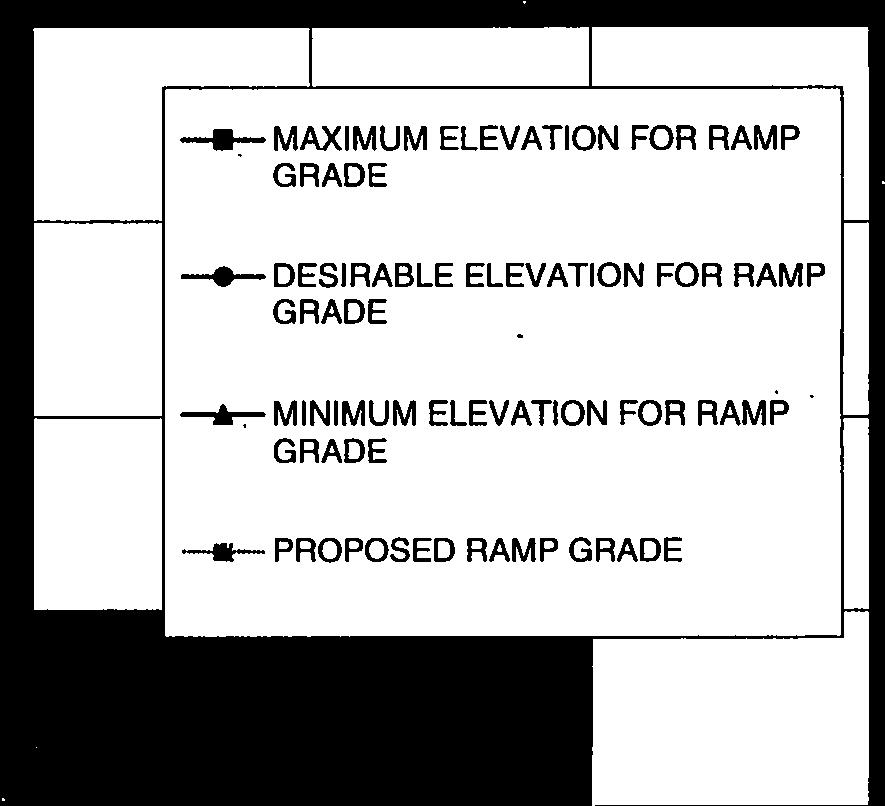
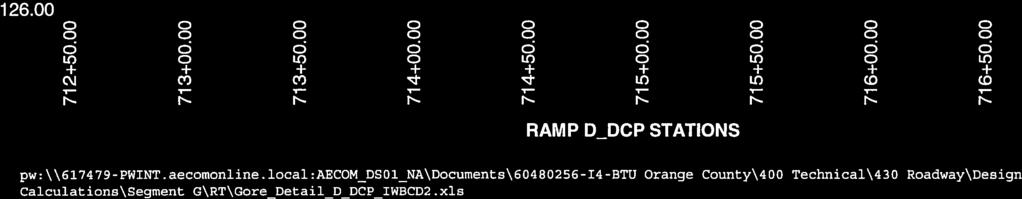
121 Ramp Terminal - Graph Input Sheet 3 of 4 Job: INTERIM DARYL CARTER PKWY AECOM Project No: Description: Ramp D_DCP and IWBCD2 Computed By: BM Date: 10/23/2017 Checked By: MSP Date: 10/25/2017 Mainline Rollover MINIMUM ELEVATION FOR RAMP GRADE DESIRABLE ELEVATION FOR RAMP GRADE MAXIMUM ELEVATION FOR RAMP GRADE Gore Slope(%) Ramp Rollover Inside Ramp Elevation Outside Ramp Elevation Ramp Rollover Gore Slope(%) Mainline Rollover Inside Ramp Elevation Outside Ramp Elevation Ramp Rollover Gore Slope(%) Mainline Rollover Inside Ramp Elevation Outside Ramp Elevation 5.00% -7.00% 4.00% % -2.00% 0.00% % 2.00% 4.00% % -7.00% 4.00% % -2.00% 0.00% % 2.00% 4.00% % -7.00% 4.00% % -2.00% 0.00% % 2.00% 4.00% % -7.00% 4.00% % -2.00% 0.00% % 2.00% 4.00% % -7.00% 4.00% % -2.00% 0.00% % 2.00% 4.00% % -7.00% 4.00% % -2.00% 0.00% % 2.00% 4.00% % N/A 1.00% % N/A 1.00% % N/A 1.00% % N/A 1.00% % N/A 1.00% % N/A 1.00% % N/A 1.00% % N/A 1.00% % N/A 1.00% % N/A 1.00% % N/A 1.00% % N/A 1.00% % N/A 1.00% % N/A 1.00% % N/A 1.00% % N/A 1.00% % N/A 1.00% % N/A 1.00% pw:\\ pwint.aecomonline.local:aecom_ds01_na\documents\ i4-btu Orange County\400 Technical\430 Roadway\Design Calculations\Segment G\RT\Gore_Detail_D_DCP_IWBCD2.xls


122

123

124

125
126
127
128

129
130
131
132
133
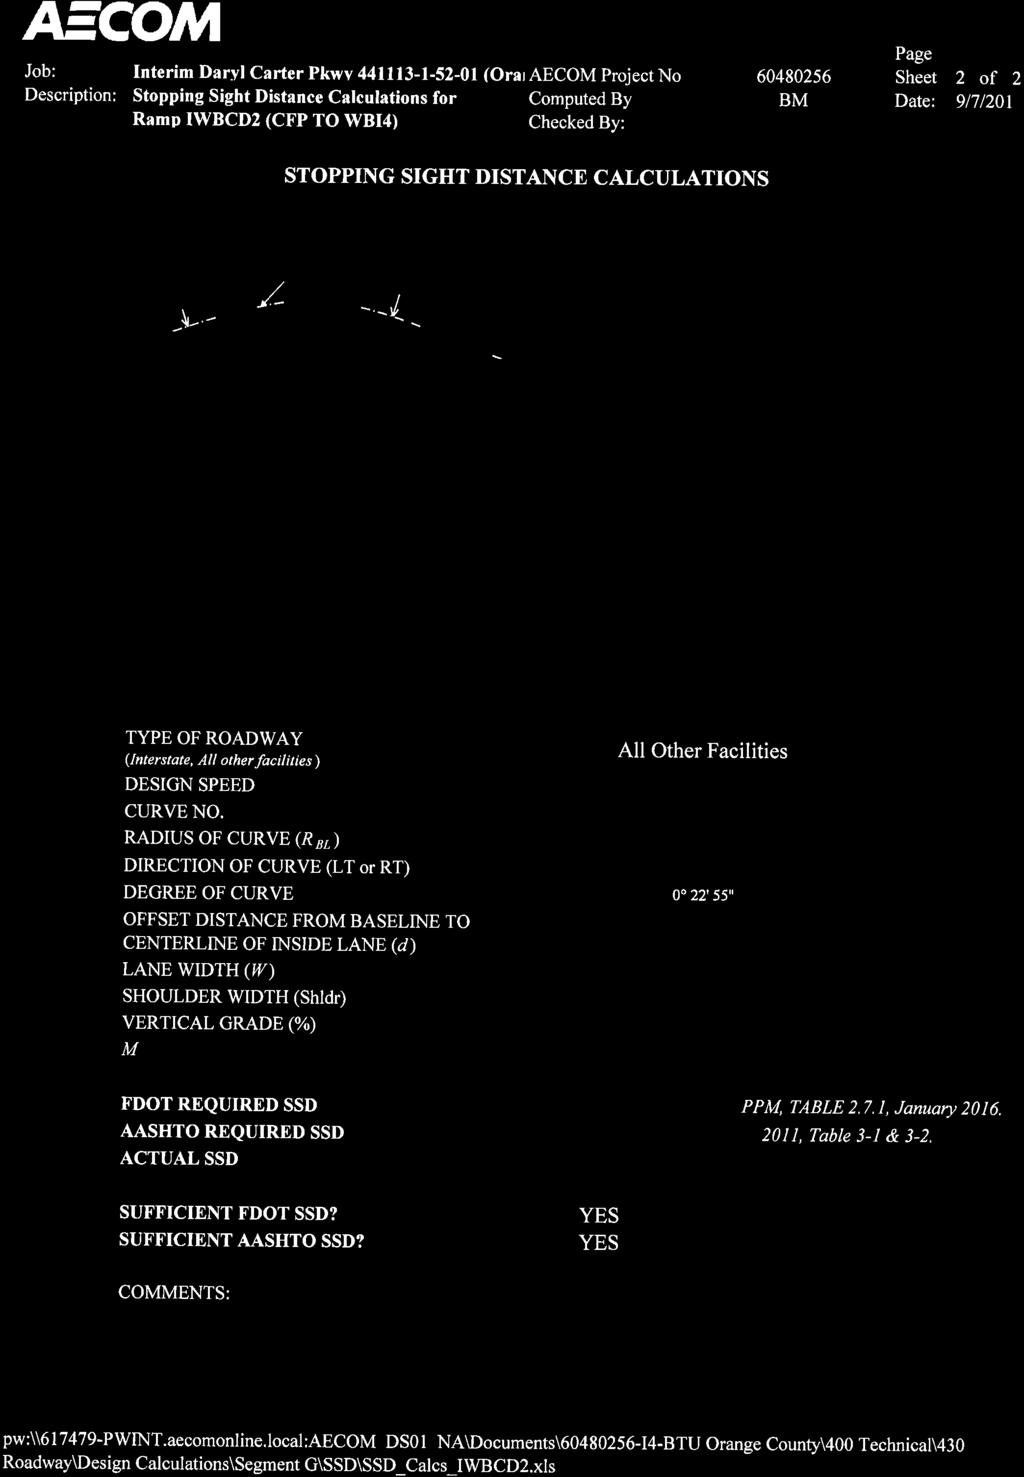
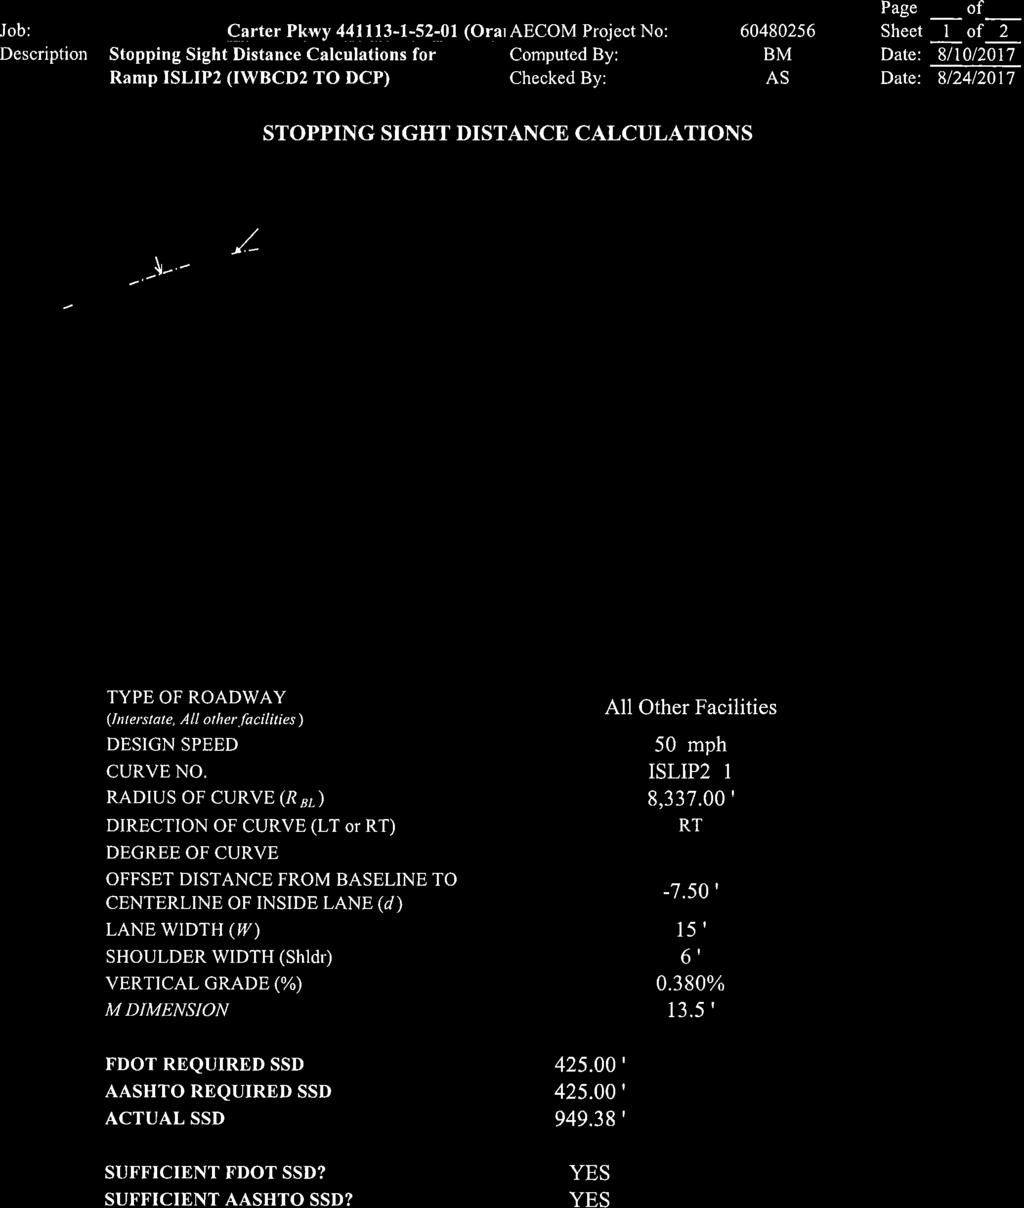
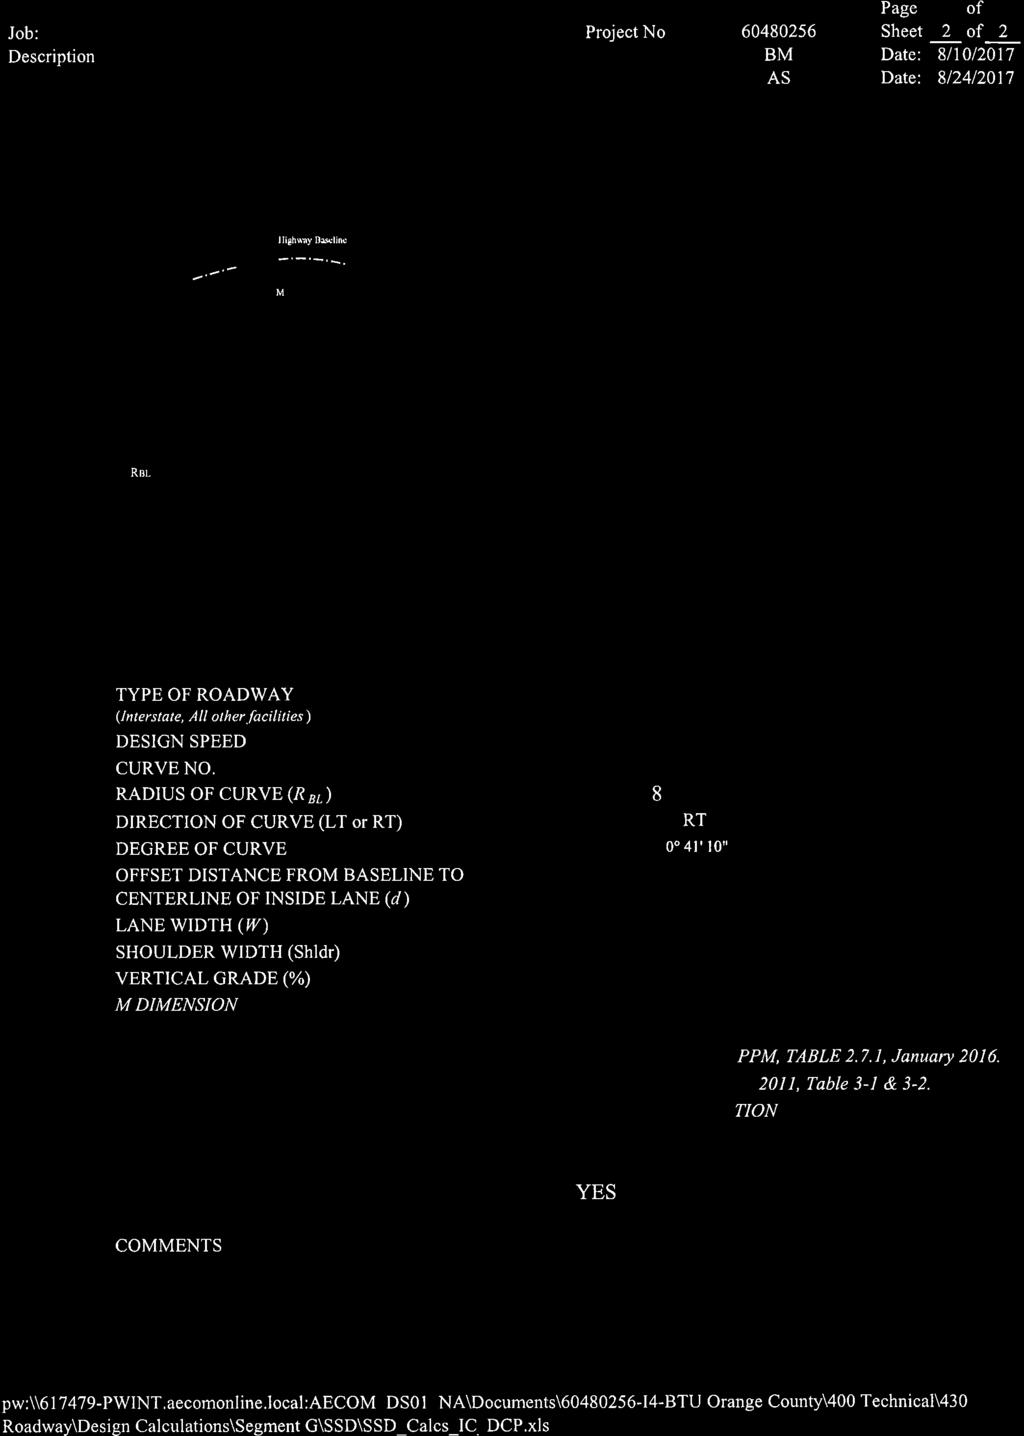
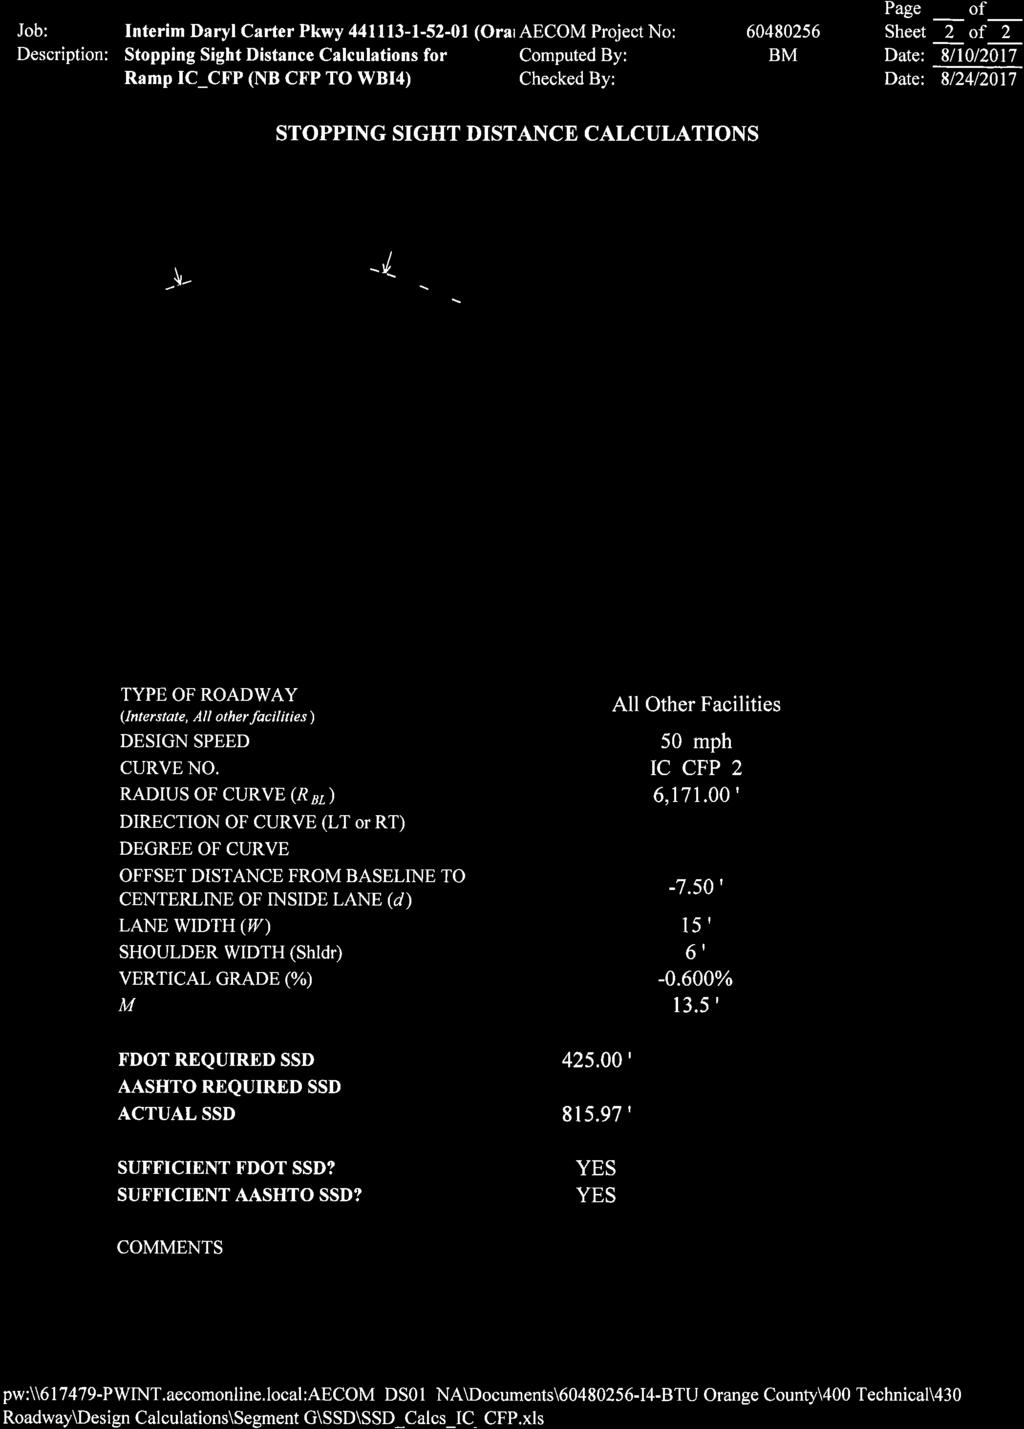
134 Page of Job: Interim Daryl Carter Pkwy (OranAECOM Project No: Sheet 1 of 2 Description: Stopping Sight Distance Calculations for Computed By: BM Date: 8/10/2017 Ramp IB_CFP (EBI4 TO CFP) Checked By: AS Date: 8/24/2017 STOPPING SIGHT DISTANCE CALCULATIONS Sight Distance (S) Highway Baseline d Line of Sight Inside Lane Centerline M Shldr W S = R x Cos M R Sight Obstruction Where: S = Stopping Sight Distance (ft) RBL = Radius of Baseline (ft) RBL R = Radius (ft) = RBL+d d W = Distance from Baseline to Centerline of Inside Lane = Lane width (ft) Shldr = Shoulder width (ft) M = Middle Ordinate (ft) = SHLDR+W/2 Reference: AASHTO TYPE OF ROADWAY (Interstate, All other facilities ) DESIGN SPEED CURVE NO. RADIUS OF CURVE (R BL ) DIRECTION OF CURVE (LT or RT) DEGREE OF CURVE OFFSET DISTANCE FROM BASELINE TO CENTERLINE OF INSIDE LANE (d ) LANE WIDTH (W ) SHOULDER WIDTH (Shldr) VERTICAL GRADE (%) M DIMENSION All Other Facilities 50 mph IB_CFP_1 5, ' RT 1 8' 45" ' 15 ' 6 ' 2.000% 13.5 ' FDOT REQUIRED SSD ' FDOT PPM, TABLE 2.7.1, January AASHTO REQUIRED SSD ' AASHTO 2011, Table 3-1 & 3-2. ACTUAL SSD ' EQUATION SUFFICIENT FDOT SSD? SUFFICIENT AASHTO SSD? YES YES COMMENTS: pw:\\ pwint.aecomonline.local:aecom_ds01_na\documents\ i4-btu Orange County\400 Technical\430 Roadway\Design Calculations\Segment G\SSD\SSD_Calcs_IB_CFP.xls
135
136
137
138
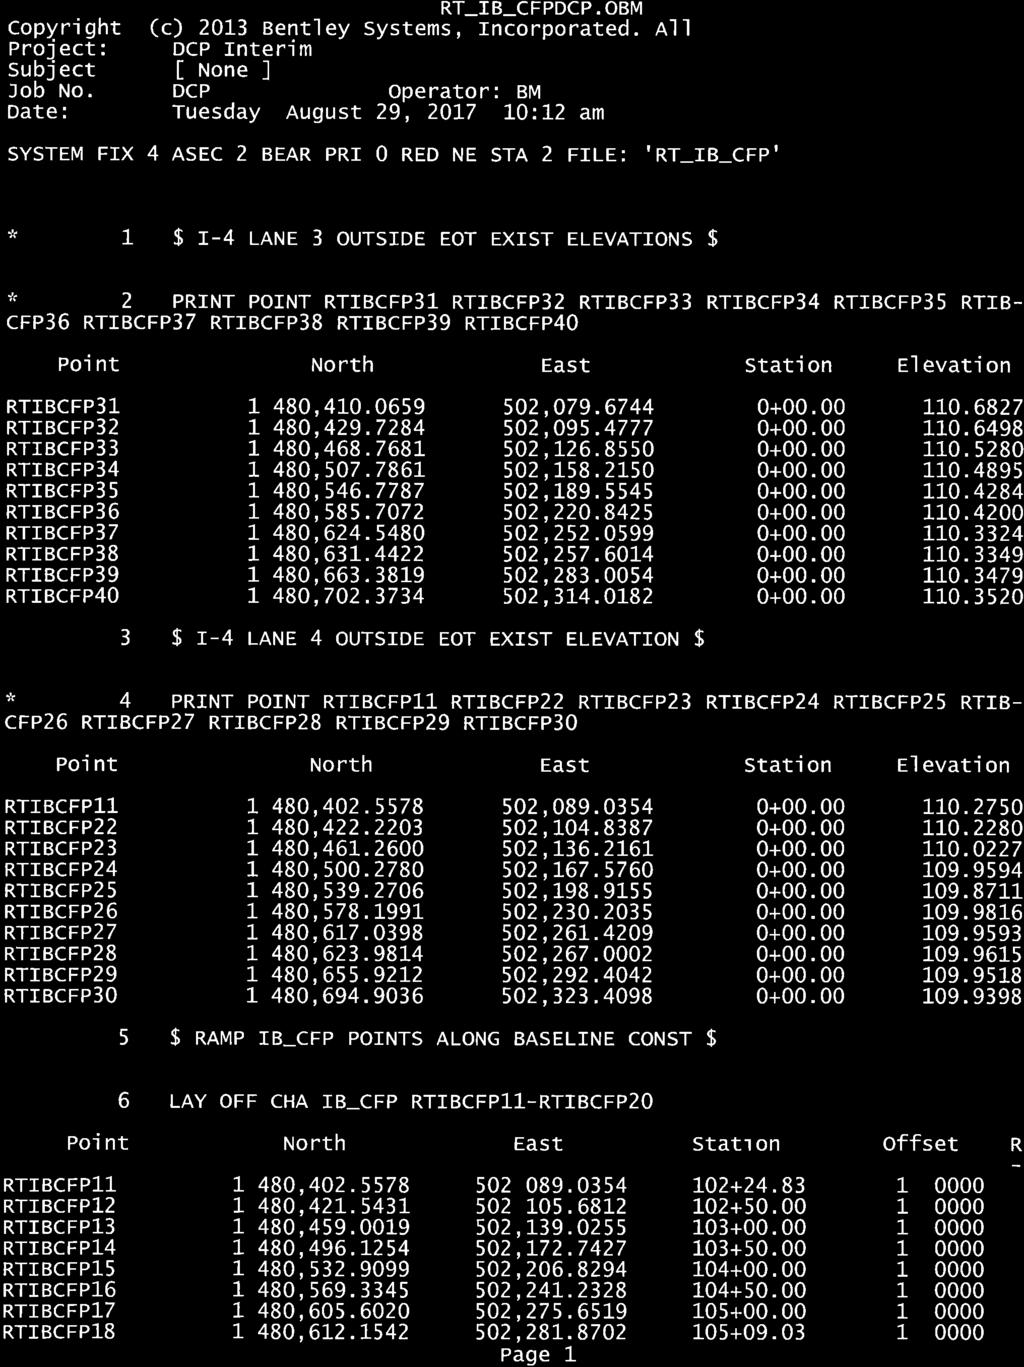
139 RT_IB_CFPDCP.OBM RTIBCFP19 1,480, , RTIBCFP20 1,480, , * 7 $ RAMP IB_CFP INSIDE EXISTING ELEVATIONS $ * 8 PRINT POINT RTIBCFP11 RTIBCFP12 RTIBCFP13 RTIBCFP14 RTIBCFP15 RTIB- CFP16 RTIBCFP17 RTIBCFP18 RTIBCFP19 RTIBCFP20 Point North East Station Elevation RTIBCFP11 1,480, , RTIBCFP12 1,480, , RTIBCFP13 1,480, , RTIBCFP14 1,480, , RTIBCFP15 1,480, , RTIBCFP16 1,480, , RTIBCFP17 1,480, , RTIBCFP18 1,480, , RTIBCFP19 1,480, , RTIBCFP20 1,480, , * 9 $ RAMP IB_CFP OUTSIDE EXISITING ELEVATIONS $ * 10 PRINT POINT RTIBCFP01 RTIBCFP02 RTIBCFP03 RTIBCFP04 RTIBCFP05 RTIB- CFP06 RTIBCFP07 RTIBCFP08 RTIBCFP09 RTIBCFP10 Point North East Station Elevation RTIBCFP01 1,480, , RTIBCFP02 1,480, , RTIBCFP03 1,480, , RTIBCFP04 1,480, , RTIBCFP05 1,480, , RTIBCFP06 1,480, , RTIBCFP07 1,480, , RTIBCFP08 1,480, , RTIBCFP09 1,480, , RTIBCFP10 1,480, , * 11 $ GORE WIDTH CALCULATIONS $ * 12 INV RTIBCFP12 RTIBCFP22 Inverse RTIBCFP12 to RTIBCFP22 N 51 12' 36.48" W Distance * 13 INV RTIBCFP13 RTIBCFP23 Inverse RTIBCFP13 to RTIBCFP23 N 51 12' 36.49" W Distance * 14 INV RTIBCFP14 RTIBCFP24 Inverse RTIBCFP14 to RTIBCFP24 N 51 12' 36.49" W Distance * 15 INV RTIBCFP15 RTIBCFP25 Inverse RTIBCFP15 to RTIBCFP25 N 51 12' 36.49" W Distance * 16 INV RTIBCFP16 RTIBCFP26 Inverse RTIBCFP16 to RTIBCFP26 N 51 12' 36.49" W Distance Page 2

140
141
142
143
144
145
146
147
148 Ramp Terminal - Detail Sheet 1 of 4 Job: Interim Daryl Carter Pkwy (Orange County) AECOM Project No: Description: Ramp IC_CFP and IA_CFP Computed By: BM Date: 4/24/2018 Checked By: MSP Date: 4/24/2018 Baseline Mainline Station PGL Elev. MAINLINE GORE RAMP Inside Travel Lane Slope(%) Inside EOT Offset Inside EOT Elev. Gore Width Gore Slope(%) Outside Elev. *Pavement Slope(%) Pavement Width Inside Elev. Baseline Ramp Station IA_CFP % N/A % IC_CFP IA_CFP % N/A % IC_CFP IA_CFP % N/A % IC_CFP IA_CFP % N/A % IC_CFP IA_CFP % N/A % IC_CFP IA_CFP % N/A % IC_CFP IA_CFP % % % IC_CFP IA_CFP % % % IC_CFP IA_CFP % % % IC_CFP IA_CFP % % % IC_CFP IA_CFP % % % IC_CFP IA_CFP % % % IC_CFP IA_CFP % % % IC_CFP * The sign convention for the cross slope % is relative to the Mainline PGL. pw:\\ pwint.aecomonline.local:aecom_ds01_na\documents\ i4-btu Orange County\400 Technical\430 Roadway\Design Calculations\Segment G\RT\Gore_Detail_IC_CFP_IA_CFP.xls
149 Ramp Terminal - Data Sheet 2 of 4 Job: Interim Daryl Carter Pkwy (Orange County) AECOM Project No: Description: Ramp IC_CFP and IA_CFP Computed By: BM Date: 4/24/2018 Checked By: MSP Date: 4/24/2018 Baseline Mainline Station PGL Elev. Inside Travel Lane Width Inside Travel Lane Slope(%) Inside EOT Offset Inside EOT Elev. COGO Distance Gore Width Baseline Ramp Station *Pavement Slope(%) IA_CFP % IC_CFP % IA_CFP % IC_CFP % IA_CFP % IC_CFP % IA_CFP % IC_CFP % IA_CFP % IC_CFP % IA_CFP % IC_CFP % IA_CFP % IC_CFP % IA_CFP % IC_CFP % IA_CFP % IC_CFP % IA_CFP % IC_CFP % IA_CFP % IC_CFP % IA_CFP % IC_CFP % IA_CFP % IC_CFP % * The sign convention for the cross slope % is relative to the Mainline PGL. COGO Width Pavement Width pw:\\ pwint.aecomonline.local:aecom_ds01_na\documents\ i4-btu Orange County\400 Technical\430 Roadway\Design Calculations\Segment G\RT\Gore_Detail_IC_CFP_IA_CFP.xls
150 Ramp Terminal - Graph Input Sheet 3 of 4 Job: Interim Daryl Carter Pkwy (Orange County) AECOM Project No: Description: Ramp IC_CFP and IA_CFP Computed By: BM Date: 4/24/2018 Checked By: MSP Date: 4/24/2018 Mainline Rollover MINIMUM ELEVATION FOR RAMP GRADE DESIRABLE ELEVATION FOR RAMP GRADE MAXIMUM ELEVATION FOR RAMP GRADE Gore Slope(%) Ramp Rollover Outside Ramp Elevation Inside Ramp Elevation Ramp Rollover Gore Slope(%) Mainline Rollover Outside Ramp Elevation Inside Ramp Elevation Ramp Rollover Gore Slope(%) Mainline Rollover Outside Ramp Elevation Inside Ramp Elevation 5.00% N/A 0.00% % N/A 0.00% % N/A 0.00% % N/A 0.00% % N/A 0.00% % N/A 0.00% % N/A 0.00% % N/A 0.00% % N/A 0.00% % N/A 0.00% % N/A 0.00% % N/A 0.00% % N/A 0.00% % N/A 0.00% % N/A 0.00% % N/A 0.00% % N/A 0.00% % N/A 0.00% % N/A 0.00% % N/A 0.00% % N/A 0.00% % -3.00% 5.00% % 2.00% 0.00% % 7.00% 5.00% % -3.00% 5.00% % 2.00% 0.00% % 7.00% 5.00% % -3.00% 5.00% % 2.00% 0.00% % 7.00% 5.00% % -3.00% 5.00% % 2.00% 0.00% % 7.00% 5.00% % -3.00% 5.00% % 2.00% 0.00% % 7.00% 5.00% % -3.00% 5.00% % 2.00% 0.00% % 7.00% 5.00% pw:\\ pwint.aecomonline.local:aecom_ds01_na\documents\ i4-btu Orange County\400 Technical\430 Roadway\Design Calculations\Segment G\RT\Gore_Detail_IC_CFP_IA_CFP.xls

151 ELEVATION (FT) RAMP RAMP IA_CFP SHEET 4 OF MAXIMUM ELEVATION FOR RAMP GRADE DESIRABLE ELEVATION FOR RAMP GRADE MINIMUM ELEVATION FOR RAMP GRADE PROPOSED RAMP GRADE RAMP IC_CFP STATIONS pw:\\ pwint.aecomonline.local:aecom_ds01_na\documents\ i4-btu Orange County\400 Technical\430 Roadway\Design Calculations\Segment G\RT\Gore_Detail_IC_CFP_IA_CFP.xls
152

153
154
155 Page of Job: Interim Daryl Carter Pkwy (OranAECOM Project No: Sheet 1 of 2 Description: Stopping Sight Distance Calculations for Computed By: BM Date: 4/23/2018 DIVERSION 1 (EB/WB CFP TO WB I-4) Checked By: MSP Date: 5/17/2018 STOPPING SIGHT DISTANCE CALCULATIONS Sight Distance (S) Highway Baseline d Line of Sight Inside Lane Centerline M Shldr W S = R x Cos M R Sight Obstruction Where: RBL S RBL R = Stopping Sight Distance (ft) = Radius of Baseline (ft) = Radius (ft) = RBL+d d W = Distance from Baseline to Centerline of Inside Lane = Lane width (ft) Shldr = Shoulder width (ft) M = Middle Ordinate (ft) = SHLDR+W/2 Reference: AASHTO TYPE OF ROADWAY (Interstate, All other facilities ) DESIGN SPEED CURVE NO. RADIUS OF CURVE (R BL ) DIRECTION OF CURVE (LT or RT) DEGREE OF CURVE OFFSET DISTANCE FROM BASELINE TO CENTERLINE OF INSIDE LANE (d ) LANE WIDTH (W ) SHOULDER WIDTH (Shldr) VERTICAL GRADE (%) M DIMENSION All Other Facilities 50 mph DIV011 2, ' LT 2 23' 14" 7.50 ' 15 ' 2 ' % 9.5 ' FDOT REQUIRED SSD ' FDOT PPM, TABLE 2.7.1, January AASHTO REQUIRED SSD ' AASHTO 2011, Table 3-1 & 3-2. ACTUAL SSD ' EQUATION SUFFICIENT FDOT SSD? SUFFICIENT AASHTO SSD? YES YES COMMENTS: pw:\\ pwint.aecomonline.local:aecom_ds01_na\documents\ i4-btu Orange County\400 Technical\430 Roadway\Design Calculations\Segment G\SSD\SSD_Calcs_DIV01.xls
Submittal/Approval Letter
 Submittal/Approval Letter To: Patrick Muench, P.E. Date: May 1, 2017 Turnpike Design Engineer Financial Project ID: 436517-1-52-01 & 436517-3-52-01 New Construction ( ) RRR ( ) Federal Aid : Not Applicable
I-95/I-85 INTERCHANGE ROADWAY SAFETY ASSESSMENT
 FINAL REPORT I-95/I-85 INTERCHANGE ROADWAY SAFETY ASSESSMENT Prepared for: Prepared by: 117306012.B MARCH 2013 Final Report March 2013 I-95/I-85 Interchange ROADWAY SAFETY ASSESSMENT Prepared for: Prepared
Submittal/Approval Letter
 Submittal/Approval Letter To: Patrick Muench, P.E. Date: May 1, 2017 Turnpike Design Engineer Financial Project ID: 436517-1-52-01 & 436517-3-52-01 New Construction ( ) RRR ( ) Federal Aid : Not Applicable
Submittal/Approval Letter
 Submittal/Approval Letter To: Patrick Muench, P.E. Date: June 14, 2017 Turnpike Design Engineer Financial Project ID: 436517-1-52-01 & 436517-3-52-01 New Construction ( ) RRR ( ) Federal Aid : Not Applicable
Market Street PDP. Nassau County, Florida. Transportation Impact Analysis. VHB/Vanasse Hangen Brustlin, Inc. Nassau County Growth Management
 Transportation Impact Analysis Market Street PDP Nassau County, Florida Submitted to Nassau County Growth Management Prepared for TerraPointe Services, Inc. Prepared by VHB/Vanasse Hangen Brustlin, Inc.
EVALUATION OF SAFETY PERFORMANCES ON FREEWAY DIVERGE AREA AND FREEWAY EXIT RAMPS. Transportation Seminar February 16 th, 2009
 EVALUATION OF SAFETY PERFORMANCES ON FREEWAY DIVERGE AREA AND FREEWAY EXIT RAMPS Transportation Seminar February 16 th, 2009 By: Hongyun Chen Graduate Research Assistant 1 Outline Introduction Problem
Expanding the GSATS Model Area into
 Appendix A Expanding the GSATS Model Area into North Carolina Jluy, 2011 Table of Contents LONG-RANGE TRANSPORTATION PLAN UPDATE 1. Introduction... 1 1.1 Background... 1 1.2 Existing Northern Extent of
Vertical Curve Profile Views. Vertical Alignment Fundamentals. Offsets. Offset Formulas 9/17/2009
 9/17/009 Vertical Alignment Fundamentals Vertical Curve Profile Views CE 3 Transportation Engineering Dr. Ahmed Abdel-Rahim, Ph.D., P.E. Fig. 3.3 Fig. 3.4 Offsets Offsets are vertical distances from initial
Subject: Desert Palisades Specific Plan - Tram Way Access Sight Distance
 Endo Engineering Traffic Engineering Air Quality Studies Noise Assessments July 13, 2015 Mr. Ed Freeman Pinnacle View, LLC P.O. Box 1754 Lake Oswego, OR 97035-0579 Subject: Desert Palisades Specific Plan
h CIVIL ENGINEERING FLUID MECHANICS section. ± G = percent grade divided by 100 (uphill grade "+")
") FLUID MECHANICS section. TRANSPORTATION U.S. Customary Units a = deceleration rate (ft/sec ) A = absolute value of algebraic difference in grades (%) e = superelevation (%) f = side friction factor ± G
FLUID MECHANICS section. TRANSPORTATION U.S. Customary Units a = deceleration rate (ft/sec ) A = absolute value of algebraic difference in grades (%) e = superelevation (%) f = side friction factor ± G
College of Engineering Tutorial Note 3: Chapter 7
 1 King Saud University CE 431: Highway Engineering College of Engineering Tutorial Note 3: Chapter 7 Civil Engineering Department 7.1 Given Δ = 35, R = 1,350 ft, and the PI station 75 + 8.10, compute the
WEBER ROAD RESIDENTIAL DEVELOPMENT Single Family Residential Project
 WEBER ROAD RESIDENTIAL DEVELOPMENT Single Family Residential Project WEBER ROAD RESIDENTIAL DEVELOPMENT TRAFFIC IMPACT STUDY TABLE OF CONTENTS 1.0 Executive Summary Page 2.0 Introduction 2.1 DEVELOPMENT
City of Saginaw Right of Way Division Snow and Ice Removal Policy January 18, 2016
 Snow and Ice Removal Policy January 18, 2016 It is the policy of the to provide snowplowing and ice removal services in order to: Provide safe traveling conditions for motorists and pedestrians Assist
LIC SR INTERCHANGE OPERATIONS STUDY
 LIC SR 16 18.20 - INTERCHANGE OPERATIONS STUDY Project Summary Location SR 16 & W. Church St. Interchange Newark, Ohio Licking County PID 99478 Study Sponsor ODOT District 5 Proposed Work Add Left Turn
JEP John E. Jack Pflum, P.E. Consulting Engineering 7541 Hosbrook Road, Cincinnati, OH Telephone:
 JEP John E. Jack Pflum, P.E. Consulting Engineering 7541 Hosbrook Road, Cincinnati, OH 45243 Email: jackpflum1@gmail.com Telephone: 513.919.7814 MEMORANDUM REPORT Traffic Impact Analysis Proposed Soccer
Brandywine Road Speed Study FINAL REPORT
 Brandywine Road Speed Study FINAL REPORT City of Albuquerque Brandywine Road Speed Study Final Report Albuquerque, New Mexico City of Albuquerque May, 2016 Brandywine Road Speed Study Final Report City
Local Calibration Factors for Implementing the Highway Safety Manual in Maine
 Local Calibration Factors for Implementing the Highway Safety Manual in Maine 2017 Northeast Transportation Safety Conference Cromwell, Connecticut October 24-25, 2017 MAINE Darryl Belz, P.E. Maine Department
FUNDAMENTALS OF TRANSPORTATION ENGINEERING By Jon D. Fricker and Robert K. Whitford
 FUNDAMENTALS OF TRANSPORTATION ENGINEERING By Jon D. Fricker and Robert K. Whitford This table includes typos Dr. Saito found besides the ones listed in the authors official errata sheet. Please note that
MEMORANDUM. The study area of the analysis was discussed with City staff and includes the following intersections:
 MEMORANDUM DATE: JULY 6, 2012 TO: FROM: RE: CC: MELANIE KNIGHT BRAD BYVELDS/ JENNIFER LUONG 1050 SOMERSET STREET PRELIMINARY TRAFFIC ANALYSIS OUR FILE NO. 111152 NEIL MALHOTRA The purpose of this memo
2015 Grand Forks East Grand Forks TDM
 GRAND FORKS EAST GRAND FORKS 2015 TRAVEL DEMAND MODEL UPDATE DRAFT REPORT To the Grand Forks East Grand Forks MPO October 2017 Diomo Motuba, PhD & Muhammad Asif Khan (PhD Candidate) Advanced Traffic Analysis
The Highline Development Traffic Impact Study
 The Highline Development Traffic Impact Study Columbia Falls, Montana Prepared For: TD&H Engineering 450 Corporate Drive, Suite 101 Kalispell, MT 59901 June, 2018 130 South Howie Street Helena, Montana
TRAFFIC IMPACT STUDY MANUFACTURING COMPANY
 TRAFFIC IMPACT STUDY For MANUFACTURING COMPANY Prepared For: Airway Heights, WA Prepared By: SUNBURST ENGINEERING, P. S. 4310 S. Ball Dr. Veradale, WA 99037 April, 2013 TRAFFIC IMP ACT STUDY Manufacturing
Prepared for. 3D/International, Inc West Loop South, Suite 400 Houston, Texas November 2006
 DRAFT TRAFFIC IMPACT STUDY FOR PHASED DEVELOPMENT OF TAMU CC Prepared for 3D/International, Inc. 1900 West Loop South, Suite 400 Houston, Texas 77027 November 2006 Interim Review Only Document Incomplete:
Appendix I: Traffic Study
 City of Fontana Sierra Lakes Commerce Center Draft EIR Appendix I: Traffic Study FirstCarbon Solutions H:\Client (PN JN)\0144\01440050\EIR\1 ADEIR\01440050 Sec99 99 Appendix Dividers.doc THIS PAGE INTENTIONALLY
Case Histories and Practical Examples
 SUMMER SCHOOL SIIV 2012 - ROAD SAFETY MANAGEMENT Theoretical principles and practical application in the framework of the European Directive 2008/96/CE Catania 24-28 September 2012 Case Histories and Practical
TRAFFIC ALERT FOR WEEK OF February 4 8, 2008
 TRAFFIC ALERT FOR WEEK OF February 4 8, 2008 Highway work zones in the Staunton District The following is a list of highway work that might affect traffic in the Staunton transportation district during
SPEED LIMIT STUDY ELDRON BLVD NE & SE FROM AMERICANA BLVD NE TO BAYSIDE LAKES BLVD. Engineering and Traffic Investigation Conducted by:
 SPEED LIMIT STUDY ELDRON BLVD NE & SE FROM AMERICANA BLVD NE TO BAYSIDE LAKES BLVD Engineering and Traffic Investigation Conducted by: Elia Twigg, P.E. Kwabena Ofosu, Ph.D., P.E. Public Works Department
III. FORECASTED GROWTH
 III. FORECASTED GROWTH In order to properly identify potential improvement projects that will be required for the transportation system in Milliken, it is important to first understand the nature and volume
MnDOT Method for Calculating Measures of Effectiveness (MOE) From CORSIM Model Output
 From CORSIM Model Output") MnDOT Method for Calculating Measures of Effectiveness (MOE) From CORSIM Model Output Rev. April 29, 2005 MnDOT Method for Calculating Measures of Effectiveness (MOE) From CORSIM Model Output Table of
MnDOT Method for Calculating Measures of Effectiveness (MOE) From CORSIM Model Output Rev. April 29, 2005 MnDOT Method for Calculating Measures of Effectiveness (MOE) From CORSIM Model Output Table of
FINAL Traffic Report for the Proposed Golden Valley Road and Newhall Ranch Road Projects in the City of Santa Clarita, California May 5, 2005
 FINAL Traffic Report for the Proposed Golden Valley Road and Newhall Ranch Road Projects in the City of Santa Clarita, California May 5, 2005 Prepared For: EDAW, Inc. 1420 Kettner Boulevard, Suite 620
CVS Derwood. Local Area Transportation Review
 CVS Derwood Montgomery County, Maryland May 27, 2016 Local Area Transportation Review Prepared for: JC Bar Properties, Inc. Steve Fleming, PE 415 Fallowfield Road, Suite 301 Camp Hill, Pennsylvania 17011
State Highway Log. Planning Report Olympic Region. Washington State Department of Transportation. Strategic Planning Division
 State Highway Log Planning Report 2009 Olympic Region Washington State Department of Transportation Strategic Planning Division March 8, 2010 Highway Log Users Re: 2009 State Highway Log Dear User: The
TRANSPORTATION IMPACT STUDY WHEELER STREET CLOSURE
 TRANSPORTATION IMPACT STUDY WHEELER STREET CLOSURE Village of Greene, Chenango County, New York Prepared for: VILLAGE OF GREENE 49 Genesee Street Greene, NY 13778 Prepared by: LARSON DESIGN GROUP 1000
Traffic Impact Study
 Traffic Impact Study Statham DRI One University Parkway Prepared for: Barrow County Prepared by: October 2012 Table of Contents Executive Summary i Section 1. Introduction 1 Project Description 1 Methodology
Freeway Work Zone Lane Capacity
 Report Title Report Date: 2009 Freeway Work Zone Lane Capacity Principle Investigator Vendor Name and Address Name Drakopoulos, Alex «Vendor» Affiliation Marquette University Address 263 Haggerty Hall
Freeway Work Zone Lane Capacity
 Freeway Work Zone Lane Capacity Thomas Notbohm, P.E. Wisconsin Department of Transportation Thomas.Notbohm@dot.state.wi.us Alex Drakopoulos Department of Civil & Environmental Engineering Marquette University,
Standard Highway Sign Border Specifications
 Standard Highway Sign Border Specifications A Radius Radius B C SIGN SIZE SIGN SIZE Variable Radius B C SIGN SIZE BORDER WIDTHS A B C CORNER RADIUS 18 4 30 36 48 60.375.375.375 1.375.375.438 1.5.5.375.65
VIRGINIA S I-77 VARIABLE SPEED LIMIT SYSTEM FOR LOW VISIBILITY CONDITIONS
 VIRGINIA S I-77 VARIABLE SPEED LIMIT SYSTEM FOR LOW VISIBILITY CONDITIONS Christopher D. McDonald, PE, PTOE Regional Operations Director, Southwest Region NRITS and ITS Arizona Annual Conference October
Commonwealth of Pennsylvania PA Test Method No. 729 Department of Transportation October Pages LABORATORY TESTING SECTION. Method of Test for
 Commonwealth of Pennsylvania PA Test Method No. 729 Department of Transportation 14 Pages LABORATORY TESTING SECTION Method of Test for SAMPLING ROADWAY BITUMINOUS CONCRETE 1. SCOPE 1.1 This method covers
The Sunland Park flyover ramp is set to close the week of March 19 until early summer
 March 2, 2018 The Sunland Park flyover ramp is set to close the week of March 19 until early summer GO 10 is targeting the week of March 19 to close the Sunland Park Drive flyover entrance ramp to I 10
FAA Research on Runway Intersection Grading Criteria
 ENDURING VALUES. INSPIRED PERFORMANCE. FAA Research on Runway Intersection Grading Criteria Injun Song, Ph.D., P.E. November 3, 2016 2016 RPUG, Marriott San Diego Mission Valley Hotel San Diego, California,
TRAFFIC IMPACT STUDY. Platte Canyon Villas Arapahoe County, Colorado (Arapahoe County Case Number: Z16-001) For
 For") TRAFFIC IMPACT STUDY For Platte Canyon Villas Arapahoe County, Colorado (Arapahoe County Case Number: Z16-001) February 2015 Revised: August 2015 April 2016 July 2016 September 2016 Prepared for: KB Home
TRAFFIC IMPACT STUDY For Platte Canyon Villas Arapahoe County, Colorado (Arapahoe County Case Number: Z16-001) February 2015 Revised: August 2015 April 2016 July 2016 September 2016 Prepared for: KB Home
VHD Daily Totals. Population 14.5% change. VMT Daily Totals Suffolk 24-hour VMT. 49.3% change. 14.4% change VMT
 6.9 Suffolk 6-54 VMT Population and Travel Characteristics Population 14.5% change 2014 1,529,202 VHD Daily Totals 2014 251,060 49.3% change 2040 1,788,175 2040 374,850 VMT Daily Totals 2014 39,731,990
Preliminary Hydraulic Report
 Tarrant County, Texas Preliminary Hydraulic Report Prepared for: Texas Department of Transportation Fort Worth District Prepared by: AECOM Corporation Scott C. Williams, P.E. No. 101334, Date 2009 This
West Tennessee Construction June 14-21, 2017
 FOR IMMEDIATE RELEASE Wednesday, June 14, 2017 CONTACT: Nichole Lawrence CELL: 731-225-6041 West Tennessee Construction June 14-21, 2017 BENTON COUNTY, I-40 Truck Climbing Lane Wednesday, June 7 through
Using GIS to Determine Goodness of Fit for Functional Classification. Eric Foster NWMSU MoDOT
 Using GIS to Determine Goodness of Fit for Functional Classification Eric Foster NWMSU MoDOT Northwest Missouri State Masters of GIScience Degree Program University All Online Coursework Missouri Department
Best Practices and Techniques for Clearing Intersection Layouts
 Research for winter highway maintenance Manual of Best Practices and Techniques for Clearing Intersection Layouts Prepared by: Yan Qi (Southern Illinois University Edwardsville) Dave Bergner (Monte Vista
OREGON DEPARTMENT OF TRANSPORTATION STATEWIDE ROAD, WEATHER AND INCIDENT CONDITIONS 4/22/2019 4:20:05 AM
 OREGON DEPARTMENT OF TRANSPORTATION STATEWIDE ROAD, WEATHER AND INCIDENT CONDITIONS Incidents/: 4/22/2019 4:20:05 AM HWY372 22 22 Mount Bachelor Ski Area I-5 10 13 5 Mi S of Ashland Informational only
APPENDIX D SUMMARY OF EXISTING SIMPLIFIED METHODS
 APPENDIX D SUMMARY OF EXISTING SIMPLIFIED METHODS D-1 An extensive literature search revealed many methods for the calculation of live load distribution factors. This appendix will discuss, in detail,
NATHAN HALE HIGH SCHOOL PARKING AND TRAFFIC ANALYSIS. Table of Contents
 Parking and Traffic Analysis Seattle, WA Prepared for: URS Corporation 1501 4th Avenue, Suite 1400 Seattle, WA 98101-1616 Prepared by: Mirai Transportation Planning & Engineering 11410 NE 122nd Way, Suite
Bruce Freeman Rail Trail
 Functional Design Report Bruce Freeman Rail Trail Station Road to Concord Town Line Sudbury, Massachusetts PREPARED FOR Town of Sudbury Planning and Community Development 287 Old Sudbury Road Sudbury,
The last three sections of the main body of this report consist of:
 Threatened and Endangered Species Geological Hazards Floodplains Cultural Resources Hazardous Materials A Cost Analysis section that provides comparative conceptual-level costs follows the Environmental
Weather Responsive Traffic Management. Wyoming DOT Variable Speed Limit (VSL) Project. March 2012
 Project. March 2012") Weather Responsive Traffic Management Wyoming DOT Variable Speed Limit (VSL) Project March 2012 I-80 Background Information >50% of I-80 traffic in Wyoming is commercial vehicles Rural AADT 11,000 vehicles
Weather Responsive Traffic Management Wyoming DOT Variable Speed Limit (VSL) Project March 2012 I-80 Background Information >50% of I-80 traffic in Wyoming is commercial vehicles Rural AADT 11,000 vehicles
MINNESOTA DEPARTMENT OF TRANSPORTATION OFFICE OF LAND MANAGEMENT SURVEYING AND MAPPING SECTION PHOTOGRAMMETRY UNIT
 JULY 1, 2001 MINNESOTA DEPARTMENT OF TRANSPORTATION OFFICE OF LAND MANAGEMENT SURVEYING AND MAPPING SECTION PHOTOGRAMMETRY UNIT SPECIAL PROVISIONS FOR: GROUP 3: DIGITAL TERRAIN MODEL/DIGITAL ELEVATION
Snow and Ice Control POLICY NO. P-01/2015. CITY OF AIRDRIE Snow and Ice Control Policy
 Page 1 CITY OF AIRDRIE Snow and Ice Control Effective Date: Approved By: Approved On: March 17, 2015 City Council March 16, 2015 Revision Date: Resolution #: ------ PURPOSE: The City of Airdrie is responsible
Weather Responsive Traffic Management. WYDOT VSL Project. October 2011
 Weather Responsive Traffic Management Portland, OR WYDOT VSL Project October 2011 Variable Speed Limits I 80 Background Information >50% of I 80 traffic in Wyoming is commercial vehicles Rural AADT 11,000
1 h. Page 1 of 12 FINAL EXAM FORMULAS. Stopping Sight Distance. (2 ) N st U Where N=sample size s=standard deviation t=z value for confidence level
 N st U Where N=sample size s=standard deviation t=z value for confidence level") Page 1 of 12 FINAL EXAM FORMULAS Stopping Sight Distance 2 2 V V d 1.47Vt 1.075 i f a 2 2 Vi Vf d 1.47Vt 30( f 0.01 G) Where d = distance (ft) V = speed (mph) t = time (sec) a=deceleration rate (ft/sec
Page 1 of 12 FINAL EXAM FORMULAS Stopping Sight Distance 2 2 V V d 1.47Vt 1.075 i f a 2 2 Vi Vf d 1.47Vt 30( f 0.01 G) Where d = distance (ft) V = speed (mph) t = time (sec) a=deceleration rate (ft/sec
Chapter 5 Traffic Flow Characteristics
 Chapter 5 Traffic Flow Characteristics 1 Contents 2 Introduction The Nature of Traffic Flow Approaches to Understanding Traffic Flow Parameters Connected with Traffic Flow Categories of Traffic Flow The
US 169/I-70 North Loop Planning & Environmental Linkages Study
 US 169/I-70 North Loop Planning & Environmental Linkages Study VISSIM Calibration Document Draft April 13, 2018 Page i Table of Contents 1. Overview... 1 2. Data Types... 2 3. Model Parameter Adjustments...
SECTION 7 RAMP TERMINAL SIGNS
 SECTION 7 Part 3: Motorways and Expressways CONTENTS Reference Page Page Number Date SECTION 7: 7.1 GENERAL... 7-1 7.2 SIGN COLOUR... 7-1 7.3 MOTORWAY AND EXPRESSWAY NAMING... 7-1 7.4 ADVANCE DIRECTION
March Grade Crossing Analysis
 March 2014 Grade Crossing Analysis T E C H N I C A L M E M O R A N D U M South Florida Freight and Passenger Rail Enhancement Study Phase 1A - Rehabilitate Existing Northwood Connection; FPID: 434948-1
Active Traffic & Safety Management System for Interstate 77 in Virginia. Chris McDonald, PE VDOT Southwest Regional Operations Director
 Active Traffic & Safety Management System for Interstate 77 in Virginia Chris McDonald, PE VDOT Southwest Regional Operations Director Interstate 77 at Fancy Gap Mountain Mile markers 0-15 Built in late
I-10 East at Redd closes for 24 hours this Sunday, Feb 11. Then, I-10 West at Resler closes for 27 hours on Feb 25
 NEWS RELEASE a TxDOT Project For immediate release EL PASO DISTRICT Jennifer Wright (915) 790-4340 Jennifer.Wright3@txdot.gov February 9, 2018 I-10 East at Redd closes for 24 hours this Sunday, Feb 11
FDOT Level 2 Roundabout b/c Evaluation
 FDOT Level 2 Roundabout b/c Evaluation This spreadsheet tool compares the cost of a roundabout to the cost of a traditional intersection, as specified by the user. A traditional intersection is defined
MIAMI-DADE TRANSPORTATION PLANNING ORGANIZATION TRANSPORTATION IMPROVEMENT PROGRAM REGIONALLY SIGNIFICANT TRANSPORTATION IMPROVEMENTS
 DT2511563 2511563 FROM PORT OF MIAMI PORT OF MIAMI TUNNEL TO SR 836/I-395 0.5 NEW ROAD CONSTRUCTION $2,514,664 $790,186 - DESIGN/BUILD LF 2,766 2,849 2,935 3,023 3,113 DESIGN/BUILD GMR 22,152 22,990 24,338
MADISON, WI STONE HOUSE DEVELOPMENT 1000 E. WASHINGTON AVENUE REDEVELOPMENT TRANSPORTATION STUDY DECEMBER 14, 2015
 MADISON, WI STONE HOUSE DEVELOPMENT 1000 E. WASHINGTON AVENUE REDEVELOPMENT TRANSPORTATION STUDY DECEMBER 14, 2015 TABLE OF CONTENTS... 3 Proposed Development... 3 Methodology... 3 Phase 1 Development...
Colorado Department of Transportation Structure Inspection and Inventory Report (English Units)
") 10/23/2017 Header Information Colorado Department of Transportation Structure Inspection and Inventory Report (English Units) Bridge Name: D-02-PR-030A Inspection Date: 12/2/2015 Sufficiency Rating: Inspection
10/23/2017 Header Information Colorado Department of Transportation Structure Inspection and Inventory Report (English Units) Bridge Name: D-02-PR-030A Inspection Date: 12/2/2015 Sufficiency Rating: Inspection
FY 2010 Continuing i Planning Program Product Report. Local Transportation and Traffic Data. Wood-Washington-Wirt Interstate Planning Commission
 FY 2010 Continuing i Planning Program Product Report Local Transportation and Traffic Data Travel Time and Delay Data for Belpre and Marietta, Ohio Wood-Washington-Wirt Interstate Planning Commission CONTINUING
Technical Memorandum #2 Future Conditions
 Technical Memorandum #2 Future Conditions To: Dan Farnsworth Transportation Planner Fargo-Moorhead Metro Council of Governments From: Rick Gunderson, PE Josh Hinds PE, PTOE Houston Engineering, Inc. Subject:
PLAZA MEXICO RESIDENCES
 PLAZA MEXICO RESIDENCES TRAFFIC STUDY PREPARED FOR: 3000 E. IMPERIAL, LLC. 6940 Beach Boulevard, D-501 Buena Park, California 90621 PREPARED BY: OCTOBER 5, 2017 translutions the transportatio n solutions
CITY OF ORILLIA POLICY MANUAL. Winter Operations. Table of Contents. WINTER CONTROL Objectives 2. WINTER CONTROL Season 3
 Page 1 of 12 Winter Operations Table of Contents WINTER CONTROL Objectives 2 WINTER CONTROL Season 3 SNOW ACCUMULATION Road Plowing 4,5 ICY ROADWAYS Application of Deicers/Abrasives 6 SNOW ACCUMULATION
TRANSPORTATION AND TRAFFIC ANALYSIS REPORT
 Square One Drive Extension Municipal Class Environmental Assessment Environmental Study Report Appendix B Transportation and Traffic Analysis Report TRANSPORTATION AND TRAFFIC ANALYSIS REPORT FINAL DRAFT
PROPOSED PROJECT. Section PROJECT DESCRIPTION
 1 2 3 4 5 6 7 8 9 10 11 12 13 14 15 16 17 18 19 20 21 22 23 24 25 26 27 28 29 30 31 32 33 34 35 36 37 38 39 40 41 42 43 1.1 PROJECT DESCRIPTION This Environmental Assessment describes the proposed improvements
Travel Demand Management Plan
 Travel Demand Management Plan Tryg s & Apartment Building 8 West Lake Street Minneapolis, MN AUTHORIZED PROPERTY REPRESENTATIVE: By Dated: Mr. Johnny Carlson Trammell Crow Chicago Development, Inc. 5 South
TRAFFIC STUDY FOR THE GAFFEY POOL PROJECT LOS ANGELES, CALIFORNIA CITY OF LOS ANGELES, BUREAU OF ENGINEERING OCTOBER 2013 PREPARED FOR PREPARED BY
 TRAFFIC STUDY FOR THE GAFFEY POOL PROJECT LOS ANGELES, CALIFORNIA OCTOBER 2013 PREPARED FOR CITY OF LOS ANGELES, BUREAU OF ENGINEERING PREPARED BY DRAFT TRAFFIC STUDY FOR THE GAFFEY POOL PROJECT October
Project Level Traffic Forecast Report Business 40 Reconstruction Study Forsyth County
 Project Level Traffic Forecast Report Business 40 Reconstruction Study Forsyth County TIP No. U-2827 B WBS # 34872.1.1 June 2013 Prepared for North Carolina Department of Transportation Prepared by Project
DISTRICT ATLANTA 3004 BOWIE US STP 2012(053) $ 4,495, NO AWARD
 $ 4,495, NO AWARD") HIGHWAY AND TRANSPORTATION ENHANCEMENT BUILDING CONSTRUCTION CONTRACTS PAGE 1 DISTRICT ATLANTA 3004 BOWIE US 67 0010-11-068 STP 2012(053) 110.500 $ 4,495,000.00 5-12.80 NO AWARD CONTRACTOR: CLARK CONSTRUCTION
HIGHWAY AND TRANSPORTATION ENHANCEMENT BUILDING CONSTRUCTION CONTRACTS PAGE 1 DISTRICT ATLANTA 3004 BOWIE US 67 0010-11-068 STP 2012(053) 110.500 $ 4,495,000.00 5-12.80 NO AWARD CONTRACTOR: CLARK CONSTRUCTION
CE351 Transportation Systems: Planning and Design
 CE351 Transportation Systems: Planning and Design TOPIC: HIGHWAY USERS PERFORMANCE (Part III) 1 ANOUNCEMENT Updated d Schedule on: http://wiki.cecs.pdx.edu/bin/view/main/slidesce 351 Course Outline Introduction
COUNCIL POLICY MANUAL
 COUNCIL POLICY MANUAL SECTION: PUBLIC WORKS SUBJECT: SNOW & ICE CONTROL POLICY 2012/2013 GOAL: Pages: 1 of 10 Approval Date: Dec. 3, 2012 Res. # 1001/2012 To annually identify the winter maintenance costs
MEMORANDUM (DRAFT) DRAFT
 DRAFT") 117 Commercial St. NE, Suite 310 Salem, OR 97301 503.391.8773 www.dksassociates.com MEMORANDUM (DRAFT) DATE: February 15, 2017 TO: FROM: SUBJECT: Alex Dupey, MIG Scott Mansur, PE, PTOE; Garth Appanaitis,
117 Commercial St. NE, Suite 310 Salem, OR 97301 503.391.8773 www.dksassociates.com MEMORANDUM (DRAFT) DATE: February 15, 2017 TO: FROM: SUBJECT: Alex Dupey, MIG Scott Mansur, PE, PTOE; Garth Appanaitis,
GIS ANALYSIS METHODOLOGY
 GIS ANALYSIS METHODOLOGY No longer the exclusive domain of cartographers, computer-assisted drawing technicians, mainframes, and workstations, geographic information system (GIS) mapping has migrated to
Traffic Impact Analysis. for the STARBUCKS STORE. Located at 9900 BALBOA BOULEVARD. Submitted to CITY OF LOS ANGELES. January 2017.
 Traffic Impact Analysis for the STARBUCKS STORE Located at 9900 BALBOA BOULEVARD Submitted to CITY OF LOS ANGELES January 2017 Submitted By January 5, 2017 Ken A. Aitchison, P.E. Transportation Engineering
12"CMP DIA. ELEV. PVC CI DI CMP VCP RCP RCAP LRCP LCPP STA. LA LB BM-2 ROW PI POT LF TH PVC
 PLANS FOR X-REFS: FILE PATH: Z:\WEST BRANCH 3682 MAIN STREET SIDEWALK IMPROVEMENTS - PHASE 3\DRAWINGS\_PRODUCTION DRAWINGS\TITLE & INDEX PLOTTED: Thursday, May 26, 216 4:7:42 PM MAIN STREET SIDEWALK PHASE
Vehicle Motion Equations:
 1 Vehicle Motion Equations: v = at + v (2.2.4) x x = v2 2 v 2a (2.2.6) v 2 = v 2 + 2a(x x ) (2.2.6) x = 1 2 at2 + v t + x (2.2.7) D b = x cos α (2.2.10) x = vt D b = v 2 v 2 2g(f G) (2.2.14) e + f s =
CHAPTER 3. CAPACITY OF SIGNALIZED INTERSECTIONS
 CHAPTER 3. CAPACITY OF SIGNALIZED INTERSECTIONS 1. Overview In this chapter we explore the models on which the HCM capacity analysis method for signalized intersections are based. While the method has
Information for File MVP RMM
 Information for File MVP-2013-03320-RMM Applicant: City of St. Cloud Corps Contact: Ryan Malterud Address: 180 Fifth Street East, Suite 700, St. Paul, MN 55101 E-Mail: Ryan.M.Malterud@usace.army.mil Phone:
CITY OF CAPE CORAL STORMWATER MASTER PLAN PHASE II - PART 1 BASINS 4, 10, & 14 SUB-BASIN DRAINAGE IMPROVEMENTS HYDRAULIC ANALYSIS SUMMARY
 CITY OF CAPE CORAL STORMWATER MASTER PLAN PHASE II - PART 1 BASINS 4, 10, & 14 SUB-BASIN DRAINAGE IMPROVEMENTS HYDRAULIC ANALYSIS SUMMARY Cape Coral, FL Prepared for: The City of Cape Coral Public Works
To convert a speed to a velocity. V = Velocity in feet per seconds (ft/sec) S = Speed in miles per hour (mph) = Mathematical Constant
 S = Speed in miles per hour (mph) = Mathematical Constant") To convert a speed to a velocity V S ( 1.466) V Velocity in feet per seconds (ft/sec) S Speed in miles per hour (mph) 1.466 Mathematical Constant Example Your driver just had a rear-end accident and says
To convert a speed to a velocity V S ( 1.466) V Velocity in feet per seconds (ft/sec) S Speed in miles per hour (mph) 1.466 Mathematical Constant Example Your driver just had a rear-end accident and says
Factors Affecting the Severity of Injuries Sustained in Collisions with Roadside Objects
 Factors Affecting the Severity of Injuries Sustained in Collisions with Roadside Objects Presenter: Ashirwad Barnwal Adviser: Dr. Peter T. Savolainen Source: clipartbest.com 1 Overview Background Research
FY 2018 Ten Year Capital Plan Review Project List
 FY 2018 Ten Year Capital Plan Review Project List Program Category FY2018 FY2019 FY2020 FY2021 FY2022 FY2023 FY2024 FY2025 FY2026 FY2027 Highway Roadway/Safety 100,950,000 128,431,766 125,896,635 91,153,571
Fundamentals of Algebra, Geometry, and Trigonometry. (Self-Study Course)
") Fundamentals of Algebra, Geometry, and Trigonometry (Self-Study Course) This training is offered eclusively through the Pennsylvania Department of Transportation, Business Leadership Office, Technical
Fundamentals of Algebra, Geometry, and Trigonometry (Self-Study Course) This training is offered eclusively through the Pennsylvania Department of Transportation, Business Leadership Office, Technical
Sample Plan. Sample Plan ALIGNMENT PLAN AND TABULATION NARRATIVE ALIGNMENT PLAN AND TABULATION CHECKLIST.
 Sample Plan Sample Plan AND TABULATION --------- NARRATIVE AND TABULATION --------- HEKLIST. Alignment point numbers and/or curve names REVISION DATE 0/05/2 References: Design Scene: hapter 7 - Alignment
Effect of Environmental Factors on Free-Flow Speed
 Effect of Environmental Factors on Free-Flow Speed MICHAEL KYTE ZAHER KHATIB University of Idaho, USA PATRICK SHANNON Boise State University, USA FRED KITCHENER Meyer Mohaddes Associates, USA ABSTRACT
April 10, Mr. Curt Van De Walle, City Manager City of Castle Hills 209 Lemonwood Drive Castle Hills, Texas 78213
 Mr. Curt Van De Walle, City Manager City of Castle Hills 209 Lemonwood Drive Castle Hills, Texas 78213 Subject: Revised Castle Hills BASIS Charter School Traffic Impact Analysis Review City of Castle Hills,
CITY OF NEW LONDON WINTER ROAD & SIDEWALK MAINTENANCE POLICY
 CITY OF NEW LONDON WINTER ROAD & SIDEWALK MAINTENANCE POLICY GENERAL The purpose of this policy is to set up acceptable procedures and policies for the winter maintenance of public areas in the City of
NORTH HOUSTON HIGHWAY IMPROVEMENT PROJECT (NHHIP)
") NORTH HOUSTON HIGHWAY IMPROVEMENT PROJECT (NHHIP) Project Overview Briefing Packet September 2015 RECOMMENDED ALTERNATIVES Environmental Impact Statement (EIS) Project Divided into 3 Segments Segment 1:
NORTH HOUSTON HIGHWAY IMPROVEMENT PROJECT (NHHIP) Project Overview Briefing Packet September 2015 RECOMMENDED ALTERNATIVES Environmental Impact Statement (EIS) Project Divided into 3 Segments Segment 1:
MODELING OF 85 TH PERCENTILE SPEED FOR RURAL HIGHWAYS FOR ENHANCED TRAFFIC SAFETY ANNUAL REPORT FOR FY 2009 (ODOT SPR ITEM No.
 MODELING OF 85 TH PERCENTILE SPEED FOR RURAL HIGHWAYS FOR ENHANCED TRAFFIC SAFETY ANNUAL REPORT FOR FY 2009 (ODOT SPR ITEM No. 2211) Submitted to: Ginger McGovern, P.E. Planning and Research Division Engineer
2015 North Dakota Asphalt Conference
 2015 North Dakota Asphalt Conference NDDOT Implementation of AASHTO Flexible Pavement Design Part I ADT & ESALs Nickie Reis, P&AM Part II Structural Numbers Tom Bold, M&R March 31 - April 1, 2015 Part
CONTINUING PLANNING PROGRAM LOCAL TRANSPORTATION AND TRAFFIC DATA PRODUCT REPORT [OH Corridors]
![CONTINUING PLANNING PROGRAM LOCAL TRANSPORTATION AND TRAFFIC DATA PRODUCT REPORT [OH Corridors]](/thumbs/94/120123757.jpg "CONTINUING PLANNING PROGRAM LOCAL TRANSPORTATION AND TRAFFIC DATA PRODUCT REPORT [OH Corridors]") CONTINUING PLANNING PROGRAM LOCAL TRANSPORTATION AND TRAFFIC DATA PRODUCT REPORT [OH Corridors] Travel Time and Delay Analysis for Belpre (OH) and Marietta (OH) Fiscal Year 2009 Report WOOD WASHINGTON
CONTINUING PLANNING PROGRAM LOCAL TRANSPORTATION AND TRAFFIC DATA PRODUCT REPORT [OH Corridors] Travel Time and Delay Analysis for Belpre (OH) and Marietta (OH) Fiscal Year 2009 Report WOOD WASHINGTON
US 20 Highway Safety Study
 US 20 Highway Safety Study Corvallis City Limits to Springhill Road, Albany Prepared for Prepared by December 2016 US 20 HIGHWAY SAFETY STUDY FINAL REPORT Benton County, Oregon Prepared for: Oregon Department