I-95/I-85 INTERCHANGE ROADWAY SAFETY ASSESSMENT
|
|
|
- Wesley Ford
- 6 years ago
- Views:
Transcription


1 FINAL REPORT I-95/I-85 INTERCHANGE ROADWAY SAFETY ASSESSMENT Prepared for: Prepared by: B MARCH 2013
2 Final Report March 2013 I-95/I-85 Interchange ROADWAY SAFETY ASSESSMENT Prepared for: Prepared by:
3 I-95/I-85 Interchange EXECUTIVE SUMMARY INTRODUCTION Interstates 95 and 85, as well as Route 460 and US 301, converge in Petersburg, Virginia in a complex series of interchanges developed in the mid-1950 s as part of the Richmond-Petersburg Turnpike. These interchanges have several features that create safety and operational challenges, which may have met design standards in the 1950 s, but are deficient by current design standards. Examples of such features include short acceleration/deceleration lanes, tight turns, low-speed curves, and short weave/merge areas. A comprehensive planning study was conducted in the study area between 1998 and 2000 and identified a number of capacity and safety issues. The study recommendations are documented in the final report, Final Report: I-85/95/Route 460 Interchange Study dated December, Since the initial study was completed, there has been significant traffic growth in the area due to the expansion of Fort Lee from the BRAC realignment as well as increased long distance traffic on I-95 and I-85. Additionally, the Route 460 Corridor Improvements Project is planned to connect to I-85, and is projected to significantly impact traffic in this interchange area. This roadway safety assessment study is intended to be the first phase of an eventual larger I-95/I-85/Route 460 Interchange Area operations and conceptual design study that will update the aforementioned 2000 planning study using the latest available information and will consider the recent changes in traffic patterns and growth in the area. This study is a cooperative effort between the Virginia Department of Transportation (VDOT), the Crater Planning District Commission (CPDC), and Tri-Cities Metropolitan Planning Organization (MPO). STUDY AREA The study area includes two study corridors, an 8-mile segment of I-95 and a 1-mile segment of I-85 near Petersburg and Colonial Heights, Virginia. The overall study area is illustrated in Figure EX-1. The I-95 study corridor includes 8 interchanges with a northern limit 1,000 feet north of the Temple Avenue interchange (Exit 54) and a southern limit 1,000 feet south of the Rives Road interchange (Exit 47). The I-85 study corridor is approximately one mile in length and extends from the I-95/I-85 interchange (Exit 51) to the Sycamore Street overpass. With the exception of the I-95 junction, there are no interchanges on the I-85 study corridor. STUDY PROCESS The study process included data collection, crash analysis, field reviews, and the development of safety related improvements within the study area. The development of improvements focused on addressing the identified safety issues in the study area. An analysis of traffic operations was not conducted as part of this study; however, the previous I-95/I-85/Route 460 Interchange Study (conducted in 2000), which included a comprehensive operational analysis, was reviewed and its findings and recommendations considered throughout this study. In addition to the RSA assessment, VDOT requested the study team review safety issues at the following three areas of interest within the study area and propose mitigation measures. 1. Rives Road Interchange at I-95 (Exit 47) 2. The I-95 Southbound Off-Ramp to Washington Street (Exit 52) 3. The I-85 Northbound Off-Ramp to I-95 Southbound (Exit 68) I

4 I-95/I-85 Interchange I
5 I-95/I-85 Interchange The study team conducted a meeting with the following stakeholders to discuss and gain input on the proposed recommendations: Virginia Department of Transportation (VDOT) Tri-Cities Metropolitan Planning Organization (MPO) City of Petersburg Federal Highway Administration (FHWA) EXISTING CONDITIONS The consultant team collected existing condition information in the study area by conducting field inventories and by obtaining historical crash, speed, and traffic count data from VDOT. The results of the existing conditions analyses were used as a basis for identifying safety issues and confirm the need for this study and future study efforts within the study area. TRAFFIC VOLUMES Daily traffic volumes for the I-95 and I-85 study corridors were derived from the 2010 VDOT published traffic counts. Based on the 2010 VDOT published traffic counts, I-95 carries approximately 96,000 vehicles per day on the north end of the corridor (Temple Road) and approximately 31,000 vehicles per day on the south end of the corridor (Rives Road). The highest traffic volumes on the I-95 study corridor are found between the Southpark Boulevard and Washington Street interchanges with approximately 101,000 vehicles per day. Truck percentages range from 10 to 15 percent on the I-95 study corridor. The I-85 study corridor carries approximately 54,000 vehicles per day with 13 to 14 percent trucks. SPEED DATA Existing speed data for the I-95 and I-85 study corridors was collected from three of VDOT s count stations located throughout the study area. This data, in addition to field reviews, was used to measure the level of congestion during the peak periods. Traffic counts included with the speed data were used to verify the peak periods. Speed data was analyzed to determine the average daily speed, average speed during the peak periods, and the 85th percentile speeds. The following conclusions were drawn based on an analysis of this data. The AM peak period extends from approximately 6:00 AM to 9:00 AM and the PM peak period extends from approximately 3:00 PM to 6:00 PM for both study corridors. I-95 Corridor On both ends of the I-95 study corridor the 85th percentile speed, in both directions, fell between 60 and 65 mph, which is above the posted speed limit of 55 mph on the north end and below the posted speed limit of 65 mph on the south end. On the northern end of the I-95 corridor there was little variation (± 5 mph) from the posted speed limit during the peak periods; however, on the southern end of the corridor the peak period speeds range between 55 and 60 mph, which is 10 mph less than the posted speed limit. I-85 Corridor On I-85 the 85th percentile speed in both directions fell between 65 and 70 mph, which is above the posted speed limit of 60 mph. On I-85 there was little variation (± 5 mph), from the posted speed limit during the peak periods. II
6 I-95/I-85 Interchange CRASH ANALYSIS Crash data was collected for a 3-year period, from January 1, 2007 through December 31, 2009, for both the I-95 and I-85 study corridors. The following crash trends were identified. The total number of reported crashes during 3 years was 405 with 135 (33%) of them resulting in injuries. Overall, injury, and fatal crash rates for the study corridors were less than the most recent published (2007) crash rates for statewide urban interstates. The exception is the fatal crash rate of 0.8 crashes per 100 million vehicle miles traveled (VMT) on I-95 southbound, which is 35% higher than the statewide interstate crash rate of 0.5 crashes per 100 million VMT. The current study corridors crash rates (calculated using data from 2007 to 2009) were compared to the crash rates calculated in the I-85/I-95/Route 460 Interchange Study from 2000 (calculated from 1996 to 1998) and show a reduction in the overall, injury, and fatal crash rates. Although the limits of the two studies were different; a comparison of the crash rates shows a downward trend through the study area. The primary crash type for both the I-95 and I-85 study corridors was fixed-object off-road, which is a prominent crash type on interstates. Sixty-four percent (64%) of the 152 roadway departure crashes in the study area (both study corridors) were to the left and 36% occurred to the right. The second highest crash type for the I-95 study corridor (including the collector-distributor roads and ramps) was rear end, which is an indication of possible traffic congestion, variable travel speeds, short deceleration and acceleration lane lengths, and inadequate ramp configurations. The highest number of reported crashes occurred at the Temple Avenue interchange. The on- and off-ramps at the interchange had a combined total of 28 crashes. Approximately 48% of all crashes occurred during AM and PM peak periods. Approximately 30% of the crashes occurred during dark conditions, which is often found in corridors without continuous roadway lighting. Of those crashes, 71% were reported as occurring on a segment of roadway without lighting. Crash histograms, developed on a half-mile basis, were used by the study team to identify high-crash locations or crash hot spots within the study corridor. The top three hot spots were near the Temple Avenue (northbound direction), Southpark Boulevard (southbound direction), and Washington/Wythe Street (southbound direction) interchanges. There were no crash hotspots identified in either direction on I-85. GEOMETRIC DEFICIENCIES Geometric data for various roadways in the study area was reviewed and tabulated. Each element was compared to AASHTO A Policy on Geometric Design of Highways and Streets standards. This section of I-95/I-85 was initially constructed in the late-1950s resulting in geometric conditions not meeting current design standards. The following key roadway deficiencies, which currently negatively impact operations and safety in the corridor, were documented: Thirteen of the 16 (81%) study segments do not meet the recommended one mile minimum spacing between interchanges on an urban interstate. Closely spaced interchanges within an urban area create friction and turbulence, which can result in increased congestion, bottlenecks, and corresponding crashes. Eleven of the 31 (35%) acceleration/deceleration lane lengths are deficient and do not meet current standards. Specifically, 8 of the 11 (73%) are deficient acceleration lanes and 3 of the 11 (27%) are deficient deceleration lanes. There are 14 overhead sign structures with unlit signs throughout the I-95 study corridor. Eight of the 9 bridges crossing over mainline I-95 and I-85 do not meet the 16.5-foot minimum bridge vertical clearance for urban interstates. III
7 I-95/I-85 Interchange The I-95 northbound to I-85 southbound, an interstate-to-interstate connection, is signed with a 25 mph advisory speed and a truck rollover warning sign. The I-85 northbound to I-95 southbound ramp, an interstate-to-interstate connection with a significant number of heavy vehicles, is controlled with a yield condition on a steep uphill grade and must yield to traffic exiting I-95 southbound. PROPOSED IMPROVEMENTS CORRIDOR-WIDE IMPROVEMENTS Many of the safety issues observed along the study corridor were not localized to a single segment of roadway and, as a result, several corridor-wide improvements were recommended. The goal was to relate crash trends and deficiencies identified during the study process with improvements that will reduce crashes and risk throughout the corridor. Rumble Strips: The existing crash pattern of roadway departure crashes along the study corridor justifies the corridor-wide installation of rumble strips along I-95 and I-85 on both the right and left shoulders where they do not currently exist. Median Barrier: Due to the prevalence of roadway departure crashes to the left in roadway segments with median barriers, a corridor-wide assessment of traffic barriers is recommended. The study should assess the barrier design as it impacts vehicle deflection and the main travel way safety during crashes. It is recommended that reflectors be installed on the median barrier in locations were they do not currently exist, especially in locations where there are a significant number of crashes in dark conditions. Pavement Markings: The installation of 6 wide pavement markings and in-pavement reflectors will improve visibility in the corridor and reduce the risk of crashes related to dark driving conditions, wet driving conditions and ultimately help reduce the number of roadway departure and sideswipe crashes. Guardrail: A comprehensive guardrail assessment should be performed for the study corridor to identify areas where the guardrail should be upgraded to meet current VDOT standards and specifications. The guardrail should be upgraded or repaired as necessary, preferably in conjunction with other planned interstate maintenance projects. Corridor Signing: The I-95 and I-85 study corridors have a numerous guide signs due to the complex configurations of the interchanges and associated CD roads. Proliferation of signs can reduce effectiveness of the information to be relayed and unnecessary signs should be removed. There are not enough crashes to warrant the existing Deer Crossing Warning (W11-13) signs and Slippery When Wet Warning (W8-5) signs; therefore, they should be removed. Install lighting on 14 overhead signs currently not lit. The 2009 MUTCD states that overhead signs should be lit unless there is an engineering study conducted that concludes lighting is not necessary. The I-95 southbound loop off-ramp to Wagner Road East does not have a Horizontal Alignment (W1-15) sign or an Advisory Exit and/or Ramp Speed (W13-2, W13-3) warning sign. The ballbank/limiting angle method as defined in the VDOT Traffic Engineering Memorandum (TE-363) should be conducted to determine if warning signs are warranted to be installed at this location. IV
8 I-95/I-85 Interchange Replace the nonfunctioning continuous flashing beacons on the Truck Rollover Warning (W1-13) sign on the I-95 northbound off-ramp to I-85 southbound. Bridge Vertical Clearances: Eight of the 9 bridge structures on the study corridors are vertically deficient and do not meet the minimum clearance requirement of 16.5 feet; thereby, creating potential hazards. There were a total of 19 reported bridge strikes located within the study corridor in a 13-year period. Short-Term: Install Low Clearance with Arrows (W12-2) warning signs displaying the existing bridge heights on the 8 bridges with deficient vertical clearance. Install low bridge warning systems on the northbound and southbound I-95 approaches to the study area to advise drivers of over height vehicles to take an alternate route. Long-Term: Replace bridge and/or overhead sign structures to meet minimum vertical clearance height requirements. Corridor-Wide Operations Study: A corridor-wide operational analysis is recommended to identify the impacts of short interchange spacing and deficient acceleration/deceleration lanes have on corridor-wide operations. Such a study could be used to further justify the need for future long-term improvements throughout the I-95 study corridor. Acceleration/Deceleration Lanes: Lengthen deficient acceleration/deceleration lanes to meet AASHTO standards. Pavement: The middle segment of the corridor was not paved during the same timeframe as the adjacent segments leaving some inconsistent pavement sections. Based on discussions with VDOT, the study corridors are not currently on a paving schedule; however, it is recommended that the entire corridor be paved to improve roadway visibility and drivability. In addition, drainage, rumble strips, striping and in pavement reflectors should also be assessed and potentially upgraded at this time. Corridor Lighting: Conduct a corridor-wide lighting warrant study and install additional lighting as appropriate. VDOT should also consider the addition of underbridge lighting systems for bridges in the corridor as an additional safety measure. AREA OF INTEREST: RIVES ROAD INTERCHANGE Rives Road is currently in the design phase to be widened from US 301 to the I-95 interchange. A traffic study was conducted as part of the widening project. Findings of the Rives Road at I-95 Traffic Study conducted as part of the current widening project concluded that the following improvements addressed intersection delays and queues for the projected design year (2036) traffic volumes. The improvements below are being included in the Rives Road widening project currently in the design stage at the time of this study: Construct southbound right-turn lane with 500 storage and a 200 taper at the intersection of Rives Road at I-95 southbound; Construct northbound right-turn lane with 200 storage and 200 taper at the intersection of Rives Road at I-95 Northbound; Junction boxes and conduit for a potential future signal at the intersection of Rives Road at I-95 Southbound will be constructed as part of the Rives Road widening; and V
9 I-95/I-85 Interchange VDOT should monitor the intersections of Rives Road at I-95 southbound and Rives Road at I-95 northbound to determine when/if traffic signal warrants are met. The operational analysis conducted as part of this study was done using updated 2012 traffic volumes and 2035 traffic volumes developed using growth rates from the latest Richmond/Tri-Cities Regional travel demand model. Developing long-term solutions at the I-95/Rives Road interchange were not included in the scope of this study; however, the results of the operational analysis indicate long-term improvements will be necessary should traffic in the area be realized as projected. AREA OF INTEREST: SOUTHBOUND I-95 OFF-RAMP TO WASHINGTON STREET The southbound I-95 ramp has been identified as a lane utilization issue for vehicles travelling west on Washington Street and vehicles merging onto Washington Street from the southbound I-95 ramp. There were several reported crashes related to lane maneuvers. Rear end crashes were also reported on the off-ramp approach to Washington Street. Due to the conflicts created from this merging condition, queues from the ramp routinely impact southbound I-95 during the PM peak hours. Queuing on an interstate, where vehicles are traveling at high speeds and drivers are not expecting to stop, is a major safety concern. The following phased approached was proposed to mitigate this safety issue. Short Term Recommendation Allow a free-flow movement from the southbound I-95 off-ramp onto Washington Street to reduce queuing on the ramp and impacts to the southbound I-95 mainlines. Reduce the number of lanes prior to the southbound I-95 off-ramp from four lanes to three lanes through the use of pavement markings across the overpass. Washington Street will operate adequately with 3 travel lanes. Close Madison Street and private driveways between the ramp and intersection, and eliminate the rightturn movements from Washington Street to improve access management on the corridor. This will also improve safety by reducing the weaving movements that were caused specifically by vehicles turning right on Madison Street. Long-Term Recommendation Monitor traffic patterns and weave issues on Washington Street, upstream and downstream of the intersection. Should it be determined that a weaving and safety issue still exists by the lane changes between the ramp and Jefferson Street, then an additional analysis should be completed. A possible solution for this issue would be to install traffic barrier to separate the ramp free-flow lane from Washington Street through traffic. A barrier would shift the weaving area further to the west and away from the ramp. Note that this would only become a feasible recommendation once a study determined that operations and safety between the ramp and Jefferson Street achieved acceptable levels. AREA OF INTEREST: RAMP FROM NORTHBOUND I-85 TO SOUTHBOUND I-95 The yield condition on the I-85 northbound off-ramp to I-95 southbound creates a safety issue due to the short weaving segment, steep uphill grade, and percent of heavy vehicles making this movement. Vehicles traveling from I-85 northbound to I-95 southbound are on a steep grade and must merge across the vehicles on the collector-distributor road exiting to Graham Road. The length of the weave segment is only 250 feet. A total of 12 crashes occurred 1/1/2007 to 12/31/2009. The number of crashes on this off-ramp has remained consistent based on a review of the previous I-85/I-95/Route 460 Interchange Study; from 1996 to 1998 a total of 10 crashes occurred on this ramp. VI
10 I-95/I-85 Interchange A yield sign with continuous flashing beacons exists on the right shoulder of the I-85 off-ramp; however, it was observed that vehicles merging from the I-85 off-ramp onto the I-95 CD road frequently failed to yield. VDOT installed the yield pavement markings (shark s teeth) as a short-term countermeasure; however, the safety concern still exists. The following phased approached was proposed to mitigate this safety issue. Short Term Recommendation Increase existing Yield Sign (R1-2) size to 60 x60 x60 to improve visibility of traffic control device. Long-Term Recommendation Reconfigure the I-95/I-85/Route 460 interchange to mitigate the deficient weaving movement at this location. A possible solution is provided in the Long-Term Concepts section of this study. ADDITIONAL SHORT-TERM IMPROVEMENTS AND LONG-TERM CONCEPTS The focus of this study was to conduct a roadway safety assessment; however, parallel VDOT efforts were conducted during the course of this study in anticipation of future efforts to identify additional short-term improvements and long-term concepts in the I-95/I-85/Route 460 Interchange area. Drawing from the previous 2000 study and the Tri-Cities MPO Constrained Long-Range Plan (CLRP) one short-term improvement and three long-term concepts were developed. The long-term concepts were included in this study to document the order of magnitude of projects required to meet future operational and safety needs in the area of the I-95/I-85/Route 460 interchange. These concepts will provide a starting point for future efforts to further identify and refine long-term concepts in the area. Planning level cost estimates for the short- and long-term projects ranged from $310,000 to $55,790,000 with a total of $67,040,000. NEED FOR CONTINUED STUDY AND NEXT STEPS There are a number of past, present, and/or future infrastructure projects/studies within the I-95/I-85/Route 460 study area. Specific efforts are listed below. As these efforts become real projects, it will be critical that VDOT continue to identify and refine short- and long-term solutions needed in the I-95/I-85 corridor to assure mobility throughout this growing and changing area. Final Report: I-85/95/Route 460 Interchange Study, 2000 Temple Avenue Interchange Modification Report (VDOT UPC 85623) Rives Road Widening project (VDOT UPC 15832) Growth and impacts at Fort Lee (on-going Fort Lee Joint Land Use Study (JLUS)) Route 460 Corridor Improvements Project Public-Private Partnership (PPTA) project The I-95/I-85 Interchange Study should be used as a planning tool to achieve the next steps of planning, programming, designing, and constructing the identified safety and operational improvements in the study corridor. Specific steps include: 1. VDOT should update the previous I-85/I-95/Route 460 Interchange Study and extend the study corridor and scope to include additional operational analysis. Identify projects from this updated study to prioritize and program regional needs. An example next step could be an interchange modification report (IMR) to advance an interchange project (some MPO s have been successful advancing IMR studies using Regional Surface Transportation Program (RSTP) funds). 2. VDOT should continue to study and refine the operational and environmental impacts of the recommended long-term concepts. This analysis should include investigating the possibility of a phased approach to programming the long-term concepts by developing a subset of smaller projects with VII
11 I-95/I-85 Interchange independent utility. This process should continue to involve the technical expertise of a study work group to evaluate alternatives while building consensus at the federal, state, and local levels. 3. VDOT should advance the recommended short-term improvement projects to the preliminary engineering design stage, so a cost estimate and schedule can be developed. If necessary, supplemental environmental and traffic engineering studies should be conducted to move these projects along the project development process. 4. VDOT should continue to coordinate with the Tri-Cities MPO, Crater Planning District Commission (CPDC), City of Petersburg, and within VDOT to cooperatively work towards the programming short-term projects and long-term concepts. VIII
12 I-95/I-85 Interchange TABLE OF CONTENTS Executive Summary... i Study Background... 1 Study Process... 1 Information Used in the RSA... 1 Existing Conditions... 2 Description of Study Area... 2 Roadway Conditions Traffic Conditions Crash Analysis Corridor-Wide Crash Trends Northbound I-95 Crash Summary Southbound I-95 Crash Summary Northbound I-85 Crash Summary Southbound I-85 Crash Summary I-85/I-95 Ramps and CD Roads Crash Summary Identification of crash Hot Spots Recommendations Corridor-Wide Recommendations Hot Spot 1 Northbound I-95 from Milepost 54.4 to Hot Spot 2 Southbound I-95 from Milepost 52.4 to Hot Spot 3 Southbound I-95 from Milepost 53.4 to Area of Interest Rives Road Interchange Area of Interest I-95 Southbound Off-Ramp to Washington Street Area of Interest I-85 northbound Off-Ramp to I-95 southbound Additional Short-Term Improvements and Long-Term Concepts Future Traffic Volumes Critical Ramp Movements Description of Additional Improvements and Concepts Planning Level Cost Estimates Need for Continued Study Recommended Next Steps LIST OF FIGURES Figure 1: Study Corridor from Milepost 53.7 to Milepost Figure 2: Study Corridor from Milepost 52.6 TO Milepost Figure 3: Study Corridor from Milepost 51.4 to Milepost Figure 4: Study Corridor from Milepost 50.3 TO Milepost Figure 5: Study Corridor from Milepost 49.2 to Milepost Figure 6: Study Corridor from Milepost 48.1 to Milepost Figure 7: Study Corridor from Milepost 47.5 TO Milepost Figure 8: Study Corridor from Milepost 68.1 TO Milepost Figure 9: Annual Average Daily Traffic (AADT) and Heavy Vehicle Percentages Figure 10: Dark Crash Locations Figure 11: Crash Type Northbound I Figure 12: Northbound I-95 Roadway Departure Crash Density Figure 13: Crash Type Southbound I Figure 14: Southbound I-95 Roadway Departure Crash Density Figure 15: Crash Type Northbound I Figure 16: Northbound I-95 Roadway Departure Crash Density Figure 17: Crash Type Southbound I Figure 18: Southbound I-85 Roadway Departure Crash Density IX
13 I-95/I-85 Interchange Figure 19: Crash Type Corridor Ramps and Collector-Distributor (CD) Roads Figure 20: Northbound I-95 Crash Density Figure 21: Southbound I-95 Crash Density Figure 22: Northbound I-85 Crash Density Figure 23: Southbound I-85 Crash Density Figure 24: Crash Hot Spot Locations Figure 25: Conceptual Layout of Low Bridge Warning System Figure 26: Proposed Temple Roundabout Figure 27: Rives Road Interchange - Peak Hour Ramp Traffic Volumes Figure 28: Rives Road Interchange - 24-Hour Ramp Traffic Volumes Figure 29: Collision Diagram - Rives Road and I-95 Northbound Figure 30: Collision Diagram - Rives Road and I-95 Southbound Figure 31: Southbound I-95 Off-Ramp to Washington Street - Peak Hour Volumes Figure 32: Southbound I-95 Off-Ramp to Washington Street - Volumes by Lane Figure 33: Washington Street - Short-Term Recommendation Figure 34: Washington Street - Long-Term Recommendation Figure 35: I-95 SB/I-85 NB Weave PM Peak Hour Traffic Volumes Figure 37: Critical Ramp Movements Figure 36: Traffic Comparison for I-95/I-85/Route 460 Interchange Area Figure 38: I-95/I-85/Route 460 Long-Term Concepts LIST OF TABLES Table 1: Interchange Spacing Table 2: Northbound I-95 Acceleration and Deceleration Lane Lengths Table 3: Southbound I-95 Acceleration and Deceleration Lane Lengths Table 4: Annual Average Daily Traffic (AADT) and Heavy Vehicle Percentages Table 5: Crash Rates per 100 Million Vehicle Miles Traveled (1/1/2007 to 12/31/2009) Table 6: Crash Rates per 100 Million Vehicle Miles Traveled (1/1/1996 to 12/31/1998) Table 7: Crash Summary Roadway Surface Conditions Table 8: Crash Summary - Time of Day Table 9: Crash Summary Lighting Conditions Table 10: Northbound I-95 Summary of Roadway Departure Crashes Table 11: Southbound I-95 Summary of Roadway Departure Crashes Table 12: Northbound I-85 Summary of Roadway Departure Crashes Table 13: Southbound I-85 Summary of Roadway Departure Crashes Table 14: Historical Bridge Strike Information from 1999 to Table 15: Acceleration and Deceleration Lane Deficient Lengths Table 16: Crash Summary Hot Spot 1 (I-95 NB, Milepost 54.4 to 54.9) Table 17: Crash Summary Hot Spot 2 (I-95 SB, Milepost 52.4 to 52.9) Table 18: Crash Summary Hot Spot 3 (I-95 SB, Milepost 53.4 to 53.9) Table 19: Rives Road at I-95 - Existing (2012) and Future (2035) HCS Results Table 20: Rives Road at I-95 - Existing (2012) and Future (2035) Synchro Results Table 21: Planning Level Cost Estimates LIST OF PHOTOGRAPHS Photograph 1: I-95 Northbound Off-Ramp to Southpark Boulevard Midday Queue Photograph 2: I-95 Northbound Off-Ramp to Southpark Boulevard Midday Queue Photograph 3: Continuous Flashing Beacons on Truck Rollover Warning Sign Photograph 4: End of Northbound Temple Avenue Acceleration Lane (Northern On-Ramp) Photograph 5: I-95 Northbound Ramp at Rives Road Looking to the West Photograph 6: I-95 Northbound Ramp at Rives Road Looking to the East Photograph 7: I-95 Southbound Ramp at Rives Road Looking to the East X
14 I-95/I-85 Interchange Photograph 8: I-95 Southbound Ramp at Rives Road - Looking to the West Photograph 9: Southbound I-95 Off-Ramp to Washington Street Photograph 10: Northbound I-85 to Southbound I-95 Weave APPENDIX APPENDIX A: Traffic Count Data APPENDIX B: Crash Data APPENDIX C: Inventory of Overhead Signs APPENDIX D: Area of Interest Rives Road Interchange XI
15 I-95/I-85 Interchange STUDY BACKGROUND Interstates 95 and 85 as well as Route 460 and US 301 converge in Petersburg, Virginia in a complex series of interchanges developed in the mid-1950 s as part of the Richmond-Petersburg Turnpike. These interchanges have several features that create safety and operational challenges, such as short acceleration/deceleration lanes, tight turns, low-speed curves, short weave/merge areas, which may have met design standards in the 1950 s, but are deficient by modern design standards. A comprehensive planning study in this area was conducted between 1998 and 2000 identified a number of capacity and safety issues in the study area and provided study recommendations which are documented in the final report: Final Report: I-85/95/Route 460 Interchange Study from December, Since this study was completed, there has been significant growth in the area due to the expansion of Fort Lee from the BRAC realignment. Additionally, a new major roadway project called the Route 460 Corridor Improvements Project is planned to connect to I-85, which would significantly impact traffic in this interchange area. This study effort is intended to be phase one of an eventual larger I-95/85 Interchange Area study that will update the aforementioned 2000 planning study using the latest available information. This new study will also consider the impacts of Fort Lee growth and the Route 460 Corridor Improvements Project on traffic operations and safety in the I-95/85 interchange area. This study is a cooperative effort between the Virginia Department of Transportation (VDOT), the Crater Planning District Commission (CPDC), and Tri-Cities Metropolitan Planning Organization (MPO). STUDY PROCESS The study process included data collection, crash analysis, field reviews, and the development of safety related improvements within the study area. The development of improvements focused on addressing the identified safety issues in the study area. An analysis of traffic operations was not conducted as part of this study; however, the previous I-95/I-85/Route 460 Interchange Study (conducted in 2000), which included a comprehensive operational analysis, was reviewed and its findings and recommendations considered throughout this study. In addition to the RSA assessment, VDOT requested the study team review safety issues at the following three areas of interest within the study area and propose mitigation measures. 1. Rives Road Interchange at I-95 (Exit 47) 2. The I-95 Southbound Off-Ramp to Washington Street (Exit 52) 3. The I-85 Northbound Off-Ramp to I-95 Southbound (Exit 68) The study team conducted a meeting with the following stakeholders to discuss and gain input on the proposed recommendations: VDOT Tri-Cities MPO City of Petersburg FHWA INFORMATION USED IN THE RSA Information used for this roadway safety assessment on the northbound and southbound directions of both I-95 and I-85 included the following: FR-300 police crash reports (three years from 01/01/2007 through 12/31/2009) Summary of crash statistics (three years from 01/01/2007 through 12/31/2009) 1
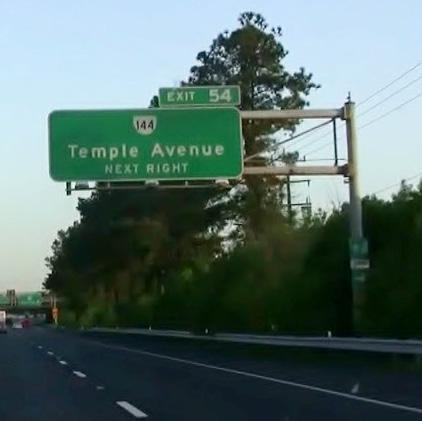
16 I-95/I-85 Interchange Two collision diagrams located at I-95 SB Ramps at Rives Road and I-95 NB Ramps at Rives Road (showing crashes occurring for three years from 01/01/2006 through 12/31/2008) Field review notes, video, and photos taken of the study corridor on Tuesday, March 27, 2012 Notes from on-site field review with VDOT on Thursday, May 17, 2012 Twenty-four hour directional traffic counts on the four ramps at the I-95 Rives Road interchange, the I-95 SB off ramp to Washington Street, and mainline Washington Street just east of the southbound I-95 offramp (collected on 03/28/2012) Twenty-four hour speed counts from VDOT count stations in the study corridor (collected on 6/27/2012) Average annual daily traffic (AADT) from the 2010 VDOT published traffic data Previous planning studies conducted in the vicinity of the study corridor and proposed design plans provided by VDOT EXISTING CONDITIONS A preliminary field review of the study corridor was conducted on Tuesday, March 27, 2012 to verify existing geometric conditions and traffic control devices; and observe peak hour traffic conditions and the driver behavior. A (RSA) of the study corridor was conducted on Thursday, May 17, The following subsections describe the study area, geometric conditions, traffic control devices, traffic conditions, and field observations. DESCRIPTION OF STUDY AREA The study area includes an 8-mile segment of I-95 and a 1-mile segment of I-85 near Petersburg and Colonial Heights, Virginia and is illustrated in Figure 1 to 8. The I-95 study corridor extends from 1,000 feet north of the Temple Avenue interchange (Exit 54) to 1,000 feet south of the Rives Road interchange (Exit 47). I-95 has three lanes in each direction with paved shoulders on both sides of the road north of the I-95/I-85 interchange and two lanes in each direction with paved shoulders on both sides of the road south of the I-95/I-85 interchange. The posted speed limit on I-95 in the study corridor is 55 MPH north of milepost 49.6 (just south of the US 301/South Crater Road interchange) and 65 MPH south of milepost The I-95 study corridor contains the following eight (8) interchanges: Temple Avenue (Exit 54) partial cloverleaf interchange Roslyn Road (Exit 53) partial cloverleaf interchange Washington Street/Wythe Street (Exit 52) modified diamond interchange I-95/I-85 (Exit 51) partial cloverleaf interchange US 301/South Crater Road (Exit 50) partial cloverleaf interchange Route 460/Winfield Road (Exit 50) diamond interchange Wagner Road (Exit 48) full cloverleaf interchange Rives Road (Exit 47) diamond interchange The I-85 study corridor is approximately one mile in length and extends from the I-95/I-85 interchange (Exit 51) to the Sycamore Street overpass. I-85 has two lanes in each direction with paved shoulders on both sides of the road. The posted speed limit along this segment is 55 MPH north of milepost 68.0 (just south of the I-95/I-85 interchange) and 60 MPH south of milepost With the exception of the I-95 junction, there are no interchanges on the I-85 study corridor. 2

17 I-95/I-85 Interchange Figure 1: Study Corridor from Milepost 53.7 to Milepost

18 I-95/I-85 Interchange Figure 2: Study Corridor from Milepost 52.6 TO Milepost

19 I-95/I-85 Interchange Figure 3: Study Corridor from Milepost 51.4 to Milepost

20 I-95/I-85 Interchange Figure 4: Study Corridor from Milepost 50.3 TO Milepost

21 I-95/I-85 Interchange Figure 5: Study Corridor from Milepost 49.2 to Milepost

22 I-95/I-85 Interchange Figure 6: Study Corridor from Milepost 48.1 to Milepost

23 I-95/I-85 Interchange Figure 7: Study Corridor from Milepost 47.5 TO Milepost

24 I-95/I-85 Interchange Figure 8: Study Corridor from Milepost 68.1 TO Milepost

25 I-95/I-85 Interchange ROADWAY CONDITIONS The following sections of this report detail the existing roadway conditions throughout the corridor. Figure 1 through 8 above show the existing locations of guardrail, rumble strips and traffic barriers relative to the mileposts. These roadway properties and others will be discussed throughout this report and locations described throughout reference the mileposts in these figures. I-95 and I-85 are functionally classified as urban interstates. The 2004 AASHTO A Policy on Geometric Design of Highways and Streets, Fifth Edition recommends a minimum interchange spacing of one mile for urban interstates. The spacing between I-95 interchanges in both the northbound and southbound directions is shown in Table 1. The segment of I-95 within the study corridor only meets this criterion in three locations (two locations in the northbound direction and one location in the southbound direction). Table 1: Interchange Spacing The 2004 AASHTO A Policy on Geometric Design of Highways and Streets, Fifth Edition provides guidance on acceleration and deceleration lane lengths based on the design speed of the ramp. The design speeds, measured lengths, and AASHTO standard lengths are shown for each of the acceleration and deceleration lanes in the study corridor on northbound and southbound I-95 in Table 2 and Table 3, respectively. Acceleration and deceleration 11
26 I-95/I-85 Interchange lanes that do not meet the AASHTO standard are denoted as deficient. Of the 16 northbound ramps, 6 (38%) are deficient while 5 of the 15 (33%) southbound ramps are deficient. Eight of the 11 (73%) deficient ramps are acceleration lanes. In addition, Table 2 and Table 3 show AADTs for ramps where the data was available. AADT data was obtained from the VDOT Statewide Planning System (SPS) data with the exception of the Rives Road volumes, which were obtained from the 24-hour traffic counts collected on March 28, Table 2: Northbound I-95 Acceleration and Deceleration Lane Lengths I-95 NB Location AADT Ramp Speed (mph) Measured Length (ft) Standard Length (ft) Deficient Rives Rd Wagner Rd Winfield Rd/CD Road CD Road I-85 Bank St Washington St/Wythe St Southpark Boulevard Temple Ave Notes: - ADT not available Decel Lane Accel Lane 3,463 35* 695 1,000 X EB Decel Lane EB Accel Lane - 25* 875 1,220 X WB Decel Lane WB Accel Lane - 35* 765 1,000 X Decel Lane Accel Lane - 35* 1, Decel Lane Decel Lane X Accel Lane , Decel Lane 10, X Accel Lane X Decel Lane 5, Accel Lane 5, WB Accel Lane - 35* 1, * Ramp speed not posted - Speed assumed based on 2004 AASHTO A Policy on Geometric Design of Highways and Streets, Fifth Edition 12
27 I-95/I-85 Interchange Table 3: Southbound I-95 Acceleration and Deceleration Lane Lengths I-95 SB Location AADT Ramp Speed (mph) Measured Length (ft) Standard Length (ft) Deficient Temple Ave Roslyn Rd Washington St Wyth St Washington St/Wythe St CD Road CD Road Wagner Rd Rives Rd Notes: - ADT not available Decel Lane 10, Accel Lane 7,137 35* 2, Decel Lane Accel Lane - 20* X Decel Lane , Decel Lane , Accel Lane , Decel Lane Accel Lane - 35* WB Decel Lane 5, X WB Accel Lane - 25* 805 1,220 X EB Decel Lane - 25* EB Accel Lane - 35* 965 1,000 X Decel Lane 3, Accel Lane * 745 1,000 X * Ramp speed not posted - Speed assumed based on 2004 AASHTO A Policy on Geometric Design of Highways and Streets, Fifth Edition I-95 ROADWAY CONDITIONS On I-95 there are three 12-foot lanes north of the I-95/I-85 interchange in one direction and two 12-foot lanes south of the I-95/I-85 interchange in one direction. The widths of the shoulders vary throughout the corridor. The left shoulder width varies from 3 to 12 feet and the right shoulder width varies from 8 to 12 feet. The AASHTO standard for left shoulders for a four-lane freeway is 4 to 8 feet and for right shoulders a minimum of 10 feet. For a six-lane freeway the left and right shoulder standard based on AASHTO is 10 feet. Guardrail was generally 13
28 I-95/I-85 Interchange observed at locations and areas where protection is typically required (i.e., bridge structures, sign structures, steep slopes, etc.), however a full guardrail assessment and length of need determination was not conducted as part of this study. The northbound and southbound travel lanes are separated by a concrete traffic barrier north of the Route 460/Winfield Road interchange, with the exception of the segment from milepost 51.9 to milepost 52.2, which is separated by double-faced guardrail. South of the Route 460/Winfield Road Interchange, the northbound and southbound travel lanes are separated by a variable width grass median with guardrail. In addition, a collector distributor road is located adjacent to I-95 in both the northbound and southbound directions between the Washington Street/Wythe Street interchange and the Route 460/Winfield Road interchange for approximately 1.5 miles. A concrete traffic barrier separates the collector-distributor lanes from the mainline lanes in both directions. Additional field observations regarding roadway conditions on I-95 are summarized below: There are no rumble strips in the study corridor on the left or right shoulders on northbound I-95. On southbound I-95, there are rumble strips on both the left and right shoulders from milepost 47.4 to 50.0, but there are no rumble strips on either side of the interstate from milepost 50.0 to Based on a visual assessment, the pavement was observed to be in fair condition throughout corridor, with few potholes and areas of severe cracking. No grades that would cause trucks to approach crawl speeds or sharp curves that would warrant curve warning signs were identified on the mainline roadway. The pavement markings (edge lines and lane lines) are 4 wide and were observed to be in fair condition, mostly visible with some fading. There is existing conventional roadway lighting along the I-95 corridor between milepost 53.0 and milepost 52.5 and between the I-95/I-85 interchange and the South Carter road interchange along both the northbound and southbound travel lanes. To supplement this lighting, there is high-mast lighting between the two segments of conventional lighting. I-85 ROADWAY CONDITIONS On I-85 there are two 12-foot lanes in both the northbound and southbound directions. The widths of the shoulders along I-85 vary throughout the corridor. The left shoulder varies from 5 to 12 feet and the right shoulder varies from 8 and 12 feet. Guardrail was generally observed at locations and areas where protection is typically required (i.e., bridge structures, sign structures, steep slopes, etc.); however, a full guardrail assessment and length of need determination was not conducted as part of this study. The northbound and southbound travel lanes are separated by a concrete traffic barrier along the entire stretch of I-85 within the study corridor. Additional field observations regarding roadway conditions on I-85 are summarized below: There are no rumble strips in the study corridor on the left or right shoulders along southbound I-85. On northbound I-85, there are rumble strips on both the left and right shoulders up to the I-95 interchange. Based on a visual assessment, the pavement was observed to be in fair condition throughout corridor, with few potholes and areas of severe cracking. No grade s that would cause trucks to approach crawl speeds or sharp curves that would warrant curve warning signs were identified on the mainline roadway. The pavement markings (edge lines and lane lines) are 4 wide and were observed to be in fair condition, mostly visible with some fading. There is conventional lighting north of milepost 68.0 and high mast lighting at the I-95/ I-85 interchange. 14
.")
 Photograph 2: I-95 Northbound Off-Ramp to Southpark Boulevard Midday Queue (Looking South) Speed data was")
29 I-95/I-85 Interchange TRAFFIC CONDITIONS VDOT has received numerous reports of congestion and queuing on ramps throughout the study corridor. Congestion was observed during the field review conducted on Tuesday, March 27, 2012 on the I-95 northbound off-ramp to Southpark Boulevard during midday (between 11:30 AM and 12:30 PM). Photographs 1 and 2 shows vehicles queued on the off-ramp back to the I-95 northbound mainline. Photograph 1: I-95 Northbound Off-Ramp to Southpark Boulevard Midday Queue (Looking North) Photograph 2: I-95 Northbound Off-Ramp to Southpark Boulevard Midday Queue (Looking South) Speed data was collected from VDOT count stations located throughout the study corridor for Wednesday, June 27, 2012 (traffic count data is provided in Appendix A). The data was collected in 5-minute increments and reported in varying ranges (e.g., less than 15 mph, mph, mph, etc.). Based on an analysis of this data, the AM peak period extends from approximately 6:00 AM to 9:00 AM and the PM peak period extends from approximately 3:00 PM to 6:00 PM. The data from three count stations were analyzed to find the average daily speed, average speed during the AM and PM peak periods, and the 85th percentile speeds. The median speed for the range was used (e.g., 57.5 mph was used as the speed for all vehicles in the mph range) when the average speeds were calculated. Data from count station , located on I-85 just north of the Squirrel Level Road interchange, was analyzed to determine speed conditions on both northbound and southbound I-85 in the study corridor. Currently, the posted speed limit is 60 mph at this location. Along northbound I-85, the average daily speed, average AM peak period speed, and average PM peak period speed all fell in the mph range. The 85th percentile speed fell in the mph range. Along southbound I-85, the average daily speed, average AM peak period speed, and average PM peak period speed all fell in the mph range. The 85th percentile speed fell in the mph range. Data from count station , located on I-95 just north of the Wagner Road interchange, was analyzed to determine speed conditions on both northbound and southbound I-95 in the southern section of the study corridor. Currently, the posted speed limit is 65 mph at this location. Along northbound I-95, the average daily speed, average AM peak period speed, and average PM peak period speed all fell in the mph range. The 85th percentile speed fell in the mph range. 15
30 I-95/I-85 Interchange Along southbound I-95, the average daily speed, average AM peak period speed, and average PM peak period speed all fell in the mph range. The 85th percentile speed fell in the mph range. Data from count station , located on I-95 just south of the Southpark Boulevard interchange, was analyzed to understand speed conditions on both northbound and southbound I-95 in northern section the study corridor. Currently, the posted speed limit is 55 mph at this location. Along northbound I-95, the average daily speed and average PM peak speed both fell in the mph range, the average AM peak period speed fell in the mph range, and the 85th percentile speed fell in the mph range. Along southbound I-95, the average daily speed, average AM peak period speed, and average PM peak period speed all fell in the mph range. The 85th percentile speed fell in the mph range. I-95 TRAFFIC CONDITIONS Based on 2010 VDOT published traffic counts, both northbound and southbound I-95 carry approximately 44,000 vehicles per day on the north end of the corridor (Temple Road) and approximately 16,000 vehicles per day on the south end of the corridor (Rives Road). Table 4 and Figure 9 shows the AADT and truck percentages on I-95. The highest traffic volumes in the study corridor are found between the Southpark Boulevard and Washington Street interchanges. In this segment of the study corridor, northbound I-95 carries approximately 51,000 vehicles per day and southbound I-95 carries approximately 50,000 vehicles per day. Truck percentages range from 10 to 15 percent in the northbound direction of I-95 and 10 to 12 percent in the southbound direction. I-85 TRAFFIC CONDITIONS Northbound I-85 in the study corridor carries approximately 28,000 vehicles per day with a truck percentage of 13 percent. Southbound I-85 carries approximately 26,000 vehicles per day and has a truck percentage of 14 percent. Table 4 and Figure 9 shows the annual average daily traffic (AADT) and truck percentages on I
 and Heavy Vehicle")
31 I-95/I-85 Interchange Table 4: Annual Average Daily Traffic (AADT) and Heavy Vehicle Percentages 17
 and Heavy Vehicle")
32 I-95/I-85 Interchange Figure 9: Annual Average Daily Traffic (AADT) and Heavy Vehicle Percentages 18
33 I-95/I-85 Interchange CRASH ANALYSIS An evaluation of corridor safety was conducted based on crash summary information and field reconnaissance. Crash data analysis for the study corridors and the associated on- and off-ramps within the study area was conducted using the latest three years of available crash data between 1/1/2007 to 12/31/2009, which was obtained from VDOT. The following sections summarize corridor crash trends and segment-specific crash data. The primary goal of this study was to identify short- and long-term improvements specifically on the study corridors. Therefore, for purposes of this study, crash analysis was not conducted at the adjacent intersections. CORRIDOR-WIDE CRASH TRENDS CRASH RATES The overall, injury, and fatal crash rates were calculated for the I-95 and I-85 study corridors and compared to the statewide urban interstate rate for Crash rates for the study corridors were based on the total number of crashes, the length, and the average daily traffic. Crash rates are reported based on 100 million vehicle miles of travel (VMT). For comparative purposes, the most recent statewide urban interstate crash rates published by VDOT (2007) were used in this study as shown in Table 5. Table 5: Crash Rates per 100 Million Vehicle Miles Traveled (1/1/2007 to 12/31/2009) Road Segment I-95 Urban Section (MP 47.4 to MP 54.6 ) Direction Corridor Rate Overall Crash Rate *Statewide Rate % Difference Corridor Rate Injury Crash Rate *Statewide Rate % Difference Corridor Rate Fatal Crash Rate *Statewide % Rate Difference NB % % % SB % % % I-85 Urban Section NB % % % (MP 68.1 to MP 69.1) SB % % % *Statewide Urban Interstate Rate (VDOT Published in 2007) Study corridor crash rate period = from 1/1/2007 to 12/31/2009 VMT = Vehicle Miles Traveled MP = Milepost Based on an analysis of the data, the overall, injury, and fatal crash rates in both directions on I-95 and I-85 within the study limits, are all lower than the 2007 statewide crash rates for urban interstates. The one exception is the fatal crash rate of 0.8 on southbound I-95, which is 35% higher than the statewide interstate crash rate of 0.5. The current study corridors crash rates (calculated using data from 2007 to 2009) were compared to the crash rates calculated in the I-85/I-95/Route 460 Interchange Study (calculated from 1996 to 1998 and shown in Table 6) show a reduction in the overall, injury, and fatal crash rates. Although the limits of the two studies were different, a comparison of the crash rates shows a downward trend through the study area. Table 6: Crash Rates per 100 Million Vehicle Miles Traveled (1/1/1996 to 12/31/1998) Road Segment I-95 at the I-85/Route 460 I-85 at the I-85/Route 460 Direction Overall Crash Rate Injury Crash Rate NB SB NB SB Crash rates from the I-85/I-95/Route 460 Interchange Study, December 2000 Study corridor crash rate period = from 1/1/1996 to 12/31/1998 VMT = Vehicle Miles Traveled Fatal Crash Rate 19
34 I-95/I-85 Interchange CRASH TYPE The most predominant crash types in the study corridor are fixed-object off road and rear end crashes. Due to the limitations of the crash data provided, fixed-object off road crashes were the only crash type reviewed in detail to identify roadway departure crashes. Roadway departure crashes are frequently severe and account for the majority of highway fatalities. According to the Federal Highway Administration, a roadway departure crash is defined as a non-intersection crash that occurs after a vehicle crosses an edge line or a center line, or otherwise leaves the traveled way. The pattern of rear-end crashes throughout the corridor is an indication of possible traffic congestion; variable travel speeds; short deceleration and acceleration lane lengths; and inadequate ramp configurations. ROADWAY SURFACE CONDITIONS Most of the crashes in the corridor occurred under dry roadway surface conditions with 29% occurring under wet conditions. A summary of the corridor crashes by pavement condition is provided in Table 7. Surface conditions in the other category include snowy, icy, and roadway flooded. Table 7: Crash Summary Roadway Surface Conditions Segment Roadway Surface Conditions [Number of Crashes (Percentage of Crashes)] Dry Wet Other I-95 Southbound 95 (64%) 48 (32%) 5 (3%) I-95 Northbound 89 (63%) 40 (28%) 12 (9%) I-85 Southbound 5 (63%) 3 (38%) 0 (0%) I-85 Northbound 16 (70%) 7 (30%) 0 (0%) Ramps & CD Roads 61 (72%) 19 (22%) 5 (6%) Corridor Total 266 (66%) 117 (29%) 22 (5%) TIME OF DAY Within the limits of the study corridor, approximately half of the crashes occur during the AM and PM peak periods and the other half occur during off peak periods. A summary of the corridor crashes by time of day is provided in Table 8. Table 8: Crash Summary - Time of Day Segment Time of Day [Number of Crashes (Percentage of Crashes)] AM Peak (6-10) PM Peak (3-7) Off Peak I-95 Southbound 27 (18%) 38 (26%) 83 (56%) I-95 Northbound 29 (21%) 38 (27%) 74 (52%) I-85 Southbound 1 (13%) 3 (38%) 4 (50%) I-85 Northbound 4 (17%) 7 (30%) 12 (52%) Ramps & CD Roads 26 (31%) 25 (29%) 34 (40%) Corridor Total 87 (21%) 111 (27%) 207 (51%) 20
35 I-95/I-85 Interchange LIGHTING CONDITIONS Most of the corridor crashes occurred during the day with 30% occurring under dark conditions. A summary of the corridor crashes by light conditions is provided in Table 9. Of the 123 crashes that occurred during dark conditions, 87 (71%) crashes were reported as occurring on a segment of roadway without lighting. The locations of all crashes occurring under dark conditions and the location of lighting along the study corridor are illustrated in Figure 10. As previously mentioned, the location of lighting in both corridors is not continuous. A description of the lighting locations is provided below. On I-85 there is conventional lighting in both the northbound and southbound directions north of milepost 68 and high mast lighting surrounding the I-95 interchange. On I-95 conventional lighting is present in the study corridor between milepost 53.0 and milepost 52.5 and between milepost and between milepost 51.2 and In addition, there is high mast lighting between the two segments of conventional lighting. Table 9: Crash Summary Lighting Conditions Segment Lighting Conditions [Number of Crashes (Percentage of Crashes)] Day Dawn/Dusk Dark I-95 Southbound 92 (62%) 7 (5%) 49 (33%) I-95 Northbound 82 (58%) 8 (6%) 51 (36%) I-85 Southbound 6 (75%) 1 (13%) 1 (13%) I-85 Northbound 19 (83%) 0 (0%) 4 (17%) Ramps & CD Roads 58 (69%) 9 (11%) 18 (21%) Corridor Total 257 (63%) 25 (6%) 123 (30%) 21

36 I-95/I-85 Interchange Figure 10: Dark Crash Locations 22


37 I-95/I-85 Interchange NORTHBOUND I-95 CRASH SUMMARY The total number of reported crashes is: 141 crashes The total number of reported injuries is: 47 injuries The total number of reported fatalities is: 0 fatalities A summary of crashes by type on the northbound I-95 is shown in Figure 11. The most prevalent crash types in this direction are fixed-object off road and rear end. Figure 11: Crash Type Northbound I-95 3% 1% 31% Rear End Angle Sideswipe - Same Direction 41% Fixed Object - In Road Fixed Object - Off Road 6% Deer/Other Animal Other 4% 15% A summary of roadway departure crashes on northbound I-95 is provided in Table 10. The frequency and direction of roadway departure crashes per half-mile segment on northbound I-95 are displayed in Figure 12. The following conclusions were developed based on a review of this crash data on southbound I-95. None of the roadway departure crashes on northbound I-95 resulted in a fatality. 30 (47%) of the roadway departure crashes on northbound I-95 resulted in injury. Injuries resulting from roadway departure crashes on northbound I-95 accounted for 38% of all injuries on northbound I-95. Table 10: Northbound I-95 Summary of Roadway Departure Crashes Type of RD Crash Number of Crashes Percent of RD Crashes Percent of Total I-95 NB Crashes To the Right 25 39% 18% To the Left 39 61% 28% Total Number of RD Crashes % 45% Notes: Crash data from 2007 to 2009 RD = Roadway Departure 23
38 Crashes I-95/I-85 Interchange Figure 12: Northbound I-95 Roadway Departure Crash Density Roadway Departure - Left Roadway Departure - Right Starting Milepost (Southbound to Northbound) SOUTHBOUND I-95 CRASH SUMMARY The total number of reported crashes is: 148 crashes The total number of reported injuries is: 49 injuries The total number of reported fatalities is: 1 fatality The one fatal crash along I-95 southbound occurred in 2009 at 5:53 AM approximately 150 feet north of the Southpark Boulevard interchange (Exit 53) at milepost In addition to the fatality, there were two injuries also associated with the crash. It was a rear end crash in conditions with dry roadway surface, clear weather, and darkness. The contributing major factor was categorized as improper or unsafe lane change. The vehicles involved in the crash were three passenger cars. Due to the random nature of fatal crashes, especially on interstate facilities, specific mitigation measures were not developed. However, corridor-wide roadside safety recommendations were developed based on the field review and a comprehensive analysis of speed data, crash data, traffic volumes, interchange spacing and roadway characteristics. These recommendations are summarized in the Corridor-Wide Recommendations section of the report. A summary of crashes by type on southbound I-95 is provided in Figure 13. The most prevalent crash types in this direction are fixed-object off road and rear end. 24


39 I-95/I-85 Interchange Figure 13: Crash Type Southbound I-95 2% 31% Rear End Angle 42% Sideswipe - Same Direction Fixed Object - In Road Non-Collision 4% Fixed Object - Off Road Deer/Other Animal 3% 5% 13% A summary of roadway departure crashes on southbound I-95 is provided in Table 11. The frequency and direction of roadway departure crashes per half-mile segment on southbound I-95 are displayed in Figure 14. Table 11: Southbound I-95 Summary of Roadway Departure Crashes Type of RD Crash Number of Crashes Percent of RD Crashes Percent of Total I-95 SB Crashes To the Right 23 31% 15% To the Left 51 69% 34% Total Number of RD Crashes % 50% Notes: Crash data from 2007 to 2009 RD = Roadway Departure The following conclusions were developed based on a review of this crash data on southbound I-95. None of the roadway departure crashes on southbound I-95 resulted in a fatality. 21 (28%) of the roadway departure crashes on southbound I-95 resulted in injury. Injuries resulting from roadway departure crashes on southbound I-95 accounted for 27% of all injuries on southbound I
40 Crashes I-95/I-85 Interchange Figure 14: Southbound I-95 Roadway Departure Crash Density Roadway Departure - Left Roadway Departure - Right Starting Milepost (Southbound to Northbound) NORTHBOUND I-85 CRASH SUMMARY The following crash statistics were computed for northbound I-85 using the three years of crash data provided by VDOT. The total number of reported crashes is: 23 crashes The total number of reported injuries is: 6 injuries The total number of reported fatalities is: 0 fatalities A summary of crashes by type on northbound I-85 is provided in Figure 15. The most prevalent crash types in this direction are fixed-object off road and rear end. 26


41 I-95/I-85 Interchange Figure 15: Crash Type Northbound I-85 4% 13% Rear End 9% Angle 35% Sideswipe - Same Direction Fixed Object - In Road Non-Collision 26% Fixed Object - Off Road Deer/Other Animal 4% 9% A summary of roadway departure crashes on northbound I-85 is provided in Table 12. The frequency and direction of roadway departure crashes per half-mile segment of northbound I-95 are displayed in Figure 16. The following conclusions were developed based on a review of this crash data on northbound I-85. None of the roadway departure crashes on northbound I-85 resulted in fatality. One (11%) of the roadway departure crashes on northbound I-85 resulted in injury. Injuries resulting from roadway departure crashes on northbound I-85 accounted for 14% of all injuries on northbound I-85. Table 12: Northbound I-85 Summary of Roadway Departure Crashes Type of RD Crash Number of Crashes Percent of RD Crashes Percent of Total I-85 NB Crashes To the Right 4 44% 17% To the Left 5 56% 22% Total Number of RD Crashes 9 100% 39% Notes: Crash data from 2007 to 2009 RD = Roadway Departure 27
42 Crashes I-95/I-85 Interchange Figure 16: Northbound I-95 Roadway Departure Crash Density Roadway Departure - Left Roadway Departure - Right Starting Milepost (Southbound to Northbound) SOUTHBOUND I-85 CRASH SUMMARY The following crash statistics were computed for southbound I-85 using the three years of crash data provided by VDOT. The total number of reported crashes is: 8 crashes The total number of reported injuries is: 3 injuries The total number of reported fatalities is: 0 fatalities A summary of crashes by type in the southbound direction of I-85 is provided in Figure 17. The most prevalent crash type in this direction is fixed object off road. 28


43 Crashes I-95/I-85 Interchange Figure 17: Crash Type Southbound I-85 13% 13% 13% Angle Sideswipe - Same Direction Fixed Object - Off Road Deer/Other Animal 63% The frequency and direction of roadway departure crashes per half-mile segment of northbound I-95 are displayed in Figure 18. A summary of roadway departure crashes in the southbound direction of I-85 is provided in Table 13. Figure 18: Southbound I-85 Roadway Departure Crash Density Roadway Departure - Left Roadway Departure - Right Starting Milepost (Southbound to Northbound) 29
44 I-95/I-85 Interchange Table 13: Southbound I-85 Summary of Roadway Departure Crashes Type of RD Crash Number of Crashes Percent of RD Crashes Percent of Total I-85 SB Crashes To the Right 3 60% 38% To the Left 2 40% 25% Total Number of RD Crashes 5 100% 63% Notes: Crash data from 2007 to 2009 RD = Roadway Departure I-85/I-95 RAMPS AND CD ROADS CRASH SUMMARY While this study did not include a full crash analysis at each individual ramp, a summary of crashes were compiled for all of the ramps and collector-distributor (CD) roads within the study corridor. This summary was compiled to identify corridor-wide trends, most prevalent crash types, and safety issues related to the ramps and CD roads. A breakdown of the crashes for the ramps and CD roads throughout the study corridor is as follows: The total number of reported crashes on the ramps and CD roads along this corridor is: 85 crashes The total number of reported injuries on the ramps and CD roads along this corridor is: 30 injuries The total number of reported fatalities on the ramps and CD roads along this corridor is: 1 fatality The interchange with the highest number of reported crashes occurred at Temple Avenue. The on-ramps and off-ramps in both the northbound and southbound directions combined for a total of 28 crashes. The one crash involving a fatality occurred in 2009 at 3:19 AM on the southbound I-95 off-ramp to Wythe Street. It was a fixed-object off road crash in conditions with wet roadway surface and darkness. The major contributing factor was driver speeding. The vehicle involved in the crash was a passenger car. Due to the random nature of fatal crashes, specific mitigation measures were not developed. However, corridor-wide roadside safety recommendations were developed based on the field review and a comprehensive analysis of speed data, crash data, traffic volumes, interchange spacing and roadway characteristics. These recommendations are summarized in the Recommendations section of the report. A summary of crashes by type on the ramps is provided in Figure 19. The most prevalent crash type on the ramps is rear end. The pattern of rear-end crashes on ramps and along the collector-distributor roads is an indication of possible traffic congestion and/or substandard deceleration/acceleration lengths. A detailed summary of all the ramp and CD road crashes can be found in Appendix B. 30

")
45 I-95/I-85 Interchange Figure 19: Crash Type Corridor Ramps and Collector-Distributor (CD) Roads 1% Rear End Angle 32% Head On Sideswipe - Same Direction 51% Sideswipe - Opposite Direction Fixed Object - In Road Non-Collision 2% 2% 1% 6% 2% 2% Fixed Object - Off Road Deer/Other Animal IDENTIFICATION OF CRASH HOT SPOTS Crash activity by half-mile segments of roadway, or crash density, for the portions of I-85 and I-95 (both directions) in the study corridor between 2007 and 2009 are represented in Figures 20 through 23. The crash density of each half-mile segment was compared to the statistical mean, or average crash density, of the corresponding segment of the study corridor (I-95 SB, I-95 NB, I-85 SB, and I-85 NB) and also to the average crash density of all urban interstates in the Richmond District. The critical crash density (two standard deviations greater than the average crash density) for I-95 SB, I-95 NB, I-85 SB, and I-85 NB was computed for each segment of the study corridor. The half-mile segments with more crashes than the critical crash density were considered to be crash hot spots for which roadway safety assessments (RSAs) were conducted. Only one location was determined to be a hot spot based on the crash density criterion. Two additional hot spots were included in the analysis due to their close proximity to meeting the crash density criterion. One of the three hot spots is located on northbound I-95 and the other two are located on southbound I-95. The locations of the three hot spots are described below and are illustrated in Figure 24. There were no crash hotspots identified in either direction on I-85. Hot Spot 1 northbound I-95 north of the Temple Avenue interchange (milepost 54.4 to 54.9) Hot Spot 2 southbound I-95 north of the Washington Street/Wythe Street interchange (milepost 52.4 to 52.9) Hot Spot 3 southbound I-95 between Temple Ave interchange and Southpark Boulevard interchange (milepost 53.4 to 53.9) 31
46 Crashes HOT SPOT 1 I-95/I-85 Interchange Figure 20: Northbound I-95 Crash Density Rear End Angle Sideswipe - Same Direction Fixed Object - In Road Fixed Object - Off Road Deer / Other Animal Other Average Crash Density for 1/2-mile segments of all Richmond District Urban Interstates = Average Crash Density for 1/2-mile segments of I-95N study corridor = 9.79 Critical Crash Density for 1/2-mile segments of I-95N study corridor = Starting Milepost (Southbound to Northbound) 32
47 Crashes HOT SPOT 2 HOT SPOT 3 I-95/I-85 Interchange Figure 21: Southbound I-95 Crash Density Rear End Angle Sideswipe - Same Direction Fixed Object - In Road Non-Collision Fixed Object - Off Road Deer / Other Animal Average Crash Density for 1/2-mile segments of I-95S study corridor = Critical Crash Density for 1/2-mile segments of I-95S study corridor = Average Crash Density for 1/2-mile segments of all Richmond District Urban Interstates = Starting Milepost (Southbound to Northbound) 33
48 Crashes I-95/I-85 Interchange Figure 22: Northbound I-85 Crash Density Rear End Angle Sideswipe - Same Direction Fixed Object - In Road Non-Collision Fixed Object - Off Road Deer / Other Animal Critical Crash Density for 1/2-mile segments of I-85N study corridor = Average Crash Density for 1/2-mile segments of all Richmond District Urban Interstates = Average Crash Density for 1/2-mile segments of I-85N study corridor = Starting Milepost (Southbound to Northbound) 34
49 Crashes I-95/I-85 Interchange Figure 23: Southbound I-85 Crash Density Angle Sideswipe - Same Direction Fixed Object - Off Road Deer / Other Animal Average Crash Density for 1/2-mile segments of all Richmond District Urban Interstates = Critical Crash Density for 1/2-mile segments of I-85S study corridor = 7.27 Average Crash Density for 1/2-mile segments of I-85S study corridor = 4.44 Starting Milepost (Southbound to Northbound) 35
50 I-95/I-85 Interchange Figure 24: Crash Hot Spot Locations 36
51 I-95/I-85 Interchange RECOMMENDATIONS CORRIDOR-WIDE RECOMMENDATIONS Many of the safety issues observed along the study corridor were not localized to a single segment of roadway; as a result, several corridor-wide improvements were recommended. The goal to relate crash trends and deficiencies identified during the study process with improvements that will reduce crashes and risk throughout the corridor. Further recommendations specific to hot spot locations will be discussed in later sections of the report. ISSUE 1: ROADWAY DEPARTURE CRASH PATTERN Roadway departure crashes are frequently severe and account for the majority of highway fatalities. According to the Federal Highway Administration, a roadway departure crash is defined as a non-intersection crash that occurs after a vehicle crosses an edge line or a center line, or otherwise leaves the traveled way. 9 roadway departure crashes on northbound I-85 (56% to the left, 44% to the right) 5 fixed object off-road on southbound I-85 (40% to the left, 60% to the right) 64 fixed object off-road on northbound I-95 (61% to the left, 39% to the right)) 74 fixed object off-road on southbound I-95 (69% to the left, 31% to the right) A significant portion of the 152 roadway departure crashes along the study corridor were fixed-object off road crashes. COUNTERMEASURE 1A: RUMBLE STRIPS The existing crash pattern of roadway departure crashes along the study corridor justifies the corridor-wide installation of rumble strips along both the right and left shoulders where they do not currently exist, which is on the following sections: Northbound I-95 throughout entire study corridor, from milepost 47.4 to milepost 54.7 Southbound I-95 from milepost 50.0 to milepost 54.7 Southbound I-85 throughout entire study corridor, from milepost 67.9 to 68.8 Rumble strips currently exist along the entire length of northbound I-85 within the study corridor no rumble strips are necessary on northbound I-85 COUNTERMEASURE 1B: MEDIAN BARRIER Numerous roadway departure crashes to the left were reported along I-95 at locations where median barriers currently exist. Median traffic barriers are present on I-95 between mileposts 50.9 and 51.9 and from milepost 52.3 to milepost During the three-year study period, the roadway departure crash experience on I-95 is summarized as follows: On northbound I-95, 26 roadway departure crashes to the left were reported in the segment where median barriers exist. On southbound I-95, 35 roadway departure crashes to the left were reported in the segment where median barriers exist. Due to the prevalence of roadway departure crashes to the left in roadway segments with median barriers, a corridor-wide assessment of traffic barriers is recommended. The study should assess the barrier design as it impacts vehicle deflection and the main travel way safety during crashes. 37
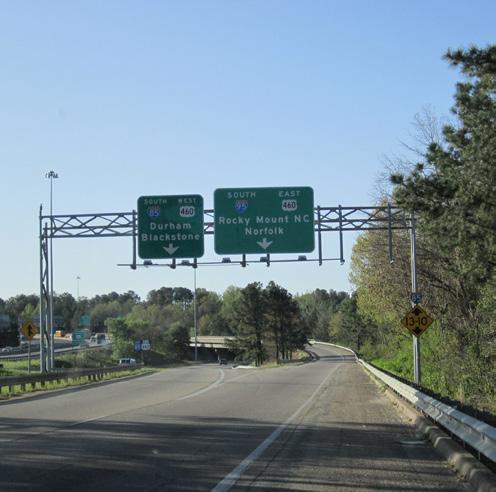
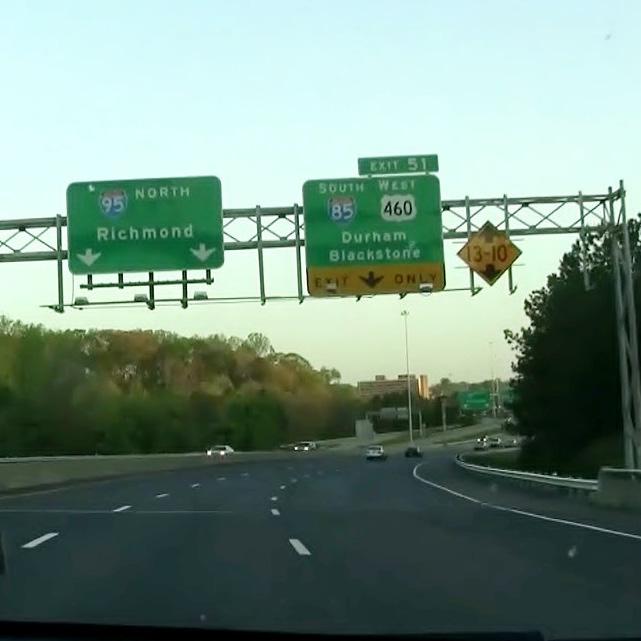
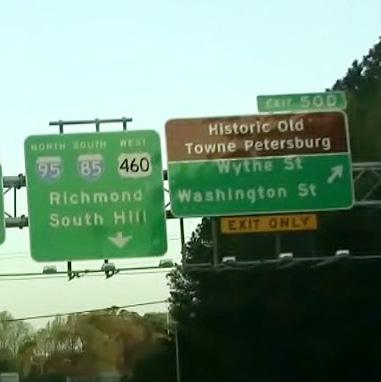
52 COUNTERMEASURE 1C: GUARDRAIL I-95/I-85 Interchange Perform a guardrail assessment to review guardrail condition and location needs in the corridor. An additional guardrail discussion is included below under Issue 2. COUNTERMEASURE 1D: REFLECTORS ON MEDIAN BARRIERS Reflectors on median barriers exist along certain stretches of the study corridor; however, there are some areas where reflectors on median barriers are not present. It is recommended that reflectors be installed on the median barrier in locations were they do not currently exist, especially in locations where there are a significant number of crashes in dark conditions. COUNTERMEASURE 1E: PAVEMENT MARKINGS The installation of 6 wide pavement markings and in-pavement reflectors will improve visibility in the corridor and reduce the risk of crashes related to dark driving conditions, wet driving conditions and ultimately help reduce the number of roadway departure and sideswipe crashes. ISSUE 2: SUBSTANDARD GUARDRAIL During the RSA field review, segments containing deficient and substandard guardrail were observed. Examples of deficient guardrail included guardrail that was installed under an earlier version of VDOT standards or guardrail sections that have been damaged. COUNTERMEASURE 2A: GUARDRAIL ASSESSMENT A comprehensive guardrail assessment should be performed for the study corridor to identify areas where the guardrail should be upgraded to meet current VDOT standards and specifications. The guardrail should be upgraded or repaired as necessary, preferably in conjunction with other planned interstate maintenance projects. ISSUE 3: CORRIDOR SIGNING The I-95 and I-85 study corridors have a numerous guide signs due to the complex configurations of the interchanges and associated CD roads. The 2009 Manual on Uniform Traffic Control Devices (MUTCD) indicates that too much signing can reduce effectiveness of the information to be relayed and should be as concise as possible while still meeting the needs of the traveling public. COUNTERMEASURE 3A: REMOVAL OF UNNECESSARY SIGNS According to the VDOT Traffic Engineering Memorandum TE dated 12/1/2011, Deer Crossing Warning (W11-13) signs should be installed when there are five or more deer crashes over two years in a mile long segment and when the speed limit is greater than 45 mph. These requirements are not met along any segment of the study corridor. It is recommended that the existing W11-13 signs be removed. Deer Crossing Warning (W11-3) signs are currently located at: Northbound I-95 near milepost 49.8 Southbound I-95 near milepost 50.7 In addition, there are not enough crashes related to slick pavement where Slippery When Wet Warning (W8-5) signs are currently present. It is recommended that the W8-5 signs be removed from the study corridor. Slippery When Wet Warning (W8-5) signs are currently located at: Northbound I-95 near milepost 51.1 and milepost
53 COUNTERMEASURE 3B: OVERHEAD SIGN LIGHTING I-95/I-85 Interchange The 2009 MUTCD states that overhead signs should be lit unless there is an engineering study conducted that concludes lighting is not necessary. Throughout the study corridor there are several overhead sign structures with unlit signs. The signs without lighting are listed below and photos of the signs can be found in Appendix C. On northbound I-95, there are 5 overhead sign structures with unlit signs with the following messages: Exit 47 Rives Rd (MP 47.4) Exit 48B Wagner Rd West ¼ Mile & Exit 48A Wagner Rd East (MP 48.4) Exit 48B Wagner Rd West (MP 48.7) Exit 53 Southpark Blvd Exit ¼ Mile (MP 52.9) Colonial Hgts Next 3 Exits (MP 53.0) On southbound I-95, there are 9 overhead sign structures with unlit signs with the following messages: Petersburg Tourist Information Center Use Exit 52 (MP 54.3) Exit 51 I-85S/Route 460W South Hill Blackstone (MP 53.0) Exit 52 Historic Old Towne Petersburg Washington St Wythe St (MP 52.5) To 460 West (MP 50.3) Exit 49B Wagner Rd West ½ Mile (MP 49.5) Exit 47 Rives Road 1 ½ Miles (MP 49.3) Exit 48A Wagner Rd East ¼ Mile & Exit 48B Wagner Rd West (MP 49.1) Exit 47 Rives Rd ½ Mile (MP 48.3) Exit 47 Rives Rd (MP 48.1) COUNTERMEASURE 3C: ADDITIONAL SIGNING IMPROVEMENTS The I-95 southbound loop off-ramp to Wagner Road East does not have a Horizontal Alignment (W1-15) sign or an Advisory Exit and/or Ramp Speed (W13-2, W13-3) warning sign. The ballbank/limiting angle method as defined in the VDOT Traffic Engineering Memorandum (TE-363) should be conducted to determine if warning signs are warranted to be installed at this location. The continuous flashing beacons on the Truck Rollover Warning (W1-13) sign on the I-95 northbound off-ramp to I-85 southbound (milepost 51.7) were observed to be nonfunctioning during the field review conducted on March 27, This sign is shown in Photograph 3. Replacing the continuous flashing beacons are recommended as part of the corridor-wide improvements. Photograph 3: Continuous Flashing Beacons on Truck Rollover Warning Sign 39
54 I-95/I-85 Interchange ISSUE 4: VERTICAL CLEARANCES There are a total of 6 bridge structures over I-95 and 3 bridge structures over I-85 in the study area. According to the VDOT Manual of the Structure and Bridge Division Volume V Part 2 Design Aids (Chapter 6 Geometrics), the minimum bridge vertical clearance is 16 6 for urban interstates. Eight of the 9 bridge crossings, summarized in Table 14, are vertically deficient, thereby creating potential hazards to vehicles that require 16.5 feet of vertical clearance. Historical bridge strike information, shown in Table 14, was provided by VDOT Richmond District for a 13-year period from 1999 to There were a total of 19 reported bridge strikes located within the study corridor in the 13-year period. The highest number of bridge strikes was recorded at the E. Washington Street and I-95 bridges over I-95 with 5 strikes each, followed by the Southpark Boulevard bridge over I-95 with 3 strikes. VDOT noted the actual number of bridge strikes may be higher as many of the impacts do not stop the vehicle and the damage is not discovered until the next bridge inspection is conducted. Over I-95 Table 14: Historical Bridge Strike Information from 1999 to 2011 Bridge Crossing Number of Bridge Strikes Bridge Height Existing < 16 6 ^ E. Ellerslie Avenue Conduit Road Southpark Boulevard E. Washington Street Wagner Road Rives Road Over I-85 I-95 (over northbound I-85) I-95 (over southbound I-85) S. Sycamore Street Total = 19 ^ Minimum bridge vertical clearance is 16.5 feet for urban interstates (Source: VDOT Manual of the Structure and Bridge Division Volume V Part 2 Design Aids (Chapter 6 Geometrics) COUNTERMEASURE 4A: LOW BRIDGE WARNING SYSTEM Install low bridge warning systems on the northbound and southbound I-95 approaches to the study area. Each system will consists of a pole mounted vehicle presence detector and an over height vehicle sensor installed upstream of the low bridge structure. When an over height vehicle is detected, a signal is transmitted to a variable message sign (VMS) which then displays a message advising the driver to take an alternate route. A conceptual layout of a low bridge warning system is provided in Figure 25. Potential locations on I-95 may include prior to the I-295 Interchange in the northbound direction and prior to the Route 10 interchange (Exit 61) in the southbound direction, both provide access to I-295 which could serve as an alternate route around study corridor which contains a number of low bridge structures. Final locations should consider low bridges adjacent to the study corridor and alternate routes that can accommodate heavy vehicle traffic. 40
55 VMS Figure 25: Conceptual Layout of Low Bridge Warning System I-95/I-85 Interchange Alternate Route Bridge with Low Vertical Clearance Alternate Route VMS LEGEND VMS Vehicle Presence Detector Over height Detector Variable Message Sign The benefits of installing a low bridge warning system include improvements to safety and operations throughout the corridor. Minimizes the risk of high vehicles striking low bridges Avoids traffic delays experienced due to a bridge strike COUNTERMEASURE 4B: STRUCTURE REPLACEMENT Replace bridge and/or overhead sign structures to meet minimum vertical clearance height requirements. COUNTERMEASURE 4C: SIGNING Install Low Clearance with arrows (W12-2) warning signs on the following bridges displaying the existing bridge heights shown in Table 14. ISSUE 5: INTERCHANGE SPACING & ACCELERATION/DECELERATION LANE LENGTHS As shown in Table 1 in the Existing Conditions section of the report, three segments do not meet the 2004 AASHTO A Policy on Geometric Design of Highways and Streets, Fifth Edition minimum interchange spacing recommendation of one mile between interchanges on an urban interstate. Closely spaced interchanges within an urban area create friction and turbulence, which can result in increased congestion, bottlenecks, and corresponding crashes. On northbound I-95, the segments with less than one mile between adjacent interchanges are listed below: Between Rives Road on-ramp and Wagner Road off-ramp Between S Crater Road/CD Road on-ramp and I-85 off-ramp Between I-85 on-ramp and E Bank Street off-ramp Between E Bank Street off-ramp and Washington Street/Wythe Street on-ramp Between Washington Street/Wythe Street on-ramp and Southpark Boulevard off-ramp Between Southpark Boulevard on-ramp and Temple Avenue off-ramp On southbound I-95, the segments with less than one mile between adjacent interchanges are listed below: Between Temple Avenue on-ramp and Roslyn Road off-ramp Between Roslyn Road on-ramp and Washington Street/Wythe Street off-ramp Between Washington Street/Wythe Street off-ramp and I-85 off-ramp 41

56 I-95/I-85 Interchange Between I-85 off-ramp and Washington Street/Wythe Street on-ramp Between Washington Street/Wythe Street on-ramp and S Crater Road/CD Road off-ramp Between S Crater Road/CD Road off-ramp and Winfield Road/CD Road on-ramp Between Wagner Road on-ramp and Rives Road off-ramp As summarized in Table 15, several of the acceleration and deceleration lane lengths do not meet the standards given in the 2004 AASHTO A Policy on Geometric Design of Highways and Streets, Fifth Edition. Table 15: Acceleration and Deceleration Lane Deficient Lengths COUNTERMEASURE 5A: CORRIDOR-WIDE OPERATIONS STUDY A corridor-wide operational analysis is recommended to identify the impacts of short interchange spacing and deficient acceleration/deceleration lanes have on corridor-wide operations. Such a study could be used to further justify the need for future long-term improvements throughout the I-95 study corridor. COUNTERMEASURE 5B: LENGTHEN ACCELERATION/DECELERATION LANES Lengthen the deficient acceleration and deceleration lanes to meet AASHTO standards. The lengths by which each acceleration or deceleration lane should be increased to meet current standards are given in Table 15. ISSUE 6: PAVEMENT CONDITION Overall the pavement condition in the corridor is in fair to good condition. Some segments, specifically the south end of the corridor and the north end of the corridor, have recently been paved. The middle segment of the corridor was not paved during the same timeframe as the adjacent segments leaving some inconsistent pavement sections. 42
57 I-95/I-85 Interchange COUNTERMEASURE 6A: PAVING SCHEDULE Based on discussions with VDOT, the study corridors are not currently on a paving schedule; however, it is recommended that the entire corridor be paved to improve roadway visibility and drivability. In addition, drainage, rumble strips, striping and in pavement reflectors should also be assessed and potentially upgraded at this time. ISSUE 7: CORRIDOR LIGHTING Approximately 30% of all crashes in the corridors occurred under dark conditions. Of those crashes, 71% were reported as occurring on a segment of roadway without lighting. Figure 10 illustrates the locations of the dark crashes relative to the location of lighting in the corridor. Roadway lighting will improve visibility in the corridor and can help with driver response time in segments where there are high traffic volumes and closely spaced interchanges. COUNTERMEASURE 7A: CONDUCT LIGHTING STUDY Conduct a corridor-wide lighting warrant study and install additional lighting as appropriate. Typically, it is recommended that interchanges have high mast lighting and other segments have conventional lighting types. VDOT should also consider the addition of underbridge lighting systems for bridges in the corridor as an additional safety measure. HOT SPOT 1 NORTHBOUND I-95 FROM MILEPOST 54.4 TO 54.9 Hot Spot 1 is located on northbound I-95 and extends from just south of the Temple Avenue on-ramp to the northern limits of the study corridor (1000 feet north of Temple Avenue). Hot Spot 1 includes the roadway segment that contains both on-ramps from eastbound and westbound Temple Avenue; however, it does not include the off-ramp to Temple Avenue. CRASH ANALYSIS Crashes within Hot Spot 1 are summarized in Table 16. The major conclusions that can be drawn from the information in this table are: Six injury crashes out of 22 total crashes were reported, accounting for 27% of total crashes. The predominate crash type is fixed-object off road, accounting for 8 out of 22 total crashes or 36%. Four of the fixed-object off road crashes departed the road to the right guardrail exists on the right side of the road along the Temple Avenue on-ramp in this segment but does not exist north of the merge point. Four of the fixed-object off road crashes departed the road to the left a traffic barrier exists on the left side of the road throughout this segment.` Eleven, or 50%, of the crashes occurred in dark conditions lighting does not exist along this segment of roadway. SAFETY ISSUES TO BE ADDRESSED The percentage (50%) of crashes occurring in dark conditions suggests that visibility is an issue in this area. Five crashes involved slick pavement or hydroplaning, resulting in three fixed object off road crashes and two angle crashes. There were a total of five crashes related to merging maneuvers from the Temple Avenue on-ramps (both ramps) to northbound I-95, resulting in three sideswipe - same direction crashes, one fixed-object off road crash, and one angle crash. 43
58 I-95/I-85 Interchange Table 16: Crash Summary Hot Spot 1 (I-95 NB, Milepost 54.4 to 54.9) Year # % Total Fatal % Property Damage % By Severity: By Weather: Total Injury % Type A % Type B % Type C % Clear & Cloudy % Rain % All Other (Mist/Sleet/Hail) % By Roadway Surface Conditions: By Light Conditions: By Type of Collision: Dry % Wet % All Other % Day % Dawn/Dusk % Dark % Rear-End % Sideswipe - Same Direction % Fixed Object Off Road - Right % Fixed Object Off Road - Left % All Other % By Number of Vehicles Involved: By Time of Day: Crash Characteristic Number of Crashes Total One % Two % Three and Greater % AM Peak (6-10) % PM Peak (3-7) % Off Peak % 44


59 I-95/I-85 Interchange Photograph 4: End of Northbound Temple Avenue Acceleration Lane (Northern On-Ramp) PROPOSED RECOMMENDATIONS There is currently a proposed project to reconstruct the Temple Avenue interchange. This project would involve the construction of a roundabout at the intersection of the I-95 on- and off-ramps and Temple Avenue. A conceptual layout displaying the proposed interchange design is shown in Figure 26 to the right. It is recommended that the following improvements be implemented, if possible, with the Temple Avenue intersection reconstruction project. Conduct a lighting study for the interchange and install high mast lighting in the vicinity of the interchange. A lighting study for this interchange should also be performed in Figure 26: Proposed Temple Roundabout conjuncture with a lighting study for the entire study corridor (see corridor-wide recommendations above). Lighting installation will improve driver visibility in dark conditions. Conduct a more detailed drainage assessment in the vicinity of the Temple Avenue interchange. Conduct a pavement friction test in the vicinity of the Temple Avenue interchange in conjuncture with the detailed drainage assessment. Install Lane Ends Merge Left (W9-2) signs at the ends of both northbound I-95 on-ramps from Temple Avenue to warn drivers that the lane is ending. HOT SPOT 2 SOUTHBOUND I-95 FROM MILEPOST 52.4 TO 52.9 Hot Spot 2 is located on southbound I-95 and extends from the northern city limit of Petersburg to just south of the off-ramp to Washington Street/Wythe Street (Exit 52). 45
60 I-95/I-85 Interchange CRASH ANALYSIS Crashes within Hot Spot 2 are summarized in Table 17. The major conclusions that can be drawn from the information in this table are: Seven injury crashes out of 25 total crashes were reported accounting for 28% of injury crashes. The predominate crash types are rear end and fixed-object off road. Rear end crashes accounted for 10 out of 25 total crashes or 40% and fixed-object off road crashes accounted for 9 out of 25 total crashes or 36%. Two of the fixed-object off road crashes departed the road to the right guardrail or traffic barriers exists on the right side of the road throughout this segment. Seven of the fixed-object off road crashes departed the road to the left a traffic barrier exists on the left side of the road throughout this segment. Table 17: Crash Summary Hot Spot 2 (I-95 SB, Milepost 52.4 to 52.9) Year # % Total Fatal % Property Damage % By Severity: By Weather: Total Injury % Type A % Type B % Type C % Clear & Cloudy % Rain % All Other (Mist/Sleet/Hail) % By Roadway Surface Conditions: By Light Conditions: By Type of Collision: Dry % Wet % All Other % Day % Dawn/Dusk % Dark % Rear-End % Sideswipe - Same Direction % Fixed Object Off Road - Right % Fixed Object Off Road - Left % All Other % By Number of Vehicles Involved: By Time of Day: Crash Characteristic Number of Crashes Total One % Two % Three and Greater % AM Peak (6-10) % PM Peak (3-7) % Off Peak % 46
61 I-95/I-85 Interchange SAFETY ISSUES TO BE ADDRESSED The existing crash pattern of rear-end crashes suggests congestion, insufficient deceleration/acceleration lengths, and/or short weave segments as possible contributing factors. Congestion was not observed during the field review, but the RSA team did note the Washington Street off-ramp has a history of recurring congestion. Specifically, it was noted that queuing on the Washington Street off-ramp often backs up onto the interstate during the PM peak. A 24-hour traffic count conducted on March 3, 2012 had an AM peak hour volume of 491 vehicles and a PM peak hour volume of 535 vehicles. The AM peak hour occurred from 7:30 AM to 8:30 AM and the PM peak hour occurred from 4:00 PM to 5:00 PM. PROPOSED RECOMMENDATIONS Recommendations for this location are consistent with the corridor-wide recommendations described above. HOT SPOT 3 SOUTHBOUND I-95 FROM MILEPOST 53.4 TO 53.9 Hot Spot 3 is located on southbound I-95 and extends from the Temple Avenue on-ramp to the Southpark Boulevard off-ramp. CRASH ANALYSIS Crashes within Hot Spot 3 are summarized in Table 18. The major conclusions that can be drawn from the information in this table are: Six injury crashes out of 27 total crashes were reported, accounting for 29% of total crashes. The predominate crash type is fixed-object off road, accounting for 12 out of 27 total crashes or 44%. Three of the fixed-object off road crashes departed the road to the right guardrail exists on the right side of the roadway north of milepost 53.8 and surrounding the overhead sign structure located between milepost 53.5 and milepost 53.6 in this segment. Nine of the fixed-object off road crashes departed the road to the left a traffic barrier exists on the left side of the road throughout this segment. Thirteen or 48% of the crashes occurred in dark conditions lighting does not exist along this segment of roadway. SAFETY ISSUES TO BE ADDRESSED The percent of crashes occurring in dark conditions suggest that lighting is inadequate along this segment of roadway. There are no reflectors on the median barrier 5 of the 9 fixed-object off road crashes to the left occurred in darkness. PROPOSED RECOMMENDATIONS Recommendations for this location are consistent with the corridor-wide recommendations described above. Conduct a lighting study for the interchange and install high mast lighting in the vicinity of the interchange. A lighting study for this interchange should also be performed in conjuncture with a lighting study for the entire study corridor (see corridor-wide recommendations above). Lighting installation will improve driver visibility in dark conditions. 47
62 AREA OF INTEREST RIVES ROAD INTERCHANGE I-95/I-85 Interchange Rives Road is currently in the design phase to be widened from US 301 to the I-95 interchange. A traffic study was conducted as part of the widening project turning movement counts from at the I-96 Rives Road interchange were reviewed and used as a basis to develop Existing (2012) and Future (2035) traffic volumes to be used in an operational analysis for purposes of this study. Development of Existing (2012) and Future (2035) traffic volumes are provided in Appendix D. A supplemental crash analysis and operational analysis using Existing (2012) and Future (2035) traffic volumes was conducted to build on the efforts of the previous traffic study and further justify the need to identify long-term improvements at the Rives Road Interchange. Table 18: Crash Summary Hot Spot 3 (I-95 SB, Milepost 53.4 to 53.9) Year # % Total Fatal % Property Damage % By Severity: By Weather: Total Injury % Type A % Type B % Type C % Clear & Cloudy % Rain % All Other (Mist/Sleet/Hail) % By Roadway Surface Conditions: By Light Conditions: By Type of Collision: Dry % Wet % All Other % Day % Dawn/Dusk % Dark % Rear-End % Sideswipe - Same Direction % Fixed Object Off Road - Right % Fixed Object Off Road - Left % All Other % By Number of Vehicles Involved: By Time of Day: Crash Characteristic Number of Crashes Total One % Two % Three and Greater % AM Peak (6-10) % PM Peak (3-7) % Off Peak % 48


63 I-95/I-85 Interchange EXISTING CONDITIONS The Rives Road interchange (Exit 47) has a diamond configuration with the northbound and southbound ramp approaches operating as stop controlled. 24-hour traffic counts were collected on March 28, 2012 for all four ramps of the interchange. The peak hour ramp volumes at the interchange are summarized in Figure 27 and the 24-hour traffic volumes are shown in Figure 28. Mainline I-95 volumes were obtained from VDOT permanent count stations for June 27, Volumes from count station were used as the mainline I-95 volumes north of the Rives Road interchange and traffic volumes from count station were used as the mainline I-95 volumes south of the Rives Road interchange. For all traffic counts the peak hour volumes reported correspond to the highest one hour volume occurring between 7:00 AM and 9:00 AM and between 4:00 PM and 6:00 PM. Figure 27: Rives Road Interchange - Peak Hour Ramp Traffic Volumes 49
64 I-95 Figure 28: Rives Road Interchange - 24-Hour Ramp Traffic Volumes I-95/I-85 Interchange 3,723 3,463 Rives Rd Legend XX - Weekday Daily 24 Hour Traffic Volumes - Traffic Movement N CRASH ANALYSIS According to an incident event list provided by the Petersburg Police Department, approximately 20 crashes occurred between January 1, 2007 and December 31, 2009 at the intersections of the northbound and southbound I-95 ramps to Rives Road. Crash reports were requested for all 20 events; however, only 10 of the reports were obtained. These 10 crashes are displayed in the collision diagrams in Figure 29 and 30. The major conclusions that can be drawn from the information in these figures are: Four of the five total crashes at the intersection of Rives Road and I-95 southbound ramps were angle crashes. 50
65 Figure 29: Collision Diagram - Rives Road and I-95 Northbound I-95/I-85 Interchange 51
66 Figure 30: Collision Diagram - Rives Road and I-95 Southbound I-95/I-85 Interchange 52
67 I-95/I-85 Interchange Rives Road is currently in the design phase to be widened from a two-lane undivided roadway to a four-lane undivided roadway from US 301 to the I-95 interchange. Findings of the Rives Road at I-95 Traffic Study conducted as part of the current widening project concluded that the following improvements addressed intersection delays and queues for the projected design year (2036) traffic volumes. The improvements below are being included in the Rives Road widening project currently in the design stage at the time of this study: Construct southbound right-turn lane with 500 storage and a 200 taper at the intersection of Rives Road at I-95 southbound; Construct northbound right-turn lane with 200 storage and 200 taper at the intersection of Rives Road at I-95 Northbound; Junction boxes and conduit for a potential future signal at the intersection of Rives Road at I-95 Southbound will be constructed as part of the Rives Road widening; and VDOT should monitor the intersections of Rives Road at I-95 southbound and Rives Road at I-95 northbound to determine when/if traffic signal warrants are met. For analysis results of the aforementioned improvements, refer to the Rives Road at I-95 Traffic Study. Highway Capacity Software (HCS) was used to analyze the existing (2012) and future (2035) levels of service (LOS) for Rives Road on- and off-ramps during both the AM and PM peak time. The existing HCS analysis was conducted using the existing roadway network with Rives Road as a two-lane undivided roadway. Future year analysis was conducted assuming Rives Road has been widened to a four-lane roadway and right-turn lanes have been constructed on the northbound and southbound I-95 Ramps. Results of the HCS analysis are provided in Table 19 below. All ramps operate at LOS B or better during both the existing and future years. HCS output sheets are provided in Appendix D. From Table 19: Rives Road at I-95 - Existing (2012) and Future (2035) HCS Results To Density (pc/mi/ln) LOS Density (pc/mi/ln) LOS Density (pc/mi/ln) LOS Density (pc/mi/ln) I-95 Southbound Off-Ramp Rives Road 6.8 A 10.3 B 8.4 A 14.8 B Rives Road I-95 Southbound Off-Ramp 7.3 A 10.2 B 8.8 A 14.2 B I-95 Northbound Off-Ramp Rives Road 3.7 A 3.6 A 6.5 A 6.5 A Rives Road I-95 Northbound Off-Ramp 12.8 B 12.7 B 19.0 B 19.1 B LOS = Level of Service Ramp pc/mi/ln = passenger car/mile/lane AM Peak Hour Existing (2012) PM Peak Hour AM Peak Hour Future (2035) PM Peak Hour LOS Synchro was used to analyze the LOS at the unsignalized intersections of the northbound and southbound I-95 off-ramps and Rives Road given existing and future traffic volumes. The existing Synchro analysis was conducted using the existing roadway network with Rives Road as a two-lane undivided roadway. Future year analysis was conducted assuming Rives Road has been widened to a four-lane roadway and right-turn lanes have been constructed on the northbound and southbound I-95 Ramps. Results of the Synchro analysis are provided in the Table 20 below. The one-lane approach ramps operate at LOS E or better under 2012 existing traffic volumes. Both ramps are projected to operate at LOS F during future (2035) traffic conditions. Synchro output sheets are provided in Appendix D. The HCS and Synchro operational analysis conducted as part of this study is supplemental to the traffic analysis conducted as part of the Rives Road widening project. The operational analysis conducted as part of this study was done using updated 2012 traffic volumes and 2035 traffic volumes developed using growth rates from the latest Richmond Regional travel demand model. Developing long-term solutions at 53
68 I-95/I-85 Interchange the I-95/Rives Road interchange were not included in the scope of this study; however, the results of the operational analysis indicate long-term improvements will be necessary should traffic in the area be realized as projected. Table 20: Rives Road at I-95 - Existing (2012) and Future (2035) Synchro Results Existing (2012) Future (2035) Intersection Intersection Control Approach/ Intersection Delay (sec/veh) LOS 95th Percentile Queue (feet) Delay (sec/veh) LOS 95th Percentile Queue (feet) AM Peak Hour I-95 NB Ramp at Rives Road I-95 SB Ramp at Rives Road PM Peak Hour I-95 NB Ramp at Rives Road I-95 SB Ramp at Rives Road Unsignalized Unsignalized Unsignalized Unsignalized EBTL 4.6 A A 56 WBTR 0.0 A A 0 NBLTR 28.6 D 33 NBLT F 175 NBR* Intersection 28.6 D F EBTR 0.0 A A 0 WBLT 0.8 A A 1 SBLTR 19.0 C 83 SBLT 24.1 C 142 SBR* Intersection 19.0 C 24.1 C EBTL 3.4 A A 40 WBTR 0.0 A A 0 NBLTR 36.5 E 43 NBLT F 199 NBR* Intersection 36.5 E F EBTR 0.0 A A 0 WBLT 0.8 A A 2 SBLTR 32.7 D 171 SBLT 43.5 E 325 SBR* Intersection 32.7 D 43.5 E * No delay or queue reported SAFETY ISSUES TO BE ADDRESSED The Rives Road interchange has been identified to have insufficient sight distance at the ramp intersections on Rives Road. Sight distance looking across the bridge over I-95 from either ramp is negatively impacted by the bridge abutments and poses as a safety issues. This issue will be furthered compounded with potential traffic growth through the study area. Photograph 5-8 were taken at the stop bars of the northbound and southbound off-ramps to Rives Road show and show the reduced sight distance. 54

 and Wythe Street (straight) exits.")


69 I-95/I-85 Interchange Photograph 5: I-95 Northbound Ramp at Rives Road Looking to the West Photograph 6: I-95 Northbound Ramp at Rives Road Looking to the East Photograph 7: I-95 Southbound Ramp at Rives Road Looking to the East Photograph 8: I-95 Southbound Ramp at Rives Road - Looking to the West AREA OF INTEREST I-95 SOUTHBOUND OFF-RAMP TO WASHINGTON STREET EXISTING CONDITIONS The southbound I-95 off-ramp to Washington Street (Exit 52) is currently controlled by a stop sign. Washington Street is a one-way, four lane roadway at the intersection with the I-95 Southbound offramp. The ramp extends 750 feet before splitting into Washington Street (to the right) and Wythe Street (straight) exits. The Washington Street ramp extends an additional 700 feet before reaching a Stop sign. With current traffic patterns, traffic must stop at the end of the ramp, and there is no acceleration or merge lane available onto Washington Street. The angle for viewing the approaching (travelling westbound) traffic increases risk of crashes at this location. The adjacent section of I-95 Southbound has a posted speed limit of 55 mph, and Washington Street has a posted speed limit of 35 mph at the intersection. Washington Street has a functional classification as an urban principal arterial. Approximately 200 feet downstream of the southbound I-95 off-ramp is the unsignalized intersection of Washington Street and Madison Street. The next intersection to the west is Jefferson Street and it is spaced approximately 1,000 feet from the ramp. Based on Appendix F of the VDOT Road Design Manual, 55


70 I-95/I-85 Interchange the Madison Street intersection is located too close to the ramp by approximately 550 to comply with VDOT Access Management Regulations. Crash data was obtained from VDOT for the I-95 SB off-ramp and Washington Street intersection. Based on the available data, there were several crashes that occurred in the vicinity of the intersection. The two main factors determined from the crash reports were that the crashes were related to a lane change movement or were a rear end crash on the ramp. A 24-hour traffic count was conducted on March 28, 2012 on the I-95 Southbound off-ramp to Washington Street and on Washington Street just east of the I-95 Southbound off-ramp. The AM and PM peak hour volumes collected at the interchange are summarized in Figure 31. During a field visit on March 27, 2012, a 15-minute traffic count was conducted to determine lane utilization as a percent of total ramp volume. The number of vehicles in each lane on Washington Street that originated from the southbound I-95 off-ramp were counted to also determine lane utilization as a percent of total mainline volume. The peak hour lane utilization volumes were derived using these percentages and are illustrated in Figure 32. Photograph 9: Southbound I-95 Off-Ramp to Washington Street Figure 31: Southbound I-95 Off-Ramp to Washington Street - Peak Hour Volumes 56
71 I-95/I-85 Interchange Figure 32: Southbound I-95 Off-Ramp to Washington Street - Volumes by Lane I-95 SB Off-Ramp AM Peak: 7:30 8:30 PM Peak: 4:00 5: (535) 43% 209 (227) 34% 168 (183) 21% 102 (111) 3% 12 (13) 23% 166 (200) 27% 198 (238) 34% 249 (300) 16% 123 (148) Washington St 736 (886) AM Peak: 7:45 8:45 PM Peak: 4:00 5:00 Legend XX (XX) - Weekday AM (PM) Peak Hour Traffic Volumes - Traffic Movement N % - XX (XX) - Weekday Percentage AM (PM) Peak Hour Volumes SAFETY ISSUES TO BE ADDRESSED The southbound I-95 ramp has been identified as a lane utilization issue for vehicles travelling west on Washington Street and vehicles merging onto Washington Street from the southbound I-95 ramp. There were several reported crashes related to lane maneuvers. Rear end crashes were also reported on the off-ramp approach to Washington Street. Due to the conflicts created from this merging condition, queues from the ramp routinely impact southbound I-95 during the PM peak hours. Queuing of vehicles on the southbound I-95 off-ramp to Washington Street was not observed during the field review but was cited as an issue by members of the RSA team. Queuing on an interstate, where vehicles are traveling at high speeds and drivers are not expecting to stop, is a major safety concern. PROPOSED RECOMMENDATIONS Short Term Recommendations Allow for a free-flow movement from the southbound I-95 off-ramp onto Washington Street Reduce queuing on the ramp, reduce impacts to the I-95 travel way Reduce the number of lanes prior to the southbound I-95 off-ramp from four lanes to three lanes through the use of pavement markings across the overpass Washington Street will operate adequately with 3 travel lanes Close Madison Street and private driveways between the ramp and intersection, and eliminate the rightturn movements from Washington Street. Improve corridor access management Reduce the weaving movements that were caused specifically by vehicles turning right on Madison Street Figure 33 shows a graphical depiction of the short-term recommendation described above. 57
72 Madison Street Madison Street I-95/I-85 Interchange Figure 33: Washington Street - Short-Term Recommendation Figure 34: Washington Street - Long-Term Recommendation 200 I-95 SB Off-Ramp 200 I-95 SB Off-Ramp Washington Street Washington Street Legend -Turning Movement -Right Turn Prohibited N Legend -Turning Movement -Right Turn Prohibited N Long-Term Recommendations Monitor traffic patterns and weave issues on Washington Street, upstream and downstream of the intersection. Should it be determined that a weaving and safety issue still exists by the lane changes between the ramp and Jefferson Street, then an additional analysis should be completed. A possible solution for this issue would be to install traffic barrier to separate the ramp free-flow lane from Washington Street through traffic. A barrier would shift the weaving area further to the west and away from the ramp. Note that this would only become a feasible recommendation once a study determined that operations and safety between the ramp and Jefferson Street achieved acceptable levels. A possible configuration for the long-term recommendation is shown in Figure 34. AREA OF INTEREST I-85 NORTHBOUND OFF-RAMP TO I-95 SOUTHBOUND The yield condition on the I-85 northbound off-ramp to I-95 southbound creates a safety issue due to the short weaving segment, steep uphill grade, and percent of heavy vehicles making this movement. EXISTING CONDITIONS Vehicles traveling from I-85 northbound to I-95 southbound are on a steep grade and must merge across the vehicles on the collector-distributor road exiting to Graham Road. The length of this weaving segment is 250 feet. A total of 12 crashes occurred on the northbound I-85 to southbound I-95 off-ramp from 1/1/2007 to 12/31/2009, specifically: Rear end (9) Non collision (1) Fixed object off road (1) Sideswipe same direction (1) The number of crashes on this off-ramp has remained consistent based on a review of the I-85/I-95/Route 460 Interchange Study. From 1996 to 1998 a total of 10 crashes occurred on this ramp with the following broken down by crash type: Rear end (2) 58

73 I-95/I-85 Interchange Fixed object off road (7) Sideswipe same direction (1) A yield sign with continuous flashing beacons exists on the right shoulder of the I-85 off-ramp; however, it was observed that vehicles merging from the I-85 off-ramp onto the I-95 CD road frequently failed to yield. VDOT installed the yield pavement markings (shark s teeth) as a short-term countermeasure; however the safety concern still exists. Photograph 10: Northbound I-85 to Southbound I-95 Weave During the preliminary field review, video was recorded of the weave segment to determine the origin and destination of vehicles. The video was recorded for a 7.5 minute period and the observed volumes were multiplied by eight to get the hourly volumes shown in Figure 35. Figure 35: I-95 SB/I-85 NB Weave PM Peak Hour Traffic Volumes SB I-95 CD Road Legend XX - PM Hourly Traffic Volumes - Traffic Movement N 59
74 I-95/I-85 Interchange SAFETY ISSUES TO BE ADDRESSED Ten crashes were reported at the I-85 northbound/i-95 southbound weave segment during the period from 1/1/2007 to 12/31/2009. Of these ten crashes, eight were rear-end crashes, one was a fixed object-off road crash, and one was a sideswipe-opposite direction. PROPOSED RECOMMENDATIONS Short Term Recommendation Increase existing Yield Sign (R1-2) size to 60 x60 x60 to improve visibility of traffic control device. Long-Term Recommendation Reconfigure the I-95/I-85/Route 460 interchange to mitigate the deficient weaving movement at this location. A possible solution is provided in subsequent section of this study. ADDITIONAL SHORT-TERM IMPROVEMENTS AND LONG-TERM CONCEPTS The focus of this study was to conduct a roadway safety assessment; however, parallel VDOT efforts were conducted during the course of this study in anticipation of future efforts to identify additional short-term improvements and long-term concepts in the I-95/I-85/Route 460 interchange area. Drawing from the previous 2000 study and the Tri-Cities MPO Constrained Long-Range Plan (CLRP) one short-term improvement and three long-term concepts were developed. The long-term concepts were included in this study to document the order of magnitude of projects required to meet future operational and safety needs in the area of the I-95/I-85/Route 460 interchange. These concepts will provide a jumping off point for future efforts to further identify and refine long-term concepts in the area. This section of the report documents the methodology and recommendations from VDOT s in-house planning efforts. FUTURE TRAFFIC VOLUMES For the purpose of developing future traffic for 2035 for the I-95/I-85 Interchange Study, VDOT staff reviewed available travel demand modeling and Statewide Planning System (SPS) data for principal study mainline and cross street locations. Traffic volumes were taken from the most recent Richmond/Tri-Cities travel demand model based on the 2035 MPO CLRP effort for both the Richmond and Tri-Cities MPOs. SPS is an oracle database tool which VDOT uses to develop planning level traffic forecasts based on historical trend line analysis for roadways throughout Virginia. SPS results for this effort included all available VDOT Traffic Monitoring System (TMS) traffic counts through VDOT staff conducted a review of traffic forecasts for the I-95/I-85/Route 460 interchange area using both SPS and the Richmond/Tri-Cities travel demand model. The purpose of this review was to create a comparison between the 2000 I-95/I-85/Route 460 Interchange study forecasts with those now available from the latest data and model. The 2000 study had a base year of 2000 and a forecast year of The new model has a base year of 2008 and a forecast year of SPS was used to document existing traffic for 2008 and the travel demand model was used to develop growth rates from 2008 to These growth rates were then used to develop traffic forecasts for both 2020 and 2035 based on 2008 existing traffic. In addition to the forecasts developed for the I-95/I-85/Route 460 interchange area, growth rates were developed for the Rives Road Interchange area using the Richmond/Tri-Cities Travel Demand Model in order to review potential future capacity concerns at this interchange. The growth rates were developed based on 2008 to 2035 projected growth and rounded to the nearest tenth of a percentage point. Future traffic volumes for 2035 were 60

75 I-95/I-85 Interchange then developed using these growth rates and are shown in Figure 36. Future 2035 traffic volumes are projected to reach over 100,000 ADT on I-95 and 89,000 ADT on I-85 in the area of the I-95/I-85/Route 460 interchange. The projected future traffic volumes coupled with the documented roadway deficiencies and safety issues further indicate the need for long-term improvements to be identified and implemented within the study area. CRITICAL RAMP MOVEMENTS I-85, I-95, Route 460, and US 301 converge in the City of Petersburg, Virginia in a complex series of interchanges. Within a two-mile length, I-95 intersects with four separate roadways through a network of ramps and collector-distributor roads, many of which are deficient by today s standards. First developed in the late 1950 s as part of the Richmond-Petersburg Turnpike, many ramps and weaving areas of the I-85/95/Route 460 interchange do not have the capacity adequately support today s traffic volumes. The I-95/I-85/Route 460 Interchange Study conducted in 2000 documented in detail the traffic safety and operations concerns for the corridor and should traffic volumes continue to grow the issues will intensify. The following three ramp movements along the I-95/I-85/Route 460 study corridor were identified as critical based on the following roadway geometrics and operational movements and are illustrated on Figure 37. A. Short weave/merge (250 feet) at I-85 northbound to I-95 southbound movement at Graham Road B. Short weave/merge (360 feet) from S. Crater Rd to I-95 northbound C. Tight turning radius and low bridge clearance at I-95 northbound to I-85 southbound ramp movement Figure 37: Critical Ramp Movements DESCRIPTION OF ADDITIONAL IMPROVEMENTS AND CONCEPTS SHORT-TERM IMPROVEMENTS Short-Term Improvement #1 Wagner Road Alternate Route Feasibility Study The previous I-95/I-85/Route 460 Interchange Study from 2000 recommended that a study be conducted to determine the feasibility of designating Wager Road or I-295 as alternate roadways to alleviate traffic congestion through the I-95/I-85/Route 46 interchange. The feasibility study should consider the following: Determine if the geometric configuration of Wagner Road warrants an increase to the speed limit currently posted at 40 mph. Determine if increasing the speed limit on Wagner Road between I-95 and Route 460 would increase/impact the projected diverted traffic volume. Determine the required signing improvements to reroute the through traffic on Route 460 to Wager Road or I

76 I-95/I-85 Interchange Figure 36: Traffic Comparison for I-95/I-85/Route 460 Interchange Area 62
77 I-95/I-85 Interchange The City of Petersburg is responsible for operating and maintaining the section of Wagner Road from I-95 to Route 460 recommended for review in the feasibility study. The City does not currently maintain any roadways with speed limits higher than 40 mph. Should a speed limit higher than 40 mph be recommended for Wagner Road, the City would be required to purchase, or secure the use of, a maintenance vehicle equipped with a truck-mounted attenuator to continue the operation and maintenance of such a roadway under the requirements of the current VDOT Work Area Protection Manual. LONG-TERM CONCEPTS Potential long-term concepts that could address the current safety and operational issues associated with the three critical ramp movements are summarized below and illustrated graphically on Figure 38. Long-Term Concept #1 - I-85 Northbound to I-95 Southbound Ramp Movement 1. Close the existing I-95 southbound off-ramp to Graham Road. 2. Close the existing I-95 southbound on-ramp from S. Crater Road. 3. Improve intersection of Graham Road and S. Crater Road and the on-ramp to southbound I-95 to allow southbound left-turn movement from S. Crater Road. 4. Construct new I-95 off-ramp to S. Crater Road. Preliminary engineering (30% plans) would need to be conducted to determine environmental feasibility. Long-Term Concept #2 - S. Crater Road to I-95 Northbound Ramp Movement 1. Close the existing I-95 northbound on-ramp from S. Crater Road and reusing the existing Winfield Road to move northbound on-ramp connection to County Drive. 2. Improve two intersections, one at the intersection of Winfield Road and County Drive and the other at the intersection of Winfield Road and S. Crater Road to facilitate new traffic movements. Long-Term Concept #3 - I-95 Northbound to I-85 Southbound Ramp Movement 1. Close the existing I-95 northbound off-ramp to I-85 southbound and construct a new flyover ramp from I-95 northbound to I-85 southbound. PLANNING LEVEL COST ESTIMATES Planning level cost estimates were developed for the following short-term improvements and long-term concepts: Short-term area of interest improvement at I-95 southbound off-ramp at Washington Street Additional short-term improvement - Wagner Road Alternate Route Feasibility Study Three long-term concepts to address critical ramp movements at the I-95/I-85/Route 460 interchange The long-term concepts were developed to understand the order of magnitude required to fund larger scaled projects throughout the I-95/I-85/Route 460 study area. VDOT staff used a combination of the Statewide Planning Level Cost Estimates and the Project Cost Estimating System (PCES) as the primary tool for estimating project costs for the long-term concepts. PCES is the project cost estimation tool used in Virginia for project cost development and accounts for the full range of potential project costs including preliminary engineering (PE), right of way (ROW), construction (CN), utilities, signing, bridge, and other miscellaneous project costs. Planning level cost estimates were developed in context to the level of detail available in this study. Projected costs were rounded to the nearest $10,000 and are summarized in Table 21. Estimated project costs ranged from $310,000 to $55,790,000 with a total of $67,040,000 needed for both the short- and long-term projects. These planning level cost estimates are intended for use by VDOT, project stakeholders, and local officials to pursue funding allocations for additional study of the improvements. Stakeholders should considering a phased approach to programming the long-term concepts. 63

78 I-95/I-85 Interchange Figure 38: I-95/I-85/Route 460 Long-Term Concepts 64
79 I-95/I-85 Interchange No. Table 21: Planning Level Cost Estimates Planning Level Cost Estimate (000s) Location PE ROW CN Total Short-Term Improvements 1 Wagner Road Alternate Route Feasibility Study $ 80 $ - $ 230 $ I-95 Southbound Off-Ramp at Washington Street $ 120 $ - $ 350 $ 470 Long-Term Concepts 1 I-85 Northbound to I-95 Southbound Ramp Movement $ 1,240 $ 2,100 $ 3,590 $ 6,930 2 S. Crater Road to I-95 Northbound Ramp Movement $ 880 $ - $ 2,660 $ 3,540 3 I-95 Northbound to I-85 Southbound Ramp Movement $ 13,920 $ 50 $ 41,820 $ 55,790 Total = $ 67,040 Notes: All costs are in Year 2019 dollars NEED FOR CONTINUED STUDY There are a number of past, present, and future infrastructure projects and studies within the I-95/I-85/Route 460 study area. Specific efforts are listed below. As these efforts become real projects, it will be critical that VDOT continue to identify and refine short- and long-term solutions needed in the I-95/I-85 corridor to assure mobility throughout this growing and changing area. Final Report: I-85/95/Route 460 Interchange Study, 2000 Temple Avenue Interchange Modification Report (VDOT UPC 85623) Rives Road Widening project (VDOT UPC 15832) Growth and impacts at Fort Lee (on-going Fort Lee Joint Land Use Study (JLUS)) Route 460 Corridor Improvements Project Public-Private Partnership (PPTA) project RECOMMENDED NEXT STEPS The I-95/I-85 Interchange Study should be used as a planning tool to achieve the next steps of planning, programming, designing, and constructing the identified safety and operational improvements in the study corridor. Specific steps include: 1. VDOT should update the previous I-85/I-95/Route 460 Interchange Study and extend the study corridor and scope to include additional operational analysis. Identify projects from this updated study to prioritize and program regional needs. An example next step could be an interchange modification report (IMR) to advance an interchange project (some metropolitan planning organizations (MPOs) have been successful advancing IMR studies using Regional Surface Transportation Program (RSTP) funds). 2. VDOT should continue to study and refine the operational and environmental impacts of the recommended long-term concepts. This analysis should include investigating the possibility of a phased approach to programming the long-term concepts by developing a subset of smaller projects with independent utility. This process should continue to involve the technical expertise of a study work group to evaluate alternatives while building consensus at the federal, state, and local levels. 3. VDOT should advance the recommended short-term improvement projects identified in this study to the preliminary engineering design stage, so a cost estimate and schedule can be developed. If necessary, supplemental environmental and traffic engineering studies should be conducted to move these projects along the project development process. 4. VDOT should continue to coordinate with the Tri-Cities Metropolitan Planning Organization (MPO), Crater Planning District Commission (CPDC), City of Petersburg, and within VDOT to cooperatively work towards the programming short-term projects and long-term concepts. 65
80 I-95/I-85 Interchange A P P E N D I X 66
81 A P P E N D I X A : T R A F F I C C O U N T D A T A I-95/I-85 Interchange
82 Malone & Associates Inc. CLASSIFICATION SUMMARY Page: 1 Wed 3/28/2012 Site Ref: Site 1 File: D prn Site ID: Info: TO/RS Max Loc: I-95 SB Off to Rives Rd. GPS: Direction: SOUTH Lane: 1 TIME Total 00: : : : Hour Total : : : : Hour Total : : : : Hour Total : : : : Hour Total : : : : Hour Total : : : : Hour Total : : : : Hour Total : : : : Hour Total : : : :
83 Malone & Associates Inc. CLASSIFICATION SUMMARY Page: 2 Wed 3/28/2012 Site Ref: Site 1 File: D prn Site ID: Info: TO/RS Max Loc: I-95 SB Off to Rives Rd. GPS: Direction: SOUTH Lane: 1 TIME Total Hour Total : : : : Hour Total : : : : Hour Total : : : : Hour Total : : : : Hour Total : : : : Hour Total : : : : Hour Total : : : : Hour Total : : : : Hour Total
84 Malone & Associates Inc. CLASSIFICATION SUMMARY Page: 3 Wed 3/28/2012 Site Ref: Site 1 File: D prn Site ID: Info: TO/RS Max Loc: I-95 SB Off to Rives Rd. GPS: Direction: SOUTH Lane: 1 TIME Total 17: : : : Hour Total : : : : Hour Total : : : : Hour Total : : : : Hour Total : : : : Hour Total : : : : Hour Total : : : : Hour Total DAY TOTAL PERCENTS 0.4% 76.9% 19.1% 0.1% 0.9% 0.4% 0.2% 0.3% 1.5% 0.2% 0.0% 0.0% 0.0% 0.0% 0.0% 100% Passenger Vehicles 96.3% Trucks & Buses 3.6% AM Times 11:00 07:30 07:30 04:00 07:45 09:45 10:15 07:45 10:15 08:15 07:30 AM Peaks PM Times 16:00 17:00 15:15 14:00 14:30 14:15 12:15 12:15 17:00 PM Peaks =================================================================================================================== GRAND TOTAL PERCENTS 0.4% 76.9% 19.1% 0.1% 0.9% 0.4% 0.2% 0.3% 1.5% 0.2% 0.0% 0.0% 0.0% 0.0% 0.0% 100%
85 Malone & Associates Inc. CLASSIFICATION SUMMARY Page: 1 Wed 3/28/2012 Site Ref: Site 2 File: D prn Site ID: Info: TO/RS Max Loc: I-95 NB On from Rives Rd. GPS: Direction: NORTH Lane: 1 TIME Total 00: : : : Hour Total : : : : Hour Total : : : : Hour Total : : : : Hour Total : : : : Hour Total : : : : Hour Total : : : : Hour Total : : : : Hour Total : : : :
86 Malone & Associates Inc. CLASSIFICATION SUMMARY Page: 2 Wed 3/28/2012 Site Ref: Site 2 File: D prn Site ID: Info: TO/RS Max Loc: I-95 NB On from Rives Rd. GPS: Direction: NORTH Lane: 1 TIME Total Hour Total : : : : Hour Total : : : : Hour Total : : : : Hour Total : : : : Hour Total : : : : Hour Total : : : : Hour Total : : : : Hour Total : : : : Hour Total
87 Malone & Associates Inc. CLASSIFICATION SUMMARY Page: 3 Wed 3/28/2012 Site Ref: Site 2 File: D prn Site ID: Info: TO/RS Max Loc: I-95 NB On from Rives Rd. GPS: Direction: NORTH Lane: 1 TIME Total 17: : : : Hour Total : : : : Hour Total : : : : Hour Total : : : : Hour Total : : : : Hour Total : : : : Hour Total : : : : Hour Total DAY TOTAL PERCENTS 0.5% 78.5% 17.7% 0.2% 0.7% 0.3% 0.0% 0.4% 1.7% 0.0% 0.0% 0.0% 0.0% 0.0% 0.0% 100% Passenger Vehicles 96.5% Trucks & Buses 3.4% AM Times 07:30 07:15 07:30 07:30 08:30 05:15 07:30 08:00 07:15 AM Peaks PM Times 14:45 16:45 15:00 13:30 12:30 15:00 12:45 16:45 PM Peaks =================================================================================================================== GRAND TOTAL PERCENTS 0.5% 78.5% 17.7% 0.2% 0.7% 0.3% 0.0% 0.4% 1.7% 0.0% 0.0% 0.0% 0.0% 0.0% 0.0% 100%
88 Malone & Associates Inc. CLASSIFICATION SUMMARY Page: 1 Wed 3/28/2012 Site Ref: Site 3 File: D prn Site ID: Info: TO/RS Max Loc: I-95 SB On from Rives Rd. GPS: Direction: SOUTH Lane: 1 TIME Total 00: : : : Hour Total : : : : Hour Total : : : : Hour Total : : : : Hour Total : : : : Hour Total : : : : Hour Total : : : : Hour Total : : : : Hour Total : : : :
89 Malone & Associates Inc. CLASSIFICATION SUMMARY Page: 2 Wed 3/28/2012 Site Ref: Site 3 File: D prn Site ID: Info: TO/RS Max Loc: I-95 SB On from Rives Rd. GPS: Direction: SOUTH Lane: 1 TIME Total Hour Total : : : : Hour Total : : : : Hour Total : : : : Hour Total : : : : Hour Total : : : : Hour Total : : : : Hour Total : : : : Hour Total : : : : Hour Total
90 Malone & Associates Inc. CLASSIFICATION SUMMARY Page: 3 Wed 3/28/2012 Site Ref: Site 3 File: D prn Site ID: Info: TO/RS Max Loc: I-95 SB On from Rives Rd. GPS: Direction: SOUTH Lane: 1 TIME Total 17: : : : Hour Total : : : : Hour Total : : : : Hour Total : : : : Hour Total : : : : Hour Total : : : : Hour Total : : : : Hour Total DAY TOTAL PERCENTS 0.4% 78.2% 18.4% 0.0% 1.0% 0.5% 0.1% 0.0% 0.9% 0.5% 0.0% 0.0% 0.0% 0.0% 0.0% 100% Passenger Vehicles 97.9% Trucks & Buses 3.0% AM Times 11:15 07:15 11:00 08:00 08:15 03:30 04:15 03:00 07:00 AM Peaks PM Times 18:00 16:45 16:45 14:30 13:00 12:15 20:00 16:45 PM Peaks =================================================================================================================== GRAND TOTAL PERCENTS 0.4% 78.2% 18.4% 0.0% 1.0% 0.5% 0.1% 0.0% 0.9% 0.5% 0.0% 0.0% 0.0% 0.0% 0.0% 100%
91 Malone & Associates Inc. CLASSIFICATION SUMMARY Page: 1 Wed 3/28/2012 Site Ref: Site 4 File: D prn Site ID: Info: TO/RS Max Loc: I-95 NB Off to Rives Rd. GPS: Direction: NORTH Lane: 1 TIME Total 00: : : : Hour Total : : : : Hour Total : : : : Hour Total : : : : Hour Total : : : : Hour Total : : : : Hour Total : : : : Hour Total : : : : Hour Total : : : :
92 Malone & Associates Inc. CLASSIFICATION SUMMARY Page: 2 Wed 3/28/2012 Site Ref: Site 4 File: D prn Site ID: Info: TO/RS Max Loc: I-95 NB Off to Rives Rd. GPS: Direction: NORTH Lane: 1 TIME Total Hour Total : : : : Hour Total : : : : Hour Total : : : : Hour Total : : : : Hour Total : : : : Hour Total : : : : Hour Total : : : : Hour Total : : : : Hour Total
93 Malone & Associates Inc. CLASSIFICATION SUMMARY Page: 3 Wed 3/28/2012 Site Ref: Site 4 File: D prn Site ID: Info: TO/RS Max Loc: I-95 NB Off to Rives Rd. GPS: Direction: NORTH Lane: 1 TIME Total 17: : : : Hour Total : : : : Hour Total : : : : Hour Total : : : : Hour Total : : : : Hour Total : : : : Hour Total : : : : Hour Total DAY TOTAL PERCENTS 0.6% 79.1% 19.1% 0.2% 0.2% 0.0% 0.1% 0.1% 0.6% 0.0% 0.0% 0.0% 0.0% 0.0% 0.0% 100% Passenger Vehicles 98.6% Trucks & Buses 1.3% AM Times 08:15 09:30 08:15 07:30 05:45 08:00 09:00 08:15 AM Peaks PM Times 18:15 13:30 13:00 12:15 13:30 20:15 13:30 PM Peaks =================================================================================================================== GRAND TOTAL PERCENTS 0.6% 79.1% 19.1% 0.2% 0.2% 0.0% 0.1% 0.1% 0.6% 0.0% 0.0% 0.0% 0.0% 0.0% 0.0% 100%
94 Malone & Associates Inc. CLASSIFICATION SUMMARY Page: 1 Wed 3/28/2012 Site Ref: Site 5 File: D prn Site ID: Info: TO/RS Max Loc: I-95 SB Off to WB E. Washington St. GPS: Direction: SOUTH Lane: 1 TIME Total 00: : : : Hour Total : : : : Hour Total : : : : Hour Total : : : : Hour Total : : : : Hour Total : : : : Hour Total : : : : Hour Total : : : : Hour Total : : : :
95 Malone & Associates Inc. CLASSIFICATION SUMMARY Page: 2 Wed 3/28/2012 Site Ref: Site 5 File: D prn Site ID: Info: TO/RS Max Loc: I-95 SB Off to WB E. Washington St. GPS: Direction: SOUTH Lane: 1 TIME Total Hour Total : : : : Hour Total : : : : Hour Total : : : : Hour Total : : : : Hour Total : : : : Hour Total : : : : Hour Total : : : : Hour Total : : : : Hour Total
96 Malone & Associates Inc. CLASSIFICATION SUMMARY Page: 3 Wed 3/28/2012 Site Ref: Site 5 File: D prn Site ID: Info: TO/RS Max Loc: I-95 SB Off to WB E. Washington St. GPS: Direction: SOUTH Lane: 1 TIME Total 17: : : : Hour Total : : : : Hour Total : : : : Hour Total : : : : Hour Total : : : : Hour Total : : : : Hour Total : : : : Hour Total DAY TOTAL PERCENTS 0.2% 80.8% 16.9% 0.5% 1.0% 0.3% 0.0% 0.1% 0.2% 0.0% 0.0% 0.0% 0.0% 0.0% 0.0% 100% Passenger Vehicles 97.7% Trucks & Buses 2.2% AM Times 06:15 07:45 08:00 06:45 11:00 10:00 06:15 07:45 09:15 07:45 AM Peaks PM Times 18:30 17:45 14:45 14:30 15:45 12:15 14:00 15:00 16:15 PM Peaks =================================================================================================================== GRAND TOTAL PERCENTS 0.2% 80.8% 16.9% 0.5% 1.0% 0.3% 0.0% 0.1% 0.2% 0.0% 0.0% 0.0% 0.0% 0.0% 0.0% 100%
97 Study Name E. Washington St ADT, btwn I-95 SB off and SB on ramps Start Date 03/28/2012 Start Time 12:00 AM Site Code Lane 1 Channel Vehicles Buses Medium Trucks Heavy Trucks Total Total Trucks/Buses Direction Westbound Westbound Westbound Westbound Westbound Westbound Start Time 12:00 AM :15 AM :30 AM :45 AM :00 AM :15 AM :30 AM :45 AM :00 AM :15 AM :30 AM :45 AM :00 AM :15 AM :30 AM :45 AM :00 AM :15 AM :30 AM :45 AM :00 AM :15 AM :30 AM :45 AM :00 AM :15 AM :30 AM :45 AM :00 AM :15 AM :30 AM :45 AM :00 AM :15 AM :30 AM :45 AM :00 AM :15 AM :30 AM :45 AM :00 AM
98 Study Name E. Washington St ADT, btwn I-95 SB off and SB on ramps Start Date 03/28/2012 Start Time 12:00 AM Site Code Lane 1 Channel Vehicles Buses Medium Trucks Heavy Trucks Total Total Trucks/Buses Direction Westbound Westbound Westbound Westbound Westbound Westbound 10:15 AM :30 AM :45 AM :00 AM :15 AM :30 AM :45 AM :00 PM :15 PM :30 PM :45 PM :00 PM :15 PM :30 PM :45 PM :00 PM :15 PM :30 PM :45 PM :00 PM :15 PM :30 PM :45 PM :00 PM :15 PM :30 PM :45 PM :00 PM :15 PM :30 PM :45 PM :00 PM :15 PM :30 PM :45 PM :00 PM :15 PM :30 PM :45 PM :00 PM :15 PM :30 PM
99 Study Name E. Washington St ADT, btwn I-95 SB off and SB on ramps Start Date 03/28/2012 Start Time 12:00 AM Site Code Lane 1 Channel Vehicles Buses Medium Trucks Heavy Trucks Total Total Trucks/Buses Direction Westbound Westbound Westbound Westbound Westbound Westbound 8:45 PM :00 PM :15 PM :30 PM :45 PM :00 PM :15 PM :30 PM :45 PM :00 PM :15 PM :30 PM :45 PM AM Times 8:00 9:00 6:45 7:45 8:00 AM Peaks PM Times 16:00 14:15 13:15 14:45 16:00 PM Peaks
100 A P P E N D I X B : C R A S H D A T A I-95/I-85 Interchange
101 Total Comparison Location I-95S from Temple Avenue to Rives Road Percentage Comparison Location I-95S from Temple Avenue to Rives Road Year AM (6-10) PM (3-7) Off Peak Day Dawn / Dusk Dark Dry Wet Misc Rear End Angle Head On I-95/I-85 RSA Summary of Corridor Crash Data Crash Data: Jan. 1, Dec. 31, 2009 I-95 Southbound Sideswipe - Same Direction Sideswipe - Opposite Direction Fixed Object - In Road Non- Collision Fixed Object - Off Road Deer / Other Animal Backed Into Pedestrian/ Bicyclist Other K (1) A (2) B (3) C (4) None (0) TOTAL Year Peak Hour Light Conditions Pavement Condition % Peak Hour % Light Conditions AM (6-10) PM (3-7) Off Peak Day Dawn / Dusk % Pavement Condition Dark Dry Wet Misc Rear End Angle Head On Sideswipe - same dir. Sideswipe - Opp. Dir. % Type of Collision % Severity Fixed Object - In Road Non- Collision Fixed Object - Off Road Deer / Other Animal Backed Into Pedestrian/ Bicyclist Other K (1) A (2) B (3) C (4) None (0) % 30% 55% 66% 2% 32% 58% 38% 4% 34% 0% 0% 21% 0% 0% 0% 45% 0% 0% 0% 0% 0% 11% 8% 15% 66% 34% % 25% 53% 64% 8% 28% 68% 32% 0% 30% 6% 0% 15% 0% 0% 6% 38% 6% 0% 0% 0% 0% 17% 8% 13% 62% 38% % 21% 62% 55% 5% 40% 67% 26% 7% 29% 7% 0% 0% 0% 17% 5% 43% 0% 0% 0% 0% 2% 17% 5% 5% 71% 26% TOTAL 18% 26% 56% 62% 5% 33% 64% 32% 3% 31% 4% 0% 13% 0% 5% 3% 42% 2% 0% 0% 0% 1% 15% 7% 11% 66% 33% Type of Collision Severity Total Injury Total Injury TOTAL
102 Total Comparison Location I-95N from Temple Avenue to Rives Road Percentage Comparison Location I-95N from Temple Avenue to Rives Road Year AM (6-10) PM (3-7) Off Peak Day Dawn / Dusk Dark Dry Wet Misc Rear End Angle Head On I-95/I-85 RSA Summary of Corridor Crash Data Crash Data: Jan. 1, Dec. 31, 2009 I-95 Northbound Sideswipe - Same Direction Sideswipe - Opposite Direction Fixed Object - In Road Non- Collision Fixed Object - Off Road Deer / Other Animal Backed Into Pedestrian/ Bicyclist Other K (1) A (2) B (3) C (4) None (0) TOTAL Year Peak Hour Light Conditions Pavement Condition % Peak Hour % Light Conditions AM (6-10) PM (3-7) Off Peak Day Dawn / Dusk % Pavement Condition Dark Dry Wet Misc Rear End Angle Head On Sideswipe - same dir. Sideswipe - Opp. Dir. % Type of Collision % Severity Fixed Object - In Road Non- Collision Fixed Object - Off Road Deer / Other Animal Backed Into Pedestrian/ Bicyclist Other K (1) A (2) B (3) C (4) None (0) % 23% 52% 67% 2% 31% 69% 19% 13% 35% 0% 0% 23% 0% 2% 0% 40% 0% 0% 0% 0% 0% 13% 4% 17% 67% 33% % 30% 48% 52% 8% 40% 58% 40% 2% 32% 4% 0% 20% 0% 2% 0% 38% 4% 0% 0% 0% 0% 14% 4% 16% 66% 34% % 28% 58% 56% 7% 37% 63% 26% 12% 26% 14% 0% 0% 0% 7% 0% 48% 5% 0% 0% 2% 0% 7% 9% 16% 67% 33% TOTAL 21% 27% 52% 58% 6% 36% 63% 28% 9% 31% 6% 0% 15% 0% 4% 0% 41% 3% 0% 0% 1% 0% 11% 6% 16% 67% 33% Type of Collision Severity Total Injury Total Injury TOTAL
103 Total Comparison Location I-85S from I-95/I-85 interchange to Sycamore Street overpass Percentage Comparison Location I-85S from I-95/I-85 interchange to Sycamore Street overpass Year AM (6-10) PM (3-7) Off Peak Day Dawn / Dusk Dark Dry Wet Misc Rear End Angle Head On I-95/I-85 RSA Summary of Corridor Crash Data Crash Data: Jan. 1, Dec. 31, 2009 I-85 Southbound Sideswipe - Same Direction Sideswipe - Opposite Direction Fixed Object - In Road Non- Collision Fixed Object - Off Road Deer / Other Animal Backed Into Pedestrian/ Bicyclist Other K (1) A (2) B (3) C (4) None (0) TOTAL Year Peak Hour Light Conditions Pavement Condition % Peak Hour % Light Conditions AM (6-10) PM (3-7) Off Peak Day Dawn / Dusk % Pavement Condition Dark Dry Wet Misc Rear End Angle Head On Sideswipe - same dir. Sideswipe - Opp. Dir. % Type of Collision % Severity Fixed Object - In Road Non- Collision Fixed Object - Off Road Deer / Other Animal Backed Into Pedestrian/ Bicyclist Other K (1) A (2) B (3) C (4) None (0) % 33% 33% 67% 33% 0% 33% 67% 0% 0% 0% 0% 33% 0% 0% 0% 67% 0% 0% 0% 0% 0% 33% 0% 0% 67% 33% % 67% 33% 100% 0% 0% 67% 33% 0% 0% 33% 0% 0% 0% 0% 0% 67% 0% 0% 0% 0% 0% 33% 0% 0% 67% 33% % 0% 100% 50% 0% 50% 100% 0% 0% 0% 0% 0% 0% 0% 0% 0% 50% 50% 0% 0% 0% 0% 0% 50% 0% 50% 50% TOTAL 13% 38% 50% 75% 13% 13% 63% 38% 0% 0% 13% 0% 13% 0% 0% 0% 63% 13% 0% 0% 0% 0% 25% 13% 0% 63% 38% Type of Collision Severity Total Injury Total Injury TOTAL
104 Total Comparison Location I-85N from I-95/I-85 interchange to Sycamore Street overpass Percentage Comparison Location I-85N from I-95/I-85 interchange to Sycamore Street overpass Year AM (6-10) PM (3-7) Off Peak Day Dawn / Dusk Dark Dry Wet Misc Rear End Angle Head On I-95/I-85 RSA Summary of Corridor Crash Data Crash Data: Jan. 1, Dec. 31, 2009 I-85 Northbound Sideswipe - Same Direction Sideswipe - Opposite Direction Fixed Object - In Road Non- Collision Fixed Object - Off Road Deer / Other Animal Backed Into Pedestrian/ Bicyclist Other K (1) A (2) B (3) C (4) None (0) TOTAL Year Peak Hour Light Conditions Pavement Condition % Peak Hour % Light Conditions % Pavement Condition % Type of Collision % Severity AM (6-10) PM (3-7) Off Peak Day Dawn / Dusk Dark Dry Wet Misc Rear End Angle Head On Sideswipe - same dir. Sideswipe - Opp. Dir. Fixed Object - In Road Non- Collision Fixed Object - Off Road Deer / Other Animal Backed Into Pedestrian/ Bicyclist Other K (1) A (2) B (3) C (4) None (0) % 30% 60% 70% 0% 30% 50% 50% 0% 0% 0% 0% 30% 0% 0% 10% 50% 10% 0% 0% 0% 0% 10% 10% 10% 70% 30% % 29% 29% 86% 0% 14% 86% 14% 0% 14% 14% 0% 43% 0% 0% 0% 29% 0% 0% 0% 0% 0% 43% 0% 0% 57% 43% % 33% 67% 100% 0% 0% 83% 17% 0% 33% 17% 0% 0% 0% 33% 0% 17% 0% 0% 0% 0% 0% 0% 0% 0% 100% 0% TOTAL 17% 30% 52% 83% 0% 17% 70% 30% 0% 13% 9% 0% 26% 0% 9% 4% 35% 4% 0% 0% 0% 0% 17% 4% 4% 74% 26% Type of Collision Severity Total Injury Total Injury TOTAL
105 Total Comparison Location All Ramps in Study Corridor Percentage Comparison Location All Ramps in Study Corridor Year AM (6-10) PM (3-7) Off Peak Day Dawn / Dusk Dark Dry Wet Misc Rear End Angle Head On I-95/I-85 RSA Summary of Corridor Crash Data Crash Data: Jan. 1, Dec. 31, 2009 All Ramps in Study Corridor Sideswipe - Same Direction Sideswipe - Opposite Direction Fixed Object - In Road Non- Collision Fixed Object - Off Road Deer / Other Animal Backed Into Pedestrian/ Bicyclist Other K (1) A (2) B (3) C (4) None (0) TOTAL Year Peak Hour Light Conditions Pavement Condition % Peak Hour % Light Conditions AM (6-10) PM (3-7) Off Peak Day Dawn / Dusk % Pavement Condition Dark Dry Wet Misc Rear End Angle Head On Sideswipe - same dir. Sideswipe - Opp. Dir. % Type of Collision % Severity Fixed Object - In Road Non- Collision Fixed Object - Off Road Deer / Other Animal Backed Into Pedestrian/ Bicyclist Other K (1) A (2) B (3) C (4) None (0) % 31% 42% 83% 3% 14% 72% 19% 8% 39% 0% 6% 14% 0% 0% 3% 36% 3% 0% 0% 0% 0% 8% 0% 19% 72% 28% % 28% 22% 67% 11% 22% 78% 22% 0% 72% 0% 0% 0% 6% 0% 0% 22% 0% 0% 0% 0% 0% 22% 0% 22% 56% 44% % 29% 48% 52% 19% 29% 68% 26% 6% 52% 6% 0% 0% 0% 6% 3% 32% 0% 0% 0% 0% 3% 10% 6% 23% 58% 39% TOTAL 31% 29% 40% 68% 11% 21% 72% 22% 6% 51% 2% 2% 6% 1% 2% 2% 32% 1% 0% 0% 0% 1% 12% 2% 21% 64% 35% Type of Collision Severity Total Injury Total Injury TOTAL
106 I-95/I-85 Interchange A P P E N D I X C : I N V E N T O R Y O F O V E R H E A D S I G N S


107 OVERHEAD SIGNS WITHOUT LIGHTING I-95 NB Located at MP 47.4 Located at MP 52.9 Located at MP 48.4 Located at MP 53.0 Located at MP 48.7


108 I-95 SB Located at MP 54.3 Located at MP 50.3 Located at MP 53.0 Located at MP 49.5 Located at MP 52.5 Located at MP 49.3


109 I-95 SB Located at MP 49.1 Located at MP 48.3 Located at MP 48.1
EVALUATION OF SAFETY PERFORMANCES ON FREEWAY DIVERGE AREA AND FREEWAY EXIT RAMPS. Transportation Seminar February 16 th, 2009
 EVALUATION OF SAFETY PERFORMANCES ON FREEWAY DIVERGE AREA AND FREEWAY EXIT RAMPS Transportation Seminar February 16 th, 2009 By: Hongyun Chen Graduate Research Assistant 1 Outline Introduction Problem
April 10, Mr. Curt Van De Walle, City Manager City of Castle Hills 209 Lemonwood Drive Castle Hills, Texas 78213
 Mr. Curt Van De Walle, City Manager City of Castle Hills 209 Lemonwood Drive Castle Hills, Texas 78213 Subject: Revised Castle Hills BASIS Charter School Traffic Impact Analysis Review City of Castle Hills,
Active Traffic & Safety Management System for Interstate 77 in Virginia. Chris McDonald, PE VDOT Southwest Regional Operations Director
 Active Traffic & Safety Management System for Interstate 77 in Virginia Chris McDonald, PE VDOT Southwest Regional Operations Director Interstate 77 at Fancy Gap Mountain Mile markers 0-15 Built in late
JEP John E. Jack Pflum, P.E. Consulting Engineering 7541 Hosbrook Road, Cincinnati, OH Telephone:
 JEP John E. Jack Pflum, P.E. Consulting Engineering 7541 Hosbrook Road, Cincinnati, OH 45243 Email: jackpflum1@gmail.com Telephone: 513.919.7814 MEMORANDUM REPORT Traffic Impact Analysis Proposed Soccer
Market Street PDP. Nassau County, Florida. Transportation Impact Analysis. VHB/Vanasse Hangen Brustlin, Inc. Nassau County Growth Management
 Transportation Impact Analysis Market Street PDP Nassau County, Florida Submitted to Nassau County Growth Management Prepared for TerraPointe Services, Inc. Prepared by VHB/Vanasse Hangen Brustlin, Inc.
EXAMINATION OF THE SAFETY IMPACTS OF VARYING FOG DENSITIES: A CASE STUDY OF I-77 IN VIRGINIA
 0 0 0 EXAMINATION OF THE SAFETY IMPACTS OF VARYING FOG DENSITIES: A CASE STUDY OF I- IN VIRGINIA Katie McCann Graduate Research Assistant University of Virginia 0 Edgemont Road Charlottesville, VA 0 --
FY 2010 Continuing i Planning Program Product Report. Local Transportation and Traffic Data. Wood-Washington-Wirt Interstate Planning Commission
 FY 2010 Continuing i Planning Program Product Report Local Transportation and Traffic Data Travel Time and Delay Data for Belpre and Marietta, Ohio Wood-Washington-Wirt Interstate Planning Commission CONTINUING
Table of Contents Introduction... 4 Study Area... 5
 Table of Contents Introduction... 4 Study Area... 5 Streets and s... 5 Traffic Volumes... 8 Recent and Anticipated Development... 10 Crash Analysis... 10 Projected Traffic Volumes... 11 Trip Generation...
US 169/I-70 North Loop Planning & Environmental Linkages Study
 US 169/I-70 North Loop Planning & Environmental Linkages Study VISSIM Calibration Document Draft April 13, 2018 Page i Table of Contents 1. Overview... 1 2. Data Types... 2 3. Model Parameter Adjustments...
Expanding the GSATS Model Area into
 Appendix A Expanding the GSATS Model Area into North Carolina Jluy, 2011 Table of Contents LONG-RANGE TRANSPORTATION PLAN UPDATE 1. Introduction... 1 1.1 Background... 1 1.2 Existing Northern Extent of
CONTINUING PLANNING PROGRAM LOCAL TRANSPORTATION AND TRAFFIC DATA PRODUCT REPORT [OH Corridors]
![CONTINUING PLANNING PROGRAM LOCAL TRANSPORTATION AND TRAFFIC DATA PRODUCT REPORT [OH Corridors]](/thumbs/94/120123757.jpg "CONTINUING PLANNING PROGRAM LOCAL TRANSPORTATION AND TRAFFIC DATA PRODUCT REPORT [OH Corridors]") CONTINUING PLANNING PROGRAM LOCAL TRANSPORTATION AND TRAFFIC DATA PRODUCT REPORT [OH Corridors] Travel Time and Delay Analysis for Belpre (OH) and Marietta (OH) Fiscal Year 2009 Report WOOD WASHINGTON
CONTINUING PLANNING PROGRAM LOCAL TRANSPORTATION AND TRAFFIC DATA PRODUCT REPORT [OH Corridors] Travel Time and Delay Analysis for Belpre (OH) and Marietta (OH) Fiscal Year 2009 Report WOOD WASHINGTON
US 20 Highway Safety Study
 US 20 Highway Safety Study Corvallis City Limits to Springhill Road, Albany Prepared for Prepared by December 2016 US 20 HIGHWAY SAFETY STUDY FINAL REPORT Benton County, Oregon Prepared for: Oregon Department
Subject: Desert Palisades Specific Plan - Tram Way Access Sight Distance
 Endo Engineering Traffic Engineering Air Quality Studies Noise Assessments July 13, 2015 Mr. Ed Freeman Pinnacle View, LLC P.O. Box 1754 Lake Oswego, OR 97035-0579 Subject: Desert Palisades Specific Plan
WEBER ROAD RESIDENTIAL DEVELOPMENT Single Family Residential Project
 WEBER ROAD RESIDENTIAL DEVELOPMENT Single Family Residential Project WEBER ROAD RESIDENTIAL DEVELOPMENT TRAFFIC IMPACT STUDY TABLE OF CONTENTS 1.0 Executive Summary Page 2.0 Introduction 2.1 DEVELOPMENT
Submittal/Approval Letter
 Submittal/Approval Letter To: Patrick Muench, P.E. Date: May 1, 2017 Turnpike Design Engineer Financial Project ID: 436517-1-52-01 & 436517-3-52-01 New Construction ( ) RRR ( ) Federal Aid : Not Applicable
Traffic Impact Study
 Traffic Impact Study Statham DRI One University Parkway Prepared for: Barrow County Prepared by: October 2012 Table of Contents Executive Summary i Section 1. Introduction 1 Project Description 1 Methodology
Brandywine Road Speed Study FINAL REPORT
 Brandywine Road Speed Study FINAL REPORT City of Albuquerque Brandywine Road Speed Study Final Report Albuquerque, New Mexico City of Albuquerque May, 2016 Brandywine Road Speed Study Final Report City
Focused Traffic Analysis for the One Lincoln Park Project
 September 15, 2015 Mr. Bill Johnson Coldwell Banker 511 Sir Francis Drake Boulevard Greenbrae, CA 94904 Focused Traffic Analysis for the One Lincoln Park Project Dear Mr. Johnson; As requested, W-Trans
Submittal/Approval Letter
 Submittal/Approval Letter To: Patrick Muench, P.E. Date: May 1, 2017 Turnpike Design Engineer Financial Project ID: 436517-1-52-01 & 436517-3-52-01 New Construction ( ) RRR ( ) Federal Aid : Not Applicable
TRAFFIC ALERT FOR WEEK OF February 4 8, 2008
 TRAFFIC ALERT FOR WEEK OF February 4 8, 2008 Highway work zones in the Staunton District The following is a list of highway work that might affect traffic in the Staunton transportation district during
NATHAN HALE HIGH SCHOOL PARKING AND TRAFFIC ANALYSIS. Table of Contents
 Parking and Traffic Analysis Seattle, WA Prepared for: URS Corporation 1501 4th Avenue, Suite 1400 Seattle, WA 98101-1616 Prepared by: Mirai Transportation Planning & Engineering 11410 NE 122nd Way, Suite
Submittal/Approval Letter
 Submittal/Approval Letter To: Patrick Muench, P.E. Date: June 14, 2017 Turnpike Design Engineer Financial Project ID: 436517-1-52-01 & 436517-3-52-01 New Construction ( ) RRR ( ) Federal Aid : Not Applicable
The Sunland Park flyover ramp is set to close the week of March 19 until early summer
 March 2, 2018 The Sunland Park flyover ramp is set to close the week of March 19 until early summer GO 10 is targeting the week of March 19 to close the Sunland Park Drive flyover entrance ramp to I 10
MEMORANDUM. The study area of the analysis was discussed with City staff and includes the following intersections:
 MEMORANDUM DATE: JULY 6, 2012 TO: FROM: RE: CC: MELANIE KNIGHT BRAD BYVELDS/ JENNIFER LUONG 1050 SOMERSET STREET PRELIMINARY TRAFFIC ANALYSIS OUR FILE NO. 111152 NEIL MALHOTRA The purpose of this memo
CVS Derwood. Local Area Transportation Review
 CVS Derwood Montgomery County, Maryland May 27, 2016 Local Area Transportation Review Prepared for: JC Bar Properties, Inc. Steve Fleming, PE 415 Fallowfield Road, Suite 301 Camp Hill, Pennsylvania 17011
Effectiveness of Experimental Transverse- Bar Pavement Marking as Speed-Reduction Treatment on Freeway Curves
 Effectiveness of Experimental Transverse- Bar Pavement Marking as Speed-Reduction Treatment on Freeway Curves Timothy J. Gates, Xiao Qin, and David A. Noyce Researchers performed a before-and-after analysis
A Study of Red Light Cameras in Kansas City, MO
 A Study of Red Light s in Kansas City, MO Prepared by the Special Operations Division Executive Summary This paper will analyze the crash data for the 29 red light cameras located in 17 intersections in
Freeway Work Zone Lane Capacity
 Freeway Work Zone Lane Capacity Thomas Notbohm, P.E. Wisconsin Department of Transportation Thomas.Notbohm@dot.state.wi.us Alex Drakopoulos Department of Civil & Environmental Engineering Marquette University,
Freeway Work Zone Lane Capacity
 Report Title Report Date: 2009 Freeway Work Zone Lane Capacity Principle Investigator Vendor Name and Address Name Drakopoulos, Alex «Vendor» Affiliation Marquette University Address 263 Haggerty Hall
1.0 INTRODUCTION AND SUMMARY...
 TABLE OF CONTENTS 1.0 INTRODUCTION AND SUMMARY... 1 1.1 Purpose and Study Objective... 1 1.2 Executive Summary... 1 2.0 ROADWAY CONDITIONS... 5 2.1 Granville Parkway (South Intersection)... 8 2.2 Tuscany
Appendix BAL Baltimore, Maryland 2003 Annual Report on Freeway Mobility and Reliability
 (http://mobility.tamu.edu/mmp) Office of Operations, Federal Highway Administration Appendix BAL Baltimore, Maryland 2003 Annual Report on Freeway Mobility and Reliability This report is a supplement to:
VIRGINIA S I-77 VARIABLE SPEED LIMIT SYSTEM FOR LOW VISIBILITY CONDITIONS
 VIRGINIA S I-77 VARIABLE SPEED LIMIT SYSTEM FOR LOW VISIBILITY CONDITIONS Christopher D. McDonald, PE, PTOE Regional Operations Director, Southwest Region NRITS and ITS Arizona Annual Conference October
I-10 East at Redd closes for 24 hours this Sunday, Feb 11. Then, I-10 West at Resler closes for 27 hours on Feb 25
 NEWS RELEASE a TxDOT Project For immediate release EL PASO DISTRICT Jennifer Wright (915) 790-4340 Jennifer.Wright3@txdot.gov February 9, 2018 I-10 East at Redd closes for 24 hours this Sunday, Feb 11
California Experience With Inside Shoulder Removals
 TRANSPORTATION RESEARCH RECORD 1122 37 California Experience With Inside Shoulder Removals THOMAS URBANIK AND CARLOS R. BONILLA The problem of increasing freeway corridor capacity in a safe and cost-effective
TRAFFIC IMPACT STUDY. Platte Canyon Villas Arapahoe County, Colorado (Arapahoe County Case Number: Z16-001) For
 For") TRAFFIC IMPACT STUDY For Platte Canyon Villas Arapahoe County, Colorado (Arapahoe County Case Number: Z16-001) February 2015 Revised: August 2015 April 2016 July 2016 September 2016 Prepared for: KB Home
TRAFFIC IMPACT STUDY For Platte Canyon Villas Arapahoe County, Colorado (Arapahoe County Case Number: Z16-001) February 2015 Revised: August 2015 April 2016 July 2016 September 2016 Prepared for: KB Home
Organized Chain-Up and VSL
 Organized Chain-Up and VSL Jim Mahugh, PE WSDOT SC Region Traffic Engineer North/West Passage VSL Peer Exchange January 28, 2015 Snoqualmie Pass 2 Limits of VSL EB: MP 48.12 to 66.56 WB: MP 46.69 to 66.90
March Grade Crossing Analysis
 March 2014 Grade Crossing Analysis T E C H N I C A L M E M O R A N D U M South Florida Freight and Passenger Rail Enhancement Study Phase 1A - Rehabilitate Existing Northwood Connection; FPID: 434948-1
CHAPTER 3. CAPACITY OF SIGNALIZED INTERSECTIONS
 CHAPTER 3. CAPACITY OF SIGNALIZED INTERSECTIONS 1. Overview In this chapter we explore the models on which the HCM capacity analysis method for signalized intersections are based. While the method has
2015 Grand Forks East Grand Forks TDM
 GRAND FORKS EAST GRAND FORKS 2015 TRAVEL DEMAND MODEL UPDATE DRAFT REPORT To the Grand Forks East Grand Forks MPO October 2017 Diomo Motuba, PhD & Muhammad Asif Khan (PhD Candidate) Advanced Traffic Analysis
PENNSTATE COMMONWEALTH OF PENNSYLVANIA DEPARTMENT OF TRANSPORTATION
 COMMONWEALTH OF PENNSYLVANIA DEPARTMENT OF TRANSPORTATION PENNDOT RESEARCH EFFECTIVENESS OF SPEED MINDERS IN REDUCING DRIVING SPEEDS ON RURAL HIGHWAYS IN PENNSYLVANIA PennDOT/MAUTC Partnership Research
Solar Powered Illuminated RPMs
 Report Title Report Date: 2000 Solar Powered Illuminated RPMs Principle Investigator Name Meyer, Eric Affiliation Meyer ITS Address 2617 W 27th Terrace Lawrence, KS 66047 Vendor Name and Address Interplex
WOODRUFF ROAD CORRIDOR ORIGIN-DESTINATION ANALYSIS
 2018 WOODRUFF ROAD CORRIDOR ORIGIN-DESTINATION ANALYSIS Introduction Woodruff Road is the main road to and through the commercial area in Greenville, South Carolina. Businesses along the corridor have
Local Calibration Factors for Implementing the Highway Safety Manual in Maine
 Local Calibration Factors for Implementing the Highway Safety Manual in Maine 2017 Northeast Transportation Safety Conference Cromwell, Connecticut October 24-25, 2017 MAINE Darryl Belz, P.E. Maine Department
2011 South Western Region Travel Time Monitoring Program Congestion Management Process. Executive Summary
 2011 South Western Region Travel Monitoring Program Executive Summary Prepared by: South Western Regional Planning Agency 888 Washington Blvd, 3rd Floor Stamford, CT 06901 Telephone: 203.6.5190 Facsimile:
North Carolina s First Quadrant Left: History and Lessons Learned
 North Carolina s First Quadrant Left: History and Lessons Learned Michael P. Reese, P.E. (Corresponding Author) Congestion Management Section Project Engineer North Carolina Department of Transportation
Appendix I: Traffic Study
 City of Fontana Sierra Lakes Commerce Center Draft EIR Appendix I: Traffic Study FirstCarbon Solutions H:\Client (PN JN)\0144\01440050\EIR\1 ADEIR\01440050 Sec99 99 Appendix Dividers.doc THIS PAGE INTENTIONALLY
Best Practices and Techniques for Clearing Intersection Layouts
 Research for winter highway maintenance Manual of Best Practices and Techniques for Clearing Intersection Layouts Prepared by: Yan Qi (Southern Illinois University Edwardsville) Dave Bergner (Monte Vista
PROPOSED PROJECT. Section PROJECT DESCRIPTION
 1 2 3 4 5 6 7 8 9 10 11 12 13 14 15 16 17 18 19 20 21 22 23 24 25 26 27 28 29 30 31 32 33 34 35 36 37 38 39 40 41 42 43 1.1 PROJECT DESCRIPTION This Environmental Assessment describes the proposed improvements
South Western Region Travel Time Monitoring Program Congestion Management Process Spring 2008 Report
 South Western Region Travel Monitoring Program Congestion Management Process Spring 2008 Report Prepared by: South Western Regional Planning Agency 888 Washington Boulevard Stamford, CT 06901 Telephone:
ROADWAY DESIGN CALCULATIONS
 ROADWAY DESIGN CALCULATIONS Interim Interchange at SR 400 (I-4) and Daryl Carter Parkway FPID: 441113-1-52-01 60% (Phase II) Prepared by: AECOM Technical Services, Inc. 150 North Orange Avenue, Suite 200
Bruce Freeman Rail Trail
 Functional Design Report Bruce Freeman Rail Trail Station Road to Concord Town Line Sudbury, Massachusetts PREPARED FOR Town of Sudbury Planning and Community Development 287 Old Sudbury Road Sudbury,
Appendixx C Travel Demand Model Development and Forecasting Lubbock Outer Route Study June 2014
 Appendix C Travel Demand Model Development and Forecasting Lubbock Outer Route Study June 2014 CONTENTS List of Figures-... 3 List of Tables... 4 Introduction... 1 Application of the Lubbock Travel Demand
NORTH HOUSTON HIGHWAY IMPROVEMENT PROJECT (NHHIP)
") NORTH HOUSTON HIGHWAY IMPROVEMENT PROJECT (NHHIP) Planning for a Mega Project in a Metropolitan Area TxDOT Short Course October 13, 2015 RECOMMENDED ALTERNATIVES Environmental Impact Statement (EIS) Project
NORTH HOUSTON HIGHWAY IMPROVEMENT PROJECT (NHHIP) Planning for a Mega Project in a Metropolitan Area TxDOT Short Course October 13, 2015 RECOMMENDED ALTERNATIVES Environmental Impact Statement (EIS) Project
FINAL Traffic Report for the Proposed Golden Valley Road and Newhall Ranch Road Projects in the City of Santa Clarita, California May 5, 2005
 FINAL Traffic Report for the Proposed Golden Valley Road and Newhall Ranch Road Projects in the City of Santa Clarita, California May 5, 2005 Prepared For: EDAW, Inc. 1420 Kettner Boulevard, Suite 620
Project Level Traffic Forecast Report Business 40 Reconstruction Study Forsyth County
 Project Level Traffic Forecast Report Business 40 Reconstruction Study Forsyth County TIP No. U-2827 B WBS # 34872.1.1 June 2013 Prepared for North Carolina Department of Transportation Prepared by Project
North Carolina s First Quadrant Left: History and Lessons Learned
 0 0 0 North Carolina s First Quadrant Left: History and Lessons Learned Michael P. Reese, P.E. (Corresponding Author) Congestion Management Section Project Engineer North Carolina Department of Transportation
PLAZA MEXICO RESIDENCES
 PLAZA MEXICO RESIDENCES TRAFFIC STUDY PREPARED FOR: 3000 E. IMPERIAL, LLC. 6940 Beach Boulevard, D-501 Buena Park, California 90621 PREPARED BY: OCTOBER 5, 2017 translutions the transportatio n solutions
Technical Memorandum #2 Future Conditions
 Technical Memorandum #2 Future Conditions To: Dan Farnsworth Transportation Planner Fargo-Moorhead Metro Council of Governments From: Rick Gunderson, PE Josh Hinds PE, PTOE Houston Engineering, Inc. Subject:
The Highline Development Traffic Impact Study
 The Highline Development Traffic Impact Study Columbia Falls, Montana Prepared For: TD&H Engineering 450 Corporate Drive, Suite 101 Kalispell, MT 59901 June, 2018 130 South Howie Street Helena, Montana
Appendix C Traffic Study
 Final Environmental Impact Statement Appendix C Traffic Study Schofield Generating Station Project, Hawaii October 2015 C-1 Final Environmental Impact Statement This page intentionally left blank. Schofield
VHD Daily Totals. Population 14.5% change. VMT Daily Totals Suffolk 24-hour VMT. 49.3% change. 14.4% change VMT
 6.9 Suffolk 6-54 VMT Population and Travel Characteristics Population 14.5% change 2014 1,529,202 VHD Daily Totals 2014 251,060 49.3% change 2040 1,788,175 2040 374,850 VMT Daily Totals 2014 39,731,990
NORTH HOUSTON HIGHWAY IMPROVEMENT PROJECT (NHHIP)
") NORTH HOUSTON HIGHWAY IMPROVEMENT PROJECT (NHHIP) Project Overview Briefing Packet September 2015 RECOMMENDED ALTERNATIVES Environmental Impact Statement (EIS) Project Divided into 3 Segments Segment 1:
NORTH HOUSTON HIGHWAY IMPROVEMENT PROJECT (NHHIP) Project Overview Briefing Packet September 2015 RECOMMENDED ALTERNATIVES Environmental Impact Statement (EIS) Project Divided into 3 Segments Segment 1:
Appendix C Final Methods and Assumptions for Forecasting Traffic Volumes
 Fairview Ave. and Main St. Improvements and Local Streets Plan Appendices Ada County Highway District Appendix C Final Methods and Assumptions for Forecasting Traffic Volumes January 3, 207 Appendices
Monroe County: Key West and Lower Keys
 FDOT PROJECT UPDATES June 15-21, 2015 Monroe County: Key West and Lower Keys Monroe County projects website: www.fdotmonroe.com Opt Out: If you no longer wish to receive these weekly notifications, please
3.0 ANALYSIS OF FUTURE TRANSPORTATION NEEDS
 3.0 ANALYSIS OF FUTURE TRANSPORTATION NEEDS In order to better determine future roadway expansion and connectivity needs, future population growth and land development patterns were analyzed as part of
ADAPTIVE SIGNAL CONTROL IV
 ADAPTIVE SIGNAL CONTROL IV Evaluation of the Adaptive Traffic Control System in Park City, Utah Dr. Peter T. Martin Associate Professor Aleksandar Stevanovic Research Associate Ivana Vladisavljevic Research
LIC SR INTERCHANGE OPERATIONS STUDY
 LIC SR 16 18.20 - INTERCHANGE OPERATIONS STUDY Project Summary Location SR 16 & W. Church St. Interchange Newark, Ohio Licking County PID 99478 Study Sponsor ODOT District 5 Proposed Work Add Left Turn
TRAFFIC IMPACT STUDY MANUFACTURING COMPANY
 TRAFFIC IMPACT STUDY For MANUFACTURING COMPANY Prepared For: Airway Heights, WA Prepared By: SUNBURST ENGINEERING, P. S. 4310 S. Ball Dr. Veradale, WA 99037 April, 2013 TRAFFIC IMP ACT STUDY Manufacturing
S.170 th Street Micro-Simulation Seattle-Tacoma International Airport Port of Seattle/Aviation Planning
 Seattle-acoma International Airport Port of Seattle/Aviation Planning Port of Seattle PO OF SEAE Aviation Planning Airport Operations January 24, 2013 Summary he Port is planning to relocate the cell phone
TRANSPORTATION IMPACT STUDY WHEELER STREET CLOSURE
 TRANSPORTATION IMPACT STUDY WHEELER STREET CLOSURE Village of Greene, Chenango County, New York Prepared for: VILLAGE OF GREENE 49 Genesee Street Greene, NY 13778 Prepared by: LARSON DESIGN GROUP 1000
ROAD SAFETY AUDIT. VFW Parkway at Spring Street at Bridge Street (Route 109) City of Boston. November 13, Prepared For: MassDOT Highway Division
 City of Boston. November 13, Prepared For: MassDOT Highway Division") ROAD SAFETY AUDIT VFW Parkway at Spring Street at Bridge Street (Route 109) City of Boston November 13, 2015 Prepared For: MassDOT Highway Division Prepared By: Nitsch Engineering 2 Center Plaza, Suite
ROAD SAFETY AUDIT VFW Parkway at Spring Street at Bridge Street (Route 109) City of Boston November 13, 2015 Prepared For: MassDOT Highway Division Prepared By: Nitsch Engineering 2 Center Plaza, Suite
North Whitfield County Roadway Corridor Study
 North Whitfield County Roadway Corridor Study Report #1: Existing Conditions, Projections, and Findings MA Project 11501 July 11, 2011 Prepared For: Greater Dalton Metropolitan Planning Organization Prepared
The last three sections of the main body of this report consist of:
 Threatened and Endangered Species Geological Hazards Floodplains Cultural Resources Hazardous Materials A Cost Analysis section that provides comparative conceptual-level costs follows the Environmental
West Tennessee Construction June 14-21, 2017
 FOR IMMEDIATE RELEASE Wednesday, June 14, 2017 CONTACT: Nichole Lawrence CELL: 731-225-6041 West Tennessee Construction June 14-21, 2017 BENTON COUNTY, I-40 Truck Climbing Lane Wednesday, June 7 through
MODELING OF 85 TH PERCENTILE SPEED FOR RURAL HIGHWAYS FOR ENHANCED TRAFFIC SAFETY ANNUAL REPORT FOR FY 2009 (ODOT SPR ITEM No.
 MODELING OF 85 TH PERCENTILE SPEED FOR RURAL HIGHWAYS FOR ENHANCED TRAFFIC SAFETY ANNUAL REPORT FOR FY 2009 (ODOT SPR ITEM No. 2211) Submitted to: Ginger McGovern, P.E. Planning and Research Division Engineer
VDOT STARS Program Terrell Hughes, PE Conceptual Planning Manager. Richmond Regional Transportation Planning Organization November 2, 2017
 VDOT STARS Program Terrell Hughes, PE Conceptual Planning Manager Richmond Regional Transportation Planning Organization November 2, 2017 Agenda Program Overview Project Development Project Types and Deliverables
MnDOT Method for Calculating Measures of Effectiveness (MOE) From CORSIM Model Output
 From CORSIM Model Output") MnDOT Method for Calculating Measures of Effectiveness (MOE) From CORSIM Model Output Rev. April 29, 2005 MnDOT Method for Calculating Measures of Effectiveness (MOE) From CORSIM Model Output Table of
MnDOT Method for Calculating Measures of Effectiveness (MOE) From CORSIM Model Output Rev. April 29, 2005 MnDOT Method for Calculating Measures of Effectiveness (MOE) From CORSIM Model Output Table of
Road Safety Audit NH 10/Manning Hill Road, Winchester, NH Road Safety Audit NH 10/Manning Hill Road Winchester, NH
 Road Safety Audit NH 10/Manning Hill Road Winchester, NH August 31, 2009 0 1.0 Introduction 1.1 Scope and purpose of Road Safety Audit A Road Safety Audit (RSA) is a formal, proactive safety performance
HALFF 16196? TRAFFIC MANAGEMENT PLAN. Richardson ISD Aikin Elementary School Dallas, Texas North Bowser Road Richardson, Texas 75081
 30280 16196? TRAFFIC MANAGEMENT PLAN Exhibit 572B Aikin Elementary School Planned Development District No. 572 Approved City Plan Commission October20, 2016 July 12, 2016 Prepared for HALFF AVO 31586 PHO1
TRANSPORTATION AND TRAFFIC ANALYSIS REPORT
 Square One Drive Extension Municipal Class Environmental Assessment Environmental Study Report Appendix B Transportation and Traffic Analysis Report TRANSPORTATION AND TRAFFIC ANALYSIS REPORT FINAL DRAFT
Speed Limit Review. Montague Road, West End. Prepared for Brisbane City Council CEB06842 CEB06842
 Speed Limit Review Montague Road, West End CEB06842 CEB06842 Prepared for Brisbane City Council 2 November 2016 Speed Limit Review Montague Road, West End Document Information Prepared for Brisbane City
HSIP FUNDING APPLICATION
 Page 1 Lucas County - Sylvania Ave at Centennial Rd DATE 5/1/2013 Project Information: COUNTY Lucas County LOCATION TYPE PROJECT SERVICE LIFE 20 years SEGMENT INFORMATION ROUTE BEGIN SLM END SLM PRESENT
Weather Information for Road Managers
 Weather Information for Road Managers by Paul A. Pisano, Lynette C. Goodwin and Andrew D. Stern How Does Weather Affect Roads? The complex interactions between weather and roads have major affects on traffic
APPENDIX IV MODELLING
 APPENDIX IV MODELLING Kingston Transportation Master Plan Final Report, July 2004 Appendix IV: Modelling i TABLE OF CONTENTS Page 1.0 INTRODUCTION... 1 2.0 OBJECTIVE... 1 3.0 URBAN TRANSPORTATION MODELLING
COUNCIL POLICY MANUAL
 COUNCIL POLICY MANUAL SECTION: PUBLIC WORKS SUBJECT: SNOW & ICE CONTROL POLICY 2012/2013 GOAL: Pages: 1 of 10 Approval Date: Dec. 3, 2012 Res. # 1001/2012 To annually identify the winter maintenance costs
Weather Information for Surface Transportation (WIST): Update on Weather Impacts and WIST Progress
: Update on Weather Impacts and WIST Progress") Weather Information for Surface Transportation (WIST): Update on Weather Impacts and WIST Progress Samuel P. Williamson Office of the Federal Coordinator for Meteorological Services and Supporting Research
Weather Information for Surface Transportation (WIST): Update on Weather Impacts and WIST Progress Samuel P. Williamson Office of the Federal Coordinator for Meteorological Services and Supporting Research
INDOT Office of Traffic Safety
 Intro to GIS Spatial Analysis INDOT Office of Traffic Safety Intro to GIS Spatial Analysis INDOT Office of Traffic Safety Kevin Knoke Section 130 Program Manager Highway Engineer II Registered Professional
Weather Responsive Traffic Management. WYDOT VSL Project. October 2011
 Weather Responsive Traffic Management Portland, OR WYDOT VSL Project October 2011 Variable Speed Limits I 80 Background Information >50% of I 80 traffic in Wyoming is commercial vehicles Rural AADT 11,000
IDAHO TRANSPORTATION DEPARTMENT
 RESEARCH REPORT IDAHO TRANSPORTATION DEPARTMENT RP 191A Potential Crash Reduction Benefits of Safety Improvement Projects Part A: Shoulder Rumble Strips By Ahmed Abdel-Rahim Mubassira Khan University of
FINAL REPORT. City of Toronto. Contract Project No: B
 City of Toronto SAFETY IMPACTS AND REGULATIONS OF ELECTRONIC STATIC ROADSIDE ADVERTISING SIGNS TECHNICAL MEMORANDUM #2B BEFORE/AFTER COLLISION ANALYSIS AT MID-BLOCK LOCATIONS FINAL REPORT 3027 Harvester
Information for File MVP RMM
 Information for File MVP-2013-03320-RMM Applicant: City of St. Cloud Corps Contact: Ryan Malterud Address: 180 Fifth Street East, Suite 700, St. Paul, MN 55101 E-Mail: Ryan.M.Malterud@usace.army.mil Phone:
Snow and Ice Control POLICY NO. P-01/2015. CITY OF AIRDRIE Snow and Ice Control Policy
 Page 1 CITY OF AIRDRIE Snow and Ice Control Effective Date: Approved By: Approved On: March 17, 2015 City Council March 16, 2015 Revision Date: Resolution #: ------ PURPOSE: The City of Airdrie is responsible
Perth County Road Fatal Head-on Collision - A Common and Dangerous Issue
 Perth County Road Fatal Head-on Collision - A Common and Dangerous Issue Posting Date: 25-Aug-2016 Figure 1: View looking east long "Speeders Alley" - a more appropriate name for the long, straight and
Cipra D. Revised Submittal 1
 Cipra D. Revised Submittal 1 Enhancing MPO Travel Models with Statewide Model Inputs: An Application from Wisconsin David Cipra, PhD * Wisconsin Department of Transportation PO Box 7913 Madison, Wisconsin
SYSTEMATIC EVALUATION OF RUN OFF ROAD CRASH LOCATIONS IN WISCONSIN FINAL REPORT
 SYSTEMATIC EVALUATION OF RUN OFF ROAD CRASH LOCATIONS IN WISCONSIN FINAL REPORT DECEMBER 2004 DISCLAIMER This research was funded by the Wisconsin Department of Transportation. The contents of this report
Factors Affecting the Severity of Injuries Sustained in Collisions with Roadside Objects
 Factors Affecting the Severity of Injuries Sustained in Collisions with Roadside Objects Presenter: Ashirwad Barnwal Adviser: Dr. Peter T. Savolainen Source: clipartbest.com 1 Overview Background Research
Travel Time Based Congestion Measures for Freeway Corridors
 Transportation Kentucky Transportation Center Research Report University of Kentucky Year 2010 Travel Time Based Congestion Measures for Freeway Corridors Mei Chen University of Kentucky, mei.chen@uky.edu
OREGON DEPARTMENT OF TRANSPORTATION STATEWIDE ROAD, WEATHER AND INCIDENT CONDITIONS 4/22/2019 4:20:05 AM
 OREGON DEPARTMENT OF TRANSPORTATION STATEWIDE ROAD, WEATHER AND INCIDENT CONDITIONS Incidents/: 4/22/2019 4:20:05 AM HWY372 22 22 Mount Bachelor Ski Area I-5 10 13 5 Mi S of Ashland Informational only
Tier 2 Final Environmental Assessment I-66 Transportation Technical Report. Appendix E. Travel Demand Forecasting Model Validation Memorandum
 Tier 2 Final Environmental Assessment I-66 Transportation Technical Report Appendix E Travel Demand Forecasting Model Validation Memorandum FINAL AUGUST 216 MEMORANDUM To: Robert Josef, VDOT Northern Virginia
OREGON DEPARTMENT OF TRANSPORTATION STATEWIDE ROAD, WEATHER AND INCIDENT CONDITIONS 4/13/2019 2:54:03 PM
 OREGON DEPARTMENT OF TRANSPORTATION STATEWIDE ROAD, WEATHER AND INCIDENT CONDITIONS Incidents/: 4/13/2019 2:54:03 PM 57 56 @ Corvallis - Newport Hwy OR34 HWY372 22 22 Mount Bachelor Ski Area I-5 10 13