SALMONID HABITAT ASSESSMENT UPPER MILLER CREEK
|
|
|
- Timothy Robinson
- 5 years ago
- Views:
Transcription

1 SALMONID HABITAT ASSESSMENT UPPER MILLER CREEK GRADY RANCH, MARIN COUNTY, CALIFORNIA July 2011 Prepared for: Skywalker Properties Ltd Lucas Valley Road Nicasio, California Prepared by: WRA, Inc G East Francsico Blvd. San Rafael, California 94901
2 TABLE OF CONTENTS 1.0 INTRODUCTION METHODS Habitat Inventory Components Data Analysis Fish Passage Assessment SURVEY RESULTS Miller Creek Grady Creek Landmark Creek Tributary G Tributary S Tributary S Tributary N SUMMARY REFERNCES...26 LIST OF FIGURES Figure 1. Upper Miller Creek Watershed Salmonid Habitat Assessment and Fish Passage Barriers...3 Figure 2. Rosgen Channel Types for the Upper Miller Creek System Survey Reaches...6 LIST OF TABLES Table 1. Rosgen Channel Types for the Upper Miller Creek System Survey Reaches...6 Table 2. Dominant Substrates By Habitat Type in Miller Creek...10 Table 3. Dominant Substrates by Habitat Type in Grady Creek...12 Table 4. Dominant Substrates by Habitat Type in Landmark Creek...14 Table 5. Dominant Substrates by Habitat Type in G Table 6. Dominant Substrates by Habitat Type in S Table 7. Dominant Substrates by Habitat Type in S Table 8. Dominant Substrates by Habitat Type in N LIST OF APPENDICES Appendix A. Annual Hydrologic Record for Miller Creek Appendix B. Habitat Inventory Graphs and Tables Appendix C. Fish Passage Barriers i
3 1.0 INTRODUCTION A stream inventory of the Grady Ranch Study Area was conducted March 23 through April 1, The Study Area is found within the Grady Ranch Property, located on Lucas Valley Road, approximately four miles west of U.S. Highway 101. The Study Area can be found on the Novato USGS 7.5-minute topographical quadrangle (Section 11, Township 2N, Range 7W) at approximately 38 2' 20.64"N, ' 12.97"W. It is bordered on the north and west by the larger Grady Ranch Property and associated open space. Residential housing development is located east of the property boundary, and Big Rock Ranch, a rural commercial development similar to the proposed project, is located to the west of the property boundary. The lands south of the Study Area across Lucas Valley Road are private lands with sparse residential development. The Study Area is located in the upper reaches of the 5,100-acre (eight-square mile) Miller Creek watershed. This creek is a major stream in Marin County and flows east through the Las Gallinas Valley for six miles to San Pablo Bay. Flows within Miller Creek are intermittent, with surface water generally present throughout the rainy season in the entire length of the creek. Surface water may remain present throughout the year in bedrock pools within deeper, shaded portions of Miller Creek within the Study Area in some years. The gravelly substrate of Miller Creek may also allow flows to be transported below the surface during the dry season. Miller Creek flows into San Pablo Bay approximately six miles to the east without contributing flows to any other drainageway. The objective of the habitat inventory was to document existing conditions and available habitat for Central California Coast Steelhead (Steelhead, Oncorhynchus mykiss), a federally threatened species within the Study Area. The objective of this report is to document the current habitat conditions and provide a quantitative baseline for Miller Creek within the Study Area. This data can be used to assess the improvement of post-restoration stream habitat parameters. 2.1 Habitat Inventory Components 2.0 METHODS Habitat typing surveys were conducted by WRA biologists in accordance with the methodology presented in the California Department of Fish and Game California (CDFG) Salmonid Stream Habitat Restoration Manual (SHRM). The inventory sampled approximately 10 percent of the habitat units within the surveyed length. All habitat units in the survey were classified by habitat type and their lengths were measured. Habitat types encountered for the first time were fully measured for all the parameters and characteristics and recorded on the SHRM habitat inventory form. Additionally, out of every ten habitat units listed on the field form, one unit is randomly selected to be fully measured. Because pool habitat tends to serve as a more important habitat feature for fish species, pools were measured for all the parameters and characteristics more frequently than the prescribed 10 percent protocol outlined in the SHRM. 2
 454-8868 Phone (415) 454-0129 Fax Grady Ranch Marin County, California N-2 Miller Creek Landmark Creek (N-3) Figure 1 Upper Miller Creek Watershed FPB_S-2 E E")

4 FPB_Miller 2 N-1 E E FPB_N G East Francisco Blvd. San Rafael, CA (415) Phone (415) Fax Grady Ranch Marin County, California N-2 Miller Creek Landmark Creek (N-3) Figure 1 Upper Miller Creek Watershed FPB_S-2 E E FPB_S-3 S-3 G-2 Grady C reek (N-4) E FPB_Grady Salmonid Habitat Assessment and Fish Passage Barriers Legend Study Area Novato Miles FPB_Miller 1 E E Streams Extent of Habitat Assessment Fish Passage Barriers FPB_S-4 E S-4. Study Area San Pablo Bay Lucas Valley Rd. Feet Miller Creek Watershed San Anselmo San Rafael Path: L:\Acad 2000 Files\18000\18076\GIS\ArcMap\Salmonids\Fig1_HabAssessBarriers_ mxd Map Date: February 2011 Map By: Derek Chan Base Source: Marin County, 2004
5 Four levels of classification (Level I through Level IV) are used to describe physical fish habitat. Each higher level in the sequence includes more descriptive categories of habitat types. For this survey, Miller Creek, Grady Creek, S-3, and S-4 were inventoried to the Level IV category. In a Level IV classification, which is the most thorough classification of stream habitat types listed in SHRM, there are a total of 24 unique habitat features used for the habitat inventory. These 24 unique habitat features more accurately inventory the complexity of habitat found within a stream, and provide a greater level of quantitative detail for the physical fish habitat present. For example, when using a Level IV classification, there are 15 types of pools that can be inventoried and each time a new habitat type is encountered, it is fully inventoried. Landmark Creek, N-1, and G-2 were inventoried to a Level II category. A Level II inventory is less detailed than a Level IV inventory and classifies habitat units into three major habitat units (riffle, pool, and flatwater). By using a Level II classification the general habitat trends of the stream are quantified, however the unique habitat feature is not identified. This approach was used for these streams because they are located outside of the area proposed for restoration (Landmark Creek and N-1); or were determined to be too small to support salmonids (G-2). With a Level II classification, the 15 unique pool types identified in a Level IV are grouped into only one general habitat type (pool). This allows the general habitat of the stream to be identified, but provides a less specific level of detail as to the unique type of habitat unit making up the physical fish habitat. There are eleven components to the SHRM inventory form used to quantify a habitat type. A description for each of these components is described below: Flow and Water Quality Flow conditions and water quality information were collected, and presented in a separate report by Balance Hydrologics (Appendix A). Channel Type Channel typing was conducted according to the classification system developed and revised by David Rosgen (1994). There are five measured parameters used to determine channel type: 1) water slope gradient, 2) entrenchment, 3) width/depth ratio, 4) substrate composition, and 5) sinuosity. Channel characteristics are measured using a clinometer, hand level, hip chain, tape measure, and a stadia rod. Rosgen channel types were determined by field measurements conducted by Balance Hydrologics and WRA for the Miller Creek system. Temperatures - Water and air temperatures were measured and recorded every tenth habitat unit while habitat typing. The time of the measurement is also recorded. Both temperatures are taken in degrees Celsius at the middle of the habitat unit and within one foot of the water surface. Habitat Unit Type Level IV habitat typing uses the 24 habitat classification types defined in the SHRM. Level II habitat typing uses three major habitat units (riffle, flatwater, and pool) for classification types. Habitat units are numbered sequentially and assigned a type identification number selected from a standard list of 24 habitat types (for Level IV), or one of the three major habitat units (for Level II). Dewatered units are labeled "dry". Miller Creek and tributary habitat typing used standard basin level measurement criteria. These parameters require that the minimum length of a described habitat unit must be equal to or greater than the stream's mean 4
6 wetted width. All measurements are in feet to the nearest tenth. Habitat characteristics are measured using a clinometer, hip chain, and stadia rod. Embeddedness - The depth of embeddedness of the cobbles in pool tail-out areas is measured by the percent of the cobble that is surrounded or buried by fine sediment. In the Miller Creek system, embeddedness was ocularly estimated. The values were recorded using the following ranges: 0-25 percent (value 1), percent (value 2), percent (value 3) and percent (value 4). Additionally, a value of 5 was assigned to tail-outs deemed unsuitable for spawning due to inappropriate substrate like bedrock, log sills, boulders or other considerations. Shelter Rating - Instream shelter is composed of those elements within a stream channel that provide juvenile salmonids protection from predation, reduce water velocities so fish can rest and conserve energy, and allow separation of territorial units to reduce density related competition for prey. The shelter rating is calculated for each fully-described habitat unit by multiplying shelter value and percent cover. Using an overhead view, a quantitative estimate of the percentage of the habitat unit covered is made. All cover is then classified according to a list of nine cover types. In the Miller Creek system, a standard qualitative shelter value of 0 (none), 1 (low), 2 (medium), or 3 (high) was assigned according to the complexity of the cover. Thus, shelter ratings can range from and are expressed as mean values by habitat types within a stream. Substrate Composition Substrate composition is based off of seven size classes ranging from silt/clay sized particles to boulders and bedrock elements. In all fully-described habitat units, dominant and sub-dominant substrate composition was ocularly estimated using these seven size classes. The dominant size was listed first, and the sub-dominant size was listed second. In addition, the dominant substrate composing the pool tail-outs is recorded for each pool. Canopy - Stream canopy density was estimated using a handheld spherical densiometer as described in the SHRM. Canopy density relates to the amount of stream shaded from the sun. In the Miller Creek system, an estimate of the percentage of the habitat unit covered by canopy was made from the center of every fully-described unit. In addition, the area of canopy was estimated ocularly into percentages of coniferous or hardwood trees. Bank Composition and Vegetation - Bank composition elements range from bedrock to bare soil. However, the stream banks are usually covered with grass, brush, or trees. These factors influence the ability of stream banks to withstand winter flows. In the Miller Creek system, the dominant composition type and the dominant vegetation type of both the right and left banks for each fully-described unit were selected from the habitat inventory form. Additionally, the percent of each bank covered by vegetation (including downed trees, logs, and rootwads) was estimated and recorded. Large Woody Debris - Large woody debris (LWD) is an important component of fish habitat and an element in channel forming processes. In each habitat unit all pieces of LWD partially or entirely below the elevation of bankfull discharge are counted and recorded. The minimum size to be considered is twelve inches in diameter and six feet in length. Average Bankfull Width - Bankfull width can vary greatly in the course of a channel type stream reach. This is especially true in very long reaches. Bankfull width can be a factor in habitat 5
7 components like canopy density, water temperature, and pool depths. Frequent measurements taken at riffle crests (velocity crossovers) are needed to accurately describe reach widths. Bankfull width measurements for the Miller Creek system were collected and averaged by Balance Hydrologics. 2.2 Data Analysis Data from the habitat inventory form are entered into Stream Habitat , a Visual Basic data entry program developed by Karen Wilson, Pacific States Marine Fisheries Commission in conjunction with the California Department of Fish and Game. This program processes and summarizes the data, producing tables and graphs provided in this report. 2.3 Fish Passage Assessment Potential barriers to fish passage were qualitatively evaluated using protocols established by CDFG, National Marine Fisheries Service, and FishXing. Potential barriers included natural and artificial structures with various impediments that prevent Steelhead from safely moving past them. Factors affecting passage include excessive gradients, large jump heights, insufficient jump pool depths, excessive velocities, insufficient depth, and excessive lengths. The location, passage impediments, structure type, inlet and outlet condition, dimensions, and basic stream information were collected and used to assess the potential for Steelhead to move through the area. The locations of these identified barriers are presented in Figure 1, and a discussion of the passage constraints, along with barrier information and photographs are presented in Appendix C. 3.0 SURVEY RESULTS The following sections describe the results of the studies outlined in Section 2.1 above. Hydrology data was recorded at a series of flow gages in the upper Miller Creek watershed by Balance Hydrologics. Flow conditions for the upper Miller Creek watershed for Water Year 2010 are presented in Appendix A. Rosgen channel type was determined by cross section data gathered by Balance Hydrologics and supplemental field measurements or observations by WRA during habitat typing surveys. Figure 2 and Table 1 provide a breakdown of channel types by reach for the Study Area. Table 1. Rosgen Channel Types for the Upper Miller Creek System Survey Reaches Creek Reach Rosgen Channel Type* Reach Length (feet) Habitat Type Survey Level 1 C IV Miller Creek 2 E IV 3 B4 2,376 IV 4 A4 3,485 IV 6
8 Creek Reach Rosgen Channel Type* Reach Length (feet) Habitat Type Survey Level Grady Creek (N-4) 1 C5 1,546 IV 2 A4 715 IV S-3 1 C3 975 IV S-4 1 C3 629 IV Landmark Creek (N-3) 1 F5 2,095 II N-1 1 A4 1,237 II G-2 1 B5 845 II *Rosgen Channel Types: A = steep, narrow, cascading, step-pool, high energy debris transporting and usually associated with depositional soils. B = moderately entrenched, riffle dominated, infrequently spaced pools, very stable plan and profile, stable banks, moderate gradients and low width-to-depth (W/D) ratios. C = low gradient, meandering, point-bar, riffle/pool, alluvial, broad a well defined floodplain. E = low gradient, slightly entrenched, with low W/D ratios, riffle/pools and well developed floodplains. F = highly entrenched, meandering riffle/pool, low gradient with a high W/D ratio. 1 = Bedrock Dominant; 2 = Boulder Dominant; 3 = Cobble Dominant; 4 = Gravel Dominant; 5 = Sand Dominant; 6 = Silt-clay Dominant. 3.1 Miller Creek The habitat inventory of Miller Creek took place from March 28 though April 1, The total length of stream surveyed was 8,278 feet (2,523 meters) beginning at the downstream end of the Study Area and working upstream. Habitat typing concluded at fish passage barrier Miller 2 (FPB_Miller2), upstream of the confluence of Miller Creek and N-1 (Figure 1). Temperature Water temperatures taken by field crews during the habitat typing survey period ranged from 10.5 to 14 C (51 to 57 F), and air temperature ranged from 10 to 21 C (50 to 70 F). Habitat Unit Type The frequency of Level II habitat type occurrences along Miller Creek amounted to 47 percent pool units, three percent flatwater units, 49 percent riffle units, with approximately one percent bridge units. Based on the total length of this survey, Level II habitat units consist of 47 percent pool units, two percent flatwater units, 50 percent riffle units, with less then one percent bridge units. 7
 454-8868 Phone (415) 454-0129 Fax Grady Ranch Marin County, California Reach 4 - A4 Miller Creek Reach 1 - F5 Landmark Creek (N-3) Reach 3")

9 Reach 1 - A4 N G East Francisco Blvd. San Rafael, CA (415) Phone (415) Fax Grady Ranch Marin County, California Reach 4 - A4 Miller Creek Reach 1 - F5 Landmark Creek (N-3) Reach 3 - B4 Reach 1 - C3 G-2 Reach 1 - C5 Grady C reek (N-4) S-3 Reach 2 - E4 Figure 2 Reach 1 - B5 Reach 2 - A4 Rosgen Channel Types for the Upper Miller Creek System Survey Reaches Legend Study Area Survey Reach Approximate end of reach Reach 1 - C3 S-4 Reac h 1 - C Lucas Valley Rd. Feet Map Date: June 2011 Map By: Derek Chan Base Source: Marin County, 2004 Path: L:\Acad 2000 Files\18000\18076\GIS\ArcMap\Salmonids\Fig2_RosgenChannels_ mxd
10 Eleven (11) level IV habitat types were identified and used. The most abundant habitat types (by frequency of occurrence) were 31 percent Low Gradient Riffle units, 21 percent High Grade Riffle units, and 17 percent Lateral Scour Pool Root Wad Enhanced units. The dominant habitat types (by total length) were Low Gradient Riffle units (31 percent), Corner Pool units (19 percent), and Lateral Scour Pool Root Wad Enhanced units (18 percent). Frequency and percent length of the remaining habitat units are provided in Appendix B. Fifty-two (52) pools were identified along Miller Creek. Scour pools comprised 92 percent of pools encountered with main channel pools making up the remaining eight percent. Scour pools comprise 95 percent of the total length of all pools. Within Miller Creek, eight of the 52 pools (15 percent) measured had a depth of two feet or greater. Shelter Rating Shelter rating for each habitat unit is expressed using a scale from Shelter ratings well below 100 may have too little cover, and those ranging from may not afford enough open water for fish to move within or through the unit. Riffle habitats had a mean shelter rating of 65, flatwater habitats had a mean shelter rating of 30, and pool habitats had a mean shelter rating of 89. Of the pool types, scour pools had a mean shelter rating of 91 and main channel pools had a mean shelter rating of 75. Within Miller Creek on a whole, bubble curtains/whitewater provide the dominant in-stream cover, and the second most dominant form of cover for the creek is root mass. Substrate Composition and Embeddedness Table 2 summarizes dominant substrates by habitat type. Gravel was observed in 65 percent of pool tail-outs, and small cobble was observed in 25 percent of pool tail-outs. The depth of cobble embeddedness was estimated at pool tail-outs. Of the 52 pool tail-outs measured, five had a value of 1 (9.6 percent); 23 had a value of 2 (44.2 percent); 21 had a value of 3 (40.4 percent); three had a value of 4 (5.8 percent). On this scale, a value of 1 indicates the best spawning conditions and a value of 4 the worst. Additionally, a value of five was assigned to tailouts deemed unsuited for spawning due to inappropriate substrate such as bedrock, log sills, boulders, or other considerations. Canopy The mean percent canopy cover along the surveyed length of Miller Creek was 64 percent. Hardwood trees comprise 100 percent of the canopy cover along Miller Creek. On average, 36 percent of the canopy along Miller Creek was described as open. Bank Composition and Vegetation For the stream reach surveyed, the mean percent right bank vegetated was 53 percent. The mean percent left bank vegetated was 51 percent. The dominant elements composing the structure of the stream banks consisted of 66 percent sand/silt/clay, 26 percent cobble/gravel, and seven percent boulder. Grass was the dominant vegetation type observed in 42 percent of 9
11 the units surveyed. Additionally, 31 percent of the units surveyed had deciduous trees as the dominant vegetation type, and 22 percent had brush as the dominant vegetation. Table 2. Dominant Substrates By Habitat Type in Miller Creek Habitat Type Total Habitat Units Habitat Units Fully Measured Percent Total Dominant Silt/Clay Sand Gravel Small Cobble Large Cobble Boulder Bedrock Low Gradient Riffle (LGR) High Gradient Riffle (HGR) Run (Run) Channel Confluence Pool (CCP) Step Pool (STP) Corner Pool (CRP) Lateral Scour Pool Log Enhanced (LSL) Lateral Scour Pool Root Wad Enhanced (LSR) Lateral Scour Pool Bedrock Formed (LSBk) Lateral Scour Pool Boulder Formed (LSBo) Plunge Pool (PLP) Individual reach analysis for inventoried habitat features for Miller Creek, along with accompanying graphs and tables from the collected data, is provided in Appendix B. 10
12 3.2 Grady Creek The habitat inventory of Grady Creek took place March 31, The total length of stream surveyed was 2,261 feet (689 meters), beginning at the downstream confluence of Grady Creek and Miller Creek and working upstream. Habitat typing concluded at fish passage barrier Grady (FPB_Grady) (Figure 1). Temperature Water temperatures taken by field crews during habitat typing ranged from 13 to 15 C (56 to 59 F), and air temperature ranged from 19 to 27 C (66 to 80 F). Habitat Unit Type The Level II habitat occurrence frequency within Grady Creek amounted to 54 percent riffle units and 46 percent pool units. Based on the total length of Level II habitat types, 79 percent were riffle units and 21 percent were pool units. No flatwater units were identified in Grady Creek. Ten (10) level IV habitat types were identified in Grady Creek. The most abundant habitat types (by frequency of occurrence) were High Gradient Riffle units (23 percent), Low Gradient Riffle units (23 percent), and Step Pool units (11 percent). The dominant habitat types (by percent total length) were Low Gradient Riffle units (48 percent), High Gradient Riffle units (27 percent) and Step Pool units (seven percent). Frequency and percent length of the remaining habitat units are provided in Appendix B. Sixteen (16) pools were identified along Grady Creek. Main channel and scour pools each occurred 50 percent of the time; however, main channel pools comprised 75 percent of all pools by length. Grady Creek pools are relatively shallow, with only two of 16 pools (12 percent) having a residual depth of two feet or greater. Shelter Rating Shelter rating for each habitat unit is expressed using a scale from Shelter ratings well below 100 may have too little cover, and those ranging from may not afford enough open water for fish to move within or through the unit. Riffle habitat types had a mean shelter rating of 84, and pool habitat had a mean shelter rating of 76. Main channel pools had a mean shelter rating of 104; scour pools had a mean shelter rating of 54. Within Grady Creek, bubble curtains/whitewater are the dominant cover type, and the second most dominant form of cover within Grady Creek is small woody debris. Substrate Composition and Embeddedness Table 3 summarizes dominant substrates by habitat type. Gravel was observed in 56 percent of pool tail-outs, and small cobble was observed in 31 percent of pool tail-outs. Of the 16 pool tailouts measured, four had a value of 2 (25 percent); and 12 had a value of 3 (75 percent). On this scale, a value of 1 indicates the best spawning conditions and a value of 4 the worst. 11
13 Table 3. Dominant Substrates by Habitat Type in Grady Creek Habitat Type Total Habitat Units Habitat Units Fully Measured Percent Total Dominant Silt/Clay Sand Gravel Small Cobble Large Cobble Boulder Bedrock Low Gradient Riffle (LGR) High Gradient Riffle (HGR) Cascade (CAS) Bedrock Sheet (BRS) Mid-channel Pool (MCP) Channel Confluence Pool (CCP) Step Pool (STP) Corner Pool (CRP) Lateral Scour Pool Log Enhanced (LSL) Plunge Pool (PLP) Canopy The mean percent canopy cover for the surveyed length of Grady Creek was 76 percent. Hardwood trees comprise 90 percent of the canopy cover and coniferous (non-native) trees comprised 10 percent along Grady Creek. On average, 24 percent of the canopy along Grady Creek was described as open. Bank Composition and Vegetation For the stream reach surveyed, the mean percent right bank vegetated was 36 percent. The mean percent left bank vegetated was 52 percent. The dominant elements composing the structure of the stream banks consisted of 38 percent sand/silt/clay, 25 percent bedrock, 22 percent cobble/gravel, and 16 percent boulder. Brush was the dominant vegetation type observed in 31 percent of the units surveyed. Additionally, 28 percent of the units surveyed had 12
14 deciduous trees as the dominant vegetation type and 12 percent had grass as the dominant vegetation. Approximately 28 percent of the units surveyed were dominated by bare ground or leaves and had no vegetative cover. Individual reach analysis for inventoried habitat features for Grady Creek, along with accompanying graphs and tables from the collected data, is provided in Appendix B. 3.3 Landmark Creek The habitat inventory of Landmark Creek took place March 23, The total length of stream surveyed was 2,095 feet (636 meters), beginning at the downstream confluence of Landmark Creek and Miller Creek and working upstream. Habitat typing concluded upstream of the designated Study Area, however below any identified fish passage barriers (Figure 1). Temperature Water temperatures taken by field crews during the habitat typing survey was 11 C (52 F), and air temperature ranged from 11 to 11.5 C (52 to 53 F). Habitat Unit Type The Level II habitat occurrence frequency within Landmark Creek amounted to 50 percent riffle units and 50 percent pool units. Based on the total length of Level II habitat types, 89 percent were riffle units and 11 percent were pool units. No flatwater units were identified in Landmark Creek. Eight (8) pools were identified along Landmark Creek. Pools within this creek are shallow, with none of the eight pools having a residual depth of two feet or greater. Shelter Rating Shelter rating for each habitat unit is expressed using a scale from Shelter ratings well below 100 may have too little cover, and those ranging from may not afford enough open water for fish to move within or through the unit. Riffle habitat types had a mean shelter rating of 20, and pool habitat had a mean shelter rating of 92. Within Landmark Creek, bubble curtains/whitewater are the dominant cover type, and the second most dominant form of cover within Landmark Creek is root mass. Substrate Composition and Embeddedness Table 4 summarizes dominant substrates by habitat type in Landmark Creek. Gravel was observed in 100 percent of pool tail-outs. Of the four pool tail-outs measured, three had a value of 2 (75 percent); and one had a value of 3 (25 percent). On this scale, a value of 1 indicates the best spawning conditions and a value of 4 the worst. 13
15 Table 4. Dominant Substrates by Habitat Type in Landmark Creek Habitat Type Total Habitat Units Habitat Units Fully Measured Percent Total Dominant Silt/Clay Sand Gravel Small Cobble Large Cobble Boulder Bedrock Riffle Pool Canopy The mean percent canopy cover for the surveyed length of Landmark Creek was 90 percent. Hardwood trees comprise 100 percent of the canopy cover along Landmark Creek. On average, 10 percent of the canopy along Landmark Creek was described as open. Bank Composition and Vegetation For the stream reach surveyed, the mean percent right bank vegetated was 28 percent. The mean percent left bank vegetated was 51 percent. The dominant elements composing the structure of the stream banks consisted of 38 percent sand/silt/clay, 25 percent cobble/gravel, 25 percent boulder, and 12 percent bedrock. Deciduous trees were the dominant vegetation type observed in 50 percent of the units surveyed. Additionally, 38 percent of the units surveyed had grass as the dominant vegetation type, while 12 percent had brush as the dominant vegetation. Individual reach analysis for inventoried habitat features for Landmark Creek, along with accompanying graphs and tables from the collected data, is provided in Appendix B. 3.4 Tributary G-2 The habitat inventory of G-2, a tributary to Grady Creek, took place March 23, The total length of stream surveyed was 845 feet (258 meters), beginning at the downstream confluence of G-2 and Grady Creek and working upstream. Habitat typing concluded at the confluence of two small tributaries (wetted width less then two feet) that form G-2 (Figure 1). Temperature Water temperatures taken by field crews during the habitat typing survey was 12 C (54 F), and air temperature was 14 C (57 F). 14
16 Habitat Unit Type The Level II habitat occurrence frequency within G-2 amounted to 50 percent riffle units, 25 percent flatwater units, 17 percent pool units, and eight percent culverts. Based on total length of Level II habitat types, 79 percent were riffle units, 15 percent were flatwater units, two percent were pool units, and four percent were culverts. Two (2) pools were identified along G-2. Pools within this creek are very shallow, with neither of the two pools having a residual depth of two feet or greater. Shelter Rating Shelter rating for each habitat unit is expressed using a scale from Shelter ratings well below 100 may have too little cover, and those ranging from may not afford enough open water for fish to move within or through the unit. Riffle habitat types had a mean shelter rating of 78, flatwater habitat types had a mean shelter rating of 55, and pool habitat had a mean shelter rating of 15. Within G-2, terrestrial vegetation is the dominant cover type, and the second most dominant form of cover within G-2 is bubble curtains/whitewater. Substrate Composition and Embeddedness Table 5 summarizes dominant substrates by habitat type. Gravel was observed in 100 percent of pool tail-outs. One pool tail-out was measured and had a value of 3. On this scale, a value of 1 indicates the best spawning conditions and a value of 4 the worst. Table 5. Dominant Substrates by Habitat Type in G-2 Habitat Type Total Habitat Units Habitat Units Fully Measured Percent Total Dominant Silt/Clay Sand Gravel Small Cobble Large Cobble Boulder Bedrock Riffle Pool Flatwater Canopy The mean percent canopy cover for the surveyed length of G-2 was 46 percent. Hardwood trees comprise 94 percent of the canopy cover and coniferous trees comprised six percent along G-2. On average, 54 percent of the canopy along G-2 was described as open. 15
17 Bank Composition and Vegetation For the stream reach surveyed, the mean percent right bank vegetated was 59 percent. The mean percent left bank vegetated was 78 percent. The dominant elements composing the structure of the stream banks consisted of 80 percent sand/silt/clay, and 20 percent boulder. Grass was the dominant vegetation type observed in 60 percent of the units surveyed. Additionally, 40 percent of the units surveyed had deciduous trees as the dominant vegetation type. Individual reach analysis for inventoried habitat features for G-2, along with accompanying graphs and tables from the collected data, is provided in Appendix B. 3.5 Tributary S-3 The habitat inventory of S-3, a tributary to Miller Creek, took place March 23, The total length of stream surveyed was 845 feet (258 meters), beginning at the downstream confluence of S-3 and Miller Creek and working upstream. Habitat typing concluded at the Lucas Valley Road crossing, identified as a fish passage barrier (FPB_S-3) (Figure 1). Temperature Water temperatures taken by field crews during the habitat typing survey was 16 C (61 F), and air temperature was 19 C (66 F). Habitat Unit Type The Level II habitat occurrence frequency within S-3 amounted to 46 percent riffle units, eight percent flatwater units, and 46 percent pool units. Based on total length of Level II habitat types, 84 percent were riffle units, 12 percent were pool units, and four percent were flatwater units. Seven (7) level IV habitat types were identified in S-3. The most abundant habitat types (by frequency of occurrence) were Low Gradient Riffle units (38 percent), and Lateral Scour Pool Boulder Formed units (23 percent). The remaining five habitat units all had a frequency of eight percent. The dominant habitat types by percent total length were Low Gradient Riffle units (76 percent), High Gradient Riffle units (eight percent), and Lateral Scour Pool Boulder Formed units (seven percent). Frequency and percent length of the remaining habitat units are provided in Appendix B. Six (6) pools were identified along S-3. Pools within this creek are very shallow, with all six pools having a residual depth less than two feet. Shelter Rating Shelter rating for each habitat unit is expressed using a scale from Shelter ratings well below 100 may have too little cover, and those ranging from may not afford enough open water for fish to move within or through the unit. Riffle habitat types had a mean shelter 16
18 rating of 88, flatwater habitat types had a mean shelter rating of 12, and pool habitat had a mean shelter rating of 64. Within S-3, terrestrial vegetation is the dominant cover type, and the second most dominant form of cover within S-3 is boulders. Substrate Composition and Embeddedness Table 6 summarizes dominant substrates by habitat type. Gravel was observed in 100 percent of pool tail-outs. Of the six pool tail-outs measured, two had a value of 2 (33.3 percent), three had a value of 3 (50 percent), and one had a value of 4 (16.7 percent). On this scale, a value of 1 indicates the best spawning conditions and a value of 4 the worst. Table 6. Dominant Substrates by Habitat Type in S-3 Habitat Type Total Habitat Units Habitat Units Fully Measured Percent Total Dominant Silt/Clay Sand Gravel Small Cobble Large Cobble Boulder Bedrock Low Gradient Riffle (LGR) High Gradient Riffle (HGR) Run (RUN) Mid-channel Pool (MCP) Channel Confluence Pool (CCP) Lateral Scour Pool Log Enhanced (LSL) Lateral Scour Pool Boulder Enhanced (LSBo) Canopy The mean percent canopy cover for the surveyed length of S-3 was 91 percent. Hardwood trees comprise 100 percent of the canopy cover along S-3. On average, nine percent of the canopy along S-3 was described as open. 17
19 Bank Composition and Vegetation For the stream reach surveyed, the mean percent right bank vegetated was 77 percent. The mean percent left bank vegetated was 51 percent. The dominant elements composing the structure of the stream banks consisted of 57 percent cobble/gravel, and 29 percent sand/silt/clay. Deciduous trees were the dominant vegetation type observed in 43 percent of the units surveyed. Additionally, 29 percent of the units surveyed had brush as the dominant vegetation type. Individual reach analysis for inventoried habitat features for S-3, along with accompanying graphs and tables from the collected data, is provided in Appendix B. 3.6 Tributary S-4 The habitat inventory of S-4, a tributary to Miller Creek, took place March 31, The total length of stream surveyed was 629 feet (192 meters), beginning at the downstream confluence of S-4 and Miller Creek and working upstream. Habitat typing concluded at the Lucas Valley Road crossing, identified as a fish passage barrier (FPB_S-4) (Figure 1). Temperature Water temperatures taken by field crews during the habitat typing survey was 16 C (61 F), and air temperature was 25 C (77 F). Habitat Unit Type The Level II habitat occurrence frequency within S-4 amounted to 62 percent riffle units and 38 percent pool units. Based on total length of Level II habitat types, 89 percent were riffle units and 11 percent were pool units. Four (4) level IV habitat types were identified in S-4. The most abundant habitat types (by frequency of occurrence) were Low Gradient Riffle units (50 percent), and Lateral Scour Pool Boulder Formed units (25 percent). The remaining two habitat units had a frequency of 12 percent. The dominant habitat types by percent total length were Low Gradient Riffle units (79 percent), Cascade units (10 percent), and Corner Pool units (nine percent). Frequency and percent length of the remaining habitat units are provided in Appendix B. Three (3) pools were identified along S-4. One of the three pools within this creek had a residual depth of two feet or greater. Shelter Rating Shelter rating for each habitat unit is expressed using a scale from Shelter ratings well below 100 may have too little cover, and those ranging from may not afford enough open water for fish to move within or through the unit. Riffle habitat types had a mean shelter rating of 20, and pool habitat had a mean shelter rating of 45. Within S-4, bubble 18
20 curtain/whitewater is the dominant cover type, and the second most dominant form of cover within S-4 is terrestrial vegetation. Substrate Composition and Embeddedness Table 7 summarizes dominant substrates by habitat type. Gravel was observed in 67 percent of pool tail-outs, and boulders were observed in 33 percent. Of the three pool tail-outs measured, one had a value of 2 (33.3 percent); and two had a value of 3 (66.7 percent). On this scale, a value of 1 indicates the best spawning conditions and a value of 4 the worst. Table 7. Dominant Substrates by Habitat Type in S-4 Habitat Type Total Habitat Units Habitat Units Fully Measured Percent Total Dominant Silt/Clay Sand Gravel Small Cobble Large Cobble Boulder Bedrock Low Gradient Riffle (LGR) Cascade (CAS) Corner Pool (CRP) Lateral Scour Pool Boulder Enhanced (LSBo) Canopy The mean percent canopy cover for the surveyed length of S-4 was 43 percent. Hardwood trees comprise 100 percent of the canopy cover. On average, 57 percent of the canopy along S-4 was described as open. Bank Composition and Vegetation For the stream reach surveyed, the mean percent right bank vegetated was 25 percent. The mean percent left bank vegetated was 26 percent. The dominant elements composing the structure of the stream banks consisted of 62 percent sand/silt/clay, and 25 percent boulder. Grass was the dominant vegetation type observed in 25 percent of the units surveyed. Additionally, 12 percent of the units surveyed had brush as the dominant vegetation type. 19
21 Individual reach analysis for inventoried habitat features for S-4, along with accompanying graphs and tables from the collected data, is provided in Appendix B. 3.7 Tributary N-1 The habitat inventory of N-1, a tributary to Miller Creek, took place April 1, The total length of stream surveyed was 1,237 feet (377 meters), beginning at the downstream confluence of N-1 and Miller Creek and working upstream. Habitat typing concluded at fish passage barrier N-1 (FPB_N-1) (Figure 1). Temperature Water temperatures taken by field crews during the habitat typing survey ranged from 14 to 14.5 C (57 to 58 F), and air temperature was 22 C (72 F). Habitat Unit Type The Level II habitat occurrence frequency within N-1 amounted to 50 percent riffle units and 50 percent pool units. Based on total length of Level II habitat types, 72 percent were riffle units,and 28 percent were pool units. Ten (10) pools were identified along N-1. Pools within this creek are very shallow, with all ten pools having a residual depth less than two feet. Shelter Rating Shelter rating for each habitat unit is expressed using a scale from Shelter ratings well below 100 may have too little cover, and those ranging from may not afford enough open water for fish to move within or through the unit. Riffle habitat types had a mean shelter rating of 25, and pool habitat had a mean shelter rating of 110. Within N-1, bubble curtain/whitewater is the dominant cover type, and the second most dominant form of cover is boulders. Substrate Composition and Embeddedness Table 8 summarizes dominant substrates by habitat type. Small cobble was observed in 60 percent of pool tail-outs, and gravel observed in 20 percent. Of the ten pool tail-outs measured, three had a value of 2 (30 percent); five had a value of 3 (50 percent); one had a value of 4 (10 percent); and one had a value of 5 (10 percent). On this scale, a value of 1 indicates the best spawning conditions and a value of 4 the worst. A value of 5 was assigned to tail-outs deemed unsuited for spawning due to inappropriate substrate such as bedrock, log sills, boulders, or other considerations. 20
22 Canopy The mean percent canopy cover for the surveyed length of N-1 was 80 percent. Hardwood trees comprise 100 percent of the canopy cover. On average, 20 percent of the canopy along N-1 was described as open. Table 8. Dominant Substrates by Habitat Type in N-1 Habitat Type Total Habitat Units Habitat Units Fully Measured Percent Total Dominant Silt/Clay Sand Gravel Small Cobble Large Cobble Boulder Bedrock Riffle Pool Bank Composition and Vegetation For the stream reach surveyed, the mean percent right bank vegetated was 59 percent. The mean percent left bank vegetated was 34 percent. The dominant elements composing the structure of the stream banks consisted of 42 percent boulder, and 33 percent sand/silt/clay. Grass was the dominant vegetation type observed in 50 percent of the units surveyed. Additionally, 33 percent of the units surveyed had deciduous trees as the dominant vegetation type. Individual reach analysis for inventoried habitat features for N-1, along with accompanying graphs and tables from the collected data, is provided in Appendix B. 4.0 SUMMARY The following section provides a brief summary of results for data collected and trends identified for each of the water bodies assessed. This habitat inventory is intended as a baseline for existing conditions within the Study Area, and can be used to compare changes in habitat conditions following restoration activities or to monitor long term changes within the upper watershed. Miller Creek Within the Study Area, Miller Creek is the major water body and receives water from the other tributaries included in this assessment. Due to the Grady Bridge total fish passage barrier (PFB_Miller1), only 1,120 of the 8,278 feet inventoried are currently accessible to Steelhead. 21
23 This total barrier also prevents Steelhead access to Landmark Creek, S-3, and tributary N-1. Removing this barrier will open several miles of stream habitat in the Upper Miller Creek watershed to Steelhead. Habitat within Miller Creek is dominated by riffles and pools, with flatwater making up only a small percentage of habitat length. Overall the gradient in the creek was low, until you reach the upper reach located above the N-1 and Miller Creek confluence. Pool habitat, which plays a critical role in the freshwater component of Steelhead life history, was readily available within Miller Creek. The habitat quality was good overall, particularly in the middle and upper portion of the Study Area, with a diversity of instream cover types and good canopy cover in the majority of the area surveyed. Large woody debris (LWD) was also found in several pools. LWD has been documented as a very important structural component to Salmonid streams because it provided cover, increases pool depth with scouring, decreases velocities, provides attachment points for benthic invertebrates (food source for Salmonids) and has generally been shown to support higher densities of young fish then other habitat types (Harvey et al. 1999, Cederholm et al. 1997, Niles and Hartman 2009, SHRM). The lower portion of Miller Creek within the Study Area had less riparian vegetation, and tended to have more fine sediment and increased bank erosion. These factors reduce the overall quality of pool habitat and would be an area improved with restoration. Any restoration should maintain and/or increase LWD currently in the stream the greatest extent feasible. Fine sediment was found in many habitat units, and played a large role in reducing the overall quality of spawning habitat within Miller Creek. Large amounts of fine sediment can reduce Salmonid reproductive success by burying suitable spawning gravels and cause direct mortality in redds by suffocating embryos or burying alevin (Dumke et al 2010). While several pool tailouts in Miller Creek supported gravel of suitable spawning size, fine sediment increased the embeddedness of this substrate, which could reduce the spawning success of Steelhead if they had access to these areas. Factors influencing instream fine sediment load identified during the survey included large erosive head cuts along the banks of Miller Creek and landslide/bank failures observed along tributaries to Miller Creek. The dominant factor that reduces the habitat quality and quantity within Miller Creek is the short duration of time the channel holds water. With the exception of a few small bedrock pools in reach 4 (Figure 2), Miller Creek within the Study Area is an ephemeral creek that generally only holds water from December to May. Even the deepest pools surveyed do not hold water year round, so the portion of Miller Creek within the Study Area is currently not suitable for year round rearing of Steelhead. Balance Hydrologics has identified the severity of down cutting and the reduction of the groundwater table as major components to this short hydroperiod. Increasing the amount of time Miller Creek is flowing within the Study Area could greatly improve the quality of habitat within upper Miller Creek. Grady Creek Habitat within Grady Creek is dominated by riffles, with pool habitat comprising only about 20 percent of the total length accessible to Steelhead. Like Miller Creek, fine sediment reduces the 22
24 small areas of potential spawning habitat available in much of Grady Creek. Much of the banks along this creek are severally eroded and lack vegetation. The lower reach of Grady Creek, which extends from the Miller Creek confluence up to the start of the narrow canyon, is primarily low gradient riffles with low to moderate riparian cover. Pools are generally shallow (less then two feet). There are also several areas where fencing, concrete slabs, old road crossings, and metal litter the creek. While these objects are not blocking passage for Steelhead, they are obstructions and reduce habitat quality within the creek. The upper reach of Grady Creek offers higher quality habitat for Steelhead. There is a greater frequency of pools, with slightly more depth, and good instream cover. Dense riparian canopy cover dominates this section, providing good thermal refugia for fish during summer months. Most of the upper reach remains perennial, with hillside seeps and springs providing cool clear water year round to the upper pools. Landmark Creek The length of stream surveyed in Landmark Creek was dominated by riffle habitat, with pool habitat comprising only a little more then 10 percent of the total length. Riparian cover is excellent throughout the survey reach, however steep eroding banks are a source of fine sediment that degrades habitat conditions and filled several pools in the lower portion of the reach. The upper portion of Landmark Creek provides better riffle/pool habitat, with an increase in gradient, and more instream cover observed. Bank erosion is still noticeable, however based on observations, appears to be less than the section closer to Miller Creek. Habitat typing concluded once surveyors were well outside of the Study Area; however no fish passage barrier was reached and additional habitat was visible upstream. The surveyed area is ephemeral, however hillside seeps that feed perennial pools in both Grady Creek and N-1 may also support year round water in the upper reaches of Landmark Creek. Currently, Landmark Creek is completely inaccessible to Steelhead due to the downstream fish passage barrier on Miller Creek. Tributary G-2 G-2 is a small tributary to Grady Creek that is dominated by riffle and flatwater habitat, and has very little pool habitat (less then three percent of the length surveyed). The surveyed area has very little complexity, with only small amounts of instream cover. G-2 is also a narrow channel, where the average channel width for all habitat types surveyed varying from two to four feet, and there is very little sinuosity. Riparian cover was lower in this area surveyed then any other stream in the Study Area, which is primarily due to a grassy meadow the stream transverses for much of the area surveyed. 23
25 G-2 is an ephemeral drainage that dries quickly. During the actual survey of this tributary on March 23, 2011 there was water flowing from recent storm activities. Upon a follow up visit to the Study Area on March 31, 2011, G-2 was completely dry (as visible from Grady Creek). Access for Steelhead into this small tributary is very limited due to existing culverts and a drop/obstruction at the confluence of G-2 and Grady Creek. The habitat for Steelhead is also very limited, with several sections of concrete and extensive fine sediment dominating the surveyed area. These substrate types provide few attachment points for benthic invertebrates, which provide an important food source for young Steelhead. Because of the short amount of time G-2 holds water, the small channel size, lack of pool habitat, and instream culverts/concrete, this channel is unlikely to support Steelhead. G-2 is a direct tributary to Grady Creek and Miller Creek, so the input of nutrients and cold water to those larger creeks still serves an important benefit. Tributary S-3 S-3 is a tributary to Miller Creek that parallels Lucas Valley Road for most of the survey length. Habitat within this tributary is dominated by riffles with pools comprising only about 12 percent of the length surveyed. Instream cover and complexity is moderate, but there is good riparian cover throughout the surveyed area. The pools within this reach are generally shallow, and fine sediment levels have reduced the quality of gravels in the pool tail-outs as shown with the high embeddedness levels. Habitat within this tributary is currently inaccessible to Steelhead due to the downstream fish passage barrier on Miller Creek. Habitat typing ended at a culvert bisecting Lucas Valley Road. Based on the culvert dimensions and length, the structure appears to be a fish passage barrier for upstream movement of juvenile Steelhead under all flow conditions and adult Steelhead under most flow conditions. Similar to many culvert designs throughought the state, water conveyance was the primary design and concern with fish passage requirements was not realized until many years later (SRF 2010). Improving the passage capability of this culvert could open additional habitat within the Miller Creek watershed outside of the Study Area. Similar to the flow conditions found within Miller Creek in this section, S-3 is an ephemeral creek that shows significant signs of incision. Balance Hydrologics has identified the severity of down cutting and the reduction of the groundwater table as major components to this short hydro period. Increasing the amount of time S-3 is flowing within the Study Area could greatly improve the quality of habitat within upper Miller Creek. Tributary S-4 S-4 is a tributary to Miller Creek that is dominated by riffle habitat with pool habitat comprising only about 10 percent of the length surveyed. Instream cover and complexity is lacking in many of the surveyed habitat units, and the limited pool habitat reduces the quantity of usable habitat for Steelhead within this tributary. 24
26 A moderate section of available habitat was restricted to a narrow and highly incised cascade that appears to have eroded significantly over the past year. Similar to the instream erosion, bank erosion appears to be a significant source of fine sediment within the area surveyed. A lack of vegetative cover, low riparian coverage, and fine sediment within the channel are all indicative of incision taking place. Habitat typing ended at a culvert bisecting Lucas Valley Road. Based on the culvert dimensions and length, the structure appears to be a fish passage barrier for upstream movement of juvenile Steelhead under all flow conditions and adult Steelhead under most flow conditions. Similar to many culvert designs throughought the state, water conveyance was the primary design and concern with fish passage requirements was not realized until many years later (SRF 2010). Improving the passage capability of this culvert could open additional habitat within the Miller Creek system outside of the Study Area. Similar to the flow conditions found within Miller Creek in this section, S-4 is an ephemeral creek. Balance Hydrologics has identified the severity of down cutting and the reduction of the groundwater table as major components to this short hydro period. Increasing the amount of time S-4 is flowing within the Study Area could greatly improve the quality of habitat within upper Miller Creek. Tributary N-1 N-1 is a tributary to the upper reach of Miller Creek. Habitat within the area surveyed is dominated by riffles with pool habitat comprising approximately 27 percent of the total length. Boulders are a more pronounced feature within this section of creek, and several riffle/pool sections are formed around these. Instream cover and complexity is good for many of the pools, however overall pool depth is limited in the majority of the area surveyed. This is likely a function of the streams location higher up in the watershed. There is also good riparian cover, particularly in the section closer to the Miller Creek and N-1 confluence. Spawning habitat within N-1 is likely restricted due to the relatively small amount of pool tail-out area and relatively high embeddedness. Fine sediment and boulder substrate reduced the quality of potential spawning habitat in approximately 70 percent of the pool tail-outs surveyed. Despite this, N-1 appears to offer suitable rearing habitat for young Steelhead because much of the upper portion of this survey reach remains perennially wetted from input from nearby springs. While the pools are small in size (mean area 250 feet) and depth (mean max depth 1.3 feet), there is good instream cover and riparian shading that could provide summer rearing and hold-out habitat for young-of-year Steelhead. Currently, habitat within N-1 is completely inaccessible to Steelhead due to the downstream fish passage barrier in Miller Creek. Improving the passage capability of FPB_Miller1 will allow access to this area which has the capability of supporting Steelhead year round. 25
27 5.0 REFERNCES California Department of Fish and Game California Salmonid Stream Habitat Restoration Manual. State of California Resource Agency. Third Edition Volumes I and II. Cederholm, C., R. Bilby, P. Bisson, T. Bumstead, B. Fransen, W. Scarlett, and J. Ward Response of Juvenile Coho Salmon and Steelhead to Placement of Large Woddy Debris in a Coastal Washington Stream. North American Journal of Fisheries Management Vol 17: Dumke, J., T. Hrabik, V. Brady, K. Gran, R. Regal, and M. Seider Channel Morphology Response to Selective Wood Removals in a Sand-laden Wisconsin Trout Stream. North American Journal of Fisheries Management Vol 30: Harvey, B., R. Nakamoto, and J. White Influence of large woody debris and a bankfull flood on movement of adult resident coastal cutthroat trout (Oncorhynchus clarki) during fall and winter. Can. J. Fish. Aquat. Sci. 56: Niles, J., and K. Hartman Larval Fish Use of Dike Structures on a Navigable River. North American Journal of Fisheries Management Vol 29: Salmonid Restoration Federation Fish Passage and Engineering Workshop. In sponsorship with: California Department of Fish and Game, and NOAA Fisheries. San Luis Obispo, CA 26
28 Appendix A Annual Hydrologic Record for Miller Creek

29 Form 1. Annual Hydrologic Record: Miller Creek above Grady Bridge Water Year: 2010 Stream: Miller Creek Station Location / Watershed Descriptors Station: above Grady Bridge Approximately 20 feet upstream Grady Bridge (right bank) County, State: Marin County, CA Latitude: 38 2'22.58"N, Longitude: '9.31"W (WGS84) Station Location Map Drainage area is 1344 acres or 2.10 square miles. Regulation: County open space N Period of Record Gage was installed on 11/4/09 by Balance Hydrologics. Record 11/24/09 through 9/30/10. Gaging sponsored by Skywalker Properties, Ltd. Mean Flows Monthly mean flows are presented below. Pre-report interim gaging reuslts Seasonal Peak Flows (period of record) Date Time Gage Ht. Discharge Date Time Gage Ht. Discharge (24-hr) (feet) (cfs) (24-hr) (feet) (cfs) 1/20/10 9: Water Year Daily Mean Flow (cubic feet per second) DAY OCT NOV DEC JAN FEB MAR APR MAY JUN JUL AUG SEPT 1 no data no data no data no data no data no data no data no data no data no data no data no data no data no data no data no data no data no data no data no data no data no data no data no data no data no data no data no data no data no data no data no data no data no data MEAN NA MAX. DAY NA MIN. DAY NA cfs days NA ac-ft NA Monitor's Comments Water Year Summary 1. Multiple stage shifts were applied to the rating equation for local scour or fill. Mean daily discharge 2.48 (cfs) 2. Daily values with more than 2 to 3 significant figures result from calculations. No additional precision is implied. Max. daily discharge 68.3 (cfs) 3. Annual mean, maximum and minimum flows are not presented since this is the first water year in the period of record. Min. daily discharge 0.00 (cfs) Total 817 (cfs-days) Total Volume 1620 (ac-ft) Balance Hydrologics, Inc. 101 Lucas Valley Rd., Suite 229, San Rafael, CA (415) Balance Hydrologics, Inc. 800 Bancroft Way, Suite 101, Berkeley, CA (510) ; fax: (510) ; Miller Ck 15data.xls Data preliminary and subject to revision 2010 Balance Hydrologics, Inc.
30 Streamflow commonly changes during the course of a day, thus an instantaneous flow measurement will not exactly match the mean flow for the day. Seasonal peak flow:199 cfs, January 20, 2010 at 9:00. Daily max flow Daily mean flow Flow measured with current meter Flow estimated by hydrologist No flow observed by hydrologist /1/09 10/29/09 11/26/09 12/24/09 1/21/10 2/18/10 3/18/10 4/15/10 5/13/10 6/10/10 7/8/10 8/5/10 9/2/10 9/30/10 Flow (cfs) On November 4, we installed this real-time station approximately 20 feet upstream of Grady Bridge in a right bank pool. Figure X. Annual hydrograph for Miller Creek above Grady Bridge, water year 2010, Marin County, California. The channel briefly wetted following the first significant early-season October 13th storm. Flows were continuous from January 12th through March 23rd, and again from March 30th through April 30th. The channel was dry from May 1st through the end of the water year Miller Ck 15data.xls, Dailyflow Data preliminary and subject to revision 2010 Balance Hydrologics, Inc.

31 Form 2. Annual Hydrologic Record: Grady Creek Water Year: 2010 Stream: Grady Creek Station Location / Watershed Descriptors Station: Approximately 350 feet upstream of the confluence with Miller Creek (left bank) County, State: Marin County, CA Latitude: 38 2'25.49"N, Longitude: '5.44"W (WGS84) Station Location Map Drainage area is 256 acres or 0.40 square miles. Regulation: County open space N Period of Record Gage was installed on 11/4/09 by Balance Hydrologics. Preliminary record 11/4/09 through 9/30/10. Gaging sponsored by Skywalker Properties, Ltd. Mean Flows Monthly mean flows are presented below. Pre-report interim gaging reuslts Seasonal Peak Flows (period of record) Date Time Gage Ht. Discharge Date Time Gage Ht. Discharge (24-hr) (feet) (cfs) (24-hr) (feet) (cfs) 1/20/10 8: Water Year Daily Mean Flow (cubic feet per second) DAY OCT NOV DEC JAN FEB MAR APR MAY JUN JUL AUG SEPT 1 no data no data no data no data no data no data no data no data no data no data no data no data no data no data no data no data no data no data no data no data no data no data no data no data no data no data no data no data no data no data no data no data no data no data MEAN NA MAX. DAY NA MIN. DAY NA cfs days NA ac-ft NA Monitor's Comments Water Year Summary 1. Multiple stage shifts were applied to the rating equation for local scour or fill. Mean daily discharge 0.63 (cfs) 2. Daily values with more than 2 to 3 significant figures result from calculations. No additional precision is implied. Max. daily discharge 17.4 (cfs) 3. Annual mean, maximum and minimum flows are not presented since this is the first water year in the period of record. Min. daily discharge 0.00 (cfs) 4. The bank adjacent to the gage slumped on March 2 and buried the sensors. The sensors continued to operate, Total 209 (cfs-days) but flow values are approximate. The sensors were dug out on April 30. Total Volume 415 (ac-ft) Balance Hydrologics, Inc. 101 Lucas Valley Rd., Suite 229, San Rafael, CA (415) Balance Hydrologics, Inc. 800 Bancroft Way, Suite 101, Berkeley, CA (510) ; fax: (510) ; Grady Ck 15data.xls, Dailyform Data preliminary and subject to revision 2010 Balance Hydrologics, Inc.
32 1000 Streamflow commonly changes during the course of a day, thus an instantaneous flow measurement will not exactly match the mean flow for the day. Daily max flow Daily mean flow Flow measured with current meter 100 Seasonal peak flow: 34.6 cfs, January 20, 2010 at 8:15. The bank adjacent to the gage slumped on March 2 and buried the sensors. The sensors continued to operate, but flow values are approximate. The sensors were dug out on April 30. No flow observed by hydrologist /1/09 10/29/09 11/26/09 12/24/09 1/21/10 2/18/10 3/18/10 4/15/10 5/13/10 6/10/10 7/8/10 8/5/10 9/2/10 Flow (cfs) 9/30/10 On November 4, we installed this station approximately 350 feet upstream of the confluence with Miller Creek in a left bank pool. Figure X. Annual hydrograph for Grady Creek, water year 2010, Marin County, California. The channel briefly wetted following the first significant early-season October 13th storm. Flows were continuous from January 8th through May 1st Grady Ck 15data.xls, Dailyflow Data preliminary and subject to revision 2010 Balance Hydrologics, Inc.

33 Form 3. Annual Hydrologic Record: Landmark Creek Water Year: 2010 Stream: Landmark Creek Station Location / Watershed Descriptors Station: Approximately 250 feet downstream road crossing (500 feet upstream Miller Creek) County, State: Marin County, CA Latitude: 38 2'34.59"N, Longitude: '23.98"W (WGS84) Station Location Map Drainage area is 256 acres or 0.40 square miles. Regulation: County open space N Period of Record Gage was installed on 11/16/09 by Balance Hydrologics. Preliminary record 11/16/09 through 9/30/10. Gaging sponsored by Skywalker Properties, Ltd. Mean Flows Monthly mean flows are presented below. Pre-report interim gaging reuslts Seasonal Peak Flows (period of record) Date Time Gage Ht. Discharge Date Time Gage Ht. Discharge (24-hr) (feet) (cfs) (24-hr) (feet) (cfs) 1/20/10 8: Water Year Daily Mean Flow (cubic feet per second) DAY OCT NOV DEC JAN FEB MAR APR MAY JUN JUL AUG SEPT 1 no data no data no data no data no data no data no data no data no data no data no data no data no data no data no data no data no data no data no data no data no data no data no data no data no data no data no data no data no data no data no data no data no data no data no data no data no data no data no data no data no data no data no data no data no data no data MEAN NA NA MAX. DAY NA NA MIN. DAY NA NA cfs days NA NA ac-ft NA NA Monitor's Comments Water Year Summary 1. Daily values with more than 2 to 3 significant figures result from calculations. No additional precision is implied. Mean daily discharge 0.40 (cfs) 2. Annual mean, maximum and minimum flows are not presented since this is the first water year in the period of record. Max. daily discharge 10.1 (cfs) Min. daily discharge 0.00 (cfs) Total 121 (cfs-days) Total Volume 240 (ac-ft) Balance Hydrologics, Inc. 101 Lucas Valley Rd., Suite 229, San Rafael, CA (415) Balance Hydrologics, Inc. 800 Bancroft Way, Suite 101, Berkeley, CA (510) ; fax: (510) ; Landmark Ck 15data.xls, Dailyform Data preliminary and subject to revision 2010 Balance Hydrologics, Inc.
34 Streamflow commonly changes during the course of a day, thus an instantaneous flow measurement will not exactly match the mean flow for the day. Daily max flow Daily mean flow Flow measured with current meter No flow observed by hydrologist Seasonal peak flow: 23.6 cfs, January 20, 2010 at 8: /1/09 10/29/09 11/26/09 12/24/09 1/21/10 2/18/10 3/18/10 4/15/10 5/13/10 6/10/10 7/8/10 8/5/10 9/2/10 9/30/10 Flow (cfs) On November 16, we installed this station approximately 500 feet upstream of the confluence with Miller Creek and 250 feet downstream of the road crossing in a left bank pool. Figure X. Annual hydrograph for Landmark Creek, water year 2010, Marin County, California. The channel briefly wetted following the first significant early-season October 13th storm. Flows were continuous from January 13th through March 18th, and then from March 31st through April 23rd Landmark Ck 15data.xls, Dailyflow Data preliminary and subject to revision 2010 Balance Hydrologics, Inc.

35 Pre-report interim gaging reuslts Form 4. Annual Hydrologic Record: S3 Tributary Water Year: 2010 Stream: S3 Tributary Station Location / Watershed Descriptors Station: below Lucas Valley Road Approximately 150 feet upstream of the confluence with Miller Creek (right bank) County, State: Marin County, CA Latitude: 38 2'25.55"N, Longitude: '16.66"W (WGS84) Station Location Map Drainage area is 256 acres or 0.40 square miles. Regulation: County open space N Period of Record Gage was installed on 11/16/09 by Balance Hydrologics. Record 11/16/09 through 9/30/10. Gaging sponsored by Skywalker Properties, Ltd. Mean Flows Monthly mean flows are presented below. Seasonal Peak Flows (period of record) Date Time Gage Ht. Discharge Date Time Gage Ht. Discharge (24-hr) (feet) (cfs) (24-hr) (feet) (cfs) 1/20/10 8: Water Year Daily Mean Flow (cubic feet per second) DAY OCT NOV DEC JAN FEB MAR APR MAY JUN JUL AUG SEPT 1 no data no data no data no data no data no data no data no data no data no data no data no data no data no data no data no data no data no data no data no data no data no data no data no data no data no data no data no data no data no data no data no data no data no data no data no data no data no data no data no data no data no data no data no data no data no data MEAN NA NA MAX. DAY NA NA MIN. DAY NA NA cfs days NA NA ac-ft NA NA Monitor's Comments Water Year Summary 1. Multiple stage shifts were applied to the rating equation for local scour or fill. Mean daily discharge 0.42 (cfs) 2. Daily values with more than 2 to 3 significant figures result from calculations. No additional precision is implied. Max. daily discharge 10.5 (cfs) 3. Annual mean, maximum and minimum flows are not presented since this is the first water year in the period of record. Min. daily discharge 0.00 (cfs) Total 125 (cfs-days) Total Volume 247 (ac-ft) Balance Hydrologics, Inc. 101 Lucas Valley Rd., Suite 229, San Rafael, CA (415) Balance Hydrologics, Inc. 800 Bancroft Way, Suite 101, Berkeley, CA (510) ; fax: (510) ; S3 15data.xls, Dailyform Data preliminary and subject to revision 2010 Balance Hydrologics, Inc.
36 Streamflow commonly changes during the course of a day, thus an instantaneous flow measurement will not exactly match the mean flow for the day. Daily max flow Daily mean flow Flow measured with current meter No flow observed by hydrologist Seasonal peak flow: 40.7 cfs, January 20, 2010 at 8: /1/09 10/29/09 11/26/09 12/24/09 1/21/10 2/18/10 3/18/10 4/15/10 5/13/10 6/10/10 7/8/10 8/5/10 9/2/10 9/30/10 Flow (cfs) On November 16, we installed this station approximately 150 feet upstream of the confluence with Miller Creek in a right bank pool. Figure X. Annual hydrograph for S3 tributary, water year 2010, Marin County, California. The channel briefly wetted following the first significant early-season October 13th storm. Flows periodically dried down throughout the wet season S3 15data.xls, Dailyflow Data preliminary and subject to revision 2010 Balance Hydrologics, Inc.

37 Pre-report interim gaging reuslts Form 5. Annual Hydrologic Record: S4 Tributary Water Year: 2010 Stream: S4 Tributary Station Location / Watershed Descriptors Station: below Lucas Valley Road Approximately 225 feet upstream of confluence with Miller Creek (right bank) County, State: Marin County, CA Latitude: 38 2'18.92"N, Longitude: '9.98"W (WGS84) Station Location Map Drainage area is 192 acres or 0.30 square miles. Regulation: County open space N Period of Record Gage was installed on 11/16/09 by Balance Hydrologics. Preliminary record 11/16/09 through 9/30/10. Gaging sponsored by Skywalker Properties, Ltd. Mean Flows Monthly mean flows are presented below. Seasonal Peak Flows (period of record) Date Time Gage Ht. Discharge Date Time Gage Ht. Discharge (24-hr) (feet) (cfs) (24-hr) (feet) (cfs) 1/19/10 6: Water Year Daily Mean Flow (cubic feet per second) DAY OCT NOV DEC JAN FEB MAR APR MAY JUN JUL AUG SEPT 1 no data no data no data no data no data no data no data no data no data no data no data no data no data no data no data no data no data no data no data no data no data no data no data no data no data no data no data no data no data no data no data no data no data no data no data no data no data no data no data no data no data no data no data no data no data no data MEAN NA NA MAX. DAY NA NA MIN. DAY NA NA cfs days NA NA ac-ft NA NA Monitor's Comments Water Year Summary 1. Multiple stage shifts were applied to the rating equation for local scour or fill. Mean daily discharge 0.41 (cfs) 2. Daily values with more than 2 to 3 significant figures result from calculations. No additional precision is implied. Max. daily discharge 8.82 (cfs) 3. Annual mean, maximum and minimum flows are not presented since this is the first water year in the period of record. Min. daily discharge 0.00 (cfs) Total 123 (cfs-days) Total Volume 245 (ac-ft) Balance Hydrologics, Inc. 101 Lucas Valley Rd., Suite 229, San Rafael, CA (415) Balance Hydrologics, Inc. 800 Bancroft Way, Suite 101, Berkeley, CA (510) ; fax: (510) ; S4 15data.xls, Dailyform Data preliminary and subject to revision 2010 Balance Hydrologics, Inc.

38 Streamflow commonly changes during the course of a day, thus an instantaneous flow measurement will not exactly match the mean flow for the day. Daily max flow Daily mean flow Flow measured with current meter No flow observed by hydrologist Seasonal peak flow: 22.6 cfs, January 19, 2010 at 6: /1/09 10/29/09 11/26/09 12/24/09 1/21/10 2/18/10 3/18/10 4/15/10 5/13/10 6/10/10 7/8/10 8/5/10 9/2/10 9/30/10 Flow (cfs) On November 16, we installed this station approximately 225 feet upstream of the confluence with Miller Creek in a right bank pool, just downslope of Lucas Valley Road. Figure X. Annual hydrograph for S4 Tributary, water year 2010, Marin County, California. The channel briefly wetted following the first significant early-season October 13th storm. Flows were sustained from January 12th through May 1st S4 15data.xls, Dailyflow Data preliminary and subject to revision 2010 Balance Hydrologics, Inc.
39 Appendix B Habitat Inventory Graphs and Tables
40 CALIFORNIA SALMONID STREAM HABITAT RESTORATION MANUAL LEVEL IV HABITAT TYPES RIFFLE Low Gradient Riffle (LGR) High Gradient Riffle (HGR) CASCADE Cascade Bedrock Sheet FLATWATER Pocket Water Glide Run Step Run Edgewater MAIN CHANNEL POOL Trench Pool Mid-Channel Pool Channel Confluence Pool Step Pool (CAS) (BRS) (POW) (GLD) (RUN) (SRN) (EDW) (TRP) (MCP) (CCP) (STP) SCOUR POOL Corner Pool (CRP) L. Scour Pool - Log Enhanced (LSL) L. Scour Pool - Root Wad Enhanced (LSR) L. Scour Pool - Bedrock Formed (LSBk) L. Scour Pool - Boulder Formed (LSBo) Plunge Pool (PLP) BACKWATER POOLS Secondary Channel Pool Backwater Pool - Boulder Formed Backwater Pool - Root Wad Formed Backwater Pool - Log Formed Dammed Pool ADDITIONAL UNIT DESIGNATIONS Dry Culvert Not Surveyed Not Surveyed due to a marsh (SCP) (BPB) (BPR) (BPL) (DPL) (DRY) (CUL) (NS) (MAR)
41 Miller Creek Habitat Assessment Data Graphs and Tables
42
43 Table MC1 - Summary of Riffle, Flatwater, and Pool Habitat Types in Miller Creek Habitat Units Fully Habitat Habitat Mean Total Total Mean Mean Mean Mean Estimated Mean Estimated Mean Mean Units Measured Type Occurrence Length (ft.) Length (ft.) Length Width Depth (ft.) Max Area Total Area Volume Total Volume Residual Shelter (%) (%) (ft.) Depth (ft.) (sq.ft.) (sq.ft.) (cu.ft.) (cu.ft.) Pool Vol Rating (cu.ft.) 1 1 CULVERT FLATWATER POOL RIFFLE Total Total Units Total Total Area Total Volume Units Fully Length (ft.) (sq.ft.) (cu.ft.) Meassured Table MC2 - Summary of Pools in Miller Creek Habitat Units Fully Habitat Habitat Mean Total Total Mean Mean Mean Estimated Mean Estimated Mean Units Measured Type Occurrence Length (ft.) Length (ft.) Length Width Residual Area Total Area Residual Total Resid. Shelter (%) (%) (ft.) Depth (ft.) (sq.ft.) (sq.ft.) Pool Vol Vol (cu.ft.) Rating (cu.ft.) 4 4 MAIN SCOUR Total Total Units Total Total Area Total Volume Units Fully Length (ft.) (sq.ft.) (cu.ft.) Meassured
44
45
46 Table MC3 - Summary of Mean Percent Cover By Habitat Type in Miller Creek Habitat Units Fully Habitat Mean % Mean % Mean % LWD Mean % Mean % Mean % Mean % Mean % Mean % Units Measured Type Undercut SWD Root Mass Terr. Aquatic White Water Boulders Bedrock Banks Vegetation Vegetation Ledges 34 7 LGR HGR RUN CCP STP CRP LSL LSR LSBk LSBo PLP Bridge Table MC4 - Mean Percent of Shelter Cover Types For Miller Creek Riffles Flatwater Pools UNDERCUT BANKS (%) SMALL WOODY DEBRIS (%) LARGE WOODY DEBRIS (%) ROOT MASS (%) TERRESTRIAL VEGETATION (%) AQUATIC VEGETATION (%) WHITEWATER (%) BOULDERS (%) BEDROCK LEDGES (%) 0 0 0
47
48 Table MC5 - Summary of Fish Habitat Elements By Stream Reach STREAM REACH: 1 Channel Type: C4 Canopy Density (%): 36.1 Pools by Stream Length (%): 49.6 Reach Length (ft.): 1126 Coniferous Component (%): 0.0 Pool Frequency (%): 46.7 Riffle/Flatwater Mean Width (ft.): 14.7 Hardwood Component (%): Residual Pool Depth (%): BFW: Dominant Bank Vegetation: Grass < 2 Feet Deep: 57.1 Range (ft.): to Vegetative Cover (%): to 2.9 Feet Deep: 28.6 Mean (ft.): Dominant Shelter: Whitewater 3 to 3.9 Feet Deep: 14.3 Std. Dev.: Dominant Bank Substrate Type: Sand/Silt/Clay >= 4 Feet Deep: 0.0 Base Flow (cfs): 0 Occurrence of LWD (%): 0.0 Mean Max Residual Pool Depth (ft.): 1.87 Water (F): Air (F): LWD per 100 ft.: Mean Pool Shelter Rating: 84 Dry Channel (ft.): 0 Riffles: Pools: Flat: Pool Tail Substrate (%): Silt/Clay: 0.0 Sand: 0.0 Gravel: 57.1 Sm Cobble: 28.6 Lg Cobble: 0.0 Boulder: 14.3 Bedrock: 0.0 Embeddedness Values (%): STREAM REACH: 2 Channel Type: E4 Canopy Density (%): 52.0 Pools by Stream Length (%): 49.7 Reach Length (ft.): 1291 Coniferous Component (%): 0.0 Pool Frequency (%): 46.7 Riffle/Flatwater Mean Width (ft.): 14.8 Hardwood Component (%): Residual Pool Depth (%): BFW: Dominant Bank Vegetation: Grass < 2 Feet Deep: 71.4 Range (ft.): to Vegetative Cover (%): to 2.9 Feet Deep: 28.6 Mean (ft.): Dominant Shelter: Whitewater 3 to 3.9 Feet Deep: 0.0 Std. Dev.: Dominant Bank Substrate Type: Sand/Silt/Clay >= 4 Feet Deep: 0.0 Base Flow (cfs): 0 Occurrence of LWD (%): 0.0 Mean Max Residual Pool Depth (ft.): 1.84 Water (F): Air (F): LWD per 100 ft.: Mean Pool Shelter Rating: 33 Dry Channel (ft.): 0 Riffles: Pools: Flat: Pool Tail Substrate (%): Silt/Clay: 0.0 Sand: 0.0 Gravel: Sm Cobble: 0.0 Lg Cobble: 0.0 Boulder: 0.0 Bedrock: 0.0 Embeddedness Values (%): STREAM REACH: 3 Channel Type: B4 Canopy Density (%): 67.8 Pools by Stream Length (%): 56.0 Reach Length (ft.): 2376 Coniferous Component (%): 0.0 Pool Frequency (%): 52.0 Riffle/Flatwater Mean Width (ft.): 9.7 Hardwood Component (%): Residual Pool Depth (%): BFW: Dominant Bank Vegetation: Hardwood Trees < 2 Feet Deep: Range (ft.): to Vegetative Cover (%): to 2.9 Feet Deep: 0.0 Mean (ft.): Dominant Shelter: Whitewater 3 to 3.9 Feet Deep: 0.0 Std. Dev.: Dominant Bank Substrate Type: Sand/Silt/Clay >= 4 Feet Deep: 0.0 Base Flow (cfs): 0 Occurrence of LWD (%): 10.0 Mean Max Residual Pool Depth (ft.): 1.36 Water (F): Air (F): LWD per 100 ft.: Mean Pool Shelter Rating: 102 Dry Channel (ft.): 0 Riffles: 0 Pools: 0 Flat: Pool Tail Substrate (%): Silt/Clay: 0.0 Sand: 0.0 Gravel: 84.6 Sm Cobble: 15.4 Lg Cobble: 0.0 Boulder: 0.0 Bedrock: 0.0 Embeddedness Values (%):
49 Table MC5 cont. - Summary of Fish Habitat Elements By Stream Reach STREAM REACH: 4 Channel Type: A4 Canopy Density (%): 79.9 Pools by Stream Length (%): 40.1 Reach Length (ft.): 3485 Coniferous Component (%): 0.0 Pool Frequency (%): 45.5 Riffle/Flatwater Mean Width (ft.): 9.5 Hardwood Component (%): Residual Pool Depth (%): BFW: Dominant Bank Vegetation: Hardwood Trees < 2 Feet Deep: 88.0 Range (ft.): to Vegetative Cover (%): to 2.9 Feet Deep: 12.0 Mean (ft.): Dominant Shelter: Whitewater 3 to 3.9 Feet Deep: 0.0 Std. Dev.: Dominant Bank Substrate Type: Sand/Silt/Clay >= 4 Feet Deep: 0.0 Base Flow (cfs): 0 Occurrence of LWD (%): 7.2 Mean Max Residual Pool Depth (ft.): 1.37 Water (F): Air (F): LWD per 100 ft.: Mean Pool Shelter Rating: 99 Dry Channel (ft.): 0 Riffles: Pools: Flat: Pool Tail Substrate (%): Silt/Clay: 0.0 Sand: 4.0 Gravel: 48.0 Sm Cobble: 36.0 Lg Cobble: 4.0 Boulder: 8.0 Bedrock: 0.0 Embeddedness Values (%):
50 Grady Creek Habitat Assessment Data Graphs and Tables
51
52 Table GC1 - Summary of Riffle, Flatwater, and Pool Habitat Types in Grady Creek Habitat Units Fully Habitat Habitat Mean Total Total Mean Mean Mean Mean Estimated Mean Estimated Mean Mean Units Measured Type Occurrence Length (ft.) Length (ft.) Length Width Depth (ft.) Max Area Total Area Volume Total Volume Residual Shelter (%) (%) (ft.) Depth (ft.) (sq.ft.) (sq.ft.) (cu.ft.) (cu.ft.) Pool Vol Rating (cu.ft.) POOL RIFFLE Total Total Units Total Total Area Total Volume Units Fully Length (ft.) (sq.ft.) (cu.ft.) Meassured Table GC2 - Summary of Pools in Grady Creek Habitat Units Fully Habitat Habitat Mean Total Total Mean Mean Mean Estimated Mean Estimated Mean Units Measured Type Occurrence Length (ft.) Length (ft.) Length Width Residual Area Total Area Residual Total Resid. Shelter (%) (%) (ft.) Depth (ft.) (sq.ft.) (sq.ft.) Pool Vol Vol (cu.ft.) Rating (cu.ft.) 8 8 MAIN SCOUR Total Total Units Total Total Area Total Volume Units Fully Length (ft.) (sq.ft.) (cu.ft.) Meassured
53
54
55 Table GC3 - Summary of Mean Percent Cover By Habitat Type in Grady Creek Habitat Units Fully Habitat Mean % Mean % Mean % LWD Mean % Mean % Mean % Mean % Mean % Mean % Units Measured Type Undercut SWD Root Mass Terr. Aquatic White Water Boulders Bedrock Banks Vegetation Vegetation Ledges 8 2 LGR HGR CAS BRS MCP CCP STP CRP LSL PLP Table GC4 - Mean Percent of Shelter Cover Types For Entire System in Grady Creek Riffles Flatwater Pools UNDERCUT BANKS (%) 0 3 SMALL WOODY DEBRIS (%) 3 21 LARGE WOODY DEBRIS (%) 3 4 ROOT MASS (%) 1 7 TERRESTRIAL VEGETATION (%) AQUATIC VEGETATION (%) 0 2 WHITEWATER (%) BOULDERS (%) 13 8 BEDROCK LEDGES (%) 0 8 2
56
57 Table GC5 - Fish Habitat Inventory Data Summary for Grady Creek Summary of Fish Habitat Elements By Stream Reach STREAM REACH: 1 Channel Type: C5 Canopy Density (%): 67.6 Pools by Stream Length (%): 15.5 Reach Length (ft.): 1546 Coniferous Component (%): 16.5 Pool Frequency (%): 45.5 Riffle/Flatwater Mean Width (ft.): 6.0 Hardwood Component (%): 83.5 Residual Pool Depth (%): BFW: Dominant Bank Vegetation: Brush < 2 Feet Deep: Range (ft.): to Vegetative Cover (%): to 2.9 Feet Deep: 0.0 Mean (ft.): Dominant Shelter: Whitewater 3 to 3.9 Feet Deep: 0.0 Std. Dev.: Dominant Bank Substrate Type: Sand/Silt/Clay >= 4 Feet Deep: 0.0 Base Flow (cfs): 0 Occurrence of LWD (%): 6.0 Mean Max Residual Pool Depth (ft.): 1.05 Water (F): Air (F): LWD per 100 ft.: Mean Pool Shelter Rating: 72 Dry Channel (ft.): 0 Riffles: Pools: Flat: Pool Tail Substrate (%): Silt/Clay: 0.0 Sand: 0.0 Gravel: 70.0 Sm Cobble: 30.0 Lg Cobble: 0.0 Boulder: 0.0 Bedrock: 0.0 Embeddedness Values (%): STREAM REACH: 2 Channel Type: A4 Canopy Density (%): 90.2 Pools by Stream Length (%): 34.3 Reach Length (ft.): 715 Coniferous Component (%): 0.0 Pool Frequency (%): 46.2 Riffle/Flatwater Mean Width (ft.): 6.3 Hardwood Component (%): Residual Pool Depth (%): BFW: Dominant Bank Vegetation: Hardwood Trees < 2 Feet Deep: 66.7 Range (ft.): to Vegetative Cover (%): to 2.9 Feet Deep: 33.3 Mean (ft.): Dominant Shelter: Whitewater 3 to 3.9 Feet Deep: 0.0 Std. Dev.: Dominant Bank Substrate Type: Bedrock >= 4 Feet Deep: 0.0 Base Flow (cfs): 0 Occurrence of LWD (%): 0.0 Mean Max Residual Pool Depth (ft.): 1.43 Water (F): Air (F): LWD per 100 ft.: Mean Pool Shelter Rating: 83 Dry Channel (ft.): 0 Riffles: Pools: Flat: Pool Tail Substrate (%): Silt/Clay: 0.0 Sand: 0.0 Gravel: 33.3 Sm Cobble: 33.3 Lg Cobble: 0.0 Boulder: 33.3 Bedrock: 0.0 Embeddedness Values (%):
58
59 Landmark Creek Habitat Assessment Data Graphs and Tables
60
61 Table LC1 - Summary of Riffle, Flatwater, and Pool Habitat Types in Landmark Creek Habitat Units Fully Habitat Habitat Mean Total Total Mean Mean Mean Mean Estimated Mean Estimated Mean Mean Units Measured Type Occurrence Length (ft.) Length (ft.) Length Width Depth (ft.) Max Area Total Area Volume Total Volume Residual Shelter (%) (%) (ft.) Depth (ft.) (sq.ft.) (sq.ft.) (cu.ft.) (cu.ft.) Pool Vol Rating (cu.ft.) 8 8 POOL RIFFLE Total Total Units Total Total Area Total Volume Units Fully Length (ft.) (sq.ft.) (cu.ft.) Meassured Table LC2 - Summary of Pools in Landmark Creek Habitat Units Fully Habitat Habitat Mean Total Total Mean Mean Mean Estimated Mean Estimated Mean Units Measured Type Occurrence Length (ft.) Length (ft.) Length Width Residual Area Total Area Residual Total Resid. Shelter (%) (%) (ft.) Depth (ft.) (sq.ft.) (sq.ft.) Pool Vol Vol (cu.ft.) Rating (cu.ft.) 8 8 MAIN Total Total Units Total Total Area Total Volume Units Fully Length (ft.) (sq.ft.) (cu.ft.) Meassured
62
63
64 Table LC3 - Summary of Mean Percent Cover By Habitat Type in Landmark Creek Habitat Units Fully Habitat Mean % Mean % Mean % LWD Mean % Mean % Mean % Mean % Mean % Mean % Units Measured Type Undercut SWD Root Mass Terr. Aquatic White Water Boulders Bedrock Banks Vegetation Vegetation Ledges 8 2 LGR MCP Table LC4 - Mean Percent of Shelter Cover Types For Entire System in Landmark Creek Riffles Flatwater Pools UNDERCUT BANKS (%) 13 8 SMALL WOODY DEBRIS (%) 3 20 LARGE WOODY DEBRIS (%) 0 0 ROOT MASS (%) TERRESTRIAL VEGETATION (%) 0 0 AQUATIC VEGETATION (%) 0 0 WHITEWATER (%) BOULDERS (%) BEDROCK LEDGES (%) 0 0 2
65
66 Table LC5 - Fish Habitat Inventory Data Summary for Landmark Creek Summary of Fish Habitat Elements By Stream Reach STREAM REACH: 1 Channel Type: F5 Canopy Density (%): 90.0 Pools by Stream Length (%): 11.3 Reach Length (ft.): 2095 Coniferous Component (%): 0.0 Pool Frequency (%): 50.0 Riffle/Flatwater Mean Width (ft.): 7.1 Hardwood Component (%): Residual Pool Depth (%): BFW: Dominant Bank Vegetation: Hardwood Trees < 2 Feet Deep: Range (ft.): to Vegetative Cover (%): to 2.9 Feet Deep: 0.0 Mean (ft.): Dominant Shelter: Whitewater 3 to 3.9 Feet Deep: 0.0 Std. Dev.: Dominant Bank Substrate Type: Sand/Silt/Clay >= 4 Feet Deep: 0.0 Base Flow (cfs): 0 Occurrence of LWD (%): 0.0 Mean Max Residual Pool Depth (ft.): 1.17 Water (F): Air (F): LWD per 100 ft.: Mean Pool Shelter Rating: 93 Dry Channel (ft.): 0 Riffles: Pools: Flat: Pool Tail Substrate (%): Silt/Clay: 0.0 Sand: 0.0 Gravel: Sm Cobble: 0.0 Lg Cobble: 0.0 Boulder: 0.0 Bedrock: 0.0 Embeddedness Values (%):
67 Tributary G-2 Habitat Assessment Data Graphs and Tables
68
69 Table G Summary of Riffle, Flatwater, and Pool Habitat Types in G-2 Habitat Units Fully Habitat Habitat Mean Total Total Mean Mean Mean Mean Estimated Mean Estimated Mean Mean Units Measured Type Occurrence Length (ft.) Length (ft.) Length Width Depth (ft.) Max Area Total Area Volume Total Volume Residual Shelter (%) (%) (ft.) Depth (ft.) (sq.ft.) (sq.ft.) (cu.ft.) (cu.ft.) Pool Vol Rating (cu.ft.) 1 1 CULVERT FLATWATER POOL RIFFLE Total Total Units Total Total Area Total Volume Units Fully Length (ft.) (sq.ft.) (cu.ft.) Meassured Table G Summary of Pools in G-2 Habitat Units Fully Habitat Habitat Mean Total Total Mean Mean Mean Estimated Mean Estimated Mean Units Measured Type Occurrence Length (ft.) Length (ft.) Length Width Residual Area Total Area Residual Total Resid. Shelter (%) (%) (ft.) Depth (ft.) (sq.ft.) (sq.ft.) Pool Vol Vol (cu.ft.) Rating (cu.ft.) 2 2 MAIN Total Total Units Total Total Area Total Volume Units Fully Length (ft.) (sq.ft.) (cu.ft.) Meassured
70
71
72 Table G Summary of Mean Percent Cover By Habitat Type in G-2 Habitat Units Fully Habitat Mean % Mean % Mean % LWD Mean % Mean % Mean % Mean % Mean % Mean % Units Measured Type Undercut SWD Root Mass Terr. Aquatic White Water Boulders Bedrock Banks Vegetation Vegetation Ledges 6 2 LGR RUN MCP CUL Table G Mean Percent of Shelter Cover Types For Entire System in G-2 Riffles Flatwater Pools UNDERCUT BANKS (%) SMALL WOODY DEBRIS (%) LARGE WOODY DEBRIS (%) ROOT MASS (%) TERRESTRIAL VEGETATION (%) AQUATIC VEGETATION (%) WHITEWATER (%) BOULDERS (%) BEDROCK LEDGES (%)
73
74 Table G Fish Habitat Inventory Data Summary for G-2 Summary of Fish Habitat Elements By Stream Reach STREAM REACH: 1 Channel Type: F5 Canopy Density (%): 46.0 Pools by Stream Length (%): 2.4 Reach Length (ft.): 845 Coniferous Component (%): 6.0 Pool Frequency (%): 16.7 Riffle/Flatwater Mean Width (ft.): 3.2 Hardwood Component (%): 94.0 Residual Pool Depth (%): BFW: Dominant Bank Vegetation: Grass < 2 Feet Deep: Range (ft.): to Vegetative Cover (%): to 2.9 Feet Deep: 0.0 Mean (ft.): Dominant Shelter: Terrestrial Veg. 3 to 3.9 Feet Deep: 0.0 Std. Dev.: Dominant Bank Substrate Type: Sand/Silt/Clay >= 4 Feet Deep: 0.0 Base Flow (cfs): 0 Occurrence of LWD (%): 0.0 Mean Max Residual Pool Depth (ft.): 0.9 Water (F): Air (F): LWD per 100 ft.: Mean Pool Shelter Rating: 15 Dry Channel (ft.): 0 Riffles: Pools: Flat: Pool Tail Substrate (%): Silt/Clay: 0.0 Sand: 0.0 Gravel: Sm Cobble: 0.0 Lg Cobble: 0.0 Boulder: 0.0 Bedrock: 0.0 Embeddedness Values (%):
75 Tributary S-3 Habitat Assessment Data Graphs and Tables
76
77 Table S Summary of Riffle, Flatwater, and Pool Habitat Types in S-3 Habitat Units Fully Habitat Habitat Mean Total Total Mean Mean Mean Mean Estimated Mean Estimated Mean Mean Units Measured Type Occurrence Length (ft.) Length (ft.) Length Width Depth (ft.) Max Area Total Area Volume Total Volume Residual Shelter (%) (%) (ft.) Depth (ft.) (sq.ft.) (sq.ft.) (cu.ft.) (cu.ft.) Pool Vol Rating (cu.ft.) 1 1 FLATWATER POOL RIFFLE Total Total Units Total Total Area Total Volume Units Fully Length (ft.) (sq.ft.) (cu.ft.) Meassured Table S Summary of Pools in S-3 Habitat Units Fully Habitat Habitat Mean Total Total Mean Mean Mean Estimated Mean Estimated Mean Units Measured Type Occurrence Length (ft.) Length (ft.) Length Width Residual Area Total Area Residual Total Resid. Shelter (%) (%) (ft.) Depth (ft.) (sq.ft.) (sq.ft.) Pool Vol Vol (cu.ft.) Rating (cu.ft.) 2 2 MAIN SCOUR Total Total Units Total Total Area Total Volume Units Fully Length (ft.) (sq.ft.) (cu.ft.) Meassured
78
79
80 Table S Summary of Mean Percent Cover By Habitat Type in S-3 Habitat Units Fully Habitat Mean % Mean % Mean % LWD Mean % Mean % Mean % Mean % Mean % Mean % Units Measured Type Undercut SWD Root Mass Terr. Aquatic White Water Boulders Bedrock Banks Vegetation Vegetation Ledges 5 1 LGR HGR RUN MCP CCP LSL LSBo Table S Mean Percent of Shelter Cover Types For Entire System in S-3 Riffles Flatwater Pools UNDERCUT BANKS (%) SMALL WOODY DEBRIS (%) LARGE WOODY DEBRIS (%) ROOT MASS (%) TERRESTRIAL VEGETATION (%) AQUATIC VEGETATION (%) WHITEWATER (%) BOULDERS (%) BEDROCK LEDGES (%)
81
82 Table S Fish Habitat Inventory Data Summary for S-3 Summary of Fish Habitat Elements By Stream Reach STREAM REACH: 1 Channel Type: C3 Canopy Density (%): 90.7 Pools by Stream Length (%): 12.3 Reach Length (ft.): 975 Coniferous Component (%): 0.0 Pool Frequency (%): 46.2 Riffle/Flatwater Mean Width (ft.): 6.9 Hardwood Component (%): Residual Pool Depth (%): BFW: Dominant Bank Vegetation: Hardwood Trees < 2 Feet Deep: Range (ft.): to Vegetative Cover (%): to 2.9 Feet Deep: 0.0 Mean (ft.): Dominant Shelter: Terrestrial Veg. 3 to 3.9 Feet Deep: 0.0 Std. Dev.: Dominant Bank Substrate Type: Cobble/Gravel >= 4 Feet Deep: 0.0 Base Flow (cfs): 0 Occurrence of LWD (%): 6.4 Mean Max Residual Pool Depth (ft.): 1.15 Water (F): Air (F): LWD per 100 ft.: Mean Pool Shelter Rating: 64 Dry Channel (ft.): 0 Riffles: Pools: Flat: Pool Tail Substrate (%): Silt/Clay: 0.0 Sand: 0.0 Gravel: Sm Cobble: 0.0 Lg Cobble: 0.0 Boulder: 0.0 Bedrock: 0.0 Embeddedness Values (%):
83 Tributary S-4 Habitat Assessment Data Graphs and Tables
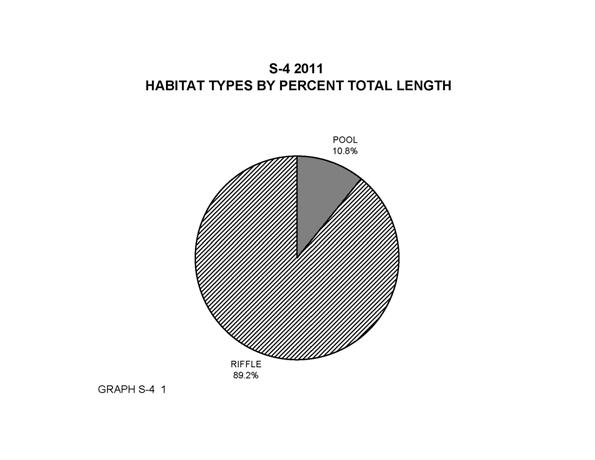
84
85 Table S Summary of Riffle, Flatwater, and Pool Habitat Types in S-4 Habitat Units Fully Habitat Habitat Mean Total Total Mean Mean Mean Mean Estimated Mean Estimated Mean Mean Units Measured Type Occurrence Length (ft.) Length (ft.) Length Width Depth (ft.) Max Area Total Area Volume Total Volume Residual Shelter (%) (%) (ft.) Depth (ft.) (sq.ft.) (sq.ft.) (cu.ft.) (cu.ft.) Pool Vol Rating (cu.ft.) 3 3 POOL RIFFLE Total Total Units Total Total Area Total Volume Units Fully Length (ft.) (sq.ft.) (cu.ft.) Meassured Table S Summary of Pools in S-4 Habitat Units Fully Habitat Habitat Mean Total Total Mean Mean Mean Estimated Mean Estimated Mean Units Measured Type Occurrence Length (ft.) Length (ft.) Length Width Residual Area Total Area Residual Total Resid. Shelter (%) (%) (ft.) Depth (ft.) (sq.ft.) (sq.ft.) Pool Vol Vol (cu.ft.) Rating (cu.ft.) 3 3 SCOUR Total Total Units Total Total Area Total Volume Units Fully Length (ft.) (sq.ft.) (cu.ft.) Meassured
86
87
88 Table S Summary of Mean Percent Cover By Habitat Type in S-4 Habitat Units Fully Habitat Mean % Mean % Mean % LWD Mean % Mean % Mean % Mean % Mean % Mean % Units Measured Type Undercut SWD Root Mass Terr. Aquatic White Water Boulders Bedrock Banks Vegetation Vegetation Ledges 4 1 LGR CAS CRP LSBo Table S Mean Percent of Shelter Cover Types For Entire System in S-4 Riffles Flatwater Pools UNDERCUT BANKS (%) 0 0 SMALL WOODY DEBRIS (%) 0 0 LARGE WOODY DEBRIS (%) 0 0 ROOT MASS (%) 0 25 TERRESTRIAL VEGETATION (%) AQUATIC VEGETATION (%) 0 5 WHITEWATER (%) BOULDERS (%) BEDROCK LEDGES (%) 0 0 2
89
90 Table S Fish Habitat Inventory Data Summary for S-4 Summary of Fish Habitat Elements By Stream Reach STREAM REACH: 1 Channel Type: C3 Canopy Density (%): 43.0 Pools by Stream Length (%): 10.8 Reach Length (ft.): 629 Coniferous Component (%): 0.0 Pool Frequency (%): 37.5 Riffle/Flatwater Mean Width (ft.): 6.3 Hardwood Component (%): Residual Pool Depth (%): BFW: Dominant Bank Vegetation: Coniferous Trees < 2 Feet Deep: 66.7 Range (ft.): to Vegetative Cover (%): to 2.9 Feet Deep: 33.3 Mean (ft.): Dominant Shelter: Whitewater 3 to 3.9 Feet Deep: 0.0 Std. Dev.: Dominant Bank Substrate Type: Sand/Silt/Clay >= 4 Feet Deep: 0.0 Base Flow (cfs): 0 Occurrence of LWD (%): 0.0 Mean Max Residual Pool Depth (ft.): 1.6 Water (F): Air (F): LWD per 100 ft.: Mean Pool Shelter Rating: 45 Dry Channel (ft.): 0 Riffles: Pools: Flat: Pool Tail Substrate (%): Silt/Clay: 0.0 Sand: 0.0 Gravel: 66.7 Sm Cobble: 0.0 Lg Cobble: 0.0 Boulder: 33.3 Bedrock: 0.0 Embeddedness Values (%):
91 Tributary N-1 Habitat Assessment Data Graphs and Tables
92
93 Table N Summary of Riffle, Flatwater, and Pool Habitat Types in N-1 Habitat Units Fully Habitat Habitat Mean Total Total Mean Mean Mean Mean Estimated Mean Estimated Mean Mean Units Measured Type Occurrence Length (ft.) Length (ft.) Length Width Depth (ft.) Max Area Total Area Volume Total Volume Residual Shelter (%) (%) (ft.) Depth (ft.) (sq.ft.) (sq.ft.) (cu.ft.) (cu.ft.) Pool Vol Rating (cu.ft.) POOL RIFFLE Total Total Units Total Total Area Total Volume Units Fully Length (ft.) (sq.ft.) (cu.ft.) Meassured Table N Summary of Pools in N-1 Habitat Units Fully Habitat Habitat Mean Total Total Mean Mean Mean Estimated Mean Estimated Mean Units Measured Type Occurrence Length (ft.) Length (ft.) Length Width Residual Area Total Area Residual Total Resid. Shelter (%) (%) (ft.) Depth (ft.) (sq.ft.) (sq.ft.) Pool Vol Vol (cu.ft.) Rating (cu.ft.) MAIN Total Total Units Total Total Area Total Volume Units Fully Length (ft.) (sq.ft.) (cu.ft.) Meassured
94
95
96 Table N Summary of Mean Percent Cover By Habitat Type in N-1 Habitat Units Fully Habitat Mean % Mean % Mean % LWD Mean % Mean % Mean % Mean % Mean % Mean % Units Measured Type Undercut SWD Root Mass Terr. Aquatic White Water Boulders Bedrock Banks Vegetation Vegetation Ledges 10 2 LGR MCP Table N Mean Percent of Shelter Cover Types For Entire System in N-1 Riffles Flatwater Pools UNDERCUT BANKS (%) 0 5 SMALL WOODY DEBRIS (%) 0 4 LARGE WOODY DEBRIS (%) 0 0 ROOT MASS (%) 0 14 TERRESTRIAL VEGETATION (%) 0 14 AQUATIC VEGETATION (%) 0 3 WHITEWATER (%) BOULDERS (%) BEDROCK LEDGES (%) 0 0 2
97
98 Table N Fish Habitat Inventory Data Summary for N-1 Summary of Fish Habitat Elements By Stream Reach STREAM REACH: 1 Channel Type: A4 Canopy Density (%): 79.8 Pools by Stream Length (%): 27.6 Reach Length (ft.): 1237 Coniferous Component (%): 0.0 Pool Frequency (%): 50.0 Riffle/Flatwater Mean Width (ft.): 7.5 Hardwood Component (%): Residual Pool Depth (%): BFW: Dominant Bank Vegetation: Grass < 2 Feet Deep: Range (ft.): to Vegetative Cover (%): to 2.9 Feet Deep: 0.0 Mean (ft.): Dominant Shelter: Whitewater 3 to 3.9 Feet Deep: 0.0 Std. Dev.: Dominant Bank Substrate Type: Boulder >= 4 Feet Deep: 0.0 Base Flow (cfs): 0 Occurrence of LWD (%): 0.0 Mean Max Residual Pool Depth (ft.): 1.33 Water (F): Air (F): LWD per 100 ft.: Mean Pool Shelter Rating: 111 Dry Channel (ft.): 0 Riffles: Pools: Flat: Pool Tail Substrate (%): Silt/Clay: 0.0 Sand: 0.0 Gravel: 20.0 Sm Cobble: 60.0 Lg Cobble: 0.0 Boulder: 10.0 Bedrock: 10.0 Embeddedness Values (%):
99 Appendix C Fish Passage Barriers


100 Barriers to Salmonid Migration in the Upper Miller Creek System Site: FPB_Miller1 Description Bridge crossing Miller Creek; forms two concrete culverts. Approximately 20 feet wide and 20 feet long. Large concrete apron run-out with several pieces of concrete broken off. Forms an approximately eight foot vertical wall. Jump pool max depth approximately two feet. Approach vector is off, and several large pieces of concrete/boulder obscure jump approach. Barrier forms total upstream fish passage barrier for all Salmonid life stages. Photos Passage Issues - Jump height - Lack of depth in jump pool - Velocity barrier over concrete - Low flow/depth barrier over concrete Miller Bridge, downstream view Miller Bridge, view from upstream View of concrete apron 1
101 Site: FPB_Miller2 Description Natural barrier of boulder and debris field formed along a gradient that exceed 20 percent in the upper reaches of Miller Creek. Large boulder field forms two tiers of barriers; each lack sufficient depth in the downstream jump pool, and have large boulders obscuring a direct line from the jump pool to the top of barrier. Gradient exceeds 20 percent. Barrier forms total upstream fish passage barrier for all Salmonid life stages. Photos Passage Issues - Jump height - Gradient exceeds 20 percent - Lack of depth in jump pool - Boulders obscure jump approach View of boulder and debris field from downstream Close-up of boulders forming the barrier 2


102 Site: FPB_Grady Description Natural barrier formed by a narrow canyon, bedrock chute, and waterfall. Waterfall height is approximately seven feet, and downstream jump pool max depth is approximately 1.4 feet. Gradient within this section of creek exceeds 20 percent. Barrier forms total upstream fish passage barrier for all Salmonid life stages. Photos Passage Issues - Jump height - Waterfall and bedrock shoot - Gradient exceeds 20 percent - Lack of depth in jump pool View of waterfall and bedrock chute View of jump pool from top of barrier 3


103 Site: FPB_N-1 Description Natural barrier formed by a narrow canyon, waterfall with a boulder field run-out. Jump height is approximately five feet, and max depth in the downstream jump pool is 0.6 feet. Water from waterfall lands on a boulder field that prevents direct access from the jump pool to the top of the barrier. Barrier forms total upstream fish passage barrier for all Salmonid life stages. Photos Passage Issues - Jump height - Boulders block approach from jump pool - Lack of depth in jump pool View of boulders from downstream of barrier View of boulder and jump pool from top of barrier 4


104 Site: FPB_S-2 Description Perched culvert beneath Lucas Valley Road. Diameter of the smooth concrete culvert is approximately three feet, and the length is 70 feet. Jump height to the outlet of the culvert is 5.5 feet, and the max depth in the downstream jump pool is 1.4 feet. Culvert outlet shrouded by poison oak. This perched culvert currently is a total barrier to upstream movement of all Salmonid life stages. The length, diameter, and smooth surface forms a passage barrier as well. Photos Passage Issues - Perched culvert - Jump height - Lack of depth in jump pool - Velocity barrier over concrete - Low flow/depth barrier over concrete - Length barrier - Possible undersized culvert Inlet (up stream) to culvert Inside smooth concrete culvert Down stream jump pool, perched culvert not visible 5
 corrugations in the paneling.")


105 Site: FPB_S-3 Description Plastic corrugated culvert beneath Lucas Valley Road. A four foot diameter culvert with very small (close together) corrugations in the paneling. Culvert length is approximately 80 feet, and there are two small jogs (minor changes in direction) in the culvert. The outlet is perched approximately 0.3 feet and there is a concrete run-out. Culvert inlet is at grade. The culvert appears to be a barrier for upstream movement of juvenile Salmonids under all flow conditions, and adult Salmonids under most flow conditions. Downstream movement would not be impeded by this culvert. Photos Passage Issues - Rip-rap run-out - Velocity barrier - Length barrier - Low flow/depth barrier Inlet (up stream) to culvert Outlet view, water lands on concrete run-out before going into a low gradient riffle 6

.")


106 Site: FPB_S-4 Description Concrete cast-in-place culvert beneath Lucas Valley Road. Diameter of the smooth concrete culvert is approximately three feet, and the length is 50 feet. The outlet is perched approximately 0.7 feet, with a concrete run-out, and a long low gradient riffle leads up to culvert outlet (no jump pool). Inlet is at grade; however the inlet is out of alignment by approximately 30 angled from the channel direction. About 50 feet upstream of the culvert inlet a fence/trash wrack has collected debris that may impede fish mobility. The culvert appears to be a barrier for upstream movement of juvenile Salmonids under all flow conditions, and adult Salmonids under most flow conditions. Downstream movement would not be impeded by this culvert. Photos Passage Issues - Velocity barrier - Length barrier - Low flow/depth barrier - Concrete run-out - No jump pool - Possible undersized culvert Inlet (Up stream) to culvert Outlet, water land on concrete run-out Inside smooth concrete culvert Trash wrack/fence upstream of culvert 7
DETAILED DESCRIPTION OF STREAM CONDITIONS AND HABITAT TYPES IN REACH 4, REACH 5 AND REACH 6.
 DETAILED DESCRIPTION OF STREAM CONDITIONS AND HABITAT TYPES IN REACH 4, REACH 5 AND REACH 6. The Eklutna River was divided into study reaches (figure 1) prior to this site visit. Prominent geologic or
Appendix G. Meso-Habitat Surveys. DRAFT Annual Technical Report
 Appendix G Meso-Habitat Surveys DRAFT Annual Technical Report Draft March 2010 1.0 Introduction 1 2 3 4 5 6 1.0 Introduction The following appendix includes a report provided by the California Department
Riparian Assessment. Steps in the right direction... Drainage Basin/Watershed: Start by Thinking Big. Riparian Assessment vs.
 Riparian Assessment vs. Monitoring Riparian Assessment What is a healthy stream? Determine stream/riparian health Determine change or trend, especially in response to mgmt Classification = designation
STREAM INVENTORY REPORT PENNINGTON CREEK
 STREAM INVENTORY REPORT PENNINGTON CREEK INTRODUCTION A stream inventory was conducted during the summer of 2001 on Pennington Creek. The survey began at the confluence with Chorro Creek and extended up
MORRO BAY WATERSHED STEELHEAD RESTORATION PLANNING PROJECT
 MORRO BAY WATERSHED STEELHEAD RESTORATION PLANNING PROJECT STREAM INVENTORY REPORT DAIRY CREEK, 2001 Prepared to: Coastal San Luis Resource Conservation District MORRO BAY WATERSHED STEELHEAD RESTORATION
Conceptual Model of Stream Flow Processes for the Russian River Watershed. Chris Farrar
 Conceptual Model of Stream Flow Processes for the Russian River Watershed Chris Farrar Several features of creeks affect the interactions between surface and groundwater. This conceptual model uses the
ODFW AQUATIC INVENTORY PROJECT OREGON PLAN FOR SALMON & WATERSHEDS STREAM RESTORATION HABITAT REPORT
 ODFW AQUATIC INVENTORY PROJECT OREGON PLAN FOR SALMON & WATERSHEDS STREAM RESTORATION HABITAT REPORT STREAM: BASIN: SURVEY TYPE: Munson Creek (NC-342) Tillamook River Post-Tx DATE: February 2, 28 SURVEY
Rosgen Classification Unnamed Creek South of Dunka Road
 Rosgen Classification Unnamed Creek South of Dunka Road Prepared for Poly Met Mining Inc. September 2013 Rosgen Classification Unnamed Creek South of Dunka Road Prepared for Poly Met Mining Inc. September
PolyMet NorthMet Project
 RS 26 Draft-01 December 8, 2005 RS26 Partridge River Level 1 Rosgen Geomorphic Survey Rosgen Classification Partridge River from Headwaters to Colby Lake Prepared for PolyMet NorthMet Project December
Little Blackfoot TPA 2009 Sediment and Habitat Assessment QAQC Review March 9, 2010
 Little Blackfoot TPA 2009 Sediment and Habitat Assessment QAQC Review March 9, 2010 1.0 PROJECT OVERVIEW Sediment and habitat monitoring in the Little Blackfoot TPA was conducted in July of 2009 as outlined
APPENDIX E. GEOMORPHOLOGICAL MONTORING REPORT Prepared by Steve Vrooman, Keystone Restoration Ecology September 2013
 APPENDIX E GEOMORPHOLOGICAL MONTORING REPORT Prepared by Steve Vrooman, Keystone Restoration Ecology September 2 Introduction Keystone Restoration Ecology (KRE) conducted geomorphological monitoring in
Stream Classification
 Stream Classification Why Classify Streams? Communication Tool Describe Existing Conditions & Trends Describe Restoration Goals Research Tool Morphologic Stream Classification Systems Schumm (1977) Alluvial
ADDRESSING GEOMORPHIC AND HYDRAULIC CONTROLS IN OFF-CHANNEL HABITAT DESIGN
 ADDRESSING GEOMORPHIC AND HYDRAULIC CONTROLS IN OFF-CHANNEL HABITAT DESIGN Conor Shea - Hydrologist U.S. Fish and Wildlife Service Conservation Partnerships Program Arcata, CA Learning Objectives Examine
Case Study 2: Twenty-mile Creek Rock Fords
 Case Study : Twenty-mile Creek Rock Fords Location Crossing Description Washington. Okanagan National Forest. Methow Valley Ranger District. Chewuch river basin, East Chewuch Road. The Twenty-mile Creek
Why Geomorphology for Fish Passage
 Channel Morphology - Stream Crossing Interactions An Overview Michael Love Michael Love & Associates mlove@h2odesigns.com (707) 476-8938 Why Geomorphology for Fish Passage 1. Understand the Scale of the
Aquifer an underground zone or layer of sand, gravel, or porous rock that is saturated with water.
 Aggradation raising of the streambed by deposition that occurs when the energy of the water flowing through a stream reach is insufficient to transport sediment conveyed from upstream. Alluvium a general
CASE STUDIES. Introduction
 Introduction The City of Winston-Salem faces the challenge of maintaining public infrastructure (e.g., water and sewer lines, storm drains, roads, culverts and bridges) while minimizing the potential impacts
Fish Passage at Road Crossings
 Fish Passage at Road Crossings 1 Crossing Design Workshop Outline 1:00 to 2:00 Intro, Design Overview, Channel Width 2:00 to 2:15 Break 2:15 to 3:15 No-Slope, Stream Simulation Design 3:15 to 3:30 Break
ODFW AQUATIC INVENTORY PROJECT RESTORATION MONITORING STREAM HABITAT REPORT. Peggy Kavanagh, Trevan Cornwell TOLEDO SOUTH Coast Range Lora Tennant
 ODFW AQUATIC INVENTORY PROJECT RESTORATION MONITORING STREAM HABITAT REPORT STREAM: GCG: 2-MC SITE ID: 489 BASIN: YAQUINA TREATMENT DATE: 24 SURVEY DATE: 2/27/24 SURVEY CREW: USGS MAPS: ECOREGION: REPORT
Appendix E Rosgen Classification
 Appendix E Stream Type s Using the morphometric parameters described above, stream reaches are classified into 7 major stream types (Aa+ through G) based on s (1996) criteria. The relevant stream classifications
APPENDIX A REACH DECRIPTIONS. Quantico Creek Watershed Assessment April 2011
 APPENDIX A REACH DECRIPTIONS Basin 615, South Fork of Quantico Creek - Project Reach Descriptions Reach Name: 615-A Coordinates (NAD 83, Virginia State Plane North): 11796510.57, 6893938.95 to 11801555.79,
A Guide To Interpreting Stream Survey Reports. Scott C. Foster Charles H. Stein Kim K. Jones. Edited by Patricia A. Bowers
 A Guide To Interpreting Stream Survey Reports Scott C. Foster Charles H. Stein Kim K. Jones Edited by Patricia A. Bowers Aquatic Inventories Project Natural Production Program Oregon Department of Fish
Rapid Geomorphic Assessments: RGA s
 Establishing Current Reference Conditions Rates and concentrations of suspended-sediment transport vary over time and space due to factors such as precipitation characteristics and discharge, geology,
ODFW AQUATIC INVENTORY PROJECT STREAM REPORT
 ODFW AQUATIC INVENTORY PROJECT STREAM REPORT STREAM: BASIN: Basin Creek Willow Creek DATE: July 9 3, 9 SURVEY CREW: REPORT PREPARED BY: USGS MAPS: ECOREGION: Nicole Bushey / Emily Zimmermann Staci Stein
Lower South Fork McKenzie River Floodplain Enhancement Project
 Lower South Fork McKenzie River Floodplain Enhancement Project McKenzie River Ranger District Willamette National Forest Project Location The project is located in the South Fork McKenzie River Watershed,
ODFW AQUATIC INVENTORY PROJECT OREGON PLAN FOR SALMON & WATERSHEDS STREAM RESTORATION HABITAT REPORT
 ODFW AQUATIC INVENTORY PROJECT OREGON PLAN FOR SALMON & WATERSHEDS STREAM RESTORATION HABITAT REPORT STREAM: BASIN: SURVEY TYPE: South Sister Creek (U-5) Smith River Pre-Tx DATE: January 7, 4 SURVEY CREW:
Habitat Assessment. Peggy Compton UW-Extension Water Action Volunteers Program Coordinator
 Habitat Assessment Peggy Compton UW-Extension Water Action Volunteers Program Coordinator Adapted from a presentation by Jean Unmuth, Water Quality Biologist, WI DNR dnr.wi.gov www.uwex.edu erc.cals.wisc.edu
GENERAL SUMMARY BIG WOOD RIVER GEOMORPHIC ASSESSMENT BLAINE COUNTY, IDAHO
 GENERAL SUMMARY BIG WOOD RIVER GEOMORPHIC ASSESSMENT BLAINE COUNTY, IDAHO Prepared For Trout Unlimited 300 North Main Street, Hailey, Idaho, 83333 Prepared By P. O. Box 8578, 140 E. Broadway, Suite 23,
CR AAO Bridge. Dead River Flood & Natural Channel Design. Mitch Koetje Water Resources Division UP District
 CR AAO Bridge Dead River Flood & Natural Channel Design Mitch Koetje Water Resources Division UP District Old County Road AAO Bridge Map courtesy of Marquette County Silver Lake Basin McClure Basin
Implementing a Project with 319 Funds: The Spring Brook Meander Project. Leslie A. Berns
 Implementing a Project with 319 Funds: The Spring Brook Meander Project Leslie A. Berns "...to acquire... and hold lands... for the purpose of protecting and preserving the flora, fauna and scenic beauties...
Gully Erosion Part 1 GULLY EROSION AND ITS CAUSES. Introduction. The mechanics of gully erosion
 Gully Erosion Part 1 GULLY EROSION AND ITS CAUSES Gully erosion A complex of processes whereby the removal of soil is characterised by incised channels in the landscape. NSW Soil Conservation Service,
PENNSYLVANIA DEPARTMENT OF TRANSPORTATION ENGINEERING DISTRICT 3-0
 PENNSYLVANIA DEPARTMENT OF TRANSPORTATION ENGINEERING DISTRICT 3-0 LYCOMING COUNTY S.R.15, SECTION C41 FINAL HYDROLOGIC AND HYDRAULIC REPORT STEAM VALLEY RUN STREAM RELOCATION DATE: June, 2006 REVISED:
REACH 1 T37S-R14W-S07NW
 OREGON DEPT. FISH AND WILDLIFE HABITAT INVENTORY Report Date: 3//3 Survey Date: 7/3/ REACH T37S-R4W-S7NW REACH Valley and Channel Summary Narrow Valley Floor Steep V-shape Moderate V-shape Open V-shape
ODFW AQUATIC INVENTORY PROJECT STREAM REPORT
 ODFW AQUATIC INVENTORY PROJECT STREAM REPORT STREAM: BASIN: South Fork Mill Creek Mill Creek / Columbia River DATES: September 7 9, 5 SURVEY CREW: REPORT PREPARED BY: Brian Bangs / LaNoah Babcock Staci
Assessment. Assessment
 2001 SPRINGBROOK CREEK RESTORATION - THREE YEAR POST-CONSTRUCTION REVIEW - Presented by Bruce Henderson and Andy Harris 2005 River Restoration Northwest Symposium Skamania Lodge, Washington www.hendersonlandservices.com
TSEGI WASH 50% DESIGN REPORT
 TSEGI WASH 50% DESIGN REPORT 2/28/2014 Daniel Larson, Leticia Delgado, Jessica Carnes I Table of Contents Acknowledgements... IV 1.0 Project Description... 1 1.1 Purpose... 1 Figure 1. Erosion of a Headcut...
Technical Memorandum. To: From: Copies: Date: 10/19/2017. Subject: Project No.: Greg Laird, Courtney Moore. Kevin Pilgrim and Travis Stroth
 Technical Memorandum To: From: Greg Laird, Courtney Moore Kevin Pilgrim and Travis Stroth 5777 Central Avenue Suite 228 Boulder, CO 80301 www.otak.com Copies: [Electronic submittal] Date: 10/19/2017 Subject:
Natural Shoreline Landscapes on Michigan Inland Lakes
 Natural Shoreline Landscapes on Michigan Inland Lakes Excerpts from Chapters 2 and 3 Photo Photo by Jane by Jane Herbert Herbert Did you know? Twenty-four species of amphibians, 25 species of reptiles,
Tom Ballestero University of New Hampshire. 1 May 2013
 Tom Ballestero University of New Hampshire 1 May 2013 1 Hydrology 2 Basic Hydrology Low flows most common Flows that fill the stream to the banks and higher are much less common Filling the stream to the
Fluvial Driven Alluvial Fans
 Fluvial Driven Alluvial Fans Restoration Project Evaluations - Examples from the Russian and Napa River Watersheds Mia Docto Masters Thesis UC Berkeley 1. Basic Fan Description 2. Fluvial Driven Fan Characteristics
May 7, Roger Leventhal, P.E. Marin County Public Works Laurel Collins Watershed Sciences
 May 7, 2013 Roger Leventhal, P.E. Marin County Public Works Laurel Collins Watershed Sciences Background Funded in 2009 under EPA 2100 Grant for $30k and managed by SFEP Project Goals: Update original
SECTION G SEDIMENT BUDGET
 SECTION G SEDIMENT BUDGET INTRODUCTION A sediment budget has been constructed for the for the time period 1952-2000. The purpose of the sediment budget is to determine the relative importance of different
Mobrand to Jones and Stokes. Sustainable Fisheries Management Use of EDT
 Sustainable Fisheries Management Use of EDT Ecosystem Diagnosis and Treatment EDT EDT designed to provide a practical, science-based approach for developing and implementing watershed plans. Provides decision
Case Study 14. Rocky Creek Vented Box Culvert Ford
 Case Study. Rocky Creek Vented Box Culvert Ford Location West Central Arkansas. Ouachita National Forest; Oden Ranger District. Rocky Creek crossing on Forest Road 887 (Muddy Gibbs Road). Crossing Description
Black Gore Creek 2013 Sediment Source Monitoring and TMDL Sediment Budget
 Black Gore Creek 2013 Sediment Source Monitoring and TMDL Sediment Budget Prepared for: Prepared By: - I. Introduction The Black Gore Creek Total Maximum Daily Load (TMDL) was developed in collaboration
Assignment 1. Measuring River Characteristics- Vernon Creek. Applied Fluvial Geomorphology Field Techniques EESc 435
 Assignment 1 Measuring River Characteristics- Vernon Creek Applied Fluvial Geomorphology Field Techniques EESc 435 Amanda Jardine 30100093 Jaime McDonald 14177083 Erica Massey 50870088 April 28, 2012 Introduction
Business. Meteorologic monitoring. Field trip? Reader. Other?
 Business Meteorologic monitoring Field trip? Reader Other? Classification Streams Characterization Discharge measurements Why classify stream channels? Why Classify Stream Channels? Provides a common language
Stream Geomorphology. Leslie A. Morrissey UVM July 25, 2012
 Stream Geomorphology Leslie A. Morrissey UVM July 25, 2012 What Functions do Healthy Streams Provide? Flood mitigation Water supply Water quality Sediment storage and transport Habitat Recreation Transportation
BZ471, Steam Biology & Ecology Exam
 BZ471, Eam1, p.1 BZ471, Steam Biology & Ecology Eam Name Multiple choice When benthic organisms enter the water column with a regular diel periodicity: a) catastrophic drift b) behavioral drift c) constant
APPENDIX 4B FOOTHILL YELLOW-LEGGED FROG SURVEY DATASHEETS AND STANDARD OPERATING PROCEDURES (BASED ON SELTENRICH AND POOL,
 APPENDIX 4B FOOTHILL YELLOW-LEGGED FROG SURVEY DATASHEETS AND STANDARD OPERATING PROCEDURES (BASED ON SELTENRICH AND POOL, 2002) February 2004 PacifiCorp Foothill Yellow-Legged Frog Klamath River Visual
Why Stabilizing the Stream As-Is is Not Enough
 Why Stabilizing the Stream As-Is is Not Enough Several examples of alternatives to the County s design approach have been suggested. A common theme of these proposals is a less comprehensive effort focusing
Addressing the Impact of Road-Stream Crossing Structures on the Movement of Aquatic Organisms
 Scott Jackson University of Massachusetts Amherst Addressing the Impact of Road-Stream Crossing Structures on the Movement of Aquatic Organisms Dams Sub-standard Culverts Excessive Velocities Inlet Drop
Upper Mississippi River Basin Environmental Management Program Workshop
 Presentation to the Upper Mississippi River Basin Environmental Management Program Workshop by Michael Rodgers River Engineer US Army Corps of Engineers, St. Louis District August 17, 2007 Engineering
Columbia Estuary Province
 Rolling Provincial Review: Implementation 2001-2004 Province 73 Columbia Basin Fish & Wildlife Authority Province FY 2001-2004 Spending Summaries NPCC Recommendations and BPA Spending by Project Category,
Ways To Identify Background Verses Accelerated Erosion
 Ways To Identify Background Verses Accelerated Erosion Establish Background Condition From Old Ground Photos, Aerial Photos, and Maps Compare Rate Over Time At the Same Location, or for Reaches Channel
!"#$%&&'()*+#$%(,-./0*)%(!
*+#$%(,-./0*)%(!") 8:30 Sign in Hoosic River Revival Coalition!"#$%&&'()*+#$%(,-./0*)%(! 12-#30+4/#"5-(60 9:00 Welcome and Introductions 9:15 Goals for Today s Program: A Description of the Planning Process 9:30 First Session:
8:30 Sign in Hoosic River Revival Coalition!"#$%&&'()*+#$%(,-./0*)%(! 12-#30+4/#"5-(60 9:00 Welcome and Introductions 9:15 Goals for Today s Program: A Description of the Planning Process 9:30 First Session:
The Effects of Geomorphology and Watershed Land Use on Spawning Habitat
 The Effects of Geomorphology and Watershed Land Use on Spawning Habitat By Evan Buckland INTRODUCTION The distribution and frequency of large geomorphic features in a watershed govern where suitable spawning
Elevation (ft) Slope ( ) County CONDITION CATEGORY. Parameter Natural Condition Slightly impacted Moderately Impacted Heavily Impacted
 Slope ( ) County CONDITION CATEGORY. Parameter Natural Condition Slightly impacted Moderately Impacted Heavily Impacted") Version: 8/25/14 Meadow Name Date : / / MM DD YYYY GPS Location:. N. W GPS Datum (e.g., WGS 84, NAD 27) Elevation (ft) Slope ( ) County Watershed (HUC8) Landowner USGS Quad Name Observers: 7.5 or 15 (circle
Version: 8/25/14 Meadow Name Date : / / MM DD YYYY GPS Location:. N. W GPS Datum (e.g., WGS 84, NAD 27) Elevation (ft) Slope ( ) County Watershed (HUC8) Landowner USGS Quad Name Observers: 7.5 or 15 (circle
C. STUDENT FIELD DATA SHEETS
 C. STUDENT FIELD DATA SHEETS Student Name Date Time Stream Location Parameter to find Your Group s Results Units trial trial average Transparency cm Water Temperature Air Temperature Weather N sunny N
Summary of Hydraulic and Sediment-transport. Analysis of Residual Sediment: Alternatives for the San Clemente Dam Removal/Retrofit Project,
 Appendix N SUMMARY OF HYDRAULIC AND SEDIMENT-TRANSPORT ANALYSIS OF RESIDUAL SEDIMENT: ALTERNATIVES FOR THE SAN CLEMENTE DAM REMOVAL/RETROFIT PROJECT, CALIFORNIA the San Clemente Dam Removal/Retrofit Project,
Stream Simulation: A Simple Example
 Stream Simulation: A Simple Example North Thompson Creek, CO Paul T. Anderson U.S.D.A. Forest Service Here s How We Started May 2011 2-1 USDA-Forest Service Here s How We Finished Forest Service Aquatic
MISSION CREEK WATERSHED (2002 Report Year 4)
") Stream Channel Monitoring Program for the MISSION CREEK WATERSHED (2002 Report Year 4) (Penticton Forest District) Prepared for RIVERSIDE FOREST PRODUCTS LTD. Prepared by DOBSON ENGINEERING LTD. #4, 1960
Stream Channel Monitoring Program for the MISSION CREEK WATERSHED (2002 Report Year 4) (Penticton Forest District) Prepared for RIVERSIDE FOREST PRODUCTS LTD. Prepared by DOBSON ENGINEERING LTD. #4, 1960
Discharge. Discharge (Streamflow) is: Q = Velocity (L T -1 ) x Area (L 2 ) Units: L 3 T -1 e.g., m 3 s -1. Velocity. Area
 is: Q = Velocity (L T -1 ) x Area (L 2 ) Units: L 3 T -1 e.g., m 3 s -1. Velocity. Area") Discharge Discharge (Streamflow) is: Q = Velocity (L T -1 ) x Area (L 2 ) Units: L 3 T -1 e.g., m 3 s -1 Velocity Area Where is the average velocity?? 3 Source: Brooks et al., Hydrology and the Management
Discharge Discharge (Streamflow) is: Q = Velocity (L T -1 ) x Area (L 2 ) Units: L 3 T -1 e.g., m 3 s -1 Velocity Area Where is the average velocity?? 3 Source: Brooks et al., Hydrology and the Management
7.1 COMPONENTS OF THE HABITAT CHARACTERIZATION 7.2 HABITAT SAMPLING LOCATIONS WITHIN THE SAMPLING REACH 7.3 LOGISTICS AND WORK FLOW 7
 7 PHYSICAL HABITAT CHARACTERIZATION...97 7.1 COMPONENTS OF THE HABITAT CHARACTERIZATION...101 7.2 HABITAT SAMPLING LOCATIONS WITHIN THE SAMPLING REACH...103 7.3 LOGISTICS AND WORK FLOW...105 7.4 THALWEG
Step 5: Channel Bed and Planform Changes
 Step 5: Channel Bed and Planform Changes When disturbed, streams go through a series of adjustments to regain equilibrium with the flow and sediment supply of their watersheds. These adjustments often
Carmel River Bank Stabilization at Rancho San Carlos Road Project Description and Work Plan March 2018
 Carmel River Bank Stabilization at Rancho San Carlos Road Project Description and Work Plan March 2018 EXISTING CONDITION The proposed Carmel River Bank Stabilization at Rancho San Carlos Road Project
REDWOOD VALLEY SUBAREA
 Independent Science Review Panel Conceptual Model of Watershed Hydrology, Surface Water and Groundwater Interactions and Stream Ecology for the Russian River Watershed Appendices A-1 APPENDIX A A-2 REDWOOD
Upper Manistee River Instream Fish Habitat Assessment
 1 Upper Manistee River Instream Fish Habitat Assessment Michigan Trout Unlimited January 216 Kristin Thomas Dr. Bryan Burroughs 2 Table of Contents INTRODUCTION... 4 Table 1. Michigan stream and river
Limitation to qualitative stability indicators. the real world is a continuum, not a dichotomy ~ 100 % 30 % ~ 100 % ~ 40 %
 Stream Stability Assessment & BEHI Surveys Joe Rathbun MDEQ Water Resources Division rathbunj@michigan.gov 517--373 517 373--8868 Stability Stream can transport its water and sediment inputs without changing
Final Report for the Green Valley Creek Winter Refugia Enhancement Project Monitoring December 2016
 Final Report for the Green Valley Creek Winter Refugia Enhancement Project Monitoring December 2016 Prepared by: Mariska Obedzinski and Sarah Nossaman University of California Cooperative Extension & California
NATURAL RIVER. Karima Attia Nile Research Institute
 NATURAL RIVER CHARACTERISTICS Karima Attia Nile Research Institute NATURAL RIVER DEFINITION NATURAL RIVER DEFINITION Is natural stream of water that flows in channels with ih more or less defined banks.
Solutions to Flooding on Pescadero Creek Road
 Hydrology Hydraulics Geomorphology Design Field Services Photo courtesy Half Moon Bay Review Solutions to Flooding on Pescadero Creek Road Prepared for: San Mateo County Resource Conservation District
NATURE OF RIVERS B-1. Channel Function... ALLUVIAL FEATURES. ... to successfully carry sediment and water from the watershed. ...dissipate energy.
 1 2 Function... Sevier River... to successfully carry sediment and water from the watershed....dissipate energy. 3 ALLUVIAL FEATURES 4 CHANNEL DIMENSION The purpose of a stream is to carry water and sediment
UPPER KETTLE CREEK FISH HABITAT CONSERVATION PLAN TRIBUTARIES ADDENDUM
 UPPER KETTLE CREEK FISH HABITAT CONSERVATION PLAN TRIBUTARIES ADDENDUM For: Kettle Creek Watershed Association and Trout Unlimited March 2005 1000 Commerce Park Drive Williamsport, PA 17701 Phone (570)
Forest Service AOP Meeting Objectives of Stream Simulation: Examples and Talking Points
 Forest Service AOP Meeting Objectives of Stream Simulation: Examples and Talking Points Traci Sylte, P.E. Hydrology/Fluvial Geomorphology Lolo National Forest Is It True? Are Road Crossings a Dam with
Name: Which rock layers appear to be most resistant to weathering? A) A, C, and E B) B and D
 A, C, and E B) B and D") Name: 1) The formation of soil is primarily the result of A) stream deposition and runoff B) precipitation and wind erosion C) stream erosion and mass movement D) weathering and biological activity 2)
Name: 1) The formation of soil is primarily the result of A) stream deposition and runoff B) precipitation and wind erosion C) stream erosion and mass movement D) weathering and biological activity 2)
17-20 November 2007 Incidental Take Monitoring Methodology and Results
 Sample Site Selection Protocol 17-20 November 2007 Incidental Take Monitoring Methodology and Results On 16 November 2007, the U.S. Fish and Wildlife Service (USFWS) provided the USACE Mobile District
Case Study 8. North Fork Nooksack River In-channel Project
 Case Study 8 Project Overview The North Fork Nooksack In-channel project was developed cooperatively between the USDA Forest Service and the Nooksack Salmon Enhancement Association (NSEA), with the objectives
Fish Passage and Abundance around Grade Control Structures on Incised Streams in Western Iowa
 Fish Passage and Abundance around Grade Control Structures on Incised Streams in Western Iowa John Thomas Hungry Canyons Alliance Mary Culler Iowa State University / Missouri DNR Dimitri Dermisis IIHR
Dan Miller + Kelly Burnett, Kelly Christiansen, Sharon Clarke, Lee Benda. GOAL Predict Channel Characteristics in Space and Time
 Broad-Scale Models Dan Miller + Kelly Burnett, Kelly Christiansen, Sharon Clarke, Lee Benda GOAL Predict Channel Characteristics in Space and Time Assess Potential for Fish Use and Productivity Assess
-- Lessons from a successful salmon stream and estuary relocation on Gravina Island
 Re-inventing Government Creek -- Lessons from a successful salmon stream and estuary relocation on Gravina Island Jon Houghton, Ph.D. and Derek Ormerod, M.S., P.E. - Pentec Environmental/Hart Crowser,
Geomorphology Geology 450/750 Spring Fluvial Processes Project Analysis of Redwood Creek Field Data Due Wednesday, May 26
 Geomorphology Geology 450/750 Spring 2004 Fluvial Processes Project Analysis of Redwood Creek Field Data Due Wednesday, May 26 This exercise is intended to give you experience using field data you collected
EAGLES NEST AND PIASA ISLANDS
 EAGLES NEST AND PIASA ISLANDS HABITAT REHABILITATION AND ENHANCEMENT PROJECT MADISON AND JERSEY COUNTIES, ILLINOIS ENVIRONMENTAL MANAGEMENT PROGRAM ST. LOUIS DISTRICT FACT SHEET I. LOCATION The proposed
Restoration Goals TFG Meeting. Agenda
 San Joaquin River Restoration Program Restoration Goals TFG Meeting Reach 2B Update April 28, 2010 Agenda 1. Introductions 2. Program Restoration Goal Context 3. Program Update a) Interim Flows b) EIS/EIR
Watershed Assessment of River Stability and Sediment Supply: Advancing the Science of Watershed Analysis
 Watershed Assessment of River Stability and Sediment Supply: Advancing the Science of Watershed Analysis 2009 MWEA Annual Conference Rob Myllyoja, CET rmyllyoja@hrc-engr.com Watershed Assessment of River
Lagunitas Creek Stewardship Plan. Marin Municipal Water District
 Lagunitas Stewardship Plan Marin Municipal Water District Final June 2011 FIGURES Lagunitas Stewardship Plan Final June 2011 Legend Tomales Bay Highway 1 Major Roads Public Lands Marin Municipal Water
Step 6: Rapid Habitat Assessment (RHA)
") Step 6: Rapid Habitat Assessment (RHA) Background Physical processes, combined with chemical constituents and biological interactions, are what determine biological productivity and diversity; and, in
Step 6: Rapid Habitat Assessment (RHA) Background Physical processes, combined with chemical constituents and biological interactions, are what determine biological productivity and diversity; and, in
Appendix F Channel Grade Control Structures
 Stream Simulation Appendix F Channel Grade Control Structures This appendix briefly describes permanent grade control structures that are sometimes needed in the upstream and/or downstream reaches adjacent
3.12 Geology and Topography Affected Environment
 3 Affected Environment and Environmental Consequences 3.12 Geology and Topography 3.12.1 Affected Environment 3.12.1.1 Earthquakes Sterling Highway MP 45 60 Project Draft SEIS The Kenai Peninsula is predisposed
NORTHUMBERLAND COUNTY, PA
 QUAKER RUN Stream and Wetland Restoration As-Built Completion Report and First Year Monitoring Data Coal Township NORTHUMBERLAND COUNTY, PA Upstream Before Upstream After Prepared for: COAL TOWNSHIP 805
SELBY CREEK STREAM HABITAT RESTORATION AND RIPARIAN REVEGETATION PROJECT: GEOMORPHIC ANALYSIS AND REVIEW
 SELBY CREEK STREAM HABITAT RESTORATION AND RIPARIAN REVEGETATION PROJECT: GEOMORPHIC ANALYSIS AND REVIEW Submitted to Bioengineering Institute P.O. Box 1554 Laytonville, CA 95454 By Matthew O Connor, PhD,
Sixteen Mile Creek Tributaries Meander Belt Width Assessment November 2009
 SIXTEEN MILE CREEK TRIBUTARIES THE CATHOLIC CEMETERIES OF THE DIOCESE OF HAMILTON -MEANDER BELT WIDTH ASSESSMENT - Report to: Attention: From: Director of Cemeteries Catholic Cemeteries of the Diocese
Which map shows the stream drainage pattern that most likely formed on the surface of this volcano? A) B)
 B)") 1. When snow cover on the land melts, the water will most likely become surface runoff if the land surface is A) frozen B) porous C) grass covered D) unconsolidated gravel Base your answers to questions
1. When snow cover on the land melts, the water will most likely become surface runoff if the land surface is A) frozen B) porous C) grass covered D) unconsolidated gravel Base your answers to questions
SCOPE OF PRESENTATION STREAM DYNAMICS, CHANNEL RESTORATION PLANS, & SEDIMENT TRANSPORT ANALYSES IN RELATION TO RESTORATION PLANS
 DESIGN METHODS B: SEDIMENT TRANSPORT PROCESSES FOR STREAM RESTORATION DESIGN PETER KLINGEMAN OREGON STATE UNIVERSITY CIVIL ENGINEERING DEPT., CORVALLIS 2 ND ANNUAL NORTHWEST STREAM RESTORATION DESIGN SYMPOSIUM
Monitoring the Effectiveness of Culvert Fish Passage Restoration
 Monitoring the Effectiveness of Culvert Fish Passage Restoration Final Report Prepared for: California Department of Fish and Game Salmon and Steelhead Trout Restoration Account Agreement No. P0210566
Birch Creek Geomorphic Assessment and Action Plan
 Birch Creek Geomorphic Assessment and Action Plan Jim Webster Tim Hanrahan, PhD, CFM Jesse Schwartz, PhD Zach Hill January 22, 2015 White Eagle Grange This Project is a First Step in Strategy Planning
BUREAU OF CLEAN WATER. Appendix C Biological Field Methods C1. Habitat Assessment DECEMBER 2013
 BUREAU OF CLEAN WATER Appendix C Biological Field Methods C1. Assessment DECEMBER 2013 HABITAT ASSESSMENT The Department has adopted the habitat assessment methods outlined in EPA s Rapid Bioassessment
The River Restoration Centre therrc.co.uk. Understanding Fluvial Processes: supporting River Restoration. Dr Jenny Mant
 The River Restoration Centre therrc.co.uk Understanding Fluvial Processes: supporting River Restoration Dr Jenny Mant Jenny@therrc.co.uk Understanding your catchment Hydrology Energy associated with the
Appendix III-A Descriptions of Channel Habitat Types
 Appendix III-A Descriptions of Channel Habitat Types Table of Contents Channel Habitat Typing Background... 3 Small Estuarine Channel (ES)... 7 Large Estuarine Channel (EL)... 9 Low Gradient Large Floodplain
Technical Supplement 3E. Rosgen Stream Classification Technique Supplemental Materials. (210 VI NEH, August 2007)
") Technical Supplement 3E (210 VI NEH, August 2007) Issued August 2007 Cover photo: The Rosgen stream classification system uses morphometric data to characterize streams. Advisory Note Techniques and approaches
Technical Supplement 3E (210 VI NEH, August 2007) Issued August 2007 Cover photo: The Rosgen stream classification system uses morphometric data to characterize streams. Advisory Note Techniques and approaches