Spatial Continuity of Selected Indicators of Labour Market
|
|
|
- Sherilyn Greer
- 5 years ago
- Views:
Transcription
1 Spatial Continuity of Selected Indicators of Labour Market Jiří Horák 1, Milan Šimek 2, Monika Šeděnková 1 1 Institut geoinformatiky, Hornicko-geologická fakulta, VŠB-TU Ostrava, 17.listopadu 15/2172, Ostrava-Poruba, Česká Republika jiri.horak@vsb.cz, monika.sedenkova@vsb.cz 2 Katedra národohospodářská, Ekonomická fakulta, VŠB-TU Ostrava, Sokolská třída 33, , Ostrava, Česká Republika milan.simek@vsb.cz Abstract. Social and Economical Geography as well as Sociology apply for measurement of spatial continuity (autocorrelation) usually methods of global and local indicators than geostatistical approaches to a field exploration. Global indicators like Moran I or Geary C indexes are considered to be analogous to basic structural functions of geostatistics, however they utilize a generalised concept of distance and contiguity. Enumerations of local indicators spatial association (LISA) and testing of their significance offer a great contribution to spatial exploratory analysis. Selected methods were applied to 3 time snapshots of the Czech labour market described by the rate of unemployment, the rate of longterm unemployed and rate of unemployed with basic education for the level of municipalities. The evaluation based on global and local indicators are compared with results of usual methods. Keywords: spatial continuity, geostatistics, global and local indicators of spatial autocorrelation Abstrakt. Prostorová kontinuita vybraných ukazatelů situace na trhu práce. V oblasti socioekonomické geografie a sociologie se k popisu a zkoumání prostorové kontinuity (autokorelace) používají více metody globálních a lokálních indikátorů než geostatistické postupy zkoumání pole. Globální indikátory jako je Moranovo I nebo Gearyho C kritérium jsou analogické základním strukturálním funkcím geostatistiky, avšak používají zobecněný koncept vzdálenosti a sousedství. Potenciálně velmi přínosné jsou výpočty lokálních indikátorů a testování jejich významnosti, známé pod označením LISA. Vybrané metody byly aplikovány na 3 časových řezech míry nezaměstnanosti, zastoupení dlouhodobě nezaměstnaných a nezaměstnaných se základním vzděláním v obcích ČR. Hodnocení pomocí globálních a lokálních hodnot indikátorů je porovnáno s běžnými metodami. Klíčová slova: prostorová kontinuita, geostatistika, globální a lokální indikátory prostorové autokorelace 1 Introduction Characteristics of close objects are more similar than distant objects. It can be seen as of one the basic geographical axioms, expressed by the Tobler s law [12]. The influence of proximity to the value distribution of selected phenomena can be strong or weak and we can recognize slow changes in values or rapid/random changes respectively. Similarity of values is usually denoted as a correlation which can be measured by i.e. Pearson coefficient of correlation, Spearman coefficient of correlation, goodness-of-fit R2 etc. Usually it is applied to evaluate the character and power of the relationship between 2 different phenomena (i.e. temperature and humidity). If we study a correlation of only 1 phenomenon (i.e. temperature) we speak about a autocorrelation instead of the correlation. The most important form of autocorrelation is spatial autocorrelation, where the similarity of values (of 1 phenomenon) separated by some distance is measured. Typically the analysis tries to evaluate how the similarity of values decreases with the increased distance (distance decay effect). Spatial autocorrelation can be defined as the coincidence between value similarity and locational similarity [2]. Any presence of strong spatial autocorrelation highly influences the application of many statistical, analytical and modelling methods where classic a spatial forms of these methods fail due to the fact that they requires to have samples independent. In such cases we need to apply methods 1
2 respecting spatial autocorrelation. I.e. classic regression models are substituted by spatial autoregressive models in various variants like simultaneous autoregressive models, conditional autoregressive models, etc. [3]. This is not the only reason why is the spatial autocorrelation important. The description of spatial autocorrelation, especially unhomogeneity and anisotropy measured by spatial autocorrelation can be deployed to divide the area to homogeneous units or to uncover and understand processes forming the explored situation. The first one represents an effective way how to establish territorial units homogeneous by its internal structure and values. Finally, the spatial autocorrelation measured in a local scale can be used for determining of hot spots in the area places where the values here and in surroundings significantly differs from other places. Such hot spots may help to discover places with specific conditions. Measurement of spatial similarity or dissimilarity between values of 1 phenomenon (separated by distance) can be seen as an extension of spatial autocorrelation. We can speak about a spatial association. The concept is the same, just for description of spatial similarity not only measures of spatial autocorrelation are deployed also measures of spatial variability can be applied. The intention of the paper is to attract attention to the phenomenon of spatial association especially for areal data and to demonstrate an application and a value of contribution for analytical studies. As an example we select the analysis of selected indicators of labour market in the Czech Republic. 2 Global indicators of spatial association The concept of spatial association and autocorrelation is deeply elaborated and usually applied in geostatistics. Geostatistics is foremost Data Analysis and Spatial Continuity Modelling [7]. Such kind of data analysis is denoted as structural analysis. The aim of structural analysis is to depict the spatial structures in the area both to understanding spatial relationships as well as utilised the final parameters describing the structure in geostatistical methods of interpolation (kriging). The structural analysis deploys various indicators to measure spatial autocorrelation or variability in the area. Typically variogram (measures of variability depending on distance and direction) and covariance functions (measures of covarince depending on distance and direction) are deployed. Both these functions use only 1 type of distance measure a metric distance. Sometimes we need to describe a spatial separation more commonly i.e. separation expressed by the order of neighbours or by the inverse share of common border. This is the case of area data where we do not have any precise measures of distance separated values. Even more, area data is usual form of socioeconomic data where more common measures of distance seem to be more contributing to understand complex phenomena. The most popular indicators are Moran s I a Geary s Ratio C indexes which can be defined as [3]: I k = n * n n i= 1 j = 1 w ( k ) ij * ( z z )* ( z z ) n 2 ( k ) ( z ) i z * wij i= 1 i j i j (1) (2) 2

3 C k = n n ( k ) ( n 1) * wij * ( zi z j ) 2* i= 1 j= 1 n 2 ( k ) ( z ) i z * wij i= 1 i j 2 where z i is the value in area unit i (z with the top stripe is mean of z), w ij (k) is the weight between units i and j for the step k. As you can see, indicators can be calculated for different steps but quite often only the first step is utilised. There are many variants of w ij calculation differs the way how to select neighbours and how to assign weights to them. Some of the variants are in the table 1. Table 1. Variants of weight matrix calculation 1) w ij = 1 the centroid of area unit j is one of the k nearest centroid to the unit i w ij = 0 other cases 2) w ij = 1 the centroid of area unit j is to the distance δ to the unit i w ij = 0 other cases 3) w ij = d γ ij the distance d ij between the centroid of unit i and j is lower than distance limit δ from the unit i (γ < 0 denotes steepness of the distance impact) w ij = 0 other cases 4) w ij = 1 the unit j shares the common border with the unit i w ij = 0 other cases 5) w ij = l ij /l i l ij is the length of the common border between units i and j; l i is the perimeter of the unit i Some ways of calculation w ij contain the parameters (k, δ, γ), which can be optimized are illustrate on fig Fig. 1 Neighbors selected as 5 closest polygons, weights are 1 [4] 3
![Fig. 2 Neighbors are in touch, weights are assigned according the length of the common border [4] Moran s I index represents a direct measure of spatial autocorrelation (likewise to covariance](/docs-images/91/106867125/images/4-0.jpg "function). Geary s Ratio C index is a measure of variability (it is calculated similarly to variogram).")
4 Fig. 2 Neighbors are in touch, weights are assigned according the length of the common border [4] Moran s I index represents a direct measure of spatial autocorrelation (likewise to covariance function). Geary s Ratio C index is a measure of variability (it is calculated similarly to variogram). In no spatial autocorrelation exists (it means a random pattern), the expected value of Moran s I is (- 1)/(n-1) [9] and the expected value for C is 1 (not depending on the size of file). The clustered pattern carries the C value between 0 and 1, the value of I is higher than for the random pattern. The dispersed pattern is indicated by the C value between 1 and 2, the value of I is lower than for the random pattern. It is necessary to stressed out that any of the criterions do not provide values exactly in the mentioned interval. It causes real problems with distance matrix formulation. [3] propose a corrective element I by which I is divided and by that the supposed value intervals can be obtained (similarly for C). Some authors [11] warn against using the statistical characteristics of spatial autocorrelation indicators for adjusted data that are based on the age population standardization. The population can be usually spatially autocorrelated and that leads to project of this dependence to adjusted data of studied phenomenon. Frequently that phenomenon can indicate spatial autocorrelation even though in reality can be invariable in the whole area. As an appropriate solution is recommended testing of probability based on a simulation. Instead of any correction factor currently the technology of randomization is applied. The values of attributes (the known values) are assigned to different spatial units randomly. Thus the random process of attribute value simulation is substituted by the random process of selection the place. For the random generated situation assessments of variance are computed and together with estimated mean value we can use for testing of importance of recognised deviation from the random situation. [9]. Moran s I and Geary s Ratio C do not distinguish if the positive autocorrelation takes place between high or low values vice versa. That is why it is possible to deploy an indicator G(d), as an analogy of Ripley's K function [9]. 3 Local indicators of spatial association Moran s I and Geary s Ratio C measure spatial autocorrelation in the whole area. So it is used for global determination of autocorrelation or variability measurement. In some case we need differentiate local autocorrelation situation and find out whether the area is homogeneous (still the same autocorrelation value in the area) or vice versa heterogeneous (the autocorrelation value in individual places significantly differs). Local Indicators of Spatial Association (LISA) represents the local version of Moran s I and Geary s Ratio C or indicator G ([1] in [8]). 4
5 The local Moran s I for unit i is defined as [9]: i i * I = r w * r j ij j (3) where r i and r j are standardized values of z. Similarly like a global Moran s I, high value for local Moran s I show a clustering of similar values (high or low). A standalone computation of the indicator is not too useful. High values can arise randomly. It is necessary to determine estimated mean value, variance and compute probability of such result (etc. to test if the deviation can be caused randomly). The expected mean value [1] is E[I i ] = (- w i )/(n-1). It is necessary to calculate expected mean and variance for each area to evaluate the probability of the given result. The local version of Geary s Ratio C is less applied due to difficulties [9] by its distribution properties. C i = c (4) i * wij i j j * ( r r ) 2 Exploration analyses try to discover places with an unusual value of spatial autocorrelation. Moran s diagram draws value Wz to z and also the result of linear regression that can identify the abnormal values (outliers). LISA helps to distinguish high autocorrelation between high and low values. It can identify the area with high values (monitoring area is surrounded by high values) which is denoted as a HH type of the area. LL type means a cluster of high correlation where a low value is surrounded by low values. HL resp. LH cluster represents an area, where significantly high autocorrelation is negative and high value is surrounded by low values and vice versa. The following computations of global and local indicators of spatial association were undertaken in the Geoda environment [13]. The model of rooks case of spatial weighting was applied according results of studies of German unemployment for different administrative units [10] and practical test showing more compact and stable results for the pattern of Czech municipalities. The Geoda programme has been used i.e. for spatial analysis of the Czech Party System, where LISA cluster map for district levels brought new view to the institutionalisation and spatial regimes of Czech party system [8]. 4 Case study: a Labour market in the Czech Republic Before starting any study we have to check the basic consistency prerequisites: no changes in area unit structure (number, shape etc.) the number of municipalities in CZ to is 6248, for the later used snap shots is The data of labour market was provided for 6249 municipalities. Thus we have used a fixed structure with 6249 area units for all time snapshots. some of area units are not continuous which complicates a computation of weighs for LISA. It negatively influences especially absolute values, where the distribution of values to all individual polygons is necessary. We have used ratio values where the problem can be neglected. The labour market is influences by many factors, among them selected indicators describing unemployment registered by labour offices are very significant. We have selected 3 main indicators: 5


6 the rate of unemployment, the rate of long-term unemployed and rate of unemployed with basic education. To study a local situation the data for the municipal level is deployed. We have selected 3 time snapshots which help to evaluate not only the state to the selected date but also the development. This way it is possible to assess the stability of the situation and an extent of changes. A traditional approach to analyse the situation of selected indicator is to create choropleth map followed by a visual interpretation. According [14] there are two choroplethic techniques simple choroplethic mapping and classless choroplethic mapping. The classless choroplethic maps represent the attribute distribution without any generalization but it may create a quite complex pattern and confuse map readers. The result of simple choroplethic mapping depends on the number of classes and class limit determination. We can find many methods for determining class limits in the cartographic literature usually based on the study of the data distribution using graphic (frequency curve, cumulative frequency curve, clinographic curve etc.) or mathematic approaches [15,16]. The methods are separated into three major groups [14]: 1. constant series or equal steps 2. systematically unequal stepped class limits 3. irregular stepped class limits We have applied three of these methods to demonstrate frequent outputs of choropleth mapping. The first group is presented by equal interval (equal steps based on the range of attribute values [14]) and standard deviation interval (parameters of a normal distribution [14]). The Box-Jenkins method (denoted in following figures as natural breaks) belongs to the third group. The choropleth maps have been prepared in ArcGIS 9.2. The application of global and local indicators of spatial association can offer another view to the data and mapped phenomenon. The spatial autocorrelation can help to better understand the phenomenon and its behaviour, to distinguish how much is the phenomenon determined by the local situation or influenced by neighbours or some common factors behind. The map of regions (NUTS3) (fig.3) will help to better understand locational terms used for description of the results documented in following figures. Fig. 3 Regions of the Czech Republic 6
7 GIS Ostrava Results of local analysis Rate of unemployment Three methods of class interval determination for choropleth map is presented in fig.3-5. We can compare results with a cluster LISA map (fig.6). Equal intervals did not contribute too much to pattern description and the determination of borders for individual regions with similar values is difficult. It is possible to find main territories with higher level of unemployment large part of the Usti region, peripheral parts of Moravian-Silesian and Olomouc regions, SW part of the South Moravian region and other smaller areas. Better visual interpretation can be achieved using natural breaks and standard deviation classifications (the effect of the last one is enhanced with a bicolour scheme). These methods provide us more plastic view of the situation where the distribution of values are better portrayed. Nevertheless these methods are not efficient to delimit individual regions with high values and establish their borders. To the opposite LISA cluster map provides clear distinguishing of individual regions where the spatial autocorrelation is high. These regions are quite compact. Some border parts of the CZ are not classified due to the insufficient neighbour s identification which decreases the quality of classification in these areas. Fig. 3 Rate of unemployment (municipalities, , equal interval classification) 7


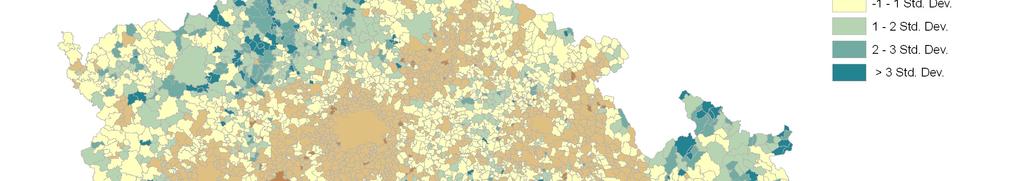

8 GIS Ostrava 2009 Fig. 4 Rate of unemployment (municipalities, , natural breaks interval classification) 8
9 Fig. 5 Rate of unemployment (municipalities, , standard deviation interval classification) Fig. 6 LISA cluster map of the rate of unemployment (municipalities, , significant clusters) Fig. 7 LISA cluster map of the rate of unemployment (municipalities, , significant clusters) The comparison of snaphots of cluster maps shows quite compact and stable clusters where we can identify important high-level clusters for Usti region, outlying municipalities of Moravian-Silesian and Olomouc regions, Znojmo area and Hodonin-Kyjov area of South Moravian region. Important low-level clusters are Central Bohemia extended to Plzen (SW) and Mlada Boleslav (NE) and Vysocina areas, part of Eastern Bohemia region (namely Hradec Karlove region), and area around Ceske Budejovice. Low-level clusters Brno-Olomouc and around Otrokovice are not stable and present significant changes of the shape and extend. 9

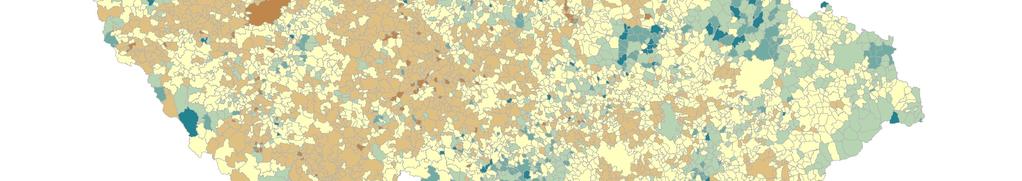
10 Fig. 8 LISA cluster map of the rate of unemployment (municipalities, , significant clusters) 5.2 Rate of unemployed with basic education LISA cluster maps provides clear delimitation of HH and LL regions although the individual clusters are not so compact and stable in time as it was for the rate of unemployment. The high-level clusters are located mainly in peripheral parts of CZ, especially in Usti, Karlovy Vary and Plzen regions. Main area of low-level clustering is along the line Prague-Brno. Transient significant clusters are usually very small and indicate municipalities contrasting to the values around (local extremes). The development of LISA cluster maps demonstrates the increase of heterogeneity. Such changes are probably induced by a local offer of unqualified vacant places. 10
11 Fig. 12 LISA cluster map of the rate of unemployed with basic education (municipalities, , significant clusters) Fig. 13 LISA cluster map of the rate of unemployed with basic education (municipalities, , significant clusters) 11
12 Fig. 14 LISA cluster map of the rate of unemployed with basic education (municipalities, , significant clusters) 5.3 Rate of long-term unemployed LISA cluster maps did not show such large homogeneous regions like for the previous indictors. The clusters are small and fragmented. The temporal development tends to increase homogeneity of both main types of clusters. This feature is probably induced by a decrease of the rate of unemployment and simultaneously an increase of long-term unemployment in the registration. Also the influence of territorial differentiation from the point of view of vacant places availability may take a part. 12
13 Fig. 18 LISA cluster map of the rate of long-term unemployed (municipalities, , significant clusters) Fig. 19 LISA cluster map of the rate of long-term unemployed (municipalities, , significant clusters) 13
14 Fig. 20 LISA cluster map of the rate of long-term unemployed (municipalities, , significant clusters) 5.4 Results of global analysis The Moran s I index has been computed for all variables in the first time snapshot. Instead of presentation of just one value for the index it is more beneficial to draw a Moran scatter plot. It is the special case of a scatter plot that shows the spatial lag of the variable on the vertical axis and the original variable on the horizontal axis [9]. The variables are standardized so that the units in the graph are expressed in standard deviations. The mean values (zero after standardization) divide the graph into four quadrants which correspond to the basic four types of spatial autocorrelation: high-high (upper right), low-low (lower left), for positive spatial autocorrelation; high-low (lower right) and lowhigh (upper left), for negative spatial autocorrelation. The slope of the regression line is Moran s I, which is also listed at the top of the graph. 14
15 Fig. 21 Moran s I for the rate of unemployment (municipalities, ) Fig. 22 Moran s I for the rate of unemployed with basic education (municipalities, ) 15
16 Fig. 23 Moran s I for the rate of long-term unemployed (municipalities, ) The global Moran s I indicator shows a significant and positive level of spatial autocorrelation for the rate of unemployment (RU) (fig. 21). The values of RU are surrounded by the similar values which invokes the high positive spatial autocorrelation. The asymmetry of the cloud in the graph seems to reflect skew distribution of RU values. The positive however low spatial autocorrelation can be seen for other indicators. The rate of unemployed with basic education shows Moran s I=0,17 (fig. 22) where the high-high quadrant is more populated. The long-term unemployment (PE12) (fig.23) presents even lower value of Moran s I which is attributed to higher variability of PE12. In both last plots we can see several vertical lines. Such effect is caused by several frequent values of the variable where each of them is surrounded by a practically full spectrum of values in their neighbourhood. The randomisations with 999 permutations prove in all cases the significance of results for the level of Conclusion The utilisation of the indicators of spatial association offers new possibilities in the frame of spatial analysis of the labour market as well as for an application of employment policies: Better identification of microregions with a distinct, specific regime of labour market Monitoring of processes determining creation of new homogeneous (micro-)regions and its stability Identification of homogeneous regions across district/region borders which can be useful mainly for preparatory analysis and for the realisation of projects supported from European Social Fund on different levels. Local and regional analyses of labour market requested by incoming foreign investors to evaluate the share of selected professions in the concerned area. The presented results demonstrate some possibilities but also stay new challenges in front of us. The labour market should be more studied using different weight matrices, bivariate global and local indicators and also better tested with randomisation process. Also the possibility of combination spatial autocorrelation approach with Gini index computation [6] can bring more information requested for deeper study and understanding of complex processes of labour market. 16
17 References [1] Anselin, L: Local indicators of spatial association LISA. Geographical Analysis p [2] Anselin, L.: Spatial econometrics. In Companion to Econometrics, Baltagi B. (ed.) Basil Blackwell. Oxford, [3] Bailey, T.C., Gatrell, A.C. Interactive spatial data analysis. Essex, Longman Scientific & Technical, [4] Hanuš, F.: Časoprostorové vyhlazení socioekonomických dat. Disertation thesis, Ostrava pages. [5] Horák, J.: Prostorová analýza dat. Institute of geoinformatics, 2006, Ostrava. [6] Guillain, R., Gallo Le, J.: Measuring agglomeration: An Exploratory Spatial Analysis Approach Applied to the case of Paris and its surroundings. Proceedings of 1 st workshop on Spatial Econometrics, Rome, [7] Journal, A.: Fundamentals of Geostatistics in Five Lessons. American Geophysical Union, p. [8] Kouba, K.: Prostorová analýza českého stranického systému. Institucionalizace a prostorové režimy. Czech Sociological Review, 2007, Vol. 43, No. 5. p [9] Lee, J., Wong, D.: Statistical analysis with ArcView GIS. USA, John Wiley & Sons Inc., 2001, 192 pages, ISBN [10] Patuelli, R., Griffith D. A., Tiefelsdorf, M., Nijkamp, P.: The use of spatial filtering techniques: the spatial and space-time structure of German unemployment data. Proceedings of 1 st workshop on Spatial Econometrics, Rome, [11] Smans, M., Esteve, J.: Practical approaches to disease mapping. In Elliott P., Cuzick J., Engish D., Stern R.(ed.): Geographical & Environmental Epidemiology. New York, Oxford University Press, 1996, s , ISBN [12] Tobler, W.: A computer movie simulating urban growth in the Detroit region. Economic Geography, 1970, Vol. 46, no. 2, p [13] Anselin, L., Syabri I., Kho, Y.: GeoDa: An introduction to spatial data analysis. Geographical Analysis. Vol. 38, no. 1, p. 5-22, [14] Robinson A., Morrison J, Muehrcke P., Kimerling A., Guptill S.: Elements of Cartography. 6 th edition. Wiley, 1995, 674 pages. ISBN [15] Kraak M., Ormeling F.: Cartography. Visualization of spatial data. 3 rd edition, Longman, 1998, 222 pages. ISBN [16] Voženílek, V.: Cartography for GIS - geovisualization and map communication. Olomouc, UP, 140 pages, ISBN
MODELLING OF TRANSPORT ACCESSIBILITY FOR MUNUCIPALITIES OF THE CZECH REPUBLIC
 MODELLING OF TRANSPORT ACCESSIBILITY FOR MUNUCIPALITIES OF THE CZECH REPUBLIC Doc.Dr.Ing. Jiří Horák 1, Ing.Monika Šeděnková 1, Ing.Igor Ivan 1 1 Institut geoinformatiky, Hornicko-geologická fakulta, VŠB-TU
Lecture 3: Exploratory Spatial Data Analysis (ESDA) Prof. Eduardo A. Haddad
 Prof. Eduardo A. Haddad") Lecture 3: Exploratory Spatial Data Analysis (ESDA) Prof. Eduardo A. Haddad Key message Spatial dependence First Law of Geography (Waldo Tobler): Everything is related to everything else, but near things
Lecture 3: Exploratory Spatial Data Analysis (ESDA) Prof. Eduardo A. Haddad Key message Spatial dependence First Law of Geography (Waldo Tobler): Everything is related to everything else, but near things
SPACE Workshop NSF NCGIA CSISS UCGIS SDSU. Aldstadt, Getis, Jankowski, Rey, Weeks SDSU F. Goodchild, M. Goodchild, Janelle, Rebich UCSB
 SPACE Workshop NSF NCGIA CSISS UCGIS SDSU Aldstadt, Getis, Jankowski, Rey, Weeks SDSU F. Goodchild, M. Goodchild, Janelle, Rebich UCSB August 2-8, 2004 San Diego State University Some Examples of Spatial
Outline ESDA. Exploratory Spatial Data Analysis ESDA. Luc Anselin
 Exploratory Spatial Data Analysis ESDA Luc Anselin University of Illinois, Urbana-Champaign http://www.spacestat.com Outline ESDA Exploring Spatial Patterns Global Spatial Autocorrelation Local Spatial
SASI Spatial Analysis SSC Meeting Aug 2010 Habitat Document 5
 OBJECTIVES The objectives of the SASI Spatial Analysis were to (1) explore the spatial structure of the asymptotic area swept (z ), (2) define clusters of high and low z for each gear type, (3) determine
Introduction to Spatial Statistics and Modeling for Regional Analysis
 Introduction to Spatial Statistics and Modeling for Regional Analysis Dr. Xinyue Ye, Assistant Professor Center for Regional Development (Department of Commerce EDA University Center) & School of Earth,
Spatial Analysis 2. Spatial Autocorrelation
 Spatial Analysis 2 Spatial Autocorrelation Spatial Autocorrelation a relationship between nearby spatial units of the same variable If, for every pair of subareas i and j in the study region, the drawings
Exploratory Spatial Data Analysis (ESDA)
") Exploratory Spatial Data Analysis (ESDA) VANGHR s method of ESDA follows a typical geospatial framework of selecting variables, exploring spatial patterns, and regression analysis. The primary software
Exploratory Spatial Data Analysis (ESDA) VANGHR s method of ESDA follows a typical geospatial framework of selecting variables, exploring spatial patterns, and regression analysis. The primary software
The Use of Spatial Weights Matrices and the Effect of Geometry and Geographical Scale
 The Use of Spatial Weights Matrices and the Effect of Geometry and Geographical Scale António Manuel RODRIGUES 1, José António TENEDÓRIO 2 1 Research fellow, e-geo Centre for Geography and Regional Planning,
Spatial Autocorrelation
 Spatial Autocorrelation Luc Anselin http://spatial.uchicago.edu spatial randomness positive and negative spatial autocorrelation spatial autocorrelation statistics spatial weights Spatial Randomness The
EXPLORATORY SPATIAL DATA ANALYSIS OF BUILDING ENERGY IN URBAN ENVIRONMENTS. Food Machinery and Equipment, Tianjin , China
 EXPLORATORY SPATIAL DATA ANALYSIS OF BUILDING ENERGY IN URBAN ENVIRONMENTS Wei Tian 1,2, Lai Wei 1,2, Pieter de Wilde 3, Song Yang 1,2, QingXin Meng 1 1 College of Mechanical Engineering, Tianjin University
Exploring the variability and geographical patterns of population characteristics: Regional and spatial perspectives
 2017, 25(2): 85 94 MORAVIAN GEOGRAPHICAL REPORTS Vol. 23/2015 No. 4 MORAVIAN GEOGRAPHICAL REPORTS MORAVIAN GEOGRAPHICAL REPORTS Institute of Geonics, The Czech Academy of Sciences journal homepage: http://www.geonika.cz/mgr.html
The Geographical Balance of Regional News of Czech TV CT24
 The Geographical Balance of Regional News of Czech TV CT24 Peter Nemec, Jiří Horák Institute of Geoinformatics, Faculty of Mining and Geology, VSB-Technical University of Ostrava, 17. listopadu 15 70833,
Exploratory Spatial Data Analysis (And Navigating GeoDa)
") Exploratory Spatial Data Analysis (And Navigating GeoDa) June 9, 2006 Stephen A. Matthews Associate Professor of Sociology & Anthropology, Geography and Demography Director of the Geographic Information
Exploratory Spatial Data Analysis (And Navigating GeoDa) June 9, 2006 Stephen A. Matthews Associate Professor of Sociology & Anthropology, Geography and Demography Director of the Geographic Information
The Nature of Geographic Data
 4 The Nature of Geographic Data OVERVIEW Elaborates on the spatial is special theme Focuses on how phenomena vary across space and the general nature of geographic variation Describes the main principles
Mapping and Analysis for Spatial Social Science
 Mapping and Analysis for Spatial Social Science Luc Anselin Spatial Analysis Laboratory Dept. Agricultural and Consumer Economics University of Illinois, Urbana-Champaign http://sal.agecon.uiuc.edu Outline
Spatial Regression. 1. Introduction and Review. Luc Anselin. Copyright 2017 by Luc Anselin, All Rights Reserved
 Spatial Regression 1. Introduction and Review Luc Anselin http://spatial.uchicago.edu matrix algebra basics spatial econometrics - definitions pitfalls of spatial analysis spatial autocorrelation spatial
Chapter 6 Spatial Analysis
 6.1 Introduction Chapter 6 Spatial Analysis Spatial analysis, in a narrow sense, is a set of mathematical (and usually statistical) tools used to find order and patterns in spatial phenomena. Spatial patterns
Spatial Analysis 1. Introduction
 Spatial Analysis 1 Introduction Geo-referenced Data (not any data) x, y coordinates (e.g., lat., long.) ------------------------------------------------------ - Table of Data: Obs. # x y Variables -------------------------------------
Finding Hot Spots in ArcGIS Online: Minimizing the Subjectivity of Visual Analysis. Nicholas M. Giner Esri Parrish S.
 Finding Hot Spots in ArcGIS Online: Minimizing the Subjectivity of Visual Analysis Nicholas M. Giner Esri Parrish S. Henderson FBI Agenda The subjectivity of maps What is Hot Spot Analysis? Why do Hot
Spatial correlation and demography.
 Spatial correlation and demography. Sébastien Oliveau, Christophe Guilmoto To cite this version: Sébastien Oliveau, Christophe Guilmoto. Spatial correlation and demography.: Exploring India s demographic
ENGRG Introduction to GIS
 ENGRG 59910 Introduction to GIS Michael Piasecki October 13, 2017 Lecture 06: Spatial Analysis Outline Today Concepts What is spatial interpolation Why is necessary Sample of interpolation (size and pattern)
Temporal vs. Spatial Data
 Temporal vs. Spatial Data Temporal 1 dimensional Units: day, week, month Lag: t, t-1, t-2 Durbin-Watson Spatial 2-3 dimensional Units: county, mile, region Lag: near neighbor, networks (?) Moran s I Differencing
Spatial Data Mining. Regression and Classification Techniques
 Spatial Data Mining Regression and Classification Techniques 1 Spatial Regression and Classisfication Discrete class labels (left) vs. continues quantities (right) measured at locations (2D for geographic
Where Do Overweight Women In Ghana Live? Answers From Exploratory Spatial Data Analysis
 Where Do Overweight Women In Ghana Live? Answers From Exploratory Spatial Data Analysis Abstract Recent findings in the health literature indicate that health outcomes including low birth weight, obesity
KAAF- GE_Notes GIS APPLICATIONS LECTURE 3
 GIS APPLICATIONS LECTURE 3 SPATIAL AUTOCORRELATION. First law of geography: everything is related to everything else, but near things are more related than distant things Waldo Tobler Check who is sitting
The Analysis of Sustainability Development of Eastern and South Eastern Europe in the Post Socialist Period
 The Analysis of Sustainability Development of Eastern and South Eastern Europe in the Post Socialist Period Fatih Çelebioğlu Dumlupınar University, Faculty of Economics and Administrative Sciences, Department
METHODS FOR STATISTICS
 DYNAMIC CARTOGRAPHIC METHODS FOR VISUALIZATION OF HEALTH STATISTICS Radim Stampach M.Sc. Assoc. Prof. Milan Konecny Ph.D. Petr Kubicek Ph.D. Laboratory on Geoinformatics and Cartography, Department of
Spatial Analysis I. Spatial data analysis Spatial analysis and inference
 Spatial Analysis I Spatial data analysis Spatial analysis and inference Roadmap Outline: What is spatial analysis? Spatial Joins Step 1: Analysis of attributes Step 2: Preparing for analyses: working with
The Case for Space in the Social Sciences
 The Case for Space in the Social Sciences Don Janelle Center for Spatially Integrated Social Science University of California, Santa Barbara Roundtable on Geographical Voices and Geographical Analysis
Types of spatial data. The Nature of Geographic Data. Types of spatial data. Spatial Autocorrelation. Continuous spatial data: geostatistics
 The Nature of Geographic Data Types of spatial data Continuous spatial data: geostatistics Samples may be taken at intervals, but the spatial process is continuous e.g. soil quality Discrete data Irregular:
Luc Anselin Spatial Analysis Laboratory Dept. Agricultural and Consumer Economics University of Illinois, Urbana-Champaign
 GIS and Spatial Analysis Luc Anselin Spatial Analysis Laboratory Dept. Agricultural and Consumer Economics University of Illinois, Urbana-Champaign http://sal.agecon.uiuc.edu Outline GIS and Spatial Analysis
2/7/2018. Module 4. Spatial Statistics. Point Patterns: Nearest Neighbor. Spatial Statistics. Point Patterns: Nearest Neighbor
 Spatial Statistics Module 4 Geographers are very interested in studying, understanding, and quantifying the patterns we can see on maps Q: What kinds of map patterns can you think of? There are so many
Using AMOEBA to Create a Spatial Weights Matrix and Identify Spatial Clusters, and a Comparison to Other Clustering Algorithms
 Using AMOEBA to Create a Spatial Weights Matrix and Identify Spatial Clusters, and a Comparison to Other Clustering Algorithms Arthur Getis* and Jared Aldstadt** *San Diego State University **SDSU/UCSB
Spatial analysis. Spatial descriptive analysis. Spatial inferential analysis:
 Spatial analysis Spatial descriptive analysis Point pattern analysis (minimum bounding box, mean center, weighted mean center, standard distance, nearest neighbor analysis) Spatial clustering analysis
Roger S. Bivand Edzer J. Pebesma Virgilio Gömez-Rubio. Applied Spatial Data Analysis with R. 4:1 Springer
 Roger S. Bivand Edzer J. Pebesma Virgilio Gömez-Rubio Applied Spatial Data Analysis with R 4:1 Springer Contents Preface VII 1 Hello World: Introducing Spatial Data 1 1.1 Applied Spatial Data Analysis
NÁRODOHOSPODÁŘSKÝ OBZOR REVIEW OF ECONOMIC PERSPECTIVES, VOL. 10, ISSUE 4, 2010, pp , DOI: /v
 NÁRODOHOSPODÁŘSKÝ OBZOR REVIEW OF ECONOMIC PERSPECTIVES, VOL. 10, ISSUE 4, 2010, pp. 151 173, DOI: 10.2478/v10135-011-0003-1 INNOVATION PERFORMANCE OF THE CZECH REGIONS Vladimír Žítek Masaryk University,
Michael Harrigan Office hours: Fridays 2:00-4:00pm Holden Hall
 Announcement New Teaching Assistant Michael Harrigan Office hours: Fridays 2:00-4:00pm Holden Hall 209 Email: michael.harrigan@ttu.edu Guofeng Cao, Texas Tech GIST4302/5302, Lecture 2: Review of Map Projection
Exploratory Spatial Data Analysis of Regional Economic Disparities in Beijing during the Preparation Period of the 2008 Olympic Games
 Exploratory Spatial Data Analysis of Regional Economic Disparities in Beijing during the Preparation Period of the 2008 Olympic Games Xiaoyi Ma, Tao Pei Thursday, May 27, 2010 The State Key Laboratory
A spatial literacy initiative for undergraduate education at UCSB
 A spatial literacy initiative for undergraduate education at UCSB Mike Goodchild & Don Janelle Department of Geography / spatial@ucsb University of California, Santa Barbara ThinkSpatial Brown bag forum
Outline. Introduction to SpaceStat and ESTDA. ESTDA & SpaceStat. Learning Objectives. Space-Time Intelligence System. Space-Time Intelligence System
 Outline I Data Preparation Introduction to SpaceStat and ESTDA II Introduction to ESTDA and SpaceStat III Introduction to time-dynamic regression ESTDA ESTDA & SpaceStat Learning Objectives Activities
Lecture 5 Geostatistics
 Lecture 5 Geostatistics Lecture Outline Spatial Estimation Spatial Interpolation Spatial Prediction Sampling Spatial Interpolation Methods Spatial Prediction Methods Interpolating Raster Surfaces with
Global Spatial Autocorrelation Clustering
 Global Spatial Autocorrelation Clustering Luc Anselin http://spatial.uchicago.edu join count statistics Moran s I Moran scatter plot non-parametric spatial autocorrelation Join Count Statistics Recap -
Exploratory Spatial Data Analysis Using GeoDA: : An Introduction
 Exploratory Spatial Data Analysis Using GeoDA: : An Introduction Prepared by Professor Ravi K. Sharma, University of Pittsburgh Modified for NBDPN 2007 Conference Presentation by Professor Russell S. Kirby,
Everything is related to everything else, but near things are more related than distant things.
 SPATIAL ANALYSIS DR. TRIS ERYANDO, MA Everything is related to everything else, but near things are more related than distant things. (attributed to Tobler) WHAT IS SPATIAL DATA? 4 main types event data,
Geographical Information Systems Institute. Center for Geographic Analysis, Harvard University. GeoDa: Spatial Autocorrelation
 Geographical Information Systems Institute, A. Background From geodacenter.asu.edu: GeoDa is a free software program that serves as an introduction to spatial data analysis. OpenGeoDa is the cross-platform,
Identification of Regional Subcenters Using Spatial Data Analysis for Estimating Traffic Volume
 Identification of Regional Subcenters Using Spatial Data Analysis for Estimating Traffic Volume Fang Zhao and Nokil Park Lehman Center for Transportation Research Department of Civil & Env.. Engineering
Spatial Analysis with ArcGIS Pro STUDENT EDITION
 Spatial Analysis with ArcGIS Pro STUDENT EDITION Copyright 2018 Esri All rights reserved. Course version 2.0. Version release date November 2018. Printed in the United States of America. The information
OPEN GEODA WORKSHOP / CRASH COURSE FACILITATED BY M. KOLAK
 OPEN GEODA WORKSHOP / CRASH COURSE FACILITATED BY M. KOLAK WHAT IS GEODA? Software program that serves as an introduction to spatial data analysis Free Open Source Source code is available under GNU license
HUMAN CAPITAL CATEGORY INTERACTION PATTERN TO ECONOMIC GROWTH OF ASEAN MEMBER COUNTRIES IN 2015 BY USING GEODA GEO-INFORMATION TECHNOLOGY DATA
 International Journal of Civil Engineering and Technology (IJCIET) Volume 8, Issue 11, November 2017, pp. 889 900, Article ID: IJCIET_08_11_089 Available online at http://http://www.iaeme.com/ijciet/issues.asp?jtype=ijciet&vtype=8&itype=11
USER PREFERENCES IN IMAGE MAP USING
 USER PREFERENCES IN IMAGE MAP USING A. Vondráková *, V. Vozenilek Department of Geoinformatics, Faculty of Science, Palacký University Olomouc, 17. listopadu 50, 771 46 Olomouc, Czech Republic alena.vondrakova@upol.cz,
Exploring the Influence of Color Distance on the Map Legibility
 Exploring the Influence of Color Distance on the Map Legibility Alžběta Brychtová, Stanislav Popelka Department of Geoinformatics, Faculty of Science, Palacký University in Olomouc, Czech Republic Abstract.
CREATION OF DEM BY KRIGING METHOD AND EVALUATION OF THE RESULTS
 CREATION OF DEM BY KRIGING METHOD AND EVALUATION OF THE RESULTS JANA SVOBODOVÁ, PAVEL TUČEK* Jana Svobodová, Pavel Tuček: Creation of DEM by kriging method and evaluation of the results. Geomorphologia
SPATIAL LAG MODEL FOR APARTMENT PRICES IN PARDUBICE REGION
 SPATIAL LAG MODEL FOR APARTMENT PRICES IN PARDUBICE REGION POZDÍLKOVÁ Alena (CZ), MAREK Jaroslav (CZ) Abstract. The article is devoted to modelling the relationship of apartment prices between neighbouring
Spatial Filtering with EViews and MATLAB
 AUSTRIAN JOURNAL OF STATISTICS Volume 36 (2007), Number 1, 17 26 Spatial Filtering with EViews and MATLAB Robert Ferstl Vienna University of Economics and Business Administration Abstract: This article
GIS AND TERRITORIAL INTELLIGENCE. Using Microdata. Jean Dubé and Diègo Legros
 GIS AND TERRITORIAL INTELLIGENCE Spatial Econometrics Using Microdata Jean Dubé and Diègo Legros Spatial Econometrics Using Microdata To the memory of Gilles Dubé. For Mélanie, Karine, Philippe, Vincent
Spatial Modeling, Regional Science, Arthur Getis Emeritus, San Diego State University March 1, 2016
 Spatial Modeling, Regional Science, and UCSB Arthur Getis Emeritus, San Diego State University March 1, 2016 My Link to UCSB The 1980s at UCSB (summers and sabbatical) Problems within Geography: The Quantitative
BAYESIAN MODEL FOR SPATIAL DEPENDANCE AND PREDICTION OF TUBERCULOSIS
 BAYESIAN MODEL FOR SPATIAL DEPENDANCE AND PREDICTION OF TUBERCULOSIS Srinivasan R and Venkatesan P Dept. of Statistics, National Institute for Research Tuberculosis, (Indian Council of Medical Research),
Universitat Autònoma de Barcelona Facultat de Filosofia i Lletres Departament de Prehistòria Doctorat en arqueologia prehistòrica
 Universitat Autònoma de Barcelona Facultat de Filosofia i Lletres Departament de Prehistòria Doctorat en arqueologia prehistòrica FROM MICRO TO MACRO SPATIAL DYNAMICS IN THE VILLAGGIO DELLE MACINE BETWEEN
GIST 4302/5302: Spatial Analysis and Modeling Lecture 2: Review of Map Projections and Intro to Spatial Analysis
 GIST 4302/5302: Spatial Analysis and Modeling Lecture 2: Review of Map Projections and Intro to Spatial Analysis Guofeng Cao http://www.spatial.ttu.edu Department of Geosciences Texas Tech University guofeng.cao@ttu.edu
Measures of Spatial Dependence
 Measures of Spatial Dependence Carlos Hurtado Department of Economics University of Illinois at Urbana-Champaign hrtdmrt2@illinois.edu Junel 30th, 2016 C. Hurtado (UIUC - Economics) Spatial Econometrics
GIST 4302/5302: Spatial Analysis and Modeling
 GIST 4302/5302: Spatial Analysis and Modeling Lecture 2: Review of Map Projections and Intro to Spatial Analysis Guofeng Cao http://thestarlab.github.io Department of Geosciences Texas Tech University
Creating and Managing a W Matrix
 Creating and Managing a W Matrix Carlos Hurtado Department of Economics University of Illinois at Urbana-Champaign hrtdmrt2@illinois.edu Junel 22th, 2016 C. Hurtado (UIUC - Economics) Spatial Econometrics
Spatial and Temporal Geovisualisation and Data Mining of Road Traffic Accidents in Christchurch, New Zealand
 166 Spatial and Temporal Geovisualisation and Data Mining of Road Traffic Accidents in Christchurch, New Zealand Clive E. SABEL and Phil BARTIE Abstract This paper outlines the development of a method
Output: -Observed Mean Distance -Expected Mean Distance - Nearest Neighbor Index -Graphic report - Test variables:
 Clustering: global indexes (to measure the global degree of clustering for the whole set of events) -> methods based on quadrats (joint count) vs. on distances AVERAGE NEAREST NEIGHBOUR: the distance between
Where to Invest Affordable Housing Dollars in Polk County?: A Spatial Analysis of Opportunity Areas
 Resilient Neighborhoods Technical Reports and White Papers Resilient Neighborhoods Initiative 6-2014 Where to Invest Affordable Housing Dollars in Polk County?: A Spatial Analysis of Opportunity Areas
The importance of spatial sampling methods for their analysis results selected issues
 The importance of spatial sampling methods for their analysis results selected issues Jadwiga Suchecka 1 Abstract A space or an area is characterised by the specific data and the uncertainties inherent
Spatial Autocorrelation (2) Spatial Weights
 Spatial Weights") Spatial Autocorrelation (2) Spatial Weights Luc Anselin Spatial Analysis Laboratory Dept. Agricultural and Consumer Economics University of Illinois, Urbana-Champaign http://sal.agecon.uiuc.edu Outline
Spatial Autocorrelation (2) Spatial Weights Luc Anselin Spatial Analysis Laboratory Dept. Agricultural and Consumer Economics University of Illinois, Urbana-Champaign http://sal.agecon.uiuc.edu Outline
Visualize and interactively design weight matrices
 Visualize and interactively design weight matrices Angelos Mimis *1 1 Department of Economic and Regional Development, Panteion University of Athens, Greece Tel.: +30 6936670414 October 29, 2014 Summary
The role of neighbourhood in the regional distribution of Europe
 ZSÓFIA FÁBIÁN The role of neighbourhood in the regional distribution of Europe Introduction The role of geographical space in social and economic research has gained more importance, resulting in the increasing
Geometric Algorithms in GIS
 Geometric Algorithms in GIS GIS Software Dr. M. Gavrilova GIS System What is a GIS system? A system containing spatially referenced data that can be analyzed and converted to new information for a specific
Course overview full-time study
 Course overview full-time study Course title: Planning of Geoinformation Technologies Applications (PGITA) Course number: 548-0063 Supervising institute: Course guarantee: Institute of Geoinformatics doc.
The Implementation of Autocorrelation-Based Regioclassification in ArcMap Using ArcObjects
 140 The Implementation of Autocorrelation-Based Regioclassification in ArcMap Using ArcObjects Christoph MAYRHOFER Abstract Conventional methods for cartographic classification are often solely based on
ANALYSIS OF THE LABOUR MARKET IN METROPOLITAN AREAS: A SPATIAL FILTERING APPROACH
 QUAESTIONES GEOGRAPHICAE 31(2) 2012 ANALYSIS OF THE LABOUR MARKET IN METROPOLITAN AREAS: A SPATIAL FILTERING APPROACH Tomasz Kossowski, Jan Hauke Institute of Socio-Economic Geography and Spatial Management,
An Introduction to Spatial Autocorrelation and Kriging
 An Introduction to Spatial Autocorrelation and Kriging Matt Robinson and Sebastian Dietrich RenR 690 Spring 2016 Tobler and Spatial Relationships Tobler s 1 st Law of Geography: Everything is related to
A Spatial Analysis of the Farm Structural Change: The Case Study of Tuscany Region
 A Spatial Analysis of the Farm Structural Change: The Case Study of Tuscany Region Chiara Landi 1, Fabio Bartolini 2, Massimo Rovai 3 1 University of Pisa, chiara.landi@for.unipi.it 2 University of Pisa,
STATE AND DEVELOPMENT ANALYSIS OF HUMAN RESOURCES IN CZECH REGION SOUTH-WEST
 ACTA UNIVERSITATIS AGRICULTURAE ET SILVICULTURAE MENDELIANAE BRUNENSIS Volume LIX 41 Number 7, 2011 STATE AND DEVELOPMENT ANALYSIS OF HUMAN RESOURCES IN CZECH REGION SOUTH-WEST L. Svatošová Received: July
Spatial Statistics For Real Estate Data 1
 1 Key words: spatial heterogeneity, spatial autocorrelation, spatial statistics, geostatistics, Geographical Information System SUMMARY: The paper presents spatial statistics tools in application to real
Index. Geostatistics for Environmental Scientists, 2nd Edition R. Webster and M. A. Oliver 2007 John Wiley & Sons, Ltd. ISBN:
 Index Akaike information criterion (AIC) 105, 290 analysis of variance 35, 44, 127 132 angular transformation 22 anisotropy 59, 99 affine or geometric 59, 100 101 anisotropy ratio 101 exploring and displaying
Tracey Farrigan Research Geographer USDA-Economic Research Service
 Rural Poverty Symposium Federal Reserve Bank of Atlanta December 2-3, 2013 Tracey Farrigan Research Geographer USDA-Economic Research Service Justification Increasing demand for sub-county analysis Policy
International Summer School of Economic, Financial. and Management Studies
 International Summer School of Economic, Financial Date: 17. 6. 23. 6. 2018 and Management Studies Place: Faculty of Economics VŠB-TU Ostrava (VŠB-TUO, GPS: 49 83 67.07 N, 18 28 72.85 E) Registration:
Nature of Spatial Data. Outline. Spatial Is Special
 Nature of Spatial Data Outline Spatial is special Bad news: the pitfalls of spatial data Good news: the potentials of spatial data Spatial Is Special Are spatial data special? Why spatial data require
MODELING INCOME DISTRIBUTION OF HOUSEHOLDS IN THE REGIONS OF THE CZECH REPUBLIC
 MODELING INCOME DISTRIBUTION OF HOUSEHOLDS IN THE REGIONS OF THE CZECH REPUBLIC JITKA BARTOŠOVÁ, VLADISLAV BÍNA University of Economics, Prague, Faculty of Management, Department of Exact Methods, Jarošovská
Links between socio-economic and ethnic segregation at different spatial scales: a comparison between The Netherlands and Belgium
 Links between socio-economic and ethnic segregation at different spatial scales: a comparison between The Netherlands and Belgium Bart Sleutjes₁ & Rafael Costa₂ ₁ Netherlands Interdisciplinary Demographic
STARS: Space-Time Analysis of Regional Systems
 STARS: Space-Time Analysis of Regional Systems Sergio J. Rey Mark V. Janikas April 27, 2004 Abstract Space-Time Analysis of Regional Systems (STARS) is an open source package designed for dynamic exploratory
Spatial Trends of unpaid caregiving in Ireland
 Spatial Trends of unpaid caregiving in Ireland Stamatis Kalogirou 1,*, Ronan Foley 2 1. NCG Affiliate, Thoukididi 20, Drama, 66100, Greece; Tel: +30 6977 476776; Email: skalogirou@gmail.com; Web: http://www.gisc.gr.
A Spatial Econometric Approach to Model the Growth of Tourism Flows to China Cities
 April 15, 2010 AAG 2010 Conference, Washington DC A Spatial Econometric Approach to Model the Growth of Tourism Flows to China Cities Yang Yang University of Florida Kevin. K.F. Wong The Hong Kong Polytechnic
Variables and Variable De nitions
 APPENDIX A Variables and Variable De nitions All demographic county-level variables have been drawn directly from the 1970, 1980, and 1990 U.S. Censuses of Population, published by the U.S. Department
What s special about spatial data?
 What s special about spatial data? Road map Geographic Information analysis The need to develop spatial thinking Some fundamental geographic concepts (PBCS) What are the effects of space? Spatial autocorrelation
Spatial Data, Spatial Analysis and Spatial Data Science
 Spatial Data, Spatial Analysis and Spatial Data Science Luc Anselin http://spatial.uchicago.edu 1 spatial thinking in the social sciences spatial analysis spatial data science spatial data types and research
DIFFUSION AND DYNAMIC TREND OF SPATIAL DEPENDENCE
 Congreso de la Asociación Española de Ciencia Regional (XXX Reunión de Estudios Regionales) DIFFUSION AND DYNAMIC TREND OF SPATIAL DEPENDENCE LÓPEZ, F.A. (*) and C. CHASCO (**) (*) Department of Quantitative
Working Paper No Introduction to Spatial Econometric Modelling. William Mitchell 1. April 2013
 Working Paper No. 01-13 Introduction to Spatial Econometric Modelling William Mitchell 1 April 2013 Centre of Full Employment and Equity The University of Newcastle, Callaghan NSW 2308, Australia Home
Development of Integrated Spatial Analysis System Using Open Sources. Hisaji Ono. Yuji Murayama
 Development of Integrated Spatial Analysis System Using Open Sources Hisaji Ono PASCO Corporation 1-1-2, Higashiyama, Meguro-ku, TOKYO, JAPAN; Telephone: +81 (03)3421 5846 FAX: +81 (03)3421 5846 Email:
Representation of Geographic Data
 GIS 5210 Week 2 The Nature of Spatial Variation Three principles of the nature of spatial variation: proximity effects are key to understanding spatial variation issues of geographic scale and level of
This lab exercise will try to answer these questions using spatial statistics in a geographic information system (GIS) context.
 context.") by Introduction Problem Do the patterns of forest fires change over time? Do forest fires occur in clusters, and do the clusters change over time? Is this information useful in fighting forest fires? This
by Introduction Problem Do the patterns of forest fires change over time? Do forest fires occur in clusters, and do the clusters change over time? Is this information useful in fighting forest fires? This
Spatial Analysis and Modeling (GIST 4302/5302) Guofeng Cao Department of Geosciences Texas Tech University
 Guofeng Cao Department of Geosciences Texas Tech University") Spatial Analysis and Modeling (GIST 4302/5302) Guofeng Cao Department of Geosciences Texas Tech University TTU Graduate Certificate Geographic Information Science and Technology (GIST) 3 Core Courses and
Spatial Analysis and Modeling (GIST 4302/5302) Guofeng Cao Department of Geosciences Texas Tech University TTU Graduate Certificate Geographic Information Science and Technology (GIST) 3 Core Courses and
Lecture 8. Spatial Estimation
 Lecture 8 Spatial Estimation Lecture Outline Spatial Estimation Spatial Interpolation Spatial Prediction Sampling Spatial Interpolation Methods Spatial Prediction Methods Interpolating Raster Surfaces
Finding Hot Spots in ArcGIS Online: Minimizing the Subjectivity of Visual Analysis. Nicholas M. Giner Esri Parrish S.
 Finding Hot Spots in ArcGIS Online: Minimizing the Subjectivity of Visual Analysis Nicholas M. Giner Esri Parrish S. Henderson - FBI Agenda The subjectivity of maps What is Hot Spot Analysis? What is Outlier
Income Distribution Dynamics in The European Union: Exploring (In)Stability Measures within Geographical Clusters
Stability Measures within Geographical Clusters") Income Distribution Dynamics in The European Union: Exploring (In)Stability Measures within Geographical Clusters António Manuel Rodrigues 1 Introduction The study of regional inequalities between and
Income Distribution Dynamics in The European Union: Exploring (In)Stability Measures within Geographical Clusters António Manuel Rodrigues 1 Introduction The study of regional inequalities between and