MICRO-TOMOGRAPHY AND X-RAY ANALYSIS OF GEOLOGICAL SAMPLES
|
|
|
- Wilfred Robinson
- 5 years ago
- Views:
Transcription
1 THE PUBLISHING HOUSE PROCEEDINGS OF THE ROMANIAN ACADEMY, Series A, OF THE ROMANIAN ACADEMY Volume 18, Number 1/2017, pp MICRO-TOMOGRAPHY AND X-RAY ANALYSIS OF GEOLOGICAL SAMPLES Ion GRUIA University of Bucharest, Faculty of Physics, P.O. Box MG-11, RO , Bucharest-Magurele, Romania Corresponding author: Ion GRUIA, Abstract. The paper deals with the X-ray fluorescence (XRF) spectroscopy and the analysis of the elemental composition of geological samples (e.g. meteorite samples). The measurements were performed on several equipments to compare the results of sample elemental composition by using both X-ray and bremsstrahlung radiation. We designed a three-step analysis of the meteorite sample: (i) the initial XRF analysis, a non-destructive recognition in situ by micro-x-ray dispersive (μxrd) analysis to determine the mineralogical meteorite texture and to identify the features of interest followed by spatially correlated μxrd analysis, (ii) the XRF spectroscopy and the scanning electron microscopyenergy dispersive (SEM-EDX) analysis that is made in polished thin sections of the meteorite to know the mineralogical and the textural development, and finally (iii) the higher resolution mapping scanning electron microscopy on a smaller scale to correlate with the X-ray photoelectron spectroscopy (XPS) analysis of the meteorite sample. Key words: XRF, X-ray microtomography (XRT), Scanning Electron Microprobe, SEM-EDX, XPS. 1. INTRODUCTION When the electron beams interact with sample surfaces, it follows a series of signals that after being detected, amplified, and processed, allow us to obtain information on the morphology, structure, and composition of the samples. The signal obtained for imaging in a scanning electron microscopy (SEM) is not produced only from the surface of the sample analyzed. The electron beam penetrates a certain distance into the sample and can interact once or several times along its trajectory. The region of the sample between the original signal and the sub-sequential leakage that cannot be detected, is called the interaction volume [1, 2]. The resulting braking energy from these electrons is emitted in the form of X-ray photons that make up the continuous emission spectrum of the sample. The maximum intensity of continuous spectrum is determined by the acceleration voltage increase, the beam intensity, and the atomic number of the sample. The meteorite sample analysis was done by several spectral methods to investigate the complex situations that may occur because there is the possibility of overlapping peaks with close energies, which can seriously hinder the whole analysis. Many such overlaps can be separated by de-convolution calculation peaks, but other more difficult problems may occur, e. g. some of the elements that can generate overlaps are found only in very small amounts in the sample composition. Using the electronic data system (EDS), all characteristic X-ray energies are measured simultaneously incident on the detector, and data acquisition is therefore very fast from one end to the other end of the whole spectrum. This is important for trace analysis of chemical elements [3, 4]. 2. RESULTS AND DISCUSSION 2.1. The Micro-tomography and XRF analysis We investigate three samples (ms, mfs, mc) of meteorite volume of mm 3. 3D investigation was made by acquiring projections. The X-ray source-sample distance was 20 mm and the source-detector distance was 580 mm. The X-ray source has a W target operating system micro focus transmission, at 100 KV voltage and a current of 150 μa. Flat panel detector is of type Dexella with width of pixels, with

![. 1 and 2. Fig. 1 Experimental setup of micro-tomography method (http://tomography.inflpr.ro) [5]. Fig. 2 Photo of the non destructive method, to evaluate a X-ray fluorescence (XRF) technique (http://tomography.](/docs-images/82/86741996/images/2-1.jpg "inflpr.ro) [5].")

. Fig. 3 The tomography reconstruction. Fig. 4 Measured energy spectrum from surface sample ms.")

, respectively, to the right (3) (see Figs. 4 6). Fig. 5 Measured energy spectrum from surface sample mfs. Fig. 6 Measured energy spectrum from surface sample mc.")
2 2 Micro-tomography and X-ray analysis of geological samples 43 height of pixels, the pixel size of 74.8 μm, and ms integration time. The devices used in this study are mainly represented in Figs. 1 and 2. Fig. 1 Experimental setup of micro-tomography method ( [5]. Fig. 2 Photo of the non destructive method, to evaluate a X-ray fluorescence (XRF) technique ( [5]. Positioning and turning around of the sample are ensured by a set of seven high-precision motorized micrometric manipulators. Automation, control, and data acquisition were obtained by means of an in-house software package. The tomography reconstruction for the cone-beam scanning is based on an optimized implementation of the modified cone-beam filtered back-projection algorithm (see Fig. 3). Fig. 3 The tomography reconstruction. Fig. 4 Measured energy spectrum from surface sample ms. The combination of analytical techniques used in the present study was useful for the following reasons: they are well suited in terms of the identification and location of inorganic elements in the meteorite sample. The corresponding graphs for the three investigated samples are obtained in the central area on the surface (1) and at a distance of 1 mm to the left (2), respectively, to the right (3) (see Figs. 4 6). Fig. 5 Measured energy spectrum from surface sample mfs. Fig. 6 Measured energy spectrum from surface sample mc. It was determined that the X-ray micro tomography (XRT) is a powerful technique to observe on extended volumes the morphology, the alignment, and the local bulk density in samples.


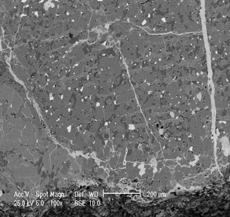
3 44 Ion GRUIA The EDX analysis The EDX spectrometers can be programmed to analyse the X-ray energy-dispersive spectrum while scanning the sample with the electron beam and with the possibility of obtaining results of compositional quality and quantity for a single point on the surface from a selected direction (the linear profile). Distributions across the entire surface of the analyzed chemical elements are also obtained. The very high efficiency and the uniform energy-dispersive analyses constitute the great advantage of these systems. The material used in the present study was a bulk meteorite sliced into 10 plaques 1 mm thick and polished on both facets. So we got to study 20 polished surfaces, which are equidistant with a 1 mm step in order to get the component elements in the meteorite sample volume. Experimental data for the EDX spectra were obtained in laboratories of various institutes (The National Institute for Laser, Plasma & Radiation Physics: INFLPR, National Institute for Materials Physics: NIMP, University Polytechnic of Bucharest: UPB, National Institute for Research and Development in Microtechnologies: IMT-Bucharest). In general, the results obtained in scanning electron microscopy are only qualitative ones. However, we can take measurements of length, height, and depth of the micro details of relief and we can provide some angular relationships between topographic elements using stereoscopic image pairs. Such stereo-pairs are two micrographs of the same area taken before and after a slight change of angle of the sample (4 6 ). Overlapping images into a stereo binocular allow us both obtaining the three-dimensional representation of the structure and the evaluation of geometrical parameters. The experimental setup and the X-ray spectra used for the EDX analysis are shown in Figs Fig. 7 X-ray emission spectrum in the center of sample. Fig. 8 Investigated the meteorite sample surface (INFLPR). C K W t (%) 10 1 O K Na K Mg K Al K Si K Mo L S K Ca K Cr K Fe K Ni K d (mm) Fig. 9 The distribution of elements on the surface of plane samples depending on the distance d in volume meteorite. Fig. 10 The certificate of origin of the meteorite. The experimental EDX data for 20 polished surfaces, which are equidistant with a 1 mm step are summarized in Table 1 and are shown graphically in Fig. 9.
 C K O K Na K Mg K Al K")


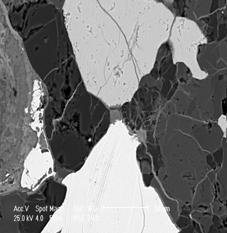
4 4 Micro-tomography and X-ray analysis of geological samples 45 Table 1 Experimental EDX data for the estimation of elements content in the meteorite Elem Wt % d(mm) C K O K Na K Mg K Al K Si K Mo L S K Ca K Cr K Fe K Ni K Total Fig. 11 EDX images of meteorite for different magnitude (NIMP). The experimental EDX data for different magnitudes are summarized in Table 2. Table 2 Experimental data for the EDXRF estimation of elements in meteorite for different magnitudes (Fig. 11) Elem Ni K Fe K Si K S K Ca K Wt % Mg K Al L Na K Cr K O K P K N k C K Total


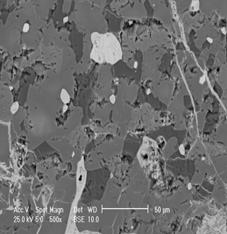
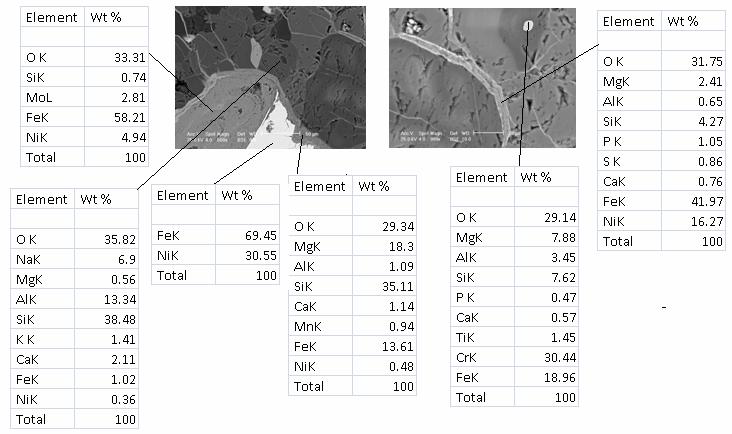
5 46 Ion GRUIA 5 Fig. 12 EDX element mapping in the meteorite (NIMP). Fig. 13 EDX images of meteorite for different magnitudes (UPB).


. 2.3.")


6 6 Micro-tomography and X-ray analysis of geological samples 47 Fig. 14 EDX element mapping in the meteorite (UPB). Fig. 15 EDX images of meteorite for different magnitude (IMT) The XPS analysis X-ray photoelectron spectroscopy (XPS) is a spectroscopic technique based on photoelectric effect that measures the elemental composition, valence state, and electronic state of the elements that exist within a material. For XPS measurements, as accurate as possible, it is necessary to apply strict working procedures regarding sample preparation, instrument calibration, and processing of the obtained spectra. These procedures are described
7 48 Ion GRUIA 7 in international standards and are required if we wish to obtain an accurate analysis. The XPS instrument measures the kinetic energy of all collected electrons. The electron signal includes contributions from both photoelectron and Auger electron lines. Surface analysis by XPS requires irradiating a solid in an ultra-high vacuum (UHV) chamber with mono-energetic soft X-rays and analyzing the energies of the emitted electrons [6]. Fig. 16 XPS spectrum of meteorite for different energy ranges (NIMP). Fig. 17 XPS spectrum of meteorite for different chemical elements (NIMP). The experimental XPS data are summarized in Figs. 16 and CONCLUSIONS In this paper we analyzed several pieces of a meteorite through photo and energy dispersion X-ray fluorescence (EDX) by using various analytical techniques and experimental methods. Combination of analytical techniques used in the present study was useful for the identification and location of inorganic elements in the meteorite sample. It is shown that X-ray micro tomography (XRT) is a powerful technique to observe on
8 8 Micro-tomography and X-ray analysis of geological samples 49 extended volumes the morphology, alignment, and local bulk density in meteorite samples. Tomo-analytic combines a 3D X-ray micro-tomography with a micro beam fluorescence system. The micro beam fluorescence component is a configurable elemental composition mapping tool, including optical X-ray beam collimation. It is proved that the tomography analysis provides a substantial new information about pore connectivity. The photo-edx and SEM analyses indicate that all components of the meteorite are clearly delimitated. Further complementary results might be achieved on this meteorite sample by other related analytical techniques. Geological analysis of materials from diverse terrestrial environments and meteorites are investigated because they often retain excellent records relating to past processes such as earth genesis, climate change, and extreme events. ACKNOWLEDGMENTS The author wishes to thank many colleagues from the research laboratories institutes: INFLPR, NIMP, UPB, and IMT-Bucharest for the preparation of samples and for the related measurements. REFERENCES 1. B.M. SIEGEL, D.R. BEAMAN, Physical Aspects of Electron Microscopy and Microbeam Analysis, New York, John Willey, C.E. LYMAN et al., Scanning Electron Microscopy, X-Ray Microanalysis and Analytical Electron Microscopy (A Laboratory Workbook), Plenum Press, New-York, S.J.B. REED, Electron Probe Microanalysis, 2 nd ed., Cambridge University Press, V.D. SCOTT, G. LOVE, S.J.B. REED, Quantitative Electron-Probe Microanalysis, 2 nd ed., Ellis Horwood Limited, Hemel Hempstead, Hertfordshire, England, Received June 6, 2016
MT Electron microscopy Scanning electron microscopy and electron probe microanalysis
 MT-0.6026 Electron microscopy Scanning electron microscopy and electron probe microanalysis Eero Haimi Research Manager Outline 1. Introduction Basics of scanning electron microscopy (SEM) and electron
EDS User School. Principles of Electron Beam Microanalysis
 EDS User School Principles of Electron Beam Microanalysis Outline 1.) Beam-specimen interactions 2.) EDS spectra: Origin of Bremsstrahlung and characteristic peaks 3.) Moseley s law 4.) Characteristic
MT Electron microscopy Scanning electron microscopy and electron probe microanalysis
 MT-0.6026 Electron microscopy Scanning electron microscopy and electron probe microanalysis Eero Haimi Research Manager Outline 1. Introduction Basics of scanning electron microscopy (SEM) and electron
Analysis of Cadmium (Cd) in Plastic Using X-ray Fluorescence Spectroscopy
 in Plastic Using X-ray Fluorescence Spectroscopy") Analysis of Cadmium (Cd) in Plastic Using X-ray Fluorescence Spectroscopy Hiroshi Onodera Application & Research Center, JEOL Ltd. Introduction um, PBB and PBDE) are subject to usage restrictions in Europe.
Analysis of Cadmium (Cd) in Plastic Using X-ray Fluorescence Spectroscopy Hiroshi Onodera Application & Research Center, JEOL Ltd. Introduction um, PBB and PBDE) are subject to usage restrictions in Europe.
Overview of X-Ray Fluorescence Analysis
 Overview of X-Ray Fluorescence Analysis AMPTEK, INC., Bedford, MA 01730 Ph: +1 781 275 2242 Fax: +1 781 275 3470 sales@amptek.com 1 What is X-Ray Fluorescence (XRF)? A physical process: Emission of characteristic
MS482 Materials Characterization ( 재료분석 ) Lecture Note 4: XRF
 Lecture Note 4: XRF") 2016 Fall Semester MS482 Materials Characterization ( 재료분석 ) Lecture Note 4: XRF Byungha Shin Dept. of MSE, KAIST 1 Course Information Syllabus 1. Overview of various characterization techniques (1 lecture)
2016 Fall Semester MS482 Materials Characterization ( 재료분석 ) Lecture Note 4: XRF Byungha Shin Dept. of MSE, KAIST 1 Course Information Syllabus 1. Overview of various characterization techniques (1 lecture)
Advanced Lab Course. X-Ray Photoelectron Spectroscopy 1 INTRODUCTION 1 2 BASICS 1 3 EXPERIMENT Qualitative analysis Chemical Shifts 7
 Advanced Lab Course X-Ray Photoelectron Spectroscopy M210 As of: 2015-04-01 Aim: Chemical analysis of surfaces. Content 1 INTRODUCTION 1 2 BASICS 1 3 EXPERIMENT 3 3.1 Qualitative analysis 6 3.2 Chemical
Methods of surface analysis
 Methods of surface analysis Nanomaterials characterisation I RNDr. Věra Vodičková, PhD. Surface of solid matter: last monoatomic layer + absorbed monolayer physical properties are effected (crystal lattice
Photoemission Spectroscopy
 FY13 Experimental Physics - Auger Electron Spectroscopy Photoemission Spectroscopy Supervisor: Per Morgen SDU, Institute of Physics Campusvej 55 DK - 5250 Odense S Ulrik Robenhagen,
Chapter 9. Electron mean free path Microscopy principles of SEM, TEM, LEEM
 Chapter 9 Electron mean free path Microscopy principles of SEM, TEM, LEEM 9.1 Electron Mean Free Path 9. Scanning Electron Microscopy (SEM) -SEM design; Secondary electron imaging; Backscattered electron
X-Ray Photoelectron Spectroscopy (XPS)
") X-Ray Photoelectron Spectroscopy (XPS) Louis Scudiero http://www.wsu.edu/~scudiero; 5-2669 Electron Spectroscopy for Chemical Analysis (ESCA) The basic principle of the photoelectric effect was enunciated
X-Ray Photoelectron Spectroscopy (XPS) Louis Scudiero http://www.wsu.edu/~scudiero; 5-2669 Electron Spectroscopy for Chemical Analysis (ESCA) The basic principle of the photoelectric effect was enunciated
Chemistry 311: Instrumentation Analysis Topic 2: Atomic Spectroscopy. Chemistry 311: Instrumentation Analysis Topic 2: Atomic Spectroscopy
 Topic 2b: X-ray Fluorescence Spectrometry Text: Chapter 12 Rouessac (1 week) 4.0 X-ray Fluorescence Download, read and understand EPA method 6010C ICP-OES Winter 2009 Page 1 Atomic X-ray Spectrometry Fundamental
X-Ray Photoelectron Spectroscopy (XPS)
") X-Ray Photoelectron Spectroscopy (XPS) Louis Scudiero http://www.wsu.edu/~scudiero; 5-2669 Fulmer 261A Electron Spectroscopy for Chemical Analysis (ESCA) The basic principle of the photoelectric effect
X-Ray Photoelectron Spectroscopy (XPS) Louis Scudiero http://www.wsu.edu/~scudiero; 5-2669 Fulmer 261A Electron Spectroscopy for Chemical Analysis (ESCA) The basic principle of the photoelectric effect
An Introduction to Auger Electron Spectroscopy
 An Introduction to Auger Electron Spectroscopy Spyros Diplas MENA3100 SINTEF Materials & Chemistry, Department of Materials Physics & Centre of Materials Science and Nanotechnology, Department of Chemistry,
Electron probe microanalysis - Electron microprobe analysis EPMA (EMPA) What s EPMA all about? What can you learn?
 What s EPMA all about? What can you learn?") Electron probe microanalysis - Electron microprobe analysis EPMA (EMPA) What s EPMA all about? What can you learn? EPMA - what is it? Precise and accurate quantitative chemical analyses of micron-size
Electron probe microanalysis - Electron microprobe analysis EPMA (EMPA) What s EPMA all about? What can you learn? EPMA - what is it? Precise and accurate quantitative chemical analyses of micron-size
raw materials C V Mn Mg S Al Ca Ti Cr Si G H Nb Na Zn Ni K Co A B C D E F
 Today s advanced batteries require a range of specialized analytical tools to better understand the electrochemical processes that occur during battery cycling. Evans Analytical Group (EAG) offers a wide-range
Auger Electron Spectroscopy (AES)
") 1. Introduction Auger Electron Spectroscopy (AES) Silvia Natividad, Gabriel Gonzalez and Arena Holguin Auger Electron Spectroscopy (Auger spectroscopy or AES) was developed in the late 1960's, deriving
1. Introduction Auger Electron Spectroscopy (AES) Silvia Natividad, Gabriel Gonzalez and Arena Holguin Auger Electron Spectroscopy (Auger spectroscopy or AES) was developed in the late 1960's, deriving
Auger Electron Spectroscopy Overview
 Auger Electron Spectroscopy Overview Also known as: AES, Auger, SAM 1 Auger Electron Spectroscopy E KLL = E K - E L - E L AES Spectra of Cu EdN(E)/dE Auger Electron E N(E) x 5 E KLL Cu MNN Cu LMM E f E
Secondary Ion Mass Spectrometry (SIMS)
") CHEM53200: Lecture 10 Secondary Ion Mass Spectrometry (SIMS) Major reference: Surface Analysis Edited by J. C. Vickerman (1997). 1 Primary particles may be: Secondary particles can be e s, neutral species
CHEM53200: Lecture 10 Secondary Ion Mass Spectrometry (SIMS) Major reference: Surface Analysis Edited by J. C. Vickerman (1997). 1 Primary particles may be: Secondary particles can be e s, neutral species
Particle-Induced X-Ray Emission Spectrometry (PIXE)
") Particle-Induced X-Ray Emission Spectrometry (PIXE) Edited by SVEN A. E. JOHANSSON Department of Nuclear Physics Lund Institute of Technology Lund, Sweden JOHN L. CAMPBELL Department of Physics University
Particle-Induced X-Ray Emission Spectrometry (PIXE) Edited by SVEN A. E. JOHANSSON Department of Nuclear Physics Lund Institute of Technology Lund, Sweden JOHN L. CAMPBELL Department of Physics University
CHARACTERIZATION of NANOMATERIALS KHP
 CHARACTERIZATION of NANOMATERIALS Overview of the most common nanocharacterization techniques MAIN CHARACTERIZATION TECHNIQUES: 1.Transmission Electron Microscope (TEM) 2. Scanning Electron Microscope
Inelastic soft x-ray scattering, fluorescence and elastic radiation
 Inelastic soft x-ray scattering, fluorescence and elastic radiation What happens to the emission (or fluorescence) when the energy of the exciting photons changes? The emission spectra (can) change. One
Praktikum zur. Materialanalytik
 Praktikum zur Materialanalytik Energy Dispersive X-ray Spectroscopy B513 Stand: 19.10.2016 Contents 1 Introduction... 2 2. Fundamental Physics and Notation... 3 2.1. Alignments of the microscope... 3 2.2.
Gaetano L Episcopo. Scanning Electron Microscopy Focus Ion Beam and. Pulsed Plasma Deposition
 Gaetano L Episcopo Scanning Electron Microscopy Focus Ion Beam and Pulsed Plasma Deposition Hystorical background Scientific discoveries 1897: J. Thomson discovers the electron. 1924: L. de Broglie propose
X-ray Photoelectron Spectroscopy/ Electron spectroscopy for chemical analysis (ESCA), By Francis Chindeka
, By Francis Chindeka") X-ray Photoelectron Spectroscopy/ Electron spectroscopy for chemical analysis (ESCA), By Francis Chindeka X-ray photoelectron spectroscopy (XPS) or Electron spectroscopy for chemical analysis (ESCA), Surface
X-ray Photoelectron Spectroscopy/ Electron spectroscopy for chemical analysis (ESCA), By Francis Chindeka X-ray photoelectron spectroscopy (XPS) or Electron spectroscopy for chemical analysis (ESCA), Surface
Lecture 5. X-ray Photoemission Spectroscopy (XPS)
") Lecture 5 X-ray Photoemission Spectroscopy (XPS) 5. Photoemission Spectroscopy (XPS) 5. Principles 5.2 Interpretation 5.3 Instrumentation 5.4 XPS vs UV Photoelectron Spectroscopy (UPS) 5.5 Auger Electron
Lecture 5 X-ray Photoemission Spectroscopy (XPS) 5. Photoemission Spectroscopy (XPS) 5. Principles 5.2 Interpretation 5.3 Instrumentation 5.4 XPS vs UV Photoelectron Spectroscopy (UPS) 5.5 Auger Electron
A Brief Introduction to Medical Imaging. Outline
 A Brief Introduction to Medical Imaging Outline General Goals Linear Imaging Systems An Example, The Pin Hole Camera Radiations and Their Interactions with Matter Coherent vs. Incoherent Imaging Length
Massachusetts Institute of Technology. Dr. Nilanjan Chatterjee
 Massachusetts Institute of Technology Dr. Nilanjan Chatterjee Electron Probe Micro-Analysis (EPMA) Imaging and micrometer-scale chemical compositional analysis of solids Signals produced in The Electron
X-Ray Photoelectron Spectroscopy (XPS)-2
-2") X-Ray Photoelectron Spectroscopy (XPS)-2 Louis Scudiero http://www.wsu.edu/~scudiero; 5-2669 Fulmer 261A Electron Spectroscopy for Chemical Analysis (ESCA) The 3 step model: 1.Optical excitation 2.Transport
X-Ray Photoelectron Spectroscopy (XPS)-2 Louis Scudiero http://www.wsu.edu/~scudiero; 5-2669 Fulmer 261A Electron Spectroscopy for Chemical Analysis (ESCA) The 3 step model: 1.Optical excitation 2.Transport
Nanoelectronics 09. Atsufumi Hirohata Department of Electronics. Quick Review over the Last Lecture
 Nanoelectronics 09 Atsufumi Hirohata Department of Electronics 13:00 Monday, 12/February/2018 (P/T 006) Quick Review over the Last Lecture ( Field effect transistor (FET) ): ( Drain ) current increases
Latest advances in identifying mineral composition variation by the M4 TORNADO AMICS
 Latest advances in identifying mineral composition variation by the M4 TORNADO AMICS Bruker Nano Analytics, Berlin, Germany Webinar, June 15, 2017 Innovation with Integrity Presenters Samuel Scheller Sr.
CHEM*3440. X-Ray Energies. Bremsstrahlung Radiation. X-ray Line Spectra. Chemical Instrumentation. X-Ray Spectroscopy. Topic 13
 X-Ray Energies very short wavelength radiation 0.1Å to 10 nm (100 Å) CHEM*3440 Chemical Instrumentation Topic 13 X-Ray Spectroscopy Visible - Ultraviolet (UV) - Vacuum UV (VUV) - Extreme UV (XUV) - Soft
Scanning Electron Microscopy & Ancillary Techniques
 Scanning Electron Microscopy & Ancillary Techniques By Pablo G. Caceres-Valencia The prototype of the first Stereoscan supplied by the Cambridge Instrument Company to the dupont Company, U.S.A. (1965)
PHI 5000 Versaprobe-II Focus X-ray Photo-electron Spectroscopy
 PHI 5000 Versaprobe-II Focus X-ray Photo-electron Spectroscopy The very basic theory of XPS XPS theroy Surface Analysis Ultra High Vacuum (UHV) XPS Theory XPS = X-ray Photo-electron Spectroscopy X-ray
MSE 321 Structural Characterization
 Auger Spectroscopy Auger Electron Spectroscopy (AES) Scanning Auger Microscopy (SAM) Incident Electron Ejected Electron Auger Electron Initial State Intermediate State Final State Physical Electronics
Standardless Analysis by XRF but I don t know what s in my sample!! Dr Colin Slater Applications Scientist, XRF Bruker UK Limited
 by XRF but I don t know what s in my sample!! Dr Colin Slater Applications Scientist, XRF Bruker UK Limited XRF Standardless Analysis In this talk What is meant by standardless analysis? Fundamental Parameters
NUCLEAR TRANSMUTATION IN DEUTERED PD FILMS IRRADIATED BY AN UV LASER
 Castellano, et al. Nuclear Transmutation in Deutered Pd Films Irradiated by an UV Laser. in 8th International Conference on Cold Fusion. 2000. Lerici (La Spezia), Italy: Italian Physical Society, Bologna,
ICP-3000 Inductively Coupled Plasma Optical Emission Spectrometer
 Inductively Coupled Plasma Optical Emission Spectrometer Inductively Coupled Plasma Optical Emission Spectrometer Inductively Coupled Plasma Optical Emission Spectrometer is powerful simultaneous full
MS482 Materials Characterization ( 재료분석 ) Lecture Note 2: UPS
 Lecture Note 2: UPS") 2016 Fall Semester MS482 Materials Characterization ( 재료분석 ) Lecture Note 2: UPS Byungha Shin Dept. of MSE, KAIST 1 Course Information Syllabus 1. Overview of various characterization techniques (1 lecture)
2016 Fall Semester MS482 Materials Characterization ( 재료분석 ) Lecture Note 2: UPS Byungha Shin Dept. of MSE, KAIST 1 Course Information Syllabus 1. Overview of various characterization techniques (1 lecture)
Surface Sensitivity & Surface Specificity
 Surface Sensitivity & Surface Specificity The problems of sensitivity and detection limits are common to all forms of spectroscopy. In its simplest form, the question of sensitivity boils down to whether
X-Ray Photoelectron Spectroscopy (XPS) Auger Electron Spectroscopy (AES)
 Auger Electron Spectroscopy (AES)") X-Ray Photoelectron Spectroscopy (XPS) Auger Electron Spectroscopy (AES) XPS X-ray photoelectron spectroscopy (XPS) is one of the most used techniques to chemically characterize the surface. Also known
X-Ray Photoelectron Spectroscopy (XPS) Auger Electron Spectroscopy (AES) XPS X-ray photoelectron spectroscopy (XPS) is one of the most used techniques to chemically characterize the surface. Also known
EDS Mapping. Ian Harvey Fall Practical Electron Microscopy
 EDS Mapping Ian Harvey Fall 2008 1 From: Energy Dispersive X-ray Microanalysis, An Introduction Kevex Corp. 1988 Characteristic X-ray generation p.2 1 http://www.small-world.net/efs.htm X-ray generation
Transmission Electron Microscopy
 L. Reimer H. Kohl Transmission Electron Microscopy Physics of Image Formation Fifth Edition el Springer Contents 1 Introduction... 1 1.1 Transmission Electron Microscopy... 1 1.1.1 Conventional Transmission
Atomic and Nuclear Analytical Methods
 H.R. Verma Atomic and Nuclear Analytical Methods XRF, Mössbauer, XPS, NAA and Ion-Beam Spectroscopic Techniques With 128 Figures and 24 Tables Springer Contents 1 X-ray Fluorescence (XRF) and Particle-Induced
Determination of Ambient Dose Equivalent at INFLPR 7 MeV Linear Accelerator
 Determination of Ambient Dose quivalent at INFLPR 7 MeV Linear Accelerator F. Scarlat, A. Scarisoreanu, M. Oane,. Badita,. Mitru National Institute for Laser, Plasma and Radiation Physics - INFLPR, Bucharest-Magurele,
A DIVISION OF ULVAC-PHI
 A DIVISION OF ULVAC-PHI X-ray photoelectron spectroscopy (XPS/ESCA) is the most widely used surface analysis technique and has many well established industrial and research applications. XPS provides
Student Projects for
 MINERALS RESOURCES Student Projects for 2016-17 The CSIRO On-line Analysis (OLA) Group offers opportunities for students to undertake applied physics research projects at our Lucas Heights laboratories.
Analytical Methods for Materials
 Analytical Methods for Materials Lesson 21 Electron Microscopy and X-ray Spectroscopy Suggested Reading Leng, Chapter 3, pp. 83-126; Chapter 4, pp. 127-160; Chapter 6, pp. 191-219 P.J. Goodhew, J. Humphreys
h p λ = mν Back to de Broglie and the electron as a wave you will learn more about this Equation in CHEM* 2060
 Back to de Broglie and the electron as a wave λ = mν h = h p you will learn more about this Equation in CHEM* 2060 We will soon see that the energies (speed for now if you like) of the electrons in the
Micro-XRF excitation in an SEM
 X-RAY SPECTROMETRY X-Ray Spectrom. 2007; 36: 254 259 Published online 8 May 2007 in Wiley InterScience (www.interscience.wiley.com).974 Micro-XRF excitation in an SEM M. Haschke, 1 F. Eggert 2 andw.t.elam
XUV 773: X-Ray Fluorescence Analysis of Gemstones
 Fischer Application report vr118 HELM UT FISCHER GMBH + CO. KG Institut für Elektronik und Messtechnik Industriestrasse 21-7169 Sindelfingen, Germany Tel.: (+49) 731 33- - Fax: (+49) 731 33-79 E-Mail:
ToF-SIMS or XPS? Xinqi Chen Keck-II
 ToF-SIMS or XPS? Xinqi Chen Keck-II 1 Time of Flight Secondary Ion Mass Spectrometry (ToF-SIMS) Not ToF MS (laser, solution) X-ray Photoelectron Spectroscopy (XPS) 2 3 Modes of SIMS 4 Secondary Ion Sputtering
In-Situ Analysis of Traces, Minor and Major Elements in Rocks and Soils with a Portable XRF Spectrometer*
 In-Situ Analysis of Traces, Minor and Major Elements in Rocks and Soils with a Portable XRF Spectrometer* Anthony Thomas 1, Joachim Heckel 1, and Dirk Wissmann 1 Search and Discovery Article #41836 (2016)
Advanced Spectroscopy Laboratory
 Advanced Spectroscopy Laboratory - Raman Spectroscopy - Emission Spectroscopy - Absorption Spectroscopy - Raman Microscopy - Hyperspectral Imaging Spectroscopy FERGIELAB TM Raman Spectroscopy Absorption
How Does It All Work? A Summary of the IDEAS Beamline at the Canadian Light Source
 How Does It All Work? A Summary of the IDEAS Beamline at the Canadian Light Source What Makes Up The Canadian Light Source? 4. Storage Ring 5. Synchrotron Light 6. Beamline 1. Electron Gun 2. Linear Accelerator
The Use of Synchrotron Radiation in Modern Research
 The Use of Synchrotron Radiation in Modern Research Physics Chemistry Structural Biology Materials Science Geochemical and Environmental Science Atoms, molecules, liquids, solids. Electronic and geometric
X-RAY SPECTRA. Theory:
 12 Oct 18 X-ray.1 X-RAY SPECTRA In this experiment, a number of measurements involving x-rays will be made. The spectrum of x-rays emitted from a molybdenum target will be measured, and the experimental
HOW TO APPROACH SCANNING ELECTRON MICROSCOPY AND ENERGY DISPERSIVE SPECTROSCOPY ANALYSIS. SCSAM Short Course Amir Avishai
 HOW TO APPROACH SCANNING ELECTRON MICROSCOPY AND ENERGY DISPERSIVE SPECTROSCOPY ANALYSIS SCSAM Short Course Amir Avishai RESEARCH QUESTIONS Sea Shell Cast Iron EDS+SE Fe Cr C Objective Ability to ask the
In Situ Analysis of Geochemistry and Mineralogy on the Venus Surface
 In Situ Analysis of Geochemistry and Mineralogy on the Venus Surface M. Darby Dyar Mount Holyoke College University of Massachusetts Planetary Science Institute Slide 1 1 Possibilities for Venus In-Situ
Supporting Information s for
 Supporting Information s for # Self-assembling of DNA-templated Au Nanoparticles into Nanowires and their enhanced SERS and Catalytic Applications Subrata Kundu* and M. Jayachandran Electrochemical Materials
Activities at the Laboratory of the Nuclear Engineering Department of the Polytechnic University of Valencia
 7 th Workshop on European Collaboration for Higher Education and Research in Nuclear Engineering & Radiological Protection Bruxelles, Belgique 30 May - 1 June 2011 Activities at the Laboratory of the Nuclear
Two-dimensional homologous perovskites as light absorbing materials for solar cell applications
 Supporting Information for Two-dimensional homologous perovskites as light absorbing materials for solar cell applications Duyen H. Cao, Constantinos C. Stoumpos, Omar K. Farha,, Joseph T. Hupp, and Mercouri
FUNDAMENTAL PARAMETER METHOD FOR THE LOW ENERGY REGION INCLUDING CASCADE EFFECT AND PHOTOELECTRON EXCITATION
 Copyright (c)jcpds-international Centre for Diffraction Data 2002, Advances in X-ray Analysis, Volume 45. 511 FUNDAMENTAL PARAMETER METHOD FOR THE LOW ENERGY REGION INCLUDING CASCADE EFFECT AND PHOTOELECTRON
X-ray uorescence, X-ray powder diraction and Raman spectrosopy
 X-ray uorescence, X-ray powder diraction and Raman spectrosopy Wubulikasimu Yibulayin, Lovro Pavleti, Kuerbannisa Muhetaer 12.05.2016. Abstract In this report we report about the experiments that were
Auger Electron Spectroscopy (AES) Prof. Paul K. Chu
 Prof. Paul K. Chu") Auger Electron Spectroscopy (AES) Prof. Paul K. Chu Auger Electron Spectroscopy Introduction Principles Instrumentation Qualitative analysis Quantitative analysis Depth profiling Mapping Examples The Auger
Auger Electron Spectroscopy (AES) Prof. Paul K. Chu Auger Electron Spectroscopy Introduction Principles Instrumentation Qualitative analysis Quantitative analysis Depth profiling Mapping Examples The Auger
4. How can fragmentation be useful in identifying compounds? Permits identification of branching not observed in soft ionization.
 Homework 9: Chapters 20-21 Assigned 12 April; Due 17 April 2006; Quiz on 19 April 2006 Chap. 20 (Molecular Mass Spectroscopy) Chap. 21 (Surface Analysis) 1. What are the types of ion sources in molecular
Electron and electromagnetic radiation
 Electron and electromagnetic radiation Generation and interactions with matter Stimuli Interaction with sample Response Stimuli Waves and energy The energy is propotional to 1/λ and 1/λ 2 λ λ 1 Electromagnetic
MSE 321 Structural Characterization
 Auger Spectroscopy Auger Electron Spectroscopy (AES) Scanning Auger Microscopy (SAM) Incident Electron Ejected Electron Auger Electron Initial State Intermediate State Final State Physical Electronics
Generation of X-Rays in the SEM specimen
 Generation of X-Rays in the SEM specimen The electron beam generates X-ray photons in the beam-specimen interaction volume beneath the specimen surface. Some X-ray photons emerging from the specimen have
Basic physics Questions
 Chapter1 Basic physics Questions S. Ilyas 1. Which of the following statements regarding protons are correct? a. They have a negative charge b. They are equal to the number of electrons in a non-ionized
Experiment objectives: measure the ratio of Planck s constant to the electron charge h/e using the photoelectric effect.
 Chapter 1 Photoelectric Effect Experiment objectives: measure the ratio of Planck s constant to the electron charge h/e using the photoelectric effect. History The photoelectric effect and its understanding
CALCULATION METHODS OF X-RAY SPECTRA: A COMPARATIVE STUDY
 Copyright -International Centre for Diffraction Data 2010 ISSN 1097-0002 CALCULATION METHODS OF X-RAY SPECTRA: A COMPARATIVE STUDY B. Chyba, M. Mantler, H. Ebel, R. Svagera Technische Universit Vienna,
Supporting Information. For. Preparation and Characterization of Highly Planar Flexible Silver
 Supporting Information For Preparation and Characterization of Highly Planar Flexible Silver Crystal Belts Dharmesh Varade and Kazutoshi Haraguchi* [*] Dr. K. Haraguchi (Corresponding-Author), Dr. D. Varade
Visualization of Xe and Sn Atoms Generated from Laser-Produced Plasma for EUV Light Source
 3rd International EUVL Symposium NOVEMBER 1-4, 2004 Miyazaki, Japan Visualization of Xe and Sn Atoms Generated from Laser-Produced Plasma for EUV Light Source H. Tanaka, A. Matsumoto, K. Akinaga, A. Takahashi
Spectroscopy on Mars!
 Spectroscopy on Mars! Pathfinder Spirit and Opportunity Real World Friday H2A The Mars Pathfinder: Geological Elemental Analysis On December 4th, 1996, the Mars Pathfinder was launched from earth to begin
X- ray Photoelectron Spectroscopy and its application in phase- switching device study
 X- ray Photoelectron Spectroscopy and its application in phase- switching device study Xinyuan Wang A53073806 I. Background X- ray photoelectron spectroscopy is of great importance in modern chemical and
Speciation of Individual Mineral Particles of Micrometer Size by the Combined Use of ATR-FT-IR Imaging and Quantitative ED-EPMA Techniques
 Speciation of Individual Mineral Particles of Micrometer Size by the ombined Use of ATR-FT-IR Imaging and Quantitative ED-EPMA Techniques Md Abdul Malek, Hae-Jin Jung, JiYeon Ryu, BoHwa Kim, Young-hul
Pulse Height Analysis System (PHA) designed for W7-X Presented by Monika KUBKOWSKA
 designed for W7-X Presented by Monika KUBKOWSKA") Pulse Height Analysis System (PHA) designed for W7-X Presented by Monika KUBKOWSKA This scientific work has been partly supported by Polish Ministry of Science and Higher Education within the framework
Pulse Height Analysis System (PHA) designed for W7-X Presented by Monika KUBKOWSKA This scientific work has been partly supported by Polish Ministry of Science and Higher Education within the framework
Practical Surface Analysis
 Practical Surface Analysis SECOND EDITION Volume 1 Auger and X-ray Photoelectron Spectroscopy Edited by D. BRIGGS ICI PLC, Wilton Materials Research Centre, Wilton, Middlesbrough, Cleveland, UK and M.
Experimental 2.1 Introduction. Ultra high vacuum.
 2 Experimental 2.1 Introduction. Ultra high vacuum. The interest in solid-gas (or solid-vacuum) interfaces has been increasing rapidly during the last three decades. On one hand this is due to the practical
LIBSlab ANALYZERS ANALYZERS
 ANALYZERS ANALYZERS Chemical multi-elemental analysis with LIBS in modular benchtop design LIBSlab LIBSpector compact sample chamber for the LIBS analysis of solid, liquid and gaseous samples. Sample chamber
High Yield Structured X-ray Photo-Cathode Development and Fabrication
 High Yield Structured X-ray Photo-Cathode Development and Fabrication K. Opachich 1, P. Ross 1, J. Koch 1, A. MacPhee 2, O. Landen 2, D. Bradley 2, P. Bell 2, S. Nagel 2, T. Hilsabeck 4, N. Chen 5, S.
6. Analytical Electron Microscopy
 Physical Principles of Electron Microscopy 6. Analytical Electron Microscopy Ray Egerton University of Alberta and National Institute of Nanotechnology Edmonton, Canada www.tem-eels.ca regerton@ualberta.ca
5.8 Auger Electron Spectroscopy (AES)
") 5.8 Auger Electron Spectroscopy (AES) 5.8.1 The Auger Process X-ray and high energy electron bombardment of atom can create core hole Core hole will eventually decay via either (i) photon emission (x-ray
5.8 Auger Electron Spectroscopy (AES) 5.8.1 The Auger Process X-ray and high energy electron bombardment of atom can create core hole Core hole will eventually decay via either (i) photon emission (x-ray
Electronic Supplementary Information (ESI)
") Electronic Supplementary Material (ESI) for Catalysis Science & Technology. This journal is The Royal Society of Chemistry 2015 Electronic Supplementary Information (ESI) Multi-scale promoting effects
Electronic Supplementary Material (ESI) for Catalysis Science & Technology. This journal is The Royal Society of Chemistry 2015 Electronic Supplementary Information (ESI) Multi-scale promoting effects
Electron Microprobe Analysis and Scanning Electron Microscopy
 Electron Microprobe Analysis and Scanning Electron Microscopy Electron microprobe analysis (EMPA) Analytical technique in which a beam of electrons is focused on a sample surface, producing X-rays from
Birck Nanotechnology Center XPS: X-ray Photoelectron Spectroscopy ESCA: Electron Spectrometer for Chemical Analysis
 Birck Nanotechnology Center XPS: X-ray Photoelectron Spectroscopy ESCA: Electron Spectrometer for Chemical Analysis Dmitry Zemlyanov Birck Nanotechnology Center, Purdue University Outline Introduction
Applications of Nuclear Analytical Techniques in Geoscience
 Applications of Nuclear Analytical Techniques in Geoscience J. Aspiazu a,1, J. López a, J. Ramírez a, M. E. Montero b, P. Villaseñor a a Intituto Nacional de Investigaciones Nucleares (ININ), Carretera
X-Rays From Laser Plasmas
 X-Rays From Laser Plasmas Generation and Applications I. C. E. TURCU CLRC Rutherford Appleton Laboratory, UK and J. B. DANCE JOHN WILEY & SONS Chichester New York Weinheim Brisbane Singapore Toronto Contents
Highly efficient SERS test strips
 Electronic Supplementary Information (ESI) for Highly efficient SERS test strips 5 Ran Zhang, a Bin-Bin Xu, a Xue-Qing Liu, a Yong-Lai Zhang, a Ying Xu, a Qi-Dai Chen, * a and Hong-Bo Sun* a,b 5 10 Experimental
Silicon Drift Detectors: Understanding the Advantages for EDS Microanalysis. Patrick Camus, PhD Applications Scientist March 18, 2010
 Silicon Drift Detectors: Understanding the Advantages for EDS Microanalysis Patrick Camus, PhD Applications Scientist March 18, 2010 EDS Detector Requirements Detect whole energy range of x-rays 50 ev
Electron Spettroscopies
 Electron Spettroscopies Spettroscopy allows to characterize a material from the point of view of: chemical composition, electronic states and magnetism, electronic, roto-vibrational and magnetic excitations.
Lecture 5-8 Instrumentation
 Lecture 5-8 Instrumentation Requirements 1. Vacuum Mean Free Path Contamination Sticking probability UHV Materials Strength Stability Permeation Design considerations Pumping speed Virtual leaks Leaking
X-ray spectroscopy: Experimental studies of Moseley s law (K-line x-ray fluorescence) and x-ray material s composition determination
 and x-ray material s composition determination") Uppsala University Department of Physics and Astronomy Laboratory exercise X-ray spectroscopy: Experimental studies of Moseley s law (K-line x-ray fluorescence) and x-ray material s composition determination
Uppsala University Department of Physics and Astronomy Laboratory exercise X-ray spectroscopy: Experimental studies of Moseley s law (K-line x-ray fluorescence) and x-ray material s composition determination
X-Ray Photoelectron Spectroscopy (XPS)-2
-2") X-Ray Photoelectron Spectroscopy (XPS)-2 Louis Scudiero http://www.wsu.edu/~pchemlab ; 5-2669 Fulmer 261A Electron Spectroscopy for Chemical Analysis (ESCA) The 3 step model: 1.Optical excitation 2.Transport
X-Ray Photoelectron Spectroscopy (XPS)-2 Louis Scudiero http://www.wsu.edu/~pchemlab ; 5-2669 Fulmer 261A Electron Spectroscopy for Chemical Analysis (ESCA) The 3 step model: 1.Optical excitation 2.Transport
SEM. Chemical Analysis in the. Elastic and Inelastic scattering. Chemical analysis in the SEM. Chemical analysis in the SEM
 THE UNIVERSITY Chemical Analysis in the SEM Ian Jones Centre for Electron Microscopy OF BIRMINGHAM Elastic and Inelastic scattering Electron interacts with one of the orbital electrons Secondary electrons,
3. An increase in the intensity of incident light does not change the maximum velocity of the emitted photo electrons. Why?
 WORK SHEET-01 1 Mark Questions: 1.The wavelength of electromagnetic radiation is doubled. What will happen to the energy of photon? 2. Ultraviolet light is incident on two photosensitive materials having
The Benefit of Wide Energy Range Spectrum Acquisition During Sputter Depth Profile Measurements
 The Benefit of Wide Energy Range Spectrum Acquisition During Sputter Depth Profile Measurements Uwe Scheithauer, 82008 Unterhaching, Germany E-Mail: scht.uhg@googlemail.com Internet: orcid.org/0000-0002-4776-0678;
1 Electrons are emitted from a metal surface when it is illuminated with suitable electromagnetic radiation. ...[1]
![1 Electrons are emitted from a metal surface when it is illuminated with suitable electromagnetic radiation. ...[1]](/thumbs/81/83978040.jpg "1 Electrons are emitted from a metal surface when it is illuminated with suitable electromagnetic radiation. ...[1]") 1 Electrons are emitted from a metal surface when it is illuminated with suitable electromagnetic radiation. 1 (a) (b) Name the effect described above....[1] The variation with frequency f of the maximum
1 Electrons are emitted from a metal surface when it is illuminated with suitable electromagnetic radiation. 1 (a) (b) Name the effect described above....[1] The variation with frequency f of the maximum
The design of an integrated XPS/Raman spectroscopy instrument for co-incident analysis
 The design of an integrated XPS/Raman spectroscopy instrument for co-incident analysis Tim Nunney The world leader in serving science 2 XPS Surface Analysis XPS +... UV Photoelectron Spectroscopy UPS He(I)