Differential Modeling for Cancer Microarray Data
|
|
|
- Shannon Holland
- 5 years ago
- Views:
Transcription


1 Differential Modeling for Cancer Microarray Data Omar Odibat Department of Computer Science Feb, 01,
2 Outline Introduction Cancer Microarray data Problem Definition Differential analysis Existing methods Limitations Differential Biclustering Biclustering Proposed algorithm Results Differential Networking Gene Networks Proposed algorithm Results Conclusion 2


3 The Biology and The Technology The central dogma DNA microarray Picture from Picture from 3

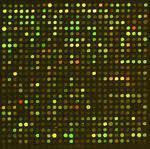


4 genes Example of Cancer Microarray Data measure the expression level of thousands of genes under different conditions. samples 4

 subject")


5 Sample Types tissue type (e.g., normal vs cancerous) subject type (e.g., male vs female) time points (time series data) comparative gene expression analysis Problem: Find the most significant genes relevant to phenotypic variation. 5

6 GENES The goals of Differential Modeling SAMPLES S 1 S 2 S 3 S 4 S 5 S 6 Group A (normal) S 1 S 3 S 4 Group B (cancer) S 2 S 5 S 6 G 1 G 2 G 3 G 4 G 5 G 6 G 7 G 1 G 2 G 3 G 4 G 5 G 6 G 7 The goal of differential analysis is to answer the following questions: What are the genes that are related to cancer? How these genes are correlated in cancer and in normal cells? 6
7 Applications of Differential Modeling Identifying disease causing genes. many applications! Examine the effects of a certain treatment. Understanding the different roles played by a given gene in two different kinds of cells. Comparative gene expression analysis. 7
8 Outline Introduction Cancer Microarray data Problem Definition Differential analysis Existing methods Limitations Differential Biclustering Biclustering Proposed algorithm Results Differential Networking Gene Networks Proposed algorithm Results Conclusion 8


9 Differential Expression (DE) Is the mean of the expression level of a gene in group A significantly different from the mean of the expression level in group B? Solution : compute t-test statistic for each gene Example : Significance Analysis of Microarrays (SAM) [Tusher et al, 2001] 9


10 Differential Variability (DV) Is the variance of the expression level of a gene in group A significantly different from the variance of the expression level in group B? Solution : compute F-test statistic for each gene Example : AlteredExpression [Prieto et al, 2006] 10

11 Limitations of DE &DV Methods Perform a statistical test for each gene individually, and do not capture the relationships between genes. Cannot find the differences in the coexpression patterns in normal and disease samples. It was shown that some disease genes were highly differentially co-expressed but not differently expressed. study genes individually Therefore, we proposed two data mining approaches: Differential biclustering Differential networking study groups of genes 11
12 Outline Introduction Cancer Microarray data Problem Definition Differential analysis Existing methods Limitations Differential Biclustering Biclustering Proposed algorithm Results Differential Networking Gene Networks Proposed algorithm Results Conclusion 12

13 Clustering Group similar objects together K-means clustering Hierarchical clustering 13
14 Traditional Clustering Algorithms In the traditional clustering methods, such as K-means and Hierarchical clustering, the similarity is computed across all the features. These methods fail in discovering: Only a small set of the genes participates in a cellular process of interest. An interesting cellular process is active only in a subset of the conditions. 14
15 Expression level Biclustering (Co-clustering) The genes are NOT correlated in all of the samples. The genes are correlated in a subset of the samples. Samples 15

16 Genes Biclustering identifies a subset of objects that are similar under a subset of features Samples More complicated biclusters Arbitrarily Positioned Overlapping biclusters These biclusters cannot be identified using traditional clustering algorithms such as k-means or hierarchical clustering. 16
17 words users Applications of Biclustering Text mining Documents Recommendation system movies Identify subgroups of documents with similar properties relatively to subgroups of attributes. Identify subgroups of customers with similar preferences or behaviors toward a subset of products. 17

18 POsitive and NEgative correlation based Overlapping Co-Clustering (PONEOCC) Main contributions of PONEOCC algorithm 1. Ranking based objective function. 2. Positive and negative correlation. 3. Large overlapping co-clusters. 4. Handling missing values. Positive and negative correlation Positive correlation: similar patterns Negative correlation: opposite patterns Omar Odibat and Chandan K. Reddy, "A Generalized Co-clustering Framework for Mining arbitrarily Positioned Overlapping Co-clusters", In Proceedings of the SIAM International Conference on Data Mining (SDM), Phoenix, AZ, April

19 PONEOCC: Model The Mean Squared Residue (MSR) function is used to measure the homogeneity of a bicluster X. error = 0 error = 0 error =

20 PONEOCC: Main Steps Initialization Core coclustering Merging Refinement 20

![ISA [Ihmels et al, 2004] 4. ROCC [Deodhar et al.](/docs-images/84/89648802/images/21-6.jpg ", 2009] Statistical analysis Average of seven data sets score= 1- error.")
21 % of significant biclusters PONEOCC: Results Existing co-clustering algorithms 1. CC [Cheng and Church, 2000] 2. OPSM [Ben-Dor et al., 2003] 3. ISA [Ihmels et al, 2004] 4. ROCC [Deodhar et al., 2009] Statistical analysis Average of seven data sets score= 1- error. score is in [0,1] Significance level 21


22 PONEOCC : Examples Positive correlation Positive & negative correlation 22

23 The DiBiCLUS Algorithm Main contributions of DiBiCLUS: I. Incorporating the class labels in the biclustering. II. Using k-means to quantize the gene values. III. The ability to find overlapping biclusters. Find the sets of genes that are correlated in one class of conditions, but not in the other class. Find the sets of genes that have different type of coorelations among the two classes (positive/negative). Omar Odibat, Chandan K. Reddy and Craig N. Giroux, "Differential Biclustering for Gene Expression Analysis", In Proceedings of the ACM Conference on Bioinformatics and Computational Biology (BCB), Niagara Falls, NY,

24 Overview of DiBiCLUS Step 1: Quantization. Step 2: Finding the differential pairs of genes. Step 3: Identifying the differential biclusters. Step 4: Merging highly overlapping biclusters. 24

25 Quantization Original values Quantized value(k=3)
 ) sim sim B A (g N B (g N A 1 1,g,g 2 2 ) ) N A is the number of conditions in class A.")
26 Differential Pairs: Two Criteria Different co-expression type (positive in one class & negative in the other one, or vice versa). Same co-expression type in both classes, but sim or sim A B (g N A (g N B %,g,g 2 2 ) ) sim sim B A (g N B (g N A 1 1,g,g 2 2 ) ) N A is the number of conditions in class A. N B is the number of conditions in class B. δ is a user threshold. 26
27 Differential Pairs - Example Class A Class B g g sim A (g N A 1,g 2 ) g g sim B (g N 1 B,g > , so g1 and g2 are considered a differential pair in class B. 2 )

28 Finding Differential Pairs: Case 1 Class A Class B The two genes are correlated in class B more than class A. So, they are considered differential genes. 28
29 Finding Differential Pairs: Case 2 Class A Class B The two genes are negatively correlated in 10 samples class A but positively correlated in 10 samples in class B. 29


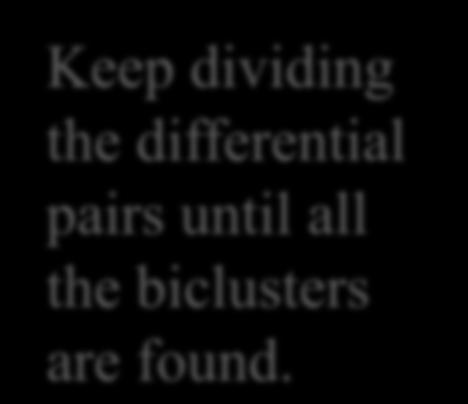
30 From Differential Pairs to Differential Biclusters Keep dividing the differential pairs until all the biclusters are found. This row indicates that g 1 and g 2 are correlated in s 1, s 3, s 6,s 7, s 9 and s 10 Bicluster 1: Genes={1,2,3,5,7,9} Samples={3,6,7} Bicluster 2: Genes={1,4,6,8,10} Samples={2,5,6,8,9} 30
, 433 samples")
, 208 samples.")
31 The prostate cancer dataset DiBiCLUS: Results Class A: an early stage of prostate cancer (low grade ), 433 samples Class B: a developed stage of prostate cancer (high grade ), 208 samples. examples of the biclusters p-values analysis 31
32 Class B Class A Significance of The Results - Example The genes are shown to be mapped to a closely related local sub-network in the IPA biological interaction Knowledge Base. This mapping result suggests that these three genes function in closely related biological processes, associated with the aggressive state of prostate cancer. Pathway obtained from IPA knowledgebase for the genes ACTA2, MTA1 and DVL 32
33 Outline Introduction Cancer Microarray data Problem Definition Differential analysis Existing methods Limitations Differential Biclustering Biclustering Proposed algorithm Results Differential Networking Gene Networks Proposed algorithm Results Conclusion 33


34 Gene Networks play a key role in modeling gene activities and in understanding the functions of cells. Gene Nodes represent genes Gene 1 Gene 2 Picture from [Nayak et al, Genome Research, 2009] Links represent correlation between genes. 34
 Bayesian Networks.")


35 Building Gene Networks (Reverse Engineering) Bayesian Networks. Information-theoretic approach. Boolean networks. Ordinary differential equations. DNA microarray adjacency matrix gene network 35

36 Hubs Cliques Centrality 36
: the number of nodes with k connections, divided by the total number of nodes 37")
37 Scale Free Networks The vast majority of nodes have only a few connections and few nodes are very highly connected K: the number of connections P(k): the number of nodes with k connections, divided by the total number of nodes 37

38 Differential Networking Comparing the structure of the cancer and control co-expression networks provides insight into disease-specific alterations Genes that have a strongly altered connectivity are assumed to play an important role in the disease phenotype. Uncover differences in modules and connectivity in different data sets. Reveals genes/pathways that are wired differently in different sample populations. 38


39 Differential Networking Data set A Data set B Network construction Network construction Differential Network analysis (Our contribution) Ranked gene list 39

40 Differential Networking How to identify the genes that responsible for changes between two gene networks? Same nodes but different links 40
41 The Proposed Model Existing approaches are based on statistical tests to compare different networks based on: The connectivity of genes (differential genes) The weight of the edges (differential edges). Inspired by the power of pagerank algorithm, we propose a data mining approach. Differential Genes Ranking algorithm (DiGeR) to rank the genes based on their contribution to the differences between two gene coexpression networks. 41
42 Centrality Measure Small changes in the expression level of the central genes could significantly alter the interconnection and the topology of the gene network. Low betweenness centrality High betweenness centrality 42


43 Differential Betweeness Centrality The shaded node has the same degree and same betweenness centrality in both networks. but the shortest paths that pass through that node are different between the two networks Then we should compare the shortest paths between the networks dbc= unique shortest paths. 43
44 The Proposed Model Rank Centrality Connectivity 44
45 Example How to rank the differentially connected genes? 45
46 Example 46

47 Example 1 (Prostate Cancer Data) This set contains highly ranked genes which form a clique in the high tumor grade network but they are less connected in the low grade network. Low ranks mean more differential gene! 47

48 Example 2 (Prostate Cancer Data) This set contains highly ranked genes which form a clique in the high tumor grade network but they are less connected in the low grade network. 48

49 Example 3 (Prostate Cancer Data) This set contains highly ranked genes which form a clique in the low tumor grade network but they are less connected in the high grade network. 49
50 Conclusion Differential modeling of microarray data helps in associating differences in gene expression profiles to phenotypic differences across different conditions. Differential modeling can find the most significant genes relevant to phenotypic variation and the genes that are related to disease. 50
51 Acknowledgments Advisor: Dr Chandan Reddy Collaborator: Dr Craig N. Giroux Karmanos Cancer Institute 51

52 52
Chapter 16. Clustering Biological Data. Chandan K. Reddy Wayne State University Detroit, MI
 Chapter 16 Clustering Biological Data Chandan K. Reddy Wayne State University Detroit, MI reddy@cs.wayne.edu Mohammad Al Hasan Indiana University - Purdue University Indianapolis, IN alhasan@cs.iupui.edu
Weighted gene co-expression analysis. Yuehua Cui June 7, 2013
 Weighted gene co-expression analysis Yuehua Cui June 7, 2013 Weighted gene co-expression network (WGCNA) A type of scale-free network: A scale-free network is a network whose degree distribution follows
Biclustering Gene-Feature Matrices for Statistically Significant Dense Patterns
 Biclustering Gene-Feature Matrices for Statistically Significant Dense Patterns Mehmet Koyutürk, Wojciech Szpankowski, and Ananth Grama Dept. of Computer Sciences, Purdue University West Lafayette, IN
Networks & pathways. Hedi Peterson MTAT Bioinformatics
 Networks & pathways Hedi Peterson (peterson@quretec.com) MTAT.03.239 Bioinformatics 03.11.2010 Networks are graphs Nodes Edges Edges Directed, undirected, weighted Nodes Genes Proteins Metabolites Enzymes
Introduction to clustering methods for gene expression data analysis
 Introduction to clustering methods for gene expression data analysis Giorgio Valentini e-mail: valentini@dsi.unimi.it Outline Levels of analysis of DNA microarray data Clustering methods for functional
Identifying Bio-markers for EcoArray
 Identifying Bio-markers for EcoArray Ashish Bhan, Keck Graduate Institute Mustafa Kesir and Mikhail B. Malioutov, Northeastern University February 18, 2010 1 Introduction This problem was presented by
Interaction Network Analysis
 CSI/BIF 5330 Interaction etwork Analsis Young-Rae Cho Associate Professor Department of Computer Science Balor Universit Biological etworks Definition Maps of biochemical reactions, interactions, regulations
Discovering molecular pathways from protein interaction and ge
 Discovering molecular pathways from protein interaction and gene expression data 9-4-2008 Aim To have a mechanism for inferring pathways from gene expression and protein interaction data. Motivation Why
An Efficient Algorithm for Protein-Protein Interaction Network Analysis to Discover Overlapping Functional Modules
 An Efficient Algorithm for Protein-Protein Interaction Network Analysis to Discover Overlapping Functional Modules Ying Liu 1 Department of Computer Science, Mathematics and Science, College of Professional
A Geometric Interpretation of Gene Co-Expression Network Analysis. Steve Horvath, Jun Dong
 A Geometric Interpretation of Gene Co-Expression Network Analysis Steve Horvath, Jun Dong Outline Network and network concepts Approximately factorizable networks Gene Co-expression Network Eigengene Factorizability,
Grundlagen der Bioinformatik Summer semester Lecturer: Prof. Daniel Huson
 Grundlagen der Bioinformatik, SS 10, D. Huson, April 12, 2010 1 1 Introduction Grundlagen der Bioinformatik Summer semester 2010 Lecturer: Prof. Daniel Huson Office hours: Thursdays 17-18h (Sand 14, C310a)
Introduction to clustering methods for gene expression data analysis
 Introduction to clustering methods for gene expression data analysis Giorgio Valentini e-mail: valentini@dsi.unimi.it Outline Levels of analysis of DNA microarray data Clustering methods for functional
Network Biology: Understanding the cell s functional organization. Albert-László Barabási Zoltán N. Oltvai
 Network Biology: Understanding the cell s functional organization Albert-László Barabási Zoltán N. Oltvai Outline: Evolutionary origin of scale-free networks Motifs, modules and hierarchical networks Network
Introduction to Bioinformatics. Shifra Ben-Dor Irit Orr
 Introduction to Bioinformatics Shifra Ben-Dor Irit Orr Lecture Outline: Technical Course Items Introduction to Bioinformatics Introduction to Databases This week and next week What is bioinformatics? A
Self Similar (Scale Free, Power Law) Networks (I)
 Networks (I)") Self Similar (Scale Free, Power Law) Networks (I) E6083: lecture 4 Prof. Predrag R. Jelenković Dept. of Electrical Engineering Columbia University, NY 10027, USA {predrag}@ee.columbia.edu February 7, 2007
Self Similar (Scale Free, Power Law) Networks (I) E6083: lecture 4 Prof. Predrag R. Jelenković Dept. of Electrical Engineering Columbia University, NY 10027, USA {predrag}@ee.columbia.edu February 7, 2007
Introduction to Bioinformatics
 CSCI8980: Applied Machine Learning in Computational Biology Introduction to Bioinformatics Rui Kuang Department of Computer Science and Engineering University of Minnesota kuang@cs.umn.edu History of Bioinformatics
Learning in Bayesian Networks
 Learning in Bayesian Networks Florian Markowetz Max-Planck-Institute for Molecular Genetics Computational Molecular Biology Berlin Berlin: 20.06.2002 1 Overview 1. Bayesian Networks Stochastic Networks
Efficient Mining Differential Co-Expression Constant Row Bicluster in Real-Valued Gene Expression Datasets
 Appl. Math. Inf. Sci. 7, No. 2, 587-598 (2013) 587 Applied Mathematics & Information Sciences An International Journal Efficient Mining Differential Co-Expression Constant Row Bicluster in Real-Valued
Data visualization and clustering: an application to gene expression data
 Data visualization and clustering: an application to gene expression data Francesco Napolitano Università degli Studi di Salerno Dipartimento di Matematica e Informatica DAA Erice, April 2007 Thanks to
Protein Complex Identification by Supervised Graph Clustering
 Protein Complex Identification by Supervised Graph Clustering Yanjun Qi 1, Fernanda Balem 2, Christos Faloutsos 1, Judith Klein- Seetharaman 1,2, Ziv Bar-Joseph 1 1 School of Computer Science, Carnegie
Automatic Reconstruction of the Building Blocks of Molecular Interaction Networks
 Automatic Reconstruction of the Building Blocks of Molecular Interaction Networks Corban G. Rivera Dissertation submitted to the Faculty of the Virginia Polytechnic Institute and State University in partial
Lecture Notes for Fall Network Modeling. Ernest Fraenkel
 Lecture Notes for 20.320 Fall 2012 Network Modeling Ernest Fraenkel In this lecture we will explore ways in which network models can help us to understand better biological data. We will explore how networks
A Multiobjective GO based Approach to Protein Complex Detection
 Available online at www.sciencedirect.com Procedia Technology 4 (2012 ) 555 560 C3IT-2012 A Multiobjective GO based Approach to Protein Complex Detection Sumanta Ray a, Moumita De b, Anirban Mukhopadhyay
Stat 315c: Introduction
 Stat 315c: Introduction Art B. Owen Stanford Statistics Art B. Owen (Stanford Statistics) Stat 315c: Introduction 1 / 14 Stat 315c Analysis of Transposable Data Usual Statistics Setup there s Y (we ll
Gene Ontology and overrepresentation analysis
 Gene Ontology and overrepresentation analysis Kjell Petersen J Express Microarray analysis course Oslo December 2009 Presentation adapted from Endre Anderssen and Vidar Beisvåg NMC Trondheim Overview How
Predicting Protein Functions and Domain Interactions from Protein Interactions
 Predicting Protein Functions and Domain Interactions from Protein Interactions Fengzhu Sun, PhD Center for Computational and Experimental Genomics University of Southern California Outline High-throughput
Data Mining Techniques
 Data Mining Techniques CS 622 - Section 2 - Spring 27 Pre-final Review Jan-Willem van de Meent Feedback Feedback https://goo.gl/er7eo8 (also posted on Piazza) Also, please fill out your TRACE evaluations!
Stat 406: Algorithms for classification and prediction. Lecture 1: Introduction. Kevin Murphy. Mon 7 January,
 1 Stat 406: Algorithms for classification and prediction Lecture 1: Introduction Kevin Murphy Mon 7 January, 2008 1 1 Slides last updated on January 7, 2008 Outline 2 Administrivia Some basic definitions.
Computational Systems Biology
 Computational Systems Biology Vasant Honavar Artificial Intelligence Research Laboratory Bioinformatics and Computational Biology Graduate Program Center for Computational Intelligence, Learning, & Discovery
Biological Networks: Comparison, Conservation, and Evolution via Relative Description Length By: Tamir Tuller & Benny Chor
 Biological Networks:,, and via Relative Description Length By: Tamir Tuller & Benny Chor Presented by: Noga Grebla Content of the presentation Presenting the goals of the research Reviewing basic terms
Principal component analysis (PCA) for clustering gene expression data
 for clustering gene expression data") Principal component analysis (PCA) for clustering gene expression data Ka Yee Yeung Walter L. Ruzzo Bioinformatics, v17 #9 (2001) pp 763-774 1 Outline of talk Background and motivation Design of our empirical
Principal component analysis (PCA) for clustering gene expression data Ka Yee Yeung Walter L. Ruzzo Bioinformatics, v17 #9 (2001) pp 763-774 1 Outline of talk Background and motivation Design of our empirical
Biological networks CS449 BIOINFORMATICS
 CS449 BIOINFORMATICS Biological networks Programming today is a race between software engineers striving to build bigger and better idiot-proof programs, and the Universe trying to produce bigger and better
Protein function prediction via analysis of interactomes
 Protein function prediction via analysis of interactomes Elena Nabieva Mona Singh Department of Computer Science & Lewis-Sigler Institute for Integrative Genomics January 22, 2008 1 Introduction Genome
A Generalized Maximum Entropy Approach to Bregman Co-clustering and Matrix Approximation
 A Generalized Maximum Entropy Approach to Bregman Co-clustering and Matrix Approximation ABSTRACT Arindam Banerjee Inderjit Dhillon Joydeep Ghosh Srujana Merugu University of Texas Austin, TX, USA Co-clustering
Computational Genomics. Systems biology. Putting it together: Data integration using graphical models
 02-710 Computational Genomics Systems biology Putting it together: Data integration using graphical models High throughput data So far in this class we discussed several different types of high throughput
Bioinformatics and Computerscience
 Bioinformatics and Computerscience Systems Biology Data collection Network Inference Network-based dataintegration 1. ARRAY BASED 2. NEXT-GEN SEQUENCING RNA-Seq analysis ChIP-seq Bulked segregant analysis
Clustering and Network
 Clustering and Network Jing-Dong Jackie Han jdhan@picb.ac.cn http://www.picb.ac.cn/~jdhan Copy Right: Jing-Dong Jackie Han What is clustering? A way of grouping together data samples that are similar in
Gene expression microarray technology measures the expression levels of thousands of genes. Research Article
 JOURNAL OF COMPUTATIONAL BIOLOGY Volume 7, Number 2, 2 # Mary Ann Liebert, Inc. Pp. 8 DOI:.89/cmb.29.52 Research Article Reducing the Computational Complexity of Information Theoretic Approaches for Reconstructing
Networks as vectors of their motif frequencies and 2-norm distance as a measure of similarity
 Networks as vectors of their motif frequencies and 2-norm distance as a measure of similarity CS322 Project Writeup Semih Salihoglu Stanford University 353 Serra Street Stanford, CA semih@stanford.edu
Network Biology-part II
 Network Biology-part II Jun Zhu, Ph. D. Professor of Genomics and Genetic Sciences Icahn Institute of Genomics and Multi-scale Biology The Tisch Cancer Institute Icahn Medical School at Mount Sinai New
Networks. Can (John) Bruce Keck Founda7on Biotechnology Lab Bioinforma7cs Resource
 Bruce Keck Founda7on Biotechnology Lab Bioinforma7cs Resource") Networks Can (John) Bruce Keck Founda7on Biotechnology Lab Bioinforma7cs Resource Networks in biology Protein-Protein Interaction Network of Yeast Transcriptional regulatory network of E.coli Experimental
Networks Can (John) Bruce Keck Founda7on Biotechnology Lab Bioinforma7cs Resource Networks in biology Protein-Protein Interaction Network of Yeast Transcriptional regulatory network of E.coli Experimental
Proteomics Systems Biology
 Dr. Sanjeeva Srivastava IIT Bombay Proteomics Systems Biology IIT Bombay 2 1 DNA Genomics RNA Transcriptomics Global Cellular Protein Proteomics Global Cellular Metabolite Metabolomics Global Cellular
Computational methods for predicting protein-protein interactions
 Computational methods for predicting protein-protein interactions Tomi Peltola T-61.6070 Special course in bioinformatics I 3.4.2008 Outline Biological background Protein-protein interactions Computational
Algorithms for Molecular Biology
 Algorithms for Molecular Biology BioMed Central Research A polynomial time biclustering algorithm for finding approximate expression patterns in gene expression time series Sara C Madeira* 1,2,3 and Arlindo
Thematic review series: Systems Biology Approaches to Metabolic and Cardiovascular Disorders
 thematic review Thematic review series: Systems Biology Approaches to Metabolic and Cardiovascular Disorders Reverse engineering gene networks to identify key drivers of complex disease phenotypes Eric
Preliminaries. Data Mining. The art of extracting knowledge from large bodies of structured data. Let s put it to use!
 Data Mining The art of extracting knowledge from large bodies of structured data. Let s put it to use! 1 Recommendations 2 Basic Recommendations with Collaborative Filtering Making Recommendations 4 The
Basics of Multivariate Modelling and Data Analysis
 Basics of Multivariate Modelling and Data Analysis Kurt-Erik Häggblom 2. Overview of multivariate techniques 2.1 Different approaches to multivariate data analysis 2.2 Classification of multivariate techniques
Non-Negative Factorization for Clustering of Microarray Data
 INT J COMPUT COMMUN, ISSN 1841-9836 9(1):16-23, February, 2014. Non-Negative Factorization for Clustering of Microarray Data L. Morgos Lucian Morgos Dept. of Electronics and Telecommunications Faculty
Overview. and data transformations of gene expression data. Toy 2-d Clustering Example. K-Means. Motivation. Model-based clustering
 Model-based clustering and data transformations of gene expression data Walter L. Ruzzo University of Washington UW CSE Computational Biology Group 2 Toy 2-d Clustering Example K-Means? 3 4 Hierarchical
Constraint-based Subspace Clustering
 Constraint-based Subspace Clustering Elisa Fromont 1, Adriana Prado 2 and Céline Robardet 1 1 Université de Lyon, France 2 Universiteit Antwerpen, Belgium Thursday, April 30 Traditional Clustering Partitions
Bioinformatics 2. Yeast two hybrid. Proteomics. Proteomics
 GENOME Bioinformatics 2 Proteomics protein-gene PROTEOME protein-protein METABOLISM Slide from http://www.nd.edu/~networks/ Citrate Cycle Bio-chemical reactions What is it? Proteomics Reveal protein Protein
Mutual Information & Genotype-Phenotype Association. Norman MacDonald January 31, 2011 CSCI 4181/6802
 Mutual Information & Genotype-Phenotype Association Norman MacDonald January 31, 2011 CSCI 4181/6802 2 Overview What is information (specifically Shannon Information)? What are information entropy and
10-810: Advanced Algorithms and Models for Computational Biology. Optimal leaf ordering and classification
 10-810: Advanced Algorithms and Models for Computational Biology Optimal leaf ordering and classification Hierarchical clustering As we mentioned, its one of the most popular methods for clustering gene
Zhiguang Huo 1, Chi Song 2, George Tseng 3. July 30, 2018
 Bayesian latent hierarchical model for transcriptomic meta-analysis to detect biomarkers with clustered meta-patterns of differential expression signals BayesMP Zhiguang Huo 1, Chi Song 2, George Tseng
Clustering. Genome 559: Introduction to Statistical and Computational Genomics Elhanan Borenstein. Some slides adapted from Jacques van Helden
 Clustering Genome 559: Introduction to Statistical and Computational Genomics Elhanan Borenstein Some slides adapted from Jacques van Helden Gene expression profiling A quick review Which molecular processes/functions
Modularity and Graph Algorithms
 Modularity and Graph Algorithms David Bader Georgia Institute of Technology Joe McCloskey National Security Agency 12 July 2010 1 Outline Modularity Optimization and the Clauset, Newman, and Moore Algorithm
Comparative Network Analysis
 Comparative Network Analysis BMI/CS 776 www.biostat.wisc.edu/bmi776/ Spring 2016 Anthony Gitter gitter@biostat.wisc.edu These slides, excluding third-party material, are licensed under CC BY-NC 4.0 by
Three right directions and three wrong directions for tensor research
 Three right directions and three wrong directions for tensor research Michael W. Mahoney Stanford University ( For more info, see: http:// cs.stanford.edu/people/mmahoney/ or Google on Michael Mahoney
Sig2GRN: A Software Tool Linking Signaling Pathway with Gene Regulatory Network for Dynamic Simulation
 Sig2GRN: A Software Tool Linking Signaling Pathway with Gene Regulatory Network for Dynamic Simulation Authors: Fan Zhang, Runsheng Liu and Jie Zheng Presented by: Fan Wu School of Computer Science and
Parametric Empirical Bayes Methods for Microarrays
 Parametric Empirical Bayes Methods for Microarrays Ming Yuan, Deepayan Sarkar, Michael Newton and Christina Kendziorski April 30, 2018 Contents 1 Introduction 1 2 General Model Structure: Two Conditions
Comparison of Shannon, Renyi and Tsallis Entropy used in Decision Trees
 Comparison of Shannon, Renyi and Tsallis Entropy used in Decision Trees Tomasz Maszczyk and W lodzis law Duch Department of Informatics, Nicolaus Copernicus University Grudzi adzka 5, 87-100 Toruń, Poland
Proteomics. Yeast two hybrid. Proteomics - PAGE techniques. Data obtained. What is it?
 Proteomics What is it? Reveal protein interactions Protein profiling in a sample Yeast two hybrid screening High throughput 2D PAGE Automatic analysis of 2D Page Yeast two hybrid Use two mating strains
Systems biology and biological networks
 Systems Biology Workshop Systems biology and biological networks Center for Biological Sequence Analysis Networks in electronics Radio kindly provided by Lazebnik, Cancer Cell, 2002 Systems Biology Workshop,
An Example of Visualization in Data Mining
 An Example of Visualization in Data Mining by Bruce L. Golden. H. Smith School of Business niversity of Maryland College Park, MD 74 Presented at Netcentricity Symposium // Data Mining Overview Data mining
Keywords: systems biology, microarrays, gene expression, clustering
 Jan H. Ihmels received his PhD in computational biology from the Weizmann Institute of Science, Israel. He is currently a postdoctoral fellow at the Department of Molecular Genetics of the Weizmann Institute.
The Role of Network Science in Biology and Medicine. Tiffany J. Callahan Computational Bioscience Program Hunter/Kahn Labs
 The Role of Network Science in Biology and Medicine Tiffany J. Callahan Computational Bioscience Program Hunter/Kahn Labs Network Analysis Working Group 09.28.2017 Network-Enabled Wisdom (NEW) empirically
Inferring Transcriptional Regulatory Networks from High-throughput Data
 Inferring Transcriptional Regulatory Networks from High-throughput Data Lectures 9 Oct 26, 2011 CSE 527 Computational Biology, Fall 2011 Instructor: Su-In Lee TA: Christopher Miles Monday & Wednesday 12:00-1:20
Mid-year Report Linear and Non-linear Dimentionality. Reduction. applied to gene expression data of cancer tissue samples
 Mid-year Report Linear and Non-linear Dimentionality applied to gene expression data of cancer tissue samples Franck Olivier Ndjakou Njeunje Applied Mathematics, Statistics, and Scientific Computation
BMD645. Integration of Omics
 BMD645 Integration of Omics Shu-Jen Chen, Chang Gung University Dec. 11, 2009 1 Traditional Biology vs. Systems Biology Traditional biology : Single genes or proteins Systems biology: Simultaneously study
25 : Graphical induced structured input/output models
 10-708: Probabilistic Graphical Models 10-708, Spring 2013 25 : Graphical induced structured input/output models Lecturer: Eric P. Xing Scribes: Meghana Kshirsagar (mkshirsa), Yiwen Chen (yiwenche) 1 Graph
Structural Learning and Integrative Decomposition of Multi-View Data
 Structural Learning and Integrative Decomposition of Multi-View Data, Department of Statistics, Texas A&M University JSM 2018, Vancouver, Canada July 31st, 2018 Dr. Gen Li, Columbia University, Mailman
6.047 / Computational Biology: Genomes, Networks, Evolution Fall 2008
 MIT OpenCourseWare http://ocw.mit.edu 6.047 / 6.878 Computational Biology: Genomes, Networks, Evolution Fall 2008 For information about citing these materials or our Terms of Use, visit: http://ocw.mit.edu/terms.
DATA MINING LECTURE 8. Dimensionality Reduction PCA -- SVD
 DATA MINING LECTURE 8 Dimensionality Reduction PCA -- SVD The curse of dimensionality Real data usually have thousands, or millions of dimensions E.g., web documents, where the dimensionality is the vocabulary
Discovering Correlation in Data. Vinh Nguyen Research Fellow in Data Science Computing and Information Systems DMD 7.
 Discovering Correlation in Data Vinh Nguyen (vinh.nguyen@unimelb.edu.au) Research Fellow in Data Science Computing and Information Systems DMD 7.14 Discovering Correlation Why is correlation important?
Network diffusion-based analysis of high-throughput data for the detection of differentially enriched modules
 Network diffusion-based analysis of high-throughput data for the detection of differentially enriched modules Matteo Bersanelli 1+, Ettore Mosca 2+, Daniel Remondini 1, Gastone Castellani 1 and Luciano
Sample Size Estimation for Studies of High-Dimensional Data
 Sample Size Estimation for Studies of High-Dimensional Data James J. Chen, Ph.D. National Center for Toxicological Research Food and Drug Administration June 3, 2009 China Medical University Taichung,
Bioinformatics I. CPBS 7711 October 29, 2015 Protein interaction networks. Debra Goldberg
 Bioinformatics I CPBS 7711 October 29, 2015 Protein interaction networks Debra Goldberg debra@colorado.edu Overview Networks, protein interaction networks (PINs) Network models What can we learn from PINs
Introduction Centrality Measures Implementation Applications Limitations Homework. Centrality Metrics. Ron Hagan, Yunhe Feng, and Jordan Bush
 Centrality Metrics Ron Hagan, Yunhe Feng, and Jordan Bush University of Tennessee Knoxville April 22, 2015 Outline 1 Introduction 2 Centrality Metrics 3 Implementation 4 Applications 5 Limitations Introduction
Overview. Overview. Social networks. What is a network? 10/29/14. Bioinformatics I. Networks are everywhere! Introduction to Networks
 Bioinformatics I Overview CPBS 7711 October 29, 2014 Protein interaction networks Debra Goldberg debra@colorado.edu Networks, protein interaction networks (PINs) Network models What can we learn from PINs
Statistical Methods for Analysis of Genetic Data
 Statistical Methods for Analysis of Genetic Data Christopher R. Cabanski A dissertation submitted to the faculty of the University of North Carolina at Chapel Hill in partial fulfillment of the requirements
Inferring Transcriptional Regulatory Networks from Gene Expression Data II
 Inferring Transcriptional Regulatory Networks from Gene Expression Data II Lectures 9 Oct 26, 2011 CSE 527 Computational Biology, Fall 2011 Instructor: Su-In Lee TA: Christopher Miles Monday & Wednesday
Types of biological networks. I. Intra-cellurar networks
 Types of biological networks I. Intra-cellurar networks 1 Some intra-cellular networks: 1. Metabolic networks 2. Transcriptional regulation networks 3. Cell signalling networks 4. Protein-protein interaction
Solving the Order-Preserving Submatrix Problem via Integer Programming
 Solving the Order-Preserving Submatrix Problem via Integer Programming Andrew C. Trapp, Oleg A. Prokopyev Department of Industrial Engineering, University of Pittsburgh, Pittsburgh, Pennsylvania 15261,
HYPERGRAPH BASED SEMI-SUPERVISED LEARNING ALGORITHMS APPLIED TO SPEECH RECOGNITION PROBLEM: A NOVEL APPROACH
 HYPERGRAPH BASED SEMI-SUPERVISED LEARNING ALGORITHMS APPLIED TO SPEECH RECOGNITION PROBLEM: A NOVEL APPROACH Hoang Trang 1, Tran Hoang Loc 1 1 Ho Chi Minh City University of Technology-VNU HCM, Ho Chi
Singular value decomposition for genome-wide expression data processing and modeling. Presented by Jing Qiu
 Singular value decomposition for genome-wide expression data processing and modeling Presented by Jing Qiu April 23, 2002 Outline Biological Background Mathematical Framework:Singular Value Decomposition
hsnim: Hyper Scalable Network Inference Machine for Scale-Free Protein-Protein Interaction Networks Inference
 CS 229 Project Report (TR# MSB2010) Submitted 12/10/2010 hsnim: Hyper Scalable Network Inference Machine for Scale-Free Protein-Protein Interaction Networks Inference Muhammad Shoaib Sehgal Computer Science
Kristina Lerman USC Information Sciences Institute
 Rethinking Network Structure Kristina Lerman USC Information Sciences Institute Università della Svizzera Italiana, December 16, 2011 Measuring network structure Central nodes Community structure Strength
Written Exam 15 December Course name: Introduction to Systems Biology Course no
 Technical University of Denmark Written Exam 15 December 2008 Course name: Introduction to Systems Biology Course no. 27041 Aids allowed: Open book exam Provide your answers and calculations on separate
Computational approaches for functional genomics
 Computational approaches for functional genomics Kalin Vetsigian October 31, 2001 The rapidly increasing number of completely sequenced genomes have stimulated the development of new methods for finding
Prediction of double gene knockout measurements
 Prediction of double gene knockout measurements Sofia Kyriazopoulou-Panagiotopoulou sofiakp@stanford.edu December 12, 2008 Abstract One way to get an insight into the potential interaction between a pair
DECOMPOSITION OF GENE REGULATORY NETWORKS INTO FUNCTIONAL PATHS AND THEIR MATCHING WITH MICROARRAY GENE EXPRESSION PROFILES
 DECOMPOSITION OF GENE REGULATORY NETWORKS INTO FUNCTIONAL PATHS AND THEIR MATCHING WITH MICROARRAY GENE EXPRESSION PROFILES A. Kanterakis*, D. Kafetzopoulos**, V. Moustakis*** and G. Potamias* * FORTH/Institute
Correlation Networks
 QuickTime decompressor and a are needed to see this picture. Correlation Networks Analysis of Biological Networks April 24, 2010 Correlation Networks - Analysis of Biological Networks 1 Review We have
A Mining Order-Preserving SubMatrices from Probabilistic Matrices
 A Mining Order-Preserving SubMatrices from Probabilistic Matrices QIONG FANG, Hong Kong University of Science and Technology WILFRED NG, Hong Kong University of Science and Technology JIANLIN FENG, Sun
Clustering. Genome 373 Genomic Informatics Elhanan Borenstein. Some slides adapted from Jacques van Helden
 Clustering Genome 373 Genomic Informatics Elhanan Borenstein Some slides adapted from Jacques van Helden The clustering problem The goal of gene clustering process is to partition the genes into distinct
Model Accuracy Measures
 Model Accuracy Measures Master in Bioinformatics UPF 2017-2018 Eduardo Eyras Computational Genomics Pompeu Fabra University - ICREA Barcelona, Spain Variables What we can measure (attributes) Hypotheses
Single gene analysis of differential expression. Giorgio Valentini
 Single gene analysis of differential expression Giorgio Valentini valenti@disi.unige.it Comparing two conditions Each condition may be represented by one or more RNA samples. Using cdna microarrays, samples
Towards Detecting Protein Complexes from Protein Interaction Data
 Towards Detecting Protein Complexes from Protein Interaction Data Pengjun Pei 1 and Aidong Zhang 1 Department of Computer Science and Engineering State University of New York at Buffalo Buffalo NY 14260,
Molecular Biology: from sequence analysis to signal processing. University of Sao Paulo. Junior Barrera
 Molecular Biology: from sequence analysis to signal processing Junior Barrera University of Sao Paulo Layout Introduction Knowledge evolution in Genetics Data acquisition Data Analysis A system for genetic
Erzsébet Ravasz Advisor: Albert-László Barabási
 Hierarchical Networks Erzsébet Ravasz Advisor: Albert-László Barabási Introduction to networks How to model complex networks? Clustering and hierarchy Hierarchical organization of cellular metabolism The
Structural measures for multiplex networks
 Structural measures for multiplex networks Federico Battiston, Vincenzo Nicosia and Vito Latora School of Mathematical Sciences, Queen Mary University of London Mathematics of Networks 2014 - Imperial