Windsor Woods Stormwater Management System Flood Mitigation Plan
|
|
|
- Winifred Roberts
- 5 years ago
- Views:
Transcription


1 CITY OF VIRGINIA BEACH Windsor Woods Stormwater Management System Flood Mitigation Plan FINAL APRIL 5, 2018 k Lake Windsor Outlet Culvert Lake Windsor Windsor Woods Canal
2
3 Table of Contents Executive Summary 1 Section 1 Introduction 1-1 Section 2 Model Development Basin Description Model Overview Hydraulic Model Setup Hydrologic Model Setup Soils Land Use Imperviousness Existing Conditions Future Conditions 2-9 Section 3 Model Calibration Storm Events for Calibration and Validation Tidal Boundary Conditions Calibration Capacity Constraints Identified during Field Investigation Calibration Results Validation Hurricane Matthew and Further Revisions 3-14 Section 4 Existing Conditions Model Results Target Level of Service (LOS Results for 10-year Design Storm Results for 100-year Design Storm Results for All Storms 4-7 Section 5 Alternative Solution Sets Overview of Alternatives Evaluation for Future Conditions SMS Improvement Elements Alternative Descriptions Alternative 1: Canal Dredging & Restoration to Original Design Alternative 2: Implement 2014 Study Recommendations Alternative Alternative Alternative Alternative 5 Model Elements Alternative 5 Model Results year Storm year Storm 5-27 i
4 Table of Contents 533 Extreme Event Simulation Results Other Storms Alternatives Considered but not Feasible 5-32 Section 6 Regulatory Feasibility and Probable Cost Feasibility Opinion of Probable Construction Cost Sea Level Rise 6-8 Section 7 Summary and Conclusions Recommended Solution Set 7-1 List of Figures Figure ES-1 Alternative 5 - Windsor Woods Proposed Stormwater Improvements 5 Figure 1-1 Windsor Woods and Watershed 4 Site Map 1-4 Figure 2-1 Windsor Woods Topography 2-3 Figure 2-2 Windsor Woods 2D Model Extent 2-4 Figure 2-3 Windsor Woods Model Schematic 2-5 Figure 2-4 Existing Conditions Surface Soil Percentages 2-7 Figure 2-5 Existing Conditions Land Use Percentages 2-8 Figure 2-6a Existing Conditions Imperviousness Percentages 2-8 Figure 2-6b Build-out Conditions Imperviousness 2-9 Figure 2-7 Windsor Woods Soil Types 2-10 Figure 2-8 Windsor Woods Land Use 2-11 Figure 3-1 City Flood Complaint Database 3-2 Figure 3-2 Windsor Woods: Locations of Calibration and Validation Points 3-3 Figure 3-3 September 19 22, 2016 Rainfall Public Works Windsor Woods 3-5 Figure 3-4 October 27 30, 2012 Rainfall MMPS Figure 3-5 August 1, 2012 Rainfall MMPS Figure 3-6 September 19 22, 2016 Tropical Storm Julia Rainfall Gauge Selection 3-7 Figure 3-7 October 27 30, 2012 Hurricane Sandy Rainfall Gauge Selection 3-8 Figure 3-8 August 1, 2012 Rainfall Gauge Selection 3-9 Figure 4-1 Windsor Woods Existing Conditions 10-year Storm Flooding 4-5 Figure 4-2 Windsor Woods Existing Conditions 100-year Storm Flooding 4-9 Figure 5-1 Alternatives Iterations 5-4 Figure 5-2 Alternative 4 Lake Windsor Only Gate Structure and Pump Station Not Selected 5-11 Figure 5-3 Alternative 5 Windsor Woods Proposed Stormwater Improvements 5-13 Figure 5-4 Windsor Woods Alternative 5: 10-year Storm Flooding 5-25 Figure 5-5 Windsor Woods Alternative 5: 100-year Storm Flooding 5-29 Figure 5-6 Alternative 5: Extreme Storm Event Flooding Extent 5-33 Figure 6-1 Windsor Woods Effective FEMA Floodway 6-5 ii
5 Table of Contents List of Tables Table 2-1 WS 4 Model Elements 2-2 Table 2-2 Windsor Woods Model Elements 2-2 Table 3-1 September 21, 2016 Flood Elevations at 10:00 AM 3-12 Table 3-2 August 2012 High Water Marks and Complaint Locations 3-13 Table 3-3 October 2012 High Water Marks and Complaint Locations 3-13 Table 3-4 September 21, 2016 Flood Elevations at 10:00 AM (Revised Model 3-14 Table 4-1 Summary of Existing Conditions, 10-year Storm Results 4-2 Table 5-1 Summary of Elements and Features for Recommended Improvements 5-15 Table 5-2 Summary of Alternative 5: 10-year Storm Results 5-23 Table 5-3 Summary of Alternative 5: 100-year Storm Results Remaining Flooded Addresses 5-27 Table 6-1 Planning-level Opinion of Probable Construction Cost for the Recommended Alternative 6-7 Table E-1 Summary of Alternatives Evaluated B-3 Appendices Appendix A Field Investigation Documentation Appendix B Stormwater Model Development Methodology Appendix C Model Results for Recommended Alternative Appendix D Planning-level Opinion of Probable Construction Costs Appendix E Summary of Alterntatives Evaluated iii
6 Table of Contents This page intentionally left blank iv
7 Executive Summary The Windsor Woods neighborhood is in the City of Virginia Beach Watershed 4 (WS 4, south of Interstate 264 (I-264, east of Mount Trashmore and Lake Windsor, and west of Rosemont Road The Windsor Woods Canal (also known as the Presidential Canal flows through the neighborhood from east to west, eventually flowing to Lake Windsor The system discharges to Thalia Creek, a tributary of the Lynnhaven River For the purposes of this study, the southern boundary of Windsor Woods is set at the hydrologic boundary between the Windsor Woods Canal and the Shoreline Lakes Windsor Woods has experienced repeated and significant flooding during recent rainfall events, including: September 2016 Tropical Storm Julia October 2016 Hurricane Matthew August 2012 storm event October 2012 Hurricane Sandy The City of Virginia Beach retained CDM Smith to develop a hydrologic and hydraulic (H/H model calibrated to multiple storm events over a range of rainfall intensities and boundary conditions Model results were compared with estimated flood depths derived from photos of observed high water levels H/H model simulations were performed for the 2-year, 10-year, 25-year, 50-year, and 100-year design storms with correlated tidal boundary conditions Model simulations were completed with and without possible sea level rise for potential future flood risk consideration Flood impacts were identified by superimposing the 100-year storm flood map on aerial photography to identify overlapping areas Additionally, surveys were conducted at garages in low-lying areas of Windsor Woods (Old Forge Road, Presidential Boulevard and Kings Point Road, to confirm model results The H/H model was used to explore improvement alternatives to alleviate flooding in Windsor Woods Alternatives were then evaluated on their ability to meet the minimum level of service (LOS for this project: Limit peak stages to 3 inches of water or less above the road crown for the 10-year design storm Prevent flooding of structures for the 100-year design storm The LOS formulated for this project is less than the City s current design standard Achieving the full design standard in existing neighborhoods is generally not practicable, and requires extensive impacts such as raising and reconstructing roads Recommended improvements to meet the LOS for this project still provides substantial protection (ie, reduced flooding from existing ES-1
8 Executive Summary conditions for existing homes and structures, and maintains emergency vehicle access to roadways for the 10-year design storm Near-term options include: Canal dredging of the Windsor Woods Canal, scheduled to begin in late 2017, to reduce head loss along the canal, to maximize downstream storage, and to repair the canal to a conveyance capacity close to the original design Canal dredging of the Windsor Oaks Canal, also planned for late 2017, for similar reasons Repair or replacement of damaged pipes or cleaning of blocked pipes that were found during the field surveys Longer-term solutions should be designed and implemented in a sequence such that an option that benefits one area does not adversely impact an adjacent area (ie, do not move the problem to another area As such, the following are listed in order of preferred implementation: Construct Lake Windsor Pump Station and gated control structure on Thalia Creek in the northwest corner of Lake Windsor, just south of I-264 Directly connect Lake Trashmore to Thalia Creek and Lake Windsor to maximize available storage volume Maximize connectivity and storage in the entire system behind the gated structure Increase the size of the Stormwater Management System (SMS significantly within the Windsor Woods neighborhood to improve conveyance toward the Windsor Woods Canal Increase the conveyance capacity of the ditch along the south side of I-264 Analysis of the near-term mitigation options show improvement to flood stages adjacent to the canals and locally near repaired pipes However, the LOS was not met for the 10-year storm away from the canals and flood stages were not significantly reduced for the 100-year storm For the longer-term solutions, initial improvement alternatives included the near-term options, conveyance improvements within the Windsor Woods SMS, and the addition of a stormwater pump station between Lake Windsor and Thalia Creek Findings from the initial analyses revealed that conveyance improvements alone were not sufficient to meet the LOS Additional testing with a larger capacity pump station produced adverse impacts on Thalia Creek and neighborhoods adjacent to Windsor Woods Further analysis included moving the pump station and gated structure to Thalia Creek and including Lake Trashmore and the canals and ponds upstream (south of these lakes to the gated area to be lowered to 0 feet NAVD prior to the storm Of the various alternatives discussed in Section 5, Alternative 5 is recommended to advance to preliminary engineering and engineering design since this was the lone alternative that met the desired LOS in Windsor Woods (with exceptions noted in Section 5 and does not cause adverse impacts in Thalia Creek or elsewhere in the watershed Implementation of the Alternative 5 elements provides protection from downstream tidal conditions and future sea level rise ES-2
9 Executive Summary It should be noted that reliance on the mechanical devices, such as the recommended pump station and gated control structure, carries residual risk from larger events and potential mechanical failure Backup systems, backup power, and manually operable capabilities are methods to mitigate some of the residual risk Without the recommended improvements, the Windsor Woods neighborhood is highly vulnerable to flooding from tidal flooding and flooding from rainfall runoff With the recommended improvements the Windsor Woods neighborhood will continue to be vulnerable to flooding from rainfall runoff for storms that exceed the 100-year design storm or from larger joint rainfall-tidal events and surges that exceed the design As documented in Section 5, approximately 186 homes would still be vulnerable to flooding when testing the Alternative 5 solution with an extreme rainfall event simulation Alternative 5 was selected based on meeting the 10-year and 100-year target LOS, and the extreme event simulation reveals that flooding risks would still exist even under the improved scenario In addition, areas draining to Thalia Creek south of the pump station and gated control structure that have not historically experienced widespread flooding will rely on the recommended improvements in the future The planning-level opinion of probable construction cost for the recommended alternative is $99 million The recommended alternative is summarized in presented in Figure ES-1 The analyses performed as part of this study are conceptual, and the completed H/H models are intended to serve as planning-level tools The conceptual improvements identified in this study should be advanced through engineering design The H/H models should also be refined during engineering design to evaluate additional details or modifications developed during the design process, and to confirm anticipated operation of the recommended pumps and gates Additional analysis is recommended during preliminary design to provide decision makers and the public with the information necessary to understand residual risk and vulnerability Continued study is also suggested to provide a comprehensive basis for prioritizing actions and investments to reduce risk and provide adaptable contingency plans for emergency conditions ES-3
10 Executive Summary This page intentionally left blank ES-4
11 36'Φ 32'x 49' Ü I-264Ditc h : Co nc retelined Trap ezo id Ch annel 'Φ Legend Proposed Improvements C\ Gated Co ntro lstruc ture Th aliacreek LakeWindso r 900c fs Pump Statio nand Gated Co ntro lstruc ture Brentw o o d Cresc ent 18'Φ So uth Blvd 43'x 68' 38'x 60' Palac egreenblvd 18'Φ 38'x 60' 18'Φ 37 PS Pump Statio n DredgeExistingDitc h Bo x Culvert Pip e So uth Blvd C\ 37 PS 264 6'X 8' 24'Φ 30'Φ 48'Φ 30'Φ 42'Φ 32'x 49' 30'Φ Co nc retecenterch annel Remo veand Dredge LakeWIndso r SilinaDr 18'Φ 30Φ 18'Φ 18'Φ 30'Φ SPlazaTrail W Co lo nialpkw y 38'x 60' 43'x68' 30'Φ Windso rwo o ds Canal 38'x 60' Lake Trash mo re 6'X 10' 6'X 10' Th aliacreek 36'Φ 38'x 60' 18'Φ 54'Φ 36'Φ Old Fo rgerd 24'Φ Windso rgatepl 18'Φ 18'Φ 30'Φ 36'Φ 18'Φ 34'x 53' 36'Φ 24'Φ 38'x 60' 34'x 53' 24'Φ 36'Φ 36'Φ 43'x 68' 30'Φ 18'Φ 24'Φ Old Fo rgerd PresidentialBlvd 43'x 68' 58'x 91' 38'x 60' 30'Φ SilinaDr Ro semo ntrd 48'Φ Sh o relinelake Windso roaks WestDitc h #1 18'Φ 30'Φ 24'Φ SPlazaTrail 24'Φ 24'Φ Miles Figure ES-1 City of Virginia Beach Alternative 5 - Windsor Woods Proposed Stormwater Improvements
12 Executive Summary This page intentionally left blank ES-6
13 Section 1 Introduction The Windsor Woods neighborhood is in the City of Virginia Beach Watershed 4 (WS 4, south of I-264, east of Mount Trashmore and Lake Windsor, and west of Rosemont Road The Windsor Woods Canal (also known as the Presidential Canal flows through the neighborhood from east to west, eventually flowing to Lake Windsor, where the system ultimately discharges to Thalia Creek over a submerged berm For the purposes of this study, the southern boundary of Windsor Woods is north of the Shoreline Lakes, where the stormwater system divides between conveying flow north to the Windsor Woods Canal and south to the Shoreline Lakes Figure 1-1 displays the location of the study area for Windsor Woods and the overall WS 4 boundary Windsor Woods has experienced repeated, significant flooding during recent rainfall events, including: September 2016 Tropical Storm Julia October 2016 Hurricane Matthew August 2012 storm event October 2012 Hurricane Sandy To address these repeated flooding events, the City directed CDM Smith to develop a hydrologic and hydraulic (H/H model of the study area to evaluate alternatives to alleviate flooding issues The Windsor Woods neighborhood cannot be separated from the larger WS 4 drainage area without making large assumptions of downstream stages and flows Therefore, the Windsor Woods modeling was conducted within a larger WS 4 model Performed under the ongoing stormwater master plan project, the WS 4 model development included the entire tributary area to Thalia Creek, both upstream and downstream of Lake Windsor and Lake Trashmore The WS 4 model enabled a more accurate prediction of flood stages throughout the system, and, as such, established the starting point for the Windsor Woods evaluations CDM Smith calibrated the Windsor Woods model to multiple storm events over a range of rainfall intensities and boundary conditions H/H model simulations were performed with the 2-year, 10-year, 50-year, and 100-year design storms, under rainfall-correlated tidal boundary conditions and sea level rise scenarios For calibration, model results were compared with estimated flood depths derived from photos of observed water levels The site visit descriptions, photos, and methodologies are presented in Appendix A To achieve calibration, model parameters were adjusted until a reasonable agreement between estimated flood depths and model simulated flood depths was reached Additional discussion of model calibration is provided in Section 3 1-1
14 Section 1 Introduction CDM Smith applied the calibrated model to identify areas of probable flooding for the 10-year and 100-year storm events under existing land use conditions For the proposed alternatives, the City requested that future land use conditions be considered Parcels slated for future development were supplied by the City and incorporated to recalculate impervious cover (see Section 51 CDM Smith then modeled potential system improvements to evaluate the benefits of each More than a dozen alternatives were evaluated to alleviate flooding for the 10-year and 100-year design storms Alternatives were then evaluated on their ability to meet the minimum level of service (LOS for this project: Limit peak stages to 3-inches or less above the road crown for the 10-year design storm Prevent flooding of structures for the 100-year design storm The LOS formulated for this project is less than the City s current design standard Provision of the full design standard in existing neighborhoods is not feasible The formulated LOS provides a cost-effective basis that provides substantial protection for existing homes and structures, and maintains access to roadways for the 10-year design storm The alternatives analysis identified multiple configurations that sufficiently reduced flooding within the Windsor Woods study area to meet the targeted LOS, but caused adverse offsite impacts on Thalia Creek and neighborhoods adjacent to Windsor Woods Therefore, further mitigation within the larger WS 4 watershed was necessary to make the alternatives feasible Subsequent alternatives were developed to avoid adverse impacts to offsite areas, both upstream and downstream of Lake Windsor and Lake Trashmore An alternative consisting of a gated structure and pump station on Thalia Creek immediately south of I-264 was identified as the most feasible option This alternative configuration provides significantly more storage volume and allows for the larger pump station necessary to meet LOS without exceeding existing peak flows The remainder of this report is organized as follows: Section 2 describes the development of the H/H model and supporting data Section 3 presents the calibration of the H/H model to observed flood conditions Section 4 presents model results of the SMS prior to evaluating improvements Section 5 provides alternative solution sets to achieve the established LOS Section 6 describes anticipated environmental permitting of the solution set, a summary of the construction cost opinion and considerations to accommodate future sea level rise conditions Section 7 presents a summary of the recommended solution 1-2
15 Section 1 Introduction Appendix A contains field investigation documentation for observed flooding conditions used to calibrate the H/H model Appendix B expands on Section 2 and provides technical details of the stormwater model development methodology Appendix C contains model results for the selected solution Appendix D contains detailed information about the opinion of probable construction costs presented in Section 6 1-3
16 WS4 Ü Windsor Woods Thalia Creek Lake Windsor Outlet Culvert Rosemont Road Windsor Woods Canal Figure 1-1 Windsor Woods and Watershed 4 Site Map Miles Legend Windsor Woods Boundary WS4 Boundary
17 Section 2 Model Development 21 Basin Description The Windsor Woods neighborhood encompasses 745 acres of relatively flat, low-lying, primarily residential developed land Lake Windsor is directly connected to Thalia Creek, a tributary of the Lynnhaven River, and is susceptible to tidal fluctuations Figure 2-1 shows the topographic digital elevation model (DEM for Windsor Woods extracted from LiDAR Topographic elevations range from approximately 0 feet NAVD along the banks adjacent to Lake Windsor to over 60 feet NAVD at the top of Mount Trashmore, a manmade feature The highest elevations within the natural topography in this neighborhood are approximately 15 feet NAVD, with most stormwater inlets ranging between 6 feet and 10 feet NAVD 22 Model Overview The primary objective for developing H/H models for the Windsor Woods Stormwater Management System (SMS is to evaluate alternatives to alleviate flooding The US EPA Stormwater Management Model (SWMM uses physical H/H parameters based on the best available data, engineering guidelines, and judgement The model is most reliable when calibrated using observed data, such as rainfall, tide elevations, and flood elevations Once CDM Smith developed the model to match observed conditions, it was used to simulate the SMS response to other rainfall events (design storms and downstream tidal boundary conditions The detailed description of SWMM methodologies and parameters is provided in Appendix B Stormwater models were developed using PCSWMM Version 70 by Computational Hydraulics International (CHI PCSWMM uses the US EPA SWMM Version computational engine, and includes a custom graphical user interface (GUI that offers GIS functionality, model building, calibration, and post processing tools Due to the extent of recurring flooding and the flat topography in the study area, both one dimensional (1D and two dimensional (2D models were developed While a 1D model of subsurface (pipe and surface (open channel flows typically is sufficient for flooding evaluations, due to the extremely flat and flooding-prone areas in Windsor Woods, the 2D model better predicts flood depths (see Appendix B, Section B57 However, due to the computational requirements of 2D modeling, the entire Windsor Woods neighborhood was not modeled in 2D; therefore, both 1D and 2D methods are utilized Figure 2-2 shows the Windsor Woods portion of the model, as well as an outline of the 2D model area The 2D model covers 310 acres of the Windsor Woods neighborhood, from Rosemont Road west to Windsor Lake During model development, several inlets along Rosemont Road were identified to convey flows away from Windsor Woods and towards the Bow Creek Golf Course stormwater system, which lies within WS 6 This area is also shown on the figure 2-1
18 Section 2 Model Development 23 Hydraulic Model Setup The Windsor Woods SMS includes open channels, pipes of 15-inch diameter and larger, constructed stormwater facilities, and overland flows Since the Windsor Woods neighborhood is modeled within the larger WS 4 model, both the full WS 4 components and those within Windsor Woods are presented in Table 2-1 and Table 2-2, respectively Figure 2-3 includes the modeled SMS network for the Windsor Woods study area To accommodate flow leaving WS 4 and entering the Bow Creek Golf Course stormwater system within WS 6, an outfall was added to the Windsor Woods model representing the pond within the golf course Table 2-1 WS 4 Model Elements Subbasins 1,406 1D Model Elements 2D Model Elements Junctions 2,672 Storage Nodes 1,279 Outfalls 139 Conduits Circular 3,642 Arch 11 Ellipse 121 Rectangular Open 0 Rectangular Closed 40 Irregular D Cells 20,625 Junctions 20,875 Outfalls 0 Conduits Open Rectangular 56,660 Table 2-2 Windsor Woods Model Elements Subbasins 141 1D Model Elements 2D Model Elements Junctions 385 Storage Nodes 76 Outfalls 0 Conduits Circular 435 Ellipse 0 Rectangular Open 0 Rectangular Closed 1 Irregular 106 2D Cells 20,625 Junctions 20,875 Outfalls 0 Conduits Open Rectangular 56,
19 Ü Thalia Creek Lake Windsor Outlet Culvert Rosemont Road Lake Windsor Windsor Woods Canal Legend Windsor Woods Boundary Figure 2-1 Windsor Woods Topography Miles 2D Model Boundary Topography DEM (ft Navd High : 15 Low : 0
20 WS4 Ü Sources: Esri, HERE, DeLorme, Windsor USGS, Intermap, INCREMENT P, NRCan, Esri Woods Japan, METI, Esri China (Hong Kong, Esri Korea, Esri Thalia Creek Lake Windsor Outlet Culvert Rosemont Road Windsor Woods Canal Sources: Esri, HERE, DeLorme, USGS, Intermap, INCREMENT P, NRCan, Esri Japan, METI, Esri China (Hong Kong, Esri Korea, Esri (Thailand, MapmyIndia, NGCC, OpenStreetMap contributors, and the GIS User Community Figure 2-2 Windsor Woods 2D Model Extent Miles Legend Windsor Woods Boundary 2D Model Boundary WS4 Boundary


21 Ü Other Inlet Manhole # Outfalls Storages # # 1D Nodes Weirs Rectangular Overland Elliptical Channel Lake Windsor Outlet Culvert Circular Thalia Creek 1D Conduits Windsor Woods 2D Model Legend Figure 2-3 City of Virginia Beach Windsor Woods Model Schmatic Miles Sources: Esri, HERE, DeLorme, USGS, Intermap, INCREMENT P, NRCan, Esri Japan, METI, Esri China (Hong Kong, Esri Korea, Esri (Thailand, MapmyIndia, NGCC, OpenStreetMap contributors, and the GIS User Community
22 Section 2 Model Development This page intentionally left blank 2-6
23 Section 2 Model Development 24 Hydrologic Model Setup The hydrologic portion of the H/H model represents the process for transforming rainfall to stormwater runoff that enters the SMS For this study, the 2017 hydrologic conditions were modeled for the calibration storm and for estimating the existing LOS The primary components of the H/H model representation of existing hydrology are soils and land use data Soils data are used to define the infiltration and stormwater runoff from pervious areas included in the model Land use data is used to estimate impervious cover, and for parameters that define the routing of stormwater runoff to the SMS Information for soils and land use data follows; additional detail is included in Appendix B 241 Soils Figure 2-4 shows the distributions of surface soil types found in Windsor Woods based on spatial data provided by the City The study area primarily consists of land complex (which is a dual class soil consisting of silty loam and sandy to silty clay In urban areas, land complex soils are often compacted with the clay layer representing a confining layer During calibration, the saturated hydraulic conductivity of the land complex soils was set to 002 inches per hour, which represents a clay soil The remaining soil types include loam and silt loams (11 percent and 7 percent, respectively and clay, peat and muck type soils (4 percent Figure 2-4 Existing Conditions Surface Soil Percentages 242 Land Use Figure 2-5 presents the land use percentages within the study area The majority of Windsor Woods is medium density residential (55 percent, with other uses being heavy industrial and transportation (23 percent and commercial, light industrial and institutional (14 percent Waterbodies account for nearly 5 percent of the area The land use coverage is used to estimate additional hydrologic parameters, such as roughness and depression storage It should be noted that the model is more sensitive to impervious coverage than to these land use-derived hydrologic parameters 2-7

24 Section 2 Model Development Figure 2-5 Existing Conditions Land Use Percentages 243 Imperviousness 2431 Existing Conditions The existing condition impervious percentages were compiled from the City s 2017 GIS coverage layers, which are directly measured from aerial photography For modeling with SWMM, wetlands and waterbodies are also considered impervious Based on this data and the land use coverage of wetlands and waterbodies, a total of 46 percent of Windsor Woods is impervious (35 percent of directly connected impervious area, plus 11 percent of impervious area routed to pervious areas with the remaining 54 percent considered pervious Figure 2-6a presents the percent cover of each type The impervious routed to pervious designation is typically for residential rooftop gutters that are directed to a yard (ie, not directly connected to the SMS During model calibration, while the total impervious area remained constant (as measured from the City s dataset, the impervious routed to pervious percentage was adjusted This parameter does not increase infiltration, but does slow the runoff, delaying the hydrograph peak and lowering peak runoff The model is only slightly sensitive to this parameter, but reducing this percentage led to the model matching the higher peak runoff for the calibration and validation storms Impervious Pervious 105 Routed to Pervious Figure 2-6a Existing Conditions Imperviousness Percentages 2-8
25 Section 2 Model Development 2432 Future Conditions As discussed in Section 5, the solution alternatives are based on future land use conditions derived from the City s zoning information and future impervious areas Using future conditions will size the formulated improvements to accommodate potential increased runoff from undeveloped parcels slated for future development Regarding model hydrology changes, the soil distribution for pervious areas within the study area was assumed to remain unchanged from existing to future conditions However, the impervious area was updated for the future conditions, as shown in Figure 2-6b Impervious Pervious 105 Routed to Pervious Figure 2-6b Build-out Conditions Imperviousness The map in Figure 2-7 shows the study area s soil type composition and Figure 2-8 shows the study area s land use for existing conditions 2-9
26 Ü Lake Windsor WIndsor Woods Canal Legend Figure 2-7 Windsor Woods Soil Types Miles Windsor Woods Boundary Soil Type Loam Silt Loam Land Complex (Silty, Sandy Clay Clay, Peat, Muck
27 Land Use Type Forest, Open Land and Parks Waterbodies Golf Courses and Agriculture Low Density Residential Medium Density Residential High Density Residential Commercial, Light Industrial, and Institutional Heavy Industrial and Transportation Ü Lake Windsor Windsor Woods Canal Rosemont Rd S Plaza Trl Figure 2-8 Windsor Woods Land Use Miles Legend Windsor Woods Boundary
28 Section 2 Model Development This page intentionally left blank 2-12
29 Section 3 Model Calibration This section describes the model calibration process for the Windsor Woods model Model calibration is the adjustment of model parameters to match observed conditions The Windsor Woods portion of the WS 4 model was calibrated and validated with available storm data provided by the City These data included the City s storm complaints database, photographs of flooding during actual rain events, and estimated peak flooding depths based on the photographs Areas outside of the Windsor Woods tributary to Lake Windsor were included in the analysis and revised as part of the Lake Windsor calibration process Known flooding areas within Windsor Woods include (but are not limited to Rosemont Road, the intersection of South Boulevard and Palace Green Boulevard, the intersection of South Plaza Trail and Palace Green Boulevard, Presidential Boulevard and Historyland Drive, Gladstone Drive and Old Forge Road, West Colonial Parkway south of South Boulevard, Hillridge Court, Windsor Gate Place and South Plaza Trail, and multiple locations along Kings Point Road Figure 3-1 shows reported flooding based on the City s storm complaints database The records were georeferenced and separated by date to evaluate various storm events The call information does not give the depth of flooding at the location CDM Smith also conducted a field investigation on September 21, 2016, during the rainfall event related to Tropical Storm Julia Our investigation resulted in photographs and time-sensitive estimates of flood depths at multiple locations Additional photographs and videos were obtained from public websites, including footage from the August 2012 storm available on YouTube, which allowed for visual estimation of flood depths at the South Boulevard and Palace Green Boulevard intersection, and the South Plaza Trail and Palace Green Boulevard intersection In addition, photographs provided in the City s 2014 Princess Anne Plaza Watershed Study (Parsons Brinckerhoff, March 2014 were used to verify flooding locations and estimate peak flood depths at numerous locations Ultimately, the model was calibrated to the September 2016 storm because of the higher quality of data available (known time and location of flood extents The model was validated with the August 2012 and October 2012 storms The locations of these calibration and validation points are presented in Figure 3-2 After the model was calibrated and validated, it was verified with the Hurricane Matthew rainfall event Within WS 4, Matthew produced between 105 and 128 inches of rain over a 24-hour period, the bulk of which fell in a 12-hour window Matthew had a relatively high peak tailwater condition of 54 feet NAVD at Thalia Creek and Virginia Beach Boulevard The model revisions resulting from these evaluations are included in Section
30 Ü ( ( ((( ( ( ( ( ( ( ( ( ( ( ( ( ( ( ( ( ( ( ( ( ( (( ( ( (( (( ( ( ( ( ( ( ( ( ( ( ( ( ( ( ( ( ( ( ( ((( ( ( ( ( ( ( ( ((((( ( ( ( ( ( ( ( ( ( ( (( ( (( ( ( ( ( ( ( ( ( (( ( ( ( ( ( ( ( ( (((( ( (( ( (( ( (( ( ( ( ( ( ( ( ( ( ( ( ( ( ( ( ( ( ( ( ( ( ( ( (( ( ( ( ( ( ( (( ( ( ( ( ( ((( ( ( ( ( ( ( ( ( ( ( ( ( ( ( ( ( ( ( ( ( ( (( ( ( (( ( ( ( ( (( (( ( ( ( ( (((((((((((( ( (( ( ( (( (( ( ( (( ( ( ( ( ( ( ( ( ( ( (( ( ( ( ( ( ( ( ( ((((( (( ( ( ( ( ( ( ( ( ( ( ( ( ( (( ( ( ( ( ( ( ( ( ( ( ( ( ( ( ( ( ( ( ( ( ( ( ( ( ( ( ( ( ( ( ( ( ( Sources: Esri, HERE, DeLorme, USGS, Intermap, INCREMENT P, NRCan, Esri Japan, METI, Esri China (Hong Kong, Esri Korea, Esri (Thailand, MapmyIndia, NGCC, OpenStreetMap contributors, and the GIS User Community Figure 3-1 Windsor Woods City Flood Complaint Database Miles Legend Windsor Woods Boundary 2D Model Boundary ( August 2012 (8/1/2012 ( Julia (9/19-22/2016 ( Other Dates
31 Ü ^_ ^_^_ ^_ ^_ ^_ ^_ ^_ ^_ ^_ ^_ ^_ ^_ ^_ ^_^_^_ ^_ ^_ Sources: Esri, HERE, DeLorme, USGS, Intermap, INCREMENT P, NRCan, Esri Japan, METI, Esri China (Hong Kong, Esri Korea, Esri (Thailand, MapmyIndia, NGCC, OpenStreetMap contributors, and the GIS User Community Figure 3-2 Windsor Woods Locations of Calibration and Validation Points Miles Legend Windsor Woods Boundary 2D Model Boundary ^_ Sandy Photos (PB Report ^_ Aug 2012 Photos (PB Report ^_ Aug 2012 Video Still ^_ Sept 2016 Field Reconnaissance
32 Section 3 Model Calibration 31 Storm Events for Calibration and Validation The storms selected as model calibration and validation events are characterized below September 19, 2016: Remnants of Tropical Storm Julia Total precipitation was 12 inches to 14 inches over a 60-hour period across Virginia Beach Maximum intensity was 032 inches in a 5-minute period (38 inches per hour, though the maximum hourly total was only 18 inches Total storm volume was much larger than the 100-year storm, but peak intensity was closer to the 2-year storm (see Appendix B, Table B-2 Peak stage in Thalia Creek reached 27 feet NAVD at 2 pm on September 21, 2016 (approximately 40 hours after the storm began Three rainfall gauges were used to characterize rainfall spatial and temporal variation Rainfall was provided in 15-minute intervals from the Hampton Road Sanitation District (HRSD rainfall gauge at Independence PRS (MMPS-140 Rainfall was provided in 1-hour intervals from the City of Virginia Beach Department of Public Utilities Brenneman Farms rainfall gauge (PU-587, and in 5-minute intervals from the City s Public Works Plaza/Windsor Woods rainfall gauge The 5-minute distribution in the Windsor Woods gauge was used to disaggregate the data from the other two gauges to 5-minute intervals Rainfall distributions from gauges across large portions of the City were similar for this storm, so there is high confidence in the distributions and intensities for this event October 28, 2012: Hurricane Sandy Total precipitation between 55 inches and 95 inches across the City, over a 72-hour period Maximum intensity was 032 inches in a 15-minute period (13 inches per hour Tidal flooding was more prevalent than rainfall-driven flooding The surge in the Lynnhaven River reached 54 feet NAVD near noon on October 29, 2012 (approximately 48 hours after the beginning of the storm Five rainfall gauges were used to characterize the event, including four HRSD rainfall gauges: Northampton Boulevard at Wesleyan Drive (MMPS-036, Kempsville PRS (MMPS- 144, Independence PRS (MMPS-140, and Pine Tree PRS (MMPS-160 Additionally, 15-minute rainfall was disaggregated from hourly rainfall at the City s Public Utilities rainfall gauge PU 526 using the distribution of the neighboring HRSD gauge August 1, 2012: Storm Event Total precipitation between 11 inches and 32 inches over a 1-hour to 2-hour period The storm was centered near the Windsor Woods neighborhood in WS 4 Maximum intensity of 1 inch in 15 minutes (4 inches per hour 3-4
33 Section 3 Model Calibration Tidal surge was not significant for this storm Three rainfall gauges were used to characterize the event, including two HRSD gauges (Independence PRS (MMPS-140 and Pine Tree PRS (MMPS-160 and the City s Public Utilities rainfall gauge PU 526 Model subbasins are typically assigned rainfall data from the nearest rain gauge However, due to the large variation in rainfall depth of the August 2012 storm, the area of influence for the Pine Tree PRS (MMPS-160 gauge was extended Figure 3-3 through Figure 3-5 show the precipitation of the three selected storms at an example gauge (the Windsor Woods gauge for the calibration storm and the Pine Tree Pressure Reducing Station gauge for the validation storms For comparison, all three graphs show rainfall volume in 15-minute increments Figure 3-6 through Figure 3-8 show the spatial distribution of the rainfall gauges and subbasin assignment within WS 4 for the three storms Figure 3-3 September 19 22, 2016 Rainfall Public Works Windsor Woods Figure 3-4 October 27 30, 2012 Rainfall MMPS
34 Section 3 Model Calibration Figure 3-5 August 1, 2012 Rainfall MMPS
35 Ü 5 MMPS-140, 1206 in PW PLAZA, 1215 in 5 5 PU-587, 1264 in Sources: Esri, HERE, DeLorme, USGS, Intermap, INCREMENT P, NRCan, Esri Japan, METI, Esri China (Hong Kong, Esri Korea, Esri (Thailand, MapmyIndia, NGCC, OpenStreetMap contributors, and the GIS User Community Legend Figu re3-6 September19 22,2016TropicalStorm Ju lia RainfalGau geselection Miles 5 Windsor Woods Boundary Rain Gauges SelectedGau ge HRSD MMPS-140 PU-587 PW 16- Plaza Windsor Woods
36 Ü 5 MMPS-036,692 in 5 MMPS-140,748 in MMPS-160,854 in 5 PU-526,944 in 5 5 MMPS-144,697 in Sources: Esri, HERE, DeLorme, USGS, Intermap, INCREMENT P, NRCan, Esri Japan, METI, Esri China (Hong Kong, Esri Korea, Esri (Thailand, MapmyIndia, NGCC, OpenStreetMap contributors, and the GIS User Community Figure3-7 October27 30,2012HuricaneSandy RainfalGaugeSelection Miles 5 Legend Rain Gauges Windsor Woods Boundary SelectedGauge HRSD MMPS-036 HRSD MMPS-140 HRSD MMPS-144 HRSD MMPS-160 PU Gage-526
37 Ü MMPS-160, 315 in 5 5 MMPS-140, 124 in 5 PU-526, 116 in Sources: Esri, HERE, DeLorme, USGS, Intermap, INCREMENT P, NRCan, Esri Japan, METI, Esri China (Hong Kong, Esri Korea, Esri (Thailand, MapmyIndia, NGCC, OpenStreetMap contributors, and the GIS User Community Figure 3-8 August 1, 2012 Rainfall Gauge Selection Miles 5 Legend Rain Gauges Windsor Woods Boundary Selected Gauge HRSD MMPS-140 HRSD MMPS-160 PU Gage 526
38 Section 3 Model Calibration 32 Tidal Boundary Conditions Tide data recorded by the United States Geological Survey (USGS in Thalia Creek at Route 58 (Virginia Beach Boulevard was used for the September 2016 calibration storm This location coincides with the Thalia Creek outfall of the WS 4 Model Data was extracted from the USGS in feet NAVD to match the model datum and was used directly as a time series boundary condition in the model For the October 2012 Hurricane Sandy storm, tide measurements were collected at the National Oceanic and Atmospheric Administration (NOAA Chesapeake Bay Bridge and Tunnel (CBBT gauge near the mouth of the Lynnhaven River Since this gauge is far downstream of the WS 4 model outfall, tide elevations and timing at the Thalia Creek and Virginia Beach Boulevard outfall were estimated, as described below The City s rainfall correlated tide/surge analysis by Dewberry (Rainfall Correlated Tailwater Elevations for the Lynnhaven Watershed, 2017 provided draft tidewater surfaces (rasters of the Lynnhaven River For the Hurricane Sandy event, CDM Smith compared these rasters to the NOAA CBBT gauge data and determined: High tide at the Virginia Beach Boulevard outfall would be approximately 05 feet higher than the CBBT high tides A 75-minute delay in high tide at Bonney Road (1/2 mile upstream of Virginia Beach Boulevard compared to the CBBT gauge; the timing was developed using measurements taken from the Princess Anne Plaza Watershed Study (Parsons Brinckerhoff, 2014 For the August 2012 storm, the CBBT gauge showed little to no increase over normal tides Since the tide analysis showed little change in amplitude between the CBBT gauge and Virginia Beach Boulevard under the smaller event rainfall conditions, no correction in amplitude was provided for this storm However, the same 75-minute delay in the timing of the tide was applied to the August 2012 storm 33 Calibration The WS 4 model was run for Tropical Storm Julia from 9:30 am on September 19, 2016, to 10:00 am on September 21, 2016 The start time was set at a relatively low tide to match the initial depths in the model setup The end time was set to match the time of the CDM Smith field reconnaissance While some locations peak stages were higher prior to the site visit, most locations experienced peak stages later the evening of September 21, 2016 However, since the timing of the flood depths were known from the site visit, the model depths at the simulation end time could be used in the analysis instead of simply using model node peaks Initial simulations indicated that model-predicted levels of Lake Windsor and the Windsor Woods Canal were too low This was resolved by modifying the center channel and bank roughness to both the Thalia Creek and Windsor Woods Canal transects, including the portion of the canal modeled in 2D For the Windsor Woods Canal, photos taken at normal water elevations showed tree branches 3-10
39 Section 3 Model Calibration hanging in the water along its banks This condition would cause additional losses when the flows are deeper, which was accounted for in the model (Appendix B, Table B-6 Additionally, the Thalia Creek roughness adjustments (both upstream and downstream of Lake Windsor were based on aerial photography and Google Earth photos Prior analysis of smaller storms and previous reports indicate that the Windsor Woods neighborhood has poorly draining soils Therefore, to calibrate the model, the soils infiltration was adjusted to provide more runoff The dual class C/D soil labeled as Land Complex was converted from a C class soil (such as a silt loam to a D class soil (such as a sandy clay, with the corresponding saturated hydraulic conductivity reduced to 002 inches per hour This matches values used in previous work done in this area by other consultants 331 Capacity Constraints Identified during Field Investigation Following the extensive flooding during Tropical Storm Julia in September 2016 and Hurricane Matthew in October 2016, site visits to the Windsor Woods neighborhood revealed several conditions causing the SMS to perform below its original intended capacity Appendix A includes a comprehensive summary of these visits, including memoranda and data sources that aided the calibration and validation efforts Highlights of the findings include: October 14, 2016: Twenty inches of sediment was found in the 54-inch diameter outfall pipe draining Presidential Boulevard and adjacent neighborhoods to the north to the Windsor Woods Canal October 20, 2016: The entrance to the 7-feet arch culvert was damaged (located under South Boulevard from the ditch along I-264 to Lake Windsor Increased Manning s roughness value and the entrance loss increased A damaged backflow preventer was also found on the outfall pipe that drains Brentwood Crescent to the I-264 ditch (Node The capacity of this pipe was subsequently reduced and the exit loss significantly increased Additionally, the outfall pipe from Palace Green Boulevard to the I-264 ditch (Node was found to be partially blocked This was represented in the model with a partially filled circular pipe and additional losses Finally, the center channel and bank roughness values of the I-264 ditch were revised based on the observed condition of the ditch October 28, 2012: The system near Presidential Boulevard and South Plaza Trail was found to have mostly clean inlets, except for the last pipe, which is the same pipe where 20 inches of sediment were found at the outfall end during the October 14, 2016 visit A hole was observed in the top of the outlet pipe, allowing soils to cave in and block flow Therefore, this pipe was set to a filled circular pipe (4 feet of the available 45-feet diameter was considered filled in the validation model 332 Calibration Results With the aforementioned H/H model revisions, the Windsor Woods model results show agreement to within 03 feet at all 14 observed flood elevation points (see Table 3-1, which is within the uncertainty of the observations and the expected accuracy of the model The flooding elevations, as shown in Figure 3-2, were observed during the field reconnaissance described in 3-11
40 Section 3 Model Calibration the memorandum in Appendix A bookmarked as 09/21/2016 This memorandum describes the methodology used to estimate flood elevations based on observed conditions, and includes the likely uncertainty of the result It should be noted that the uncertainty does not take into account the vertical accuracy of the LiDAR DEM (see Appendix B Additionally, continuous pools of floodwater should be at the same elevations, while the estimations of the observed elevations do vary some (Item 5, Item 6, and Item 7 are basically the same flood pool, as are Item 10 and Item 11 Table 3-1 September 21, 2016 Flood Elevations at 10:00 AM 1 2 ID Location N Rosemont Road between Old Forge Road and Club House Road S Rosemont Road between Old Forge Road and Club House Road Flood Elevations (feet NAVD Observed Model Delta (feet Rosemont Road near St Francis Church South Plaza Trail and Palace Green Boulevard Silina Drive and Palace Green Boulevard Starlighter Drive east of Palace Green Boulevard Silina Drive north of Windsor Woods Boulevard Silina Drive north of Colonial Parkway Brentwood Crescent south of Cortland Lane South Boulevard west of Brentwood Crescent Lake Windsor near South Boulevard South Boulevard near Lake Windsor South Plaza Trail south of the Windsor Woods Canal
41 Section 3 Model Calibration 34 Validation Following calibration, model simulations were performed for the August 2012 event and the October 2012 event, with the same parameters as the calibration model for locations shown in Figure 3-2 These include the two locations noted in the YouTube video referenced earlier and the location of the photograph from the 2014 report, as listed in Table 3-2 The memorandum in Appendix A bookmarked 08/01/2012 includes stills from this video and the analysis used to determine the peak flood elevations Table 3-2 provides a table of flood locations and depths of flooding Table 3-2 August 2012 High Water Marks and Complaint Locations Location Rosemont Road south of Kings Point Road South Plaza Trail and Palace Green Boulevard South Boulevard and Palace Green Boulevard Source Flood Elevations (feet NAVD Observed Model Delta (feet 2014 Report You Tube Video You Tube Video The results validate the model both within the 2D model area at Palace Green Boulevard and South Plaza Trail, and within the 1D model area at Palace Green Boulevard and South Boulevard The model was also run for the October 2012 event to validate the model under separate storm conditions The City s 2014 study provided two photos of flooding within the Windsor Woods model as located in Figure 3-2 and listed in Table 3-3 Table 3-3 October 2012 High Water Marks and Complaint Locations Location Source Flood Elevations (feet NAVD Observed Model Delta (feet Gladstone Drive and Old Forge Road 2014 Report Corner of Gladstone Drive 2014 Report The model results are within 03 feet of the estimated high-water marks It is possible that partial sedimentation of the outfall pipe could account for the difference, although this difference is well within the accuracy at which the high-water mark can be estimated 3-13
42 Section 3 Model Calibration 35 Hurricane Matthew and Further Revisions Following calibration, the model was verified with Hurricane Matthew The model was used to simulate this storm and develop a map of flood extents Model results identified approximately 330 homes impacted by Hurricane Matthew, which compared well with information compiled by the City from reported damages The model was calibrated, validated, and verified by November 2016; however, prior to the final proposed condition analysis, an additional survey was conducted within WS 4, and therefore the wider WS 4 model was revised Additionally, the impervious coverage was updated to the 2017 estimate provided in Section 2 To confirm these changes did not significantly change the model calibration, Tropical Storm Julia was re-simulated with the updated model Table 3-4 presents the results of the revised model compared to observed flood elevations The range of offsets from modeled to observed was +/- 03 feet, which remains within the uncertainty of the observations and the expected accuracy of the model Table 3-4 September 21, 2016 Flood Elevations at 10:00 AM (Revised Model 1 2 ID Location N Rosemont Road between Old Forge Road and Club House Road S Rosemont Road between Old Forge Road and Club House Road Flood Elevations (feet NAVD Observed Model Delta (feet Rosemont Road near St Francis Church South Plaza Trail and Palace Green Boulevard Silina Drive and Palace Green Boulevard Starlighter Drive east of Palace Green Boulevard Silina Drive north of Windsor Woods Boulevard Silina Drive north of Colonial Parkway Brentwood Crescent south of Cortland Lane South Boulevard west of Brentwood Crescent Lake Windsor near South Boulevard South Boulevard near Lake Windsor South Plaza Trail south of the Windsor Woods Canal
43 Section 4 Existing Conditions Model Results The calibrated model was run for the 2-year, 10-year, 50-year, and 100-year NOAA Type C 24-hour design storm events under the existing (2017 land use condition The methodologies used to develop the design storm hyetographs are presented in Appendix B, Section B4 The design storm volumes range from 37 inches with a 6-minute peak intensity of 41 inches per hour for the 2-year storm to 95 inches with a peak 6-minute intensity of 107 inches per hour for the 100-year storm (the hyetographs are discretized in 6-minute intervals Table B-2 in Appendix B gives the volume and intensity data for all storms presented in this report The existing condition model is similar to the calibrated model such that the existing hydrologic conditions (such as the amount of impervious cover and primary hydraulic conditions (eg, pipes, culverts, and ditches are the same in both The primary differences are the tailwater conditions for each storm and the initial depths corresponding to the tailwater Similar to the masterplan models, rainfall-correlated tailwater conditions are used for the 50-year and 100-year design storms For the 2-year and 10-year design storms, the king tide stage is used to be conservative since the rainfall-correlated tailwater stages are lower than king tide stages (see Appendix B58 for more information For the sea level rise scenarios, fixed increases of 15 feet and 3 feet are added to each tailwater condition, respectively All boundary conditions are set to Fixed Stage if the tailwater condition is higher than the outfall, otherwise Normal boundary conditions are set for the outfall Initial depths in the model are set to match the corresponding fixed tailwater condition, unless there is a structure in the SMS, in which case the higher of the tailwater condition or the structure invert is used to set the initial condition 41 Target Level of Service (LOS The target LOS for the 10-year, 100-year, and 24-hour design storms were determined from multiple meetings between CDM Smith and the City Discussions centered on public concern and project feasibility, among other topics, leading to the following project-specific level of service (LOS: Limit peak stages to 3 inches or less above the road crown for the 10-year design storm Prevent flooding of structures for the 100-year design storm To model the 10-year LOS for this project, indicator elevations were estimated from the DEM at all potential intersections with simulated flooding within the study area For the 100-year storm, the edge of the building footprint was intersected with the simulated flood extent to determine if the structure would be counted as flooded In some cases, incidental overlap between the edge of the building and the flood extent was dismissed (and not counted as a flooded structure, if the overlap was within the uncertainty of the DEM interpolation 4-1
44 Section 4 Model Results 42 Results for 10-year Design Storm The results of the existing condition simulations indicate that 88 of 134 intersections do not meet the LOS described above for the 10-year storm The complete list of indicator elevations and flood depths is presented in Appendix C Table 4-1 is a summary of the expected flooding for critical locations where flooding is expected to be more than 10 feet above the road crown The maximum flood depth is 18 feet above the road crown indicator elevation for the 10-year storm at Windsor Woods Boulevard and Windsor Woods Court Figure 4-1 shows the 10-year storm flood map for the study area Table 4-1 Summary of Existing Conditions, 10-year Storm Results Model Node Location Windsor Woods Boulevard and Windsor Woods Court South Boulevard and Brentwood Crescent South Boulevard and Palace Green Boulevard NW Silina Drive and Windsor Woods Boulevard Estimated Crown (feet NAVD 10-year Existing (feet NAVD Delta (feet Old Forge Road and Grist Mill Road Palace Green Boulevard and Starlighter Drive Presidential Boulevard and Gresham Court Presidential Boulevard and Kings Point Road Presidential Boulevard and Teakwood Drive Old Forge Road and S Kings Point Road Presidential Boulevard and Gladstone Drive South Boulevard and Palace Green Boulevard NE Woodlake Road and Woodlake Court Kings Point Road near Kings Point Court Presidential Boulevard and Old Forge Road Kings Point Road and Kings Point Arch W Kings Point Road and Kings Point Arch E Concord Bridge Road and Grist Mill Road S Kings Point Road and Kings Point Road Windsor Gate Circle
45 Section 4 Model Results Additional insight into the 10-year flood depths under existing conditions was provided by model simulations that were completed with Lake Windsor and the Windsor Woods Canal maintained at a fixed water level of 2 feet NAVD throughout the simulation Even in this optimum and physically impossible condition, the existing SMS did not meet the desired LOS, except for the roads immediately adjacent to the canal This indicates that the stormwater pipes in the neighborhood are undersized and not able to accommodate the volume and intensity of the 10-year design storm 4-3
46 Section 4 Model Results This page intentionally left blank 4-4
47 Ü Thalia Creek Brentwood Crescent South Blvd Palace Green Blvd Legend Boundary Hydrography 264 Flood Depth ft ft ft ft ft > 20 ft South Blvd 264 Silina Dr Lake WIndsor W Colonial Pkwy S Plaza Trail Presidential Blvd Rosemont Rd Old Forge Rd Silina Dr Lake Trashmore Windsor Gate Pl S Plaza Trail Old Forge Rd Miles Figure 4-1 Windsor Woods Existing Conditions 10-year Storm Flooding
48 Section 4 Model Results This page intentionally left blank 4-6
49 Section 4 Model Results 43 Results for 100-year Design Storm The results of the existing condition simulations for the 100-year design storm are shown in Figure 4-2 This figure represents a flood extent map of the 100-year storm, superimposed on an aerial photograph of the study area The simulated flood extent intersected the building footprint for a total of 357 houses for the 100-year design storm Specific areas of concern include Old Forge Road, Kings Point Road, and Presidential Boulevard and most of their side streets; West Colonial Parkway near Lake Windsor; Brentwood Crescent near South Boulevard; Silina Drive near Palace Green Boulevard; Palace Green Boulevard near Windsor Woods Boulevard and South Boulevard; and N Donnawood Court 44 Results for All Storms The results of the existing condition simulations for the 2-year, 10-year, 50-year, and 100-year design storms, with and without sea level rise are presented in Appendix C Table C-1 through Table C-9 present the peak stage compared to the road crown elevations at intersections within the neighborhood for each design storm/sea level rise scenario 4-7
50 Section 4 Model Results This page intentionally left blank 4-8
51 Ü 264 Legend Boundary Hydrography Flood Extent Thalia Creek Brentwood Crescent South Blvd Palace Green Blvd South Blvd 264 Silina Dr Lake WIndsor W Colonial Pkwy S Plaza Trail Presidential Blvd Rosemont Rd Old Forge Rd Silina Dr Lake Trashmore Windsor Gate Pl S Plaza Trail Old Forge Rd Miles Figure 4-2 City of Virginia Beach Windsor Woods Existing Conditions: 100 Year Storm Flooding
52 Section 4 Model Results This page intentionally left blank 4-10
53 Section 5 Alternative Solution Sets 51 Overview of Alternatives The results presented in Section 4 indicate that the existing Windsor Woods SMS is not sufficiently sized to meet the 10-year storm LOS Furthermore, for the 100-year storm and the 2016 extreme weather events, the modeled SMS lacks adequate capacity to convey flows away from the subdivision The simulated flood depths are too deep for normal traffic to pass through and the duration of flooding can last for many hours The City s objective with this master plan is to develop a phased Capital Improvement Program (CIP that identifies both short-term and long-term solutions The short-term solutions would address immediate, readily correctible issues; the more comprehensive, longer-term solutions will enhance the overall LOS provided by stormwater infrastructure in the area 511 Evaluation for Future Conditions As noted in Section 2 and Section 3, the existing condition model was calibrated and validated based on the 2015 land use conditions and checked using the updated 2017 land use conditions However, the alternatives analyses discussed in this section were completed using future conditions derived from the City s zoning information and future impervious areas The intent of using future conditions is to size the formulated improvements, especially those sensitive to runoff volume, to accommodate potential increased runoff from undeveloped parcels slated for future development Since Windsor Woods is built-out, the changes in future land use were mostly limited to adjacent neighborhoods Therefore, due to the differing land use between the existing and alternatives model, some locations outside of Windsor Woods showed a peak stage increase As such, these locations, where localized flooding was caused by future land use and not a decrease in LOS, were not considered an adverse impact caused by the proposed alternative Peak stages and flows further downstream in Thalia Creek and north of I-264, however, were analyzed to consider potential offsite impacts The locations where peak stage increases are directly related to changes in impervious land use highlight the importance of the continued implementation of site-specific solutions since these areas are developed 5-1
54 Section 5 Alternative Solution Sets 512 SMS Improvement Elements The model identified several key requirements for the Windsor Woods SMS to meet the desired LOS These may be separated into near-term and long-term flood mitigation options The following near-term options would restore the system closer to its original capacity: Canal dredging of the Windsor Woods Canal, which is planned to occur in late 2017, to reduce head loss along the canal, to fully utilize the downstream storage, and to repair the canal to a conveyance capacity close to the original design Canal dredging of the Windsor Oaks Canal, also planned to begin in late 2017, for similar reasons Repair or replacement of damaged or blocked pipes found during the field surveys Longer-term flood mitigation options will require more extensive engineering design, environmental permitting and capital investment The flood mitigation options listed below should be designed and implemented in a sequence such that a solution that benefits one area would not adversely impact an adjacent area As such, the following are listed in order of preferred implementation: Construct the Lake Windsor Pump Station and gated control structure located on Thalia Creek in the northwest corner of Lake Windsor, just south of I-264 Directly connect Lake Trashmore to Thalia Creek and Lake Windsor to maximize available storage volume Lower stages in the entire system behind the gated structure to 0 feet NAVD prior to an impending storm Increase the size of the SMS within the Windsor Woods neighborhood to improve conveyance toward Windsor Woods Canal Increase the conveyance capacity of the ditch along the south side of I-264 Construct pipe improvements to drain Rosemont Road east to the golf course Section 7 contains additional considerations to be investigated and refined through engineering design, including defining the normal pump station operating conditions during an event, and prior to an event when lowering lake water levels Additional considerations include emergency operating procedures for the pump station and gate structure during a loss of power 5-2
55 Section 5 Alternative Solution Sets A critical aspect of evaluating improvement alternatives for Windsor Woods was the potential for adverse impacts downstream in Thalia Creek, north of I-264 The capacity and operation of the Lake Windsor Pump Station was sized to limit downstream increases in water surface elevation in Thalia Creek, and prevent increases in flooding above existing condition elevations CDM Smith developed multiple initial alternatives based on the near-term and long-term flood mitigation options A common challenge with most alternatives was the ability to meet the targeted LOS or resulting adverse offsite impacts Section 52 presents discussion of the five alternatives evaluated and significant findings generated during the alternative analysis process 5-3

56 Section 5 Alternative Solution Sets 52 Alternative Descriptions The following presents a summary of features associated with near-term and long-term flood mitigation options tested as part of the various alternatives The options were combined and built upon one another until the target LOS was met and adverse offsite impacts were removed Figure 5-1 provides additional detail of the improvements that comprise each alternative and illustrates the progression as each successive alternative was developed The alternative improvements identified in this study are conceptual Implementation of any identified alternative should be advanced from planning level through engineering design, as the location of improvements may vary to account for siting, permitting and construction constraints To analyze structure flooding, the 100-year storm flood map was superimposed on aerial photography and inspected for overlap Surveys were conducted at garages in low-lying areas of Windsor Woods (old Forge Road, Presidential Boulevard, and Kings Point Road to confirm this methodology For the 10-year storm LOS, peak stages were compared to road crown indicator elevations at intersections throughout the neighborhood The Windsor Woods model evaluations occurred in several iterations, following the sequence shown in Figure 5-1 Figure 5-1 Alternatives Iterations 5-4
57 Section 5 Alternative Solution Sets The concept behind the alternatives formulated for Windsor Woods was to provide additional conveyance within the neighborhood, additional storage, and a pump station to overcome downstream tidal conditions The Windsor Woods neighborhood is too built-out and does not include enough open space to fully contain the 100-year storm within the neighborhood without flooding a significant number of existing homes To meet the targeted LOS, a pump station is necessary to move water out of the neighborhood; however, pumping water from one neighborhood to another can cause adverse offsite impacts This is mitigated somewhat by dropping the Lake Windsor stage prior to the storm and creating a storage volume to be filled by the storm However, the additional storage volume alone is not large enough to meet the LOS in the neighborhood for the larger storms, and therefore the pump must run during the storm In order to not cause adverse offsite impacts, the pumped flows cannot be greater than the existing flows from Lake Windsor to Thalia Creek The pump capacity necessary to meet the target LOS is much higher than the existing peak flows from Lake Windsor to Thalia Creek Only after the gated structure was moved to Thalia Creek and the pumped system included Lake Trashmore and the upstream system, was there enough storage volume to meet LOS with a pump capacity that matched the existing storm flows Listed below are several significant findings of the alternatives analysis: Test 1: The model was tested with a 10-year design storm using a fixed stage in Lake Windsor of 2 feet NAVD The results revealed the upstream Windsor Woods SMS does not have sufficient capacity to meet the targeted 10-year LOS Test 2: The proposed dredging of the Windsor Woods Canal (currently under design was added to the model With Lake Windsor and the Canal again fixed hypothetically at 2 feet NAVD, the SMS still did not meet the 10-year LOS, though there was improvement immediately adjacent to the canal Alternative 1: The existing condition model with the proposed dredging of the Windsor Woods Canal was simulated with normal Lake Windsor operations (ie, Lake Windsor drained naturally to Thalia Creek The results indicated that the canal dredging did not significantly affect the 100-year storm results Though the improved canal capacity lowers the HGL and thus upstream stages during period of peak flow, the 100-year storm flood elevation peak occurs well after peak runoff The 100-year storm flood is more dependent on the total volume of flood water in the system tributary to Thalia Creek and Lake Windsor then the peak intensity of the storm Alternative 1A: The constraints to SMS capacity found during the field surveys were repaired (See Section 331 and Appendix A The repairs improved the LOS locally near the repaired pipe, though did not meet the target LOS at any location Alternative 2: The recommended improvements from the Princess Anne Plaza Watershed Study (Parsons Brinckerhoff, 2014 were added to the model, but the results revealed that these improvements alone would not meet the targeted 10-year LOS The recommended improvements also created adverse offsite impacts and thus were not feasible without further mitigation options 5-5
58 Section 5 Alternative Solution Sets Alternative 2A: The initial depth in Lake Windsor was set to 0 feet NAVD (using the pump station and gate structure recommended in the 2014 study Alternative 3: The pump station capacity was increased to 400 cubic feet per second (cfs, additional proposed pipes were added in the Windsor Woods neighborhood, the ditch adjacent to the eastbound lanes of I-264 was dredged and a concrete center channel implemented These improvements also created adverse offsite impacts and thus were not feasible without further mitigation options Alternative 4: The proposed dredging of the Windsor Oaks Canal (currently under design was added to the model This allowed for a reduction in proposed pipe sizes in this neighborhood, but did not significantly affect LOS nor did it affect the proposed alternative feasibility, since adverse offsite impacts remained Alternative 4A: A force main under I-264 from Lake Windsor to Thalia Creek, immediately downstream (north of I-264 was implemented to test reductions in offsite impacts Though the force main resulted in lower head loss under I-264, and therefore reduced the peak stages in Thalia Creek upstream of Lake Windsor, it did not mitigate all adverse offsite impacts At this point, under this proposed configuration, either the Windsor Woods LOS would have to be reduced further, or Thalia Creek would need to be dredged downstream of I-264 However, for this study, alternatives were limited to minimize environmental impacts and avoid downstream adverse impacts This alternative was eliminated from further consideration since improvements or property acquisition would be required in the Thalia Creek floodplain downstream (north of I-264 Alternative 5: Due to the constraints of the previous alternatives, a new configuration was suggested by the City This alternative moves the pump station and gated structure to Thalia Creek, immediately upstream of I-264 (south of South Boulevard This configuration allows for a significantly larger tributary area to be drawn down to 0 feet NAVD prior to the storm, including: Lake Trashmore, Thalia Creek to the Holland Road Structure, and Shoreline Lake 1 through Shoreline Lake 3 Since the tributary area upstream of the gated structure is significantly increased, the pump station was increased as well, to a total capacity of 900 cfs Also, the control structure for Lake Trashmore was removed and replaced with two 6-feet by 10-feet box culverts, essentially connecting Lake Trashmore directly to Thalia Creek Alternative 5A: Thalia Creek, between Lake Trashmore and the proposed pump station was dredged to a depth of -3 feet NAVD (including a 3:1 side slope from existing banks and a 0035 center channel roughness Additionally, the 800 linear feet berm at the entrance of Lake Windsor from the creek, was removed, affectively shortening the channel length This new configuration mitigated offsite impacts upstream of the project, by lowering the initial depth and creating a significant amount of stormwater storage Downstream of the project, offsite impacts were mitigated by limiting the pump station to match existing flows This is performed by using stage triggers in the pump station and not allowing full pump capacity until the lakes reach high stages 5-6
59 Section 5 Alternative Solution Sets 521 Alternative 1: Canal Dredging & Restoration to Original Design The known capacity constraints identified during site visits following Hurricane Matthew in October 2016 (see Section 331 were fixed in the model to restore the system to its original capacity These changes included the sediment-filled pipe at the end of the Windsor Woods Canal at Presidential Boulevard, the partially crushed outfall pipe at the end of the I-264 ditch (South Boulevard culvert and the partially blocked outfalls to the I-264 ditch Currently under design, the model also included the post-dredged condition of the Windsor Woods Canal The Windsor Woods Canal is to be dredged to -2 feet NAVD upstream of South Plaza Trail, and between -3 feet to -4 feet NAVD downstream of South Plaza Trail, with approximately 3:1 side slopes Vegetation is to be removed from the banks, effectively removing the branches that hang in the canal during high flow conditions, which cause the high channel roughness Manning s roughness values were lowered to 0035 for the center channel and 004 for the banks The results of this alternative had a minimal impact on the 10-year flooding, with roads immediately adjacent to the canal meeting LOS, but those a few blocks away not significantly improved from the existing condition The canal was also analyzed under a hypothetical simulation where Lake Windsor was held at 2 feet NAVD throughout the simulation Even under this artificially low tailwater condition, the upstream SMS was insufficiently sized to handle the 10-year storm The results of this alternative identified the need to improve the upstream SMS under any mitigation effort to meet the targeted LOS Repairing the partially blocked and damaged pipes improved LOS locally, but still did not meet the target LOS in those locations Canal dredging to repair the canal close to the original capacity and replacing or cleaning damaged or blocked pipes are near-term options which may be implemented immediately These options repair the system to original design and therefore are not constrained by peak stages elsewhere in the watershed The following options, on the other hand, need to not adversely affect offsite stages to be feasible The longer-term options need to be phased in such that the potential offsite impacts are mitigated first, then the local improvements added However, in the alternative development, options were added to meet LOS first, then the offsite impacts were addressed Only the recommended alternative is a feasible option due to offsite impacts 522 Alternative 2: Implement 2014 Study Recommendations Alternative 2 incorporated the recommended improvements from the Princess Anne Plaza Watershed Study (Parsons Brinckerhoff, 2014 which identified pipe diameter increases to the SMS Also included were a 350 cfs pump station and gated structure on Thalia Creek, just south of I-264 The results of this alternative showed that the pump station was insufficiently sized for the peak flow in Thalia Creek, leading to increased flood stages upstream Furthermore, this option did not alleviate the flooding concerns in Windsor Woods, except for one location: Rosemont Road and South Plaza Trail, where the flooding was resolved 5-7
60 Section 5 Alternative Solution Sets The proposed gate and pump station structure was moved further upstream, between Lake Windsor and Thalia Creek, which was recommended in the previous study Specific details in the previous study included the following: Note (a the pump station size was lowered to 340 cfs Note (b The initial elevation was set to 1 feet NAVD Parsons Brinckerhoff started at 1 feet NAVD but allowed the head to drop to -2 feet NAVD prior to the onset of the peak of the storm For evaluation of Alternative 2 the pump was turned off if the elevation fell below the initial 1 feet NAVD after initially starting at elevation -2 feet NAVD The proposed gated structure is designed as a 7 feet high by 24 feet wide operable gate, which was sized to have similar capacity as the existing culverts under I-264 The gate is designed to open and closed based on telemetered upstream and downstream stages and only remain open when then upstream stage is greater than the downstream stage This alternative increased offsite peak stages and did not solve all of the Windsor Woods simulated flooding areas, though the solution was better within Windsor Woods because the lake stages were lower Based on the previous tests and alternative simulations, many additional drainage systems would be necessary to meet the target LOS everywhere Additionally, to not have homes flood for the 100-year storm, the pump station capacity would need to be increased 523 Alternative 3 Alternative 3 included CDM Smith options to mitigate the remaining simulated flooding The pump station remained between Lake Windsor and Thalia Creek and offsite mitigation options were not yet investigated The initial depth in Lake Windsor was lowered to 0 feet NAVD, the pump station was increased in capacity to 400 cfs and additional SMS capacity improvements (eg, larger pipes and culverts were added The ditch along the south side of I-264 was improved to a concrete lined channel from the Palace Green Boulevard outfall to the culvert under South Boulevard The ditch bottom drops from 3 feet NAVD to -2 feet NAVD, which is not significantly deeper than the natural bottom The concrete lined center channel is a trapezoid with 15:1 side slopes to natural grade and a center channel that ranges from 2-feet wide at the upstream end to 8-feet wide at the downstream end The culvert under South Boulevard at the end of the ditch is replaced with a 6-feet by 10-feet rectangular concrete culvert in this alternative Alternative 3 met the target LOS within Windsor Woods, but it caused significant offsite impacts, which still had not been addressed Stages in Thalia Creek increase, both upstream and downstream of Lake Windsor, because 400 cfs at the peak of the storm is much higher than the existing flow between Lake Windsor and Thalia Creek The proposed alternative moves more stormwater into Lake Windsor, and at a much faster pace, than the existing SMS 5-8
61 Section 5 Alternative Solution Sets 524 Alternative 4 Alternative 4 included dredging the Windsor Oaks Canal (currently under design and reducing the proposed pipes in the neighborhood of the canal The design of the south end of the canal shows a -3 feet NAVD bottom, 37 feet wide, and a 2:1 side slope The design of the north end of the canal is a 10-feet wide bottom at -2 feet NAVD, with 2:1 side slopes Center channel Manning s roughness was reduced to 0035 and bank roughness was reduced to 005 for these channels Alternative 4A tested a 500 feet long force main under I-264 from the Lake Windsor Pump Station to Thalia Creek downstream of the I-264 culvert The force main was tested because there is nearly a foot of head loss through the culvert at the peak of the 100-year storm, and stages needed to be reduced in Thalia Creek to mitigate offsite impacts The force main was tested with a 5-feet diameter which produced a head of over 20 feet NAVD This would significantly change the type of pumps that could be used in the pump station, though this was not investigated further since the force main did not alleviate all the adverse offsite impacts and would not be feasible without further alterations to Thalia Creek, downstream of I-264 Figure 5-2 illustrates Alternative 4, including the pump station and gated control structure serving only Lake Windsor and the areas upstream within Windsor Woods This alternative does not include improvements to connect Lake Trashmore to the upstream side of the gate structure, as discussed below under Alternative 5 Additionally, Alternative 4 does not mitigate adverse offsite impacts, or meet the target LOS, and is therefore not recommended 525 Alternative 5 Alternative 5 provides a solution to prevent adverse offsite impacts by moving the gated structure and pump station to Thalia Creek, thus providing significantly more available storage volume prior to the storm Because the entire Thalia Creek watershed, upstream of I-264 is behind the structure, upstream stages are reduced or remain the same Downstream impacts are regulated by maintaining the pumped flows in Thalia Creek at the same levels as existing flows 5251 Alternative 5 Model Elements The starting water surface elevation upstream of the pump station is set to 0 feet NAVD within: Lake Windsor, Lake Trashmore, Shoreline Lake 1 through Shoreline Lake 3, Thalia Creek from the proposed structure at I-264 to the existing Holland Road structure, the Windsor Woods Canal, and the ditch from Windsor Gate Road to Shoreline Lake 2 The Windsor Oaks Canal has a control structure at 18 feet NAVD The Lake Trashmore Control Structure replaced with two 6-feet by 10-feet box culverts under the lake berm adjacent to Thalia Creek A 200-feet long culvert at the southern end of the lake and a 150-feet long culvert at the northern end The culverts allow a high capacity connection between the lake and Thalia Creek Dredging of Thalia Creek between the southern Lake Trashmore culvert and the southern edge of Lake Windsor, to a -3 feet NAVD bottom depth, with a 5-feet wide bottom and 3:1 side slopes The Manning s roughness is expected to reduce to 0035 in the center channel and 005 along the banks 5-9
62 Section 5 Alternative Solution Sets The natural berm between Thalia Creek and Lake Windsor is removed to effectively shorten the length of the creek between Lake Trashmore and Lake Windsor, and Lake Windsor and the proposed pump station Approximately 800 linear feet of berm to be removed Pump station capacity was sized to avoid downstream increases in water surface elevation (Thalia Creek, north of I-264 while providing maximum LOS within Windsor Woods To not cause offsite impacts, the pump station is designed to increase capacity as the stage in Lake Windsor increases (ie, the full 900 cfs capacity is not utilized until Lake Windsor is near full capacity The conceptual set points for pump operation are as follows: 200 cfs on at 05 feet NAVD, off at 0 feet NAVD 100 cfs (300 cfs total on at 20 feet NAVD, off at 0 feet NAVD 200 cfs (500 cfs total on at 55 feet NAVD, off at 2 feet NAVD 100 cfs (600 cfs total on at 6 feet NAVD, off at 2 feet NAVD 100 cfs (700 cfs total on at 62 feet NAVD, off at 2 feet NAVD 200 cfs (900 cfs total on at 65 feet NAVD, off at 2 feet NAVD All elements from Alternative 1 through Alternative 4, except the force main tested as part of Alternative 4 and the alternate location of the pump station and gated structure Two critical issues need to be resolved for the Windsor Woods SMS to meet the desired LOS: Increasing Capacity in the Windsor Woods SMS: The SMS needs to be increased to improve conveyance from the neighborhood to the I-264 ditch, Lake Windsor, the Windsor Woods Canal, and the Windsor Oaks Canal The pump station and improved canals/ditches provide the capacity to lower peak stages to the target LOS, but the existing SMS is not designed to meet the volume and intensity of the SCS Type-C 10-year design storm As determined in the initial tests, Lake Windsor and the tributary canals can be held artificially low and the LOS would still not be met Expanding Storage Capacity and Pump Capacity: Increasing the conveyance from the neighborhood to Lake Windsor does not, by itself, provide LOS improvement for the 100-year storm because the total tributary volume to Lake Windsor is controlling the peak flood elevation of this storm, which occurs well after the peak local runoff Therefore, to meet the larger storm LOS, additional storage volume needs to be created by lowering peak stages prior to the storm, using the gated structure and the pump station Because the gated structure and pump station are used to mitigate adverse offsite impacts, it is recommended that this element be implemented prior to increasing the SMS within Windsor Woods, except for repairing existing pipes and canals to the original design (Alternative 1 Figure 5-3 presents the location of improvements in Alternative 5 and Table 5-1 describes the content of each improvement 5-10
63 36'Φ 32'x 49' Ü I-264Ditch: Co n cretelin edtra pezo idcha n n el 'Φ Legend Proposed Improvements C\ Ga tedco n tro lstructure Tha lia Creek La kew in dso r 300cfs PumpSta tio n a n d Ga tedco n tro lstructure Bren tw o o dcrescen t 18'Φ So uthblvd 43'x 68' 38'x 60' Pa la cegreen Blvd 18'Φ 38'x 60' 18'Φ 37 PS PumpSta tio n Dredg eexistin g Ditch Bo x Culvert Pipe So uthblvd 264 6'X8' 24'Φ 30'Φ 48'Φ 30'Φ 42'Φ Co n cretecen ter Cha n n el 37 PS C\ Disco n n ectla kew in dso r fro m Tha lia Creek Silin a Dr 32'x 49' 30'Φ Alternative 4 caused adverse offsite impacts in Thalia Creek and upstream areas, thus was not selected La ke Tra shmo re La kew In dso r Tha lia Creekdredg in g a n dla ketra shmo re co n n ectio n s n o t in cludedin Altern a tive4 36'Φ 38'x 60' 18'Φ 18'Φ 54'Φ 36'Φ W Co lo n ia lpkw y OldFo rg erd 24'Φ W in dso r Ga tepl 38'x 60' 43'x 68' 18'Φ 18'Φ 30'Φ 36'Φ 18'Φ 34'x 53' 30'Φ 36'Φ 24'Φ W in dso r W o o ds Ca n a l 38'x 60' 34'x 53' 24'Φ 30Φ 18'Φ 18'Φ 36'Φ 36'Φ 38'x 60' 43'x 68' 30'Φ 18'Φ 24'Φ OldFo rg erd Presiden tia lblvd 30'Φ 43'x 68' 58'x 91' 38'x 60' SPla za Tra il 30'Φ Silin a Dr Ro semo n trd 48'Φ Sho relin ela ke W in dso r Oa ks W estditch#1 18'Φ 30'Φ 24'Φ SPla za Tra il 24'Φ 24'Φ Miles Figure 5-2 City of Virginia Beach Alternative 4 - Lake Windsor Only Gate Structure and Pump Station Not Selected
64 Section 5 Alternative Solution Sets This page intentionally left blank 5-12
65 36'Φ 32'x 49' Ü I-264Ditc h : Co nc retelined Trap ezo id Ch annel 'Φ Legend Proposed Improvements C\ Gated Co ntro lstruc ture Th aliacreek LakeWindso r 900c fs Pump Statio nand Gated Co ntro lstruc ture Brentw o o d Cresc ent 18'Φ So uth Blvd 43'x 68' 38'x 60' Palac egreenblvd 18'Φ 38'x 60' 18'Φ 37 PS Pump Statio n DredgeExistingDitc h Bo x Culvert Pip e So uth Blvd C\ 37 PS 264 6'X 8' 24'Φ 30'Φ 48'Φ 30'Φ 42'Φ 32'x 49' 30'Φ Co nc retecenterch annel Remo veand Dredge LakeWIndso r SilinaDr 18'Φ 30Φ 18'Φ 18'Φ 30'Φ SPlazaTrail W Co lo nialpkw y 38'x 60' 43'x68' 30'Φ Windso rwo o ds Canal 38'x 60' Lake Trash mo re 6'X 10' 6'X 10' Th aliacreek 36'Φ 38'x 60' 18'Φ 54'Φ 36'Φ Old Fo rgerd 24'Φ Windso rgatepl 18'Φ 18'Φ 30'Φ 36'Φ 18'Φ 34'x 53' 36'Φ 24'Φ 38'x 60' 34'x 53' 24'Φ 36'Φ 36'Φ 43'x 68' 30'Φ 18'Φ 24'Φ Old Fo rgerd PresidentialBlvd 43'x 68' 58'x 91' 38'x 60' 30'Φ SilinaDr Ro semo ntrd 48'Φ Sh o relinelake Windso roaks WestDitc h #1 18'Φ 30'Φ 24'Φ SPlazaTrail 24'Φ 24'Φ Miles Figure 5-3 City of Virginia Beach Alternative 5 - Windsor Woods Proposed Stormwater Improvements
66 Section 5 Alternative Solution Sets This page intentionally left blank 5-14
67 Section 5 Alternative Solution Sets Table 5-1 Summary of Elements and Features for Recommended Improvements Item Feature Type 1 Pipe Addition 2 Pipe Addition 3 Pipe Addition 4 Pipe Addition 5 Pipe Addition 6 Pipe Addition 7 Pipe Addition 8 Pipe Addition 9 Pipe Addition 10 Pipe Addition 11 Pipe Addition 12 Pipe Addition Description (Refer to Figure 5-2 Construct 1200 linear feet (LF of 24-inch RCP across Rosemont Road north of Old Forge Road that outfalls to the eastern side of the road Construct 1370 LF of 48-inch RCP across Rosemont Road, along Clubhouse Road, that outfalls to Bow Creek Golf Course Construct 880 LF of 49-inch by 32-inch RECP along Van Buren Drive from S Gladstone Arch to the intersection of Presidential Boulevard and Old Forge Road Construct 30 LF of 36-inch RCP along Old Forge Road east of S Gladstone Drive Construct 905 LF of 49-inch by 32-inch RECP along Old Forge Road from S Gladstone Drive to east of Presidential Boulevard Construct 710 LF of 60-inch by 38-inch RECP along Presidential Boulevard from Old Forge Road Court to Gresham Court Construct 465 LF of 68-inch by 43-inch RECP along Presidential Boulevard from Gresham Court that connects to the proposed pipe described in Item 8 Construct 74 LF of 91-inch by 58-inch RECP from Presidential Boulevard that outfalls to Windsor Woods Canal Construct 471 LF of 68-inch by 43-inch RECP along Presidential Boulevard from Starlighter Drive to the proposed pipe described in Item 8 Construct 1415 LF of 30-inch RCP along Silina Drive from S Rosemont Road to Presidential Boulevard Construct 2745 LF of 68-inch by 43-inch RECP along Presidential Boulevard from Bentley Gateway to south of Starlighter Drive Construct 1523 LF of 30-inch RCP along South Plaza Trail from S Rosemont Road to Presidential Boulevard Comments 5-15
68 Section 5 Alternative Solution Sets Item Feature Type 13 Pipe Addition 14 Pipe Addition 15 Pipe Addition 16 Pipe Addition 17 Ditch Improvement 18 Pipe Addition 19 Pipe Addition 20 Pipe Addition 21 Pipe Addition 22 Pipe Addition 23 Pipe Addition 24 Pipe Addition Description (Refer to Figure 5-2 Construct 246 LF of 49-inch by 35-inch RECP north of Shenandoah Court that connects to the proposed pipe described in Item 12 Construct 510 LF of 30-inch RCP along N Donnawood Drive and Shenandoah Court that connects to the proposed pipe described in Item 13 Construct 530 LF of 30-inch RCP along Teakwood Drive from west of Rocky Mount Road to existing pipe west of N Donnawood Court Construct 250 LF of 18-inch RCP south of N Donnawood Court that connects to the pipe in Item 16 Dredge 3990 LF of Windsor Woods Canal Construct 140 LF of 24-inch RCP north of Kings Point Road that outfalls to Windsor Woods Canal Construct 305 LF of 18-inch RCP north of Old Forge Court that connects to the pipe described in Item 18 Construct 560 LF of 36-inch RCP along Red Lion Road that outfalls to Windsor Woods Canal Construct 855 LF of 30-inch RCP along Old Forge Road that connects to the pipe described in Item 20 Construct 220 LF of 68-inch by 43-inch RECP along Palace Green Boulevard north of Silina Drive that outfalls to Windsor Woods Canal Construct 545 LF of 60-inch by 38-inch RECP along Palace Green Boulevard from South Plaza Trail that connects to the pipe described in Item 22 Construct 71 LF of 30-inch RCP across Palace Green Boulevard south of South Plaza Trail that connects to the pipe described in Item 23 Comments Improve to a trapezoid channel, with a 20-feet wide bottom at -2 feet NAVD and 3:1 side slopes to meet existing grade; the center channel Manning s roughness value =
69 Section 5 Alternative Solution Sets Item Feature Type 25 Pipe Addition 26 Pipe Addition 27 Pipe Addition 28 Pipe Addition 29 Pipe Addition 30 Pipe Addition 31 Pipe Addition 32 Pipe Addition 33 Pipe Addition 34 Pipe Addition 35 Pipe Addition 36 Pipe Addition Description (Refer to Figure 5-2 Construct 1260 LF of 30-inch RCP across South Plaza Trail from east of Presidential Boulevard to east of Palace Green Boulevard Construct 73 LF of 30-inch RCP along Palace Green Boulevard north of South Plaza Trail that connects to the pipe described in item 23 Construct 40 LF of 18-inch RCP across Palace Green north of South Plaza Trail Construct 260 LF of 18-inch RCP along Palace Green Boulevard from Colonial Parkway to the pipe described in item 26 Construct 780 LF of 60-inch by 38-inch RECP north of Old Forge Road along Grist Mill Road, across Concord Bridge Road, and Charter Oak Road that outfalls to Windsor Woods Canal Construct 90 LF of 53-inch by 34-inch RECP across Old Forge Road that connects to the pipe described in item 29 Construct 275 LF of 24-inch RCP across Liberty Ridge Road that connects to the pipe described in item 30 Construct 925 LF of 36-inch RCP along Old Post Road east of Windsor Gate Road, and Old Forge Road that connects to the pipe described in item 30 Construct 450 LF of 24-inch RCP along Windsor Gate Road west of Turtle Cove Road that connects to the pipe described in item 32 Construct 409 LF of 24-inch RCP north of Concord Bridge Road that outfalls to Windsor Woods Canal Construct 71 LF of 18-inch RCP across Concord Bridge Road that connects to pipe described in item 34 Construct 625 LF of 53-inch by 34-inch RECP along South Plaza Trail north of Old Forge Road that outfalls to Windsor Woods Canal Comments The pipe will go across Charter Oak Road along its path 5-17
70 Section 5 Alternative Solution Sets Item Feature Type 37 Pipe Addition 38 Pipe Addition 39 Pipe Addition 40 Pipe Addition 41 Pipe Addition 42 Pipe Addition 43 Pipe Addition 44 Pipe Addition 45 Pipe Addition 46 Pipe Addition 47 Pipe Addition 48 Pipe Addition 49 Pipe Addition Description (Refer to Figure 5-2 Construct 40 LF of 18-inch RCP across South Plaza Trail north of Old Forge Road that connects the pipe described in item 36 Construct 169 LF of 36-inch RCP along South Plaza Trail south of Old Forge Road that connects the pipe described in item 36 Construct 435 LF of 18-inch RCP along Old Mill Court, and Old Forge Road to South Plaza Trail Construct 310 LF of 18-inch RCP north of Liberty Ridge Road that connects the pipe described in item 38 Construct 370 LF of 30-inch RCP along South Plaza Trail from Windsor Gate Place that connects the pipe described in item 38 Construct 289 LF of 36-inch RCP along South Plaza Trail north of Silina Drive that outfalls to Windsor Woods Canal Construct 350 LF of 30-inch RCP along South Plaza Trail from west of Colonial Parkway that connects the pipe described in item 42 Construct 175 LF of 18-inch RCP from Waterside Court that outfalls to Windsor Woods Canal Construct 190 LF of 68-inch by 43-inch RECP across W Colonial Parkway that outfalls to the Windsor Woods Canal Construct 425 LF of 60-inch by 38-inch RECP along Windsor Woods Boulevard from Silina Drive to Colonial Parkway Construct 1325 LF of 48-inch RCP along Windsor Woods Boulevard from west of Great Hall Court to Silina Drive Construct 216 LF of 30-inch RCP north of William Penn Boulevard to Windsor Woods Boulevard that connects to the pipe described in item 47 Construct 274 LF of 42-inch RCP along Windsor Woods Boulevard from west of Windsor Woods Court that connects to the pipe described in item 47 Comments 5-18
71 Section 5 Alternative Solution Sets Item Feature Type 50 Ditch Improvement 51 Pipe Addition 52 Pipe Addition 53 Pipe Addition 54 Pipe Addition 55 Pipe Addition 56 Pipe Addition 57 Culvert Addition 58 Pipe Addition 59 Ditch Improvement 60 Pipe Addition 61 Pipe Addition Description (Refer to Figure 5-2 Dredge 3217 LF of the ditch south of I-264 and line the trapezoid channel with concrete Construct 585 LF of 68-inch by 43-inch RECP along Palace Green Boulevard, south of Gateway Place that outfalls to the ditch south of I-264 Construct 398 LF of 60-inch by 38-inch RECP along South Boulevard, Palace Green Boulevard that connects to the pipe described in item 51 Construct 250 LF of 24-inch RCP from east of Palace Place that outfalls to the ditch south of I-264 Construct 135 LF of 18-inch RCP north of Brentwood Crescent that outfalls to the ditch south of I-264 Construct 425 LF of 30-inch RCP from along Brentwood Crescent north of South Boulevard that outfalls to the ditch south of I-264 Construct 85 LF of 24-inch RCP across South Boulevard that connects to the pipe described in item 55 Construct 77 LF of 8-feet by 6-feet rectangular closed box culvert across South Boulevard connecting the ditch south of I-264 to Lake Windsor Construct 120 LF of 18-inch RCP south of W Colonial Parkway that outfalls to Lake Windsor Dredge 1726 LF of existing ditch that connects to the pipe described in item 68 Construct 145 LF of 18-inch RCP from Water Oak Road and Brookside Lane intersection to Windsor Oaks West Ditch 1 Construct 180 LF of 30-inch RCP across Windsor Gate Place that outfalls to Windsor Oaks West Ditch 1 Comments Improve to a concrete lined trapezoid channel, with a 76-feet wide bottom at -15 feet NAVD and 15:1 side slopes to meet existing grade; the center channel Manning s roughness value = 0015 (concrete 5-19
72 Section 5 Alternative Solution Sets Item Feature Type 62 Pipe Addition 63 Pipe Addition 64 Pipe Addition 65 Pipe Addition 66 Pipe Addition 67 Pipe Addition 68 Pipe Addition 69 Ditch Improvement 70 Culvert Addition 71 Culvert Addition 72 Ditch Improvement Description (Refer to Figure 5-2 Construct 225 LF of 24-inch RCP north of Windsor Gate Circle that outfalls to Windsor Oaks West Ditch 1 Construct 164 LF of 18-inch RCP from Water Oak Road, in between Water Oak Place and Woodlake Road, to Windsor Oaks West Ditch 1 Construct 616 LF of 60-inch by 38-inch RECP from Mill Steam Road to Windsor Oaks West Ditch 1 Construct 250 LF of 36-inch RCP across Woodlake Road that connects to the pipe described in item 64 Construct 388 LF of 36-inch RCP from Piney Ridge Road and Hillridge Court intersection to Windsor Oaks West Ditch 1 Construct 670 LF of 24-inch RCP along Hillridge Court and Piney Ridge Road that connects to the pipe described in Item 66 Construct 300 LF of 54-inch RCP from Windsor Oaks West Ditch 1 located southeast of Old Forge Road and Oak Sprint Court intersection that outfalls to Lake Windsor Dredge 2048 LF of Thalia Creek that outfalls to Lake Windsor Construct 200 LF 10-feet by 6-feet closed rectangular box culvert that connects Lake Trashmore west of Westchester Circle to Thalia Creek Construct 150 LF 10-feet by 6-feet closed rectangular box culvert that connects Lake Trashmore west of Smoke Rise Lane to Thalia Creek Remove a portion of the berm between Thalia Creek and Lake Windsor and dredge 200 LF of the creek Comments Improve to a trapezoid channel, with a 5-feet wide bottom at -3 feet NAVD and 3:1 side slopes to meet existing grade; the center channel Manning s roughness value = 0035 Improve to a trapezoid channel, with an 18-feet wide bottom at -3 feet NAVD and 3:1 side slopes to meet existing grade; the center channel Manning s roughness value =
73 Section 5 Alternative Solution Sets Item Feature Type Description (Refer to Figure 5-2 Comments The gated control structure closes when the water surface elevations in Lake Windsor and Lake Trashmore are higher than the downstream tailwater elevation in Thalia Creek The pump station is proposed to operate at six levels: a 200 cfs pump that is triggered on at elevation 05 feet NAVD 88 and shuts off at 0 feet NAVD 88 a 100 cfs pump that is triggered on at elevation 2 feet NAVD 88 and shuts off at 0 feet NAVD Pump Station Addition Construct a new 900-cfs pump station and gated control structure a 200 cfs pump that is triggered on at elevation 55 feet NAVD 88 and shuts off at 1 feet NAVD 88 a 100 cfs pump that is triggered on at elevation 6 feet NAVD 88 and shuts off at 1 feet NAVD 88 a 100 cfs pump that is triggered on at elevation 62 feet NAVD 88 and shuts off at 1 feet NAVD 88 a 200 cfs pump that is triggered on at elevation 65 feet NAVD 88 and shuts off at 1 feet NAVD 88 Once the water surface elevations in Lake Windsor and Lake Trashmore are less than the downstream tailwater elevation in Thalia Creek, the control structure will fully open 53 Alternative 5 Model Results As stated in Section 2 and Section 511, future land use conditions were used with the alternative evaluations Since many of the increases in land use occur away from the Windsor Woods neighborhood and project components, a full comparison of peak stages within the entire WS 4 model could not be conducted to analyze potential offsite impacts Instead, peak stages and flows were compared between the existing model and the proposed model at various locations upstream and downstream of the proposed alternative Peak stages upstream in Thalia Creek were lowered or remained the same for the recommended alternative for all storms Immediately downstream of the proposed I-264 structure, the peak pumped flows were always less than or equal to the peak existing flows; however, due to the timing of the peak flows, peak stages and flows further downstream in the creek did increase slightly for the smaller storms For the 10-year storm, increases in peak stage in the creek were limited to a few hundredths of a foot, which is below the accuracy of the model No increase in peak stage were found in adjacent SMS inlets, except where the future land use impervious cover increased caused increased flows For the 2-year storm, the expected increase in stage within Thalia Creek 5-21
74 Section 5 Alternative Solution Sets approach 01 feet; however, the peak stage for both the proposed and existing condition at the location in the creek where the difference is greatest is near 33 feet NAVD When the stage in the creek is below 5 feet NAVD, the elevation of the creek has little effect on the peak stages in the rest of the SMS Therefore, though the 2-year storm produced a slight increase within the creek, there are no increases in peak stage within the adjacent inlets, except where the future land use impervious cover increased caused increased flows There are zero increases in peak stage of Thalia Creek in the 100-year storm Two items of note: Peak stages would increase for all storms if the full capacity of the pump station is implemented at the peak of the storm The elevation triggers for the pump station described above were set to match the existing condition flows through the I-264 culvert For the 2-year storm, the initial stage behind the gated structure was set to match King Tide (approximately 27 feet NAVD in order to test a more limited stormwater capacity This change does not affect the downstream peak stage comparison year Storm The simulation results for the recommended alternative are shown in Table 5-2 for the 10-year design storm at the locations with simulated flooding provided in Table 4-1 A full table of results showing all indicator elevation locations in Windsor Woods is presented in Appendix C As discussed above, the LOS for the 10-year storm was set to 3 inches (025 feet above the indicator elevation; therefore, all values shown in Table 5-2 meet the desired LOS Figure 5-4 shows a flood map of the proposed condition superimposed on an aerial of the neighborhood The flood map also indicates no more than 3 inches of flooding above road crown within the neighborhood 5-22
75 Section 5 Alternative Solution Sets Table 5-2 Summary of Alternative 5: 10-year Storm Results Model Node Location Windsor Woods Boulevard and Windsor Woods Court Estimated Crown (feet NAVD 10-year Alternative 5 (feet NAVD Delta 10-year (feet South Boulevard and Brentwood Crescent South Boulevard and Palace Green Boulevard NW Silina Drive and Windsor Woods Boulevard Old Forge Road and Grist Mill Road Palace Green Boulevard and Starlighter Drive Presidential Boulevard and Gresham Court Presidential Boulevard and Kings Point Road Presidential Boulevard and Teakwood Drive Old Forge Road and S Kings Point Road Presidential Boulevard and Gladstone Drive South Boulevard and Palace Green Boulevard NE Woodlake Road and Woodlake Court Kings Point Road near Kings Point Court Presidential Boulevard and Old Forge Road Kings Point Road and Kings Point Arch W Kings Point Road and Kings Point Arch E Concord Bridge Road and Grist Mill Road S Kings Point Road and Kings Point Road Windsor Gate Circle
76 Section 5 Alternative Solution Sets This page intentionally left blank 5-24
77 Ü Thalia Creek Brentwood Crescent South Blvd Palace Green Blvd Legend Boundary Hydrography 264 Flood Depth ft ft ft ft ft > 20 ft South Blvd 264 Silina Dr Lake WIndsor W Colonial Pkwy S Plaza Trail Presidential Blvd Rosemont Rd Old Forge Rd Silina Dr Lake Trashmore Windsor Gate Pl S Plaza Trail Old Forge Rd Miles Figure 5-4 Windsor Woods Alternative 5: 10-year Storm Flooding
78 Section 5 Alternative Solution Sets This page intentionally left blank 5-26
79 Section 5 Alternative Solution Sets year Storm The simulation results for the recommended alternative for the 100-year design storm are presented as a map of flood extent in Figure 5-5 The flood map has been superimposed upon an aerial of the neighborhood, and the flooding extents compared to building locations using the same criteria described in Section 41 The recommended alternative mitigates flooding for 351 of the 357 locations (98 percent where flooding is expected for the existing condition The remaining six homes with simulated flooding were confirmed by garage surveys conducted by the City, as shown in Table 5-3 Table 5-3 Summary of Alternative 5: 100-year Storm Results Remaining Flooded Addresses Bldg Address Comment S Gladstone Drive Confirmed by garage survey Gresham Court Confirmed by garage survey Gresham Court Confirmed by garage survey Presidential Boulevard Confirmed by garage survey W Colonial Parkway Confirmed by garage survey Windsor Woods Court Confirmed by garage survey The first five locations are primarily dependent on peak stage in Lake Windsor and therefore pump station capacity Increasing SMS conveyance in these locations will not mitigate these flood elevations Under the current configuration, since the pump capacity cannot be increased without causing adverse offsite impacts, these addresses will not meet the target LOS for the 100-year storm For 200 Windsor Woods Court, the garage is more than 2 feet lower than the adjacent home (201 Windsor Woods Court Additional SMS increases at this location may allow meeting the 100-year LOS 5-27
80 Section 5 Alternative Solution Sets This page intentionally left blank 5-28
81 Ü 264 Legend ( Flooded Structure Boundary Hydrography Flood Extent Thalia Creek Brentwood Crescent South Blvd 200 Windsor Woods Ct ( Palace Green Blvd South Blvd 264 Silina Dr Lake WIndsor 4037 W Colonial Pkwy ( W Colonial Pkwy S Plaza Trail Presidential Blvd Rosemont Rd Old Forge Rd Silina Dr Lake Trashmore Windsor Gate Pl S Plaza Trail ( 3704 Gresham Ct 432 Presidential Blvd ( ( Old Forge Rd 3700 Gresham Ct 501 S Gladstone Dr ( Miles Figure 5-5 Windsor Woods Alternative 5: 100-year Storm Flooding
82 Section 5 Alternative Solution Sets This page intentionally left blank 5-30
83 Section 5 Alternative Solution Sets 533 Extreme Event Simulation Results While the goal of this report was to identify system improvements to mitigate flooding for the 10-year and 100-year design storm (see Section 4, this section discusses the performance of Alternative 5 for an extreme rainfall event where the design frequency is exceeded To evaluate the improved stormwater system performance under these conditions, the rainfall and boundary conditions were obtained from those observed during the October 2016 Hurricane Matthew storm Hurricane Matthew led to significant flooding in the Windsor Woods neighborhood and other areas within Virginia Beach Based on a 24-hour duration intensity, Hurricane Matthew was between a 500-year to 1000-year recurrence interval (Analysis of Historical and Future Heavy Precipitation, Dewberry 2017 Model assumptions for this analysis include: Utilized the future land use conditions to match the analysis for all other alternatives Utilized observed October 8, 2016 rainfall and tidal conditions in Thalia Creek Applied a starting water surface elevation of 0 feet NAVD upstream of the Thalia Creek pump station and gate structure The Alternative 5 configuration was not resized or modified for this analysis The simulated extreme storm flood map is shown in Figure 5-6 The Alternative 5 system improvements reduces the simulated flooded structures from over 330 homes under existing modeled conditions down to 186 homes under the extreme event, a 44 percent reduction Compared to the 100-year design event results presented in Section 532, the simulated extreme rainfall event led to an additional 1,500 acre-feet of runoff volume, corresponding to 07 feet higher simulated peak stages in Lake Windsor To further mitigate flooding under the simulated extreme conditions, the Thalia Creek pump capacity would need to be increased above 900 cfs to lower stages in Lake Windsor However, this change would potentially cause offsite adverse impacts downstream of the pump station, which were not evaluated in this analysis The results for the extreme storm event are provided in Appendix C 534 Other Storms As stated above, the 2-year storm was simulated without prior drawdown of the tributary area behind the gated structure The stage behind the proposed structure was set to 27 feet NAVD to match the King Tide elevations downstream of the structure, to simulate a condition where advance warning of the storm was not given Under this scenario, the stage in Lake Windsor drops from 27 feet NAVD to approximately 01 feet NAVD before the storm inflows raise the stage again The peak elevation in Lake Windsor rebounds to 23 feet NAVD after the initial drop There is no substantial flooding in Windsor Woods for this storm under this scenario The SCS Type C design storm has the peak storm intensity at the 12-hour mark of the 24-hours storm If the intense part of a 2-year volume storm hit within the first hour, peak stages would be higher, but likely remain near the peak of the 10-year storm (42 feet NAVD because of the increased pump capacity at the higher stage The results for the 2-year, and 50-year storms are provided in Appendix C 5-31
84 Section 5 Alternative Solution Sets 54 Alternatives Considered but not Feasible Appendix E contains a comprehensive listing of alternative considered in the analysis but deemed not feasible The below list is a summary of the alternatives discussed in detail in this section: Alternative 2, described above due to adverse offsite impacts Alternative 3, described above due to adverse offsite impacts Alternative 4, described above reduces offsite impacts, but does not mitigate all of them Additionally, there would be constructability issues with implementing a force main under I-264 Options that create increased flood elevations downstream of I-264 would require mitigation measures to offset adverse impacts For this study options that require dredging Thalia Creek downstream of I-264 to mitigate offsite impacts were deemed not feasible and eliminated from further consideration due to the significant risk and uncertainty associated with potential environmental permitting requirements, land acquisition, liability and legal exposure An option that was considered conceptually was provision of a pump station and force main from Lake Windsor to a location on the Lynnhaven River where adequate capacity is available to receive the pumped discharges without increasing water surface elevations For this option a force main approximately one-mile long would be needed from Lake Windsor to the Lynnhaven River, north of Virginia Beach Boulevard The feasibility of this option was considered from the perspectives of constructability and order of magnitude cost Construction of the force main would be challenging Route options appear to be limited, and the available routes would be immediately adjacent to Thalia Creek / Lynnhaven River or through existing urban development From an order of magnitude cost perspective, the probable construction cost of the large diameter force main and high horsepower pump station is significantly higher than the cost of the pump station and gated structure in Alternative
85 Ü Legend ( Flooded Structure 264 ( Hydrography Boundary Flood Extent Thalia Creek Brentwood Crescent South Blvd South Blvd 264 ( ( ( Silina Dr ( ( ( Lake WIndsor ( ( ( ( ( ( ( W Colonial Pkwy ( S Plaza Trail Presidential Blvd Rosemont Rd Lake Trashmore Old Forge Rd ( ( ( ( ( ( Windsor Gate Pl S Plaza Trail ( Palace Green Blvd Silina Dr ( ( ( ( ( ( ( ( (( ( ( ( ( ( ( ( ( ( ( ( ( (( ( ( ( ( ( ( (( ( ( ( ( ( ( ( ( ( ((( ( ( ( ( ( ( (( ( ( ( ( ( ( ( ((( (( ( ( ( ( ( ( ( ( ( ( ( ( ( ( ( ( ( ( ( ( ( ( ( (( ( ( ( ( ( ( ( ( ( ( ( ( ( ( ( ( ( ( ( ( ( ( ((((( ( ( ( ( ( ( ( ( ( ( ( ( ( ( ( ( ( ( ( ( ( ( ( ( ( ( ( ( ( ( ( ( ( ( ( ( ( ( ( ( ( ( ( ( ( ( ( ( Old Forge Rd Miles Figure 5-6 Windsor Woods Alternative 5: Extreme Storm Event Flooding
86 Section 5 Alternative Solution Sets This page intentionally left blank 5-34
87 Section 6 Regulatory Feasibility and Probable Cost 61 Feasibility The Windsor Woods SMS improvements would impact wetlands and require wetland permitting and consultation with governing regulatory agencies During the permitting process, an early pre-application meeting should be scheduled with the USACE, the Virginia DEQ, and the VMRC to introduce the project and its objectives and identify agency concerns A wetland delineation (PJD and Wetland Confirmation from USACE should be performed prior to this meeting to identify jurisdictional areas For this assessment, the National Wetlands Inventory (NWI maintained by the US Fish and Wildlife Service (USFWS was consulted However, while NWI maps can be used as a planning tool, they are not sufficient for permitting Wetland boundaries likely vary from those shown on NWI mapping, and considerable wetland areas can be found outside those identified on the NWI maps Permits from the USACE, the Virginia DEQ, and the VMRC would be applied for through a single Joint Permit Application, available at the USACE Norfolk District Regulatory Branch website ( If impacts result in the loss of ½ acre or less of wetlands, stream impacts are 300 linear feet or less, and all impacts are nontidal, USACE and Virginia DEQ permitting may be possible using Nationwide Permit (NWP 43 for stormwater management If wetland losses equal one acre or less and stream impacts 2,000 linear feet or less, and all impacts are non-tidal, the USACE State Programmatic General Permit (12-SPGP-01 may be used along with Virginia DEQ VWP Compliance Program permitting If impacts exceed 1 acre, exceed 2,000 linear feet of stream, or are tidal, individual permits from USACE and Virginia DEQ would be required Additionally, general conditions placed on NWP 43 and 12-SPGP-01 regarding federal lands, protected species, or historic resources may preclude their use, even if wetland impacts are below the maximum amounts allowed In all cases, an individual VMRC permit would be required if applicable The permitting agencies (USACE, Virginia DEQ, and VMRC will require the submitted application be for a single and complete project with independent utility This means the project for which the application is submitted cannot be part of a larger project that has been split into smaller projects to lessen the apparent impacts During the pre-application process, the City should communicate the extent of project s size and scope to the agencies The permitting agencies will also require that the impacts proposed represent those of the least environmentally damaging practicable alternative As a result, changes in the exact location of the drainage ditches, pump stations, and gated control structures may be required during design to minimize wetland impacts 6-1
88 Section 6 Regulatory Feasibility and Probable Cost Permanent wetland impacts will require compensatory mitigation by regulatory agencies Compensatory mitigation, through the purchase of credits at a mitigation bank, is typically the most feasible option and preferred by the regulatory agencies The ratio of compensatory mitigation is by habitat types due to the difficulty in re-creating some habitats and the time required for them to reach maturity Although project-specific ratios can be considered, typical mitigation ratios are as follows: 2:1 for forested wetland impacts (2 acres compensation per 1 acre of impact 15:1 for scrub-shrub wetland impacts 1:1 for emergent wetland impacts The permitting process will further assess impacts to protected species through consultation with the Virginia Department of Conservation and Recreation (DCR and the Virginia Natural Heritage Program Impacts to historic and cultural resources would also need to be determined by consulting with the Virginia Department of Historic Resources (VDHR A preliminary examination of the National Register of Historic Places spatial data (last updated by the National Parks Service in 2014 does not indicate any historic properties within the area However, not all properties are shown on this database, nor are any archaeological resources Consultation with VDHR will be required to avoid impacts to regulated resources Proposed dredging of Thalia Creek and improvements to the ditch south of I-264 would potentially impact riverine wetlands along 5,465 linear feet of the ditches Impacts to tidal wetlands are possible at the outfall structure adjacent to Thalia Creek Since a 900-cfs pump station is proposed adjacent to Lake Windsor and Thalia Creek, an evaluation to estimate the effect of maximum flow during low tide on the salinity in the creek should be performed at the preliminary design stage In addition, implications of the locating the proposed gated control structure along tidally influenced Thalia Creek will need to be evaluated in coordination with USACE and Virginia DEQ The City has applied for USACE NWP 3 and 31 for the ongoing dredging operations along Windsor Woods Canal The NWP 3 is applicable for outlet protection against future scour and erosion at each of the existing stormwater outfalls NWP 31 covers maintenance of existing flood control activities to a baseline approved by USACE Since this permit does not have a limit on the maximum area, volume, or length of channel that can be authorized under it, the City should coordinate with USACE to establish the baseline condition for canals proposed to be dredged and the applicability of the existing permit for proposed dredging operations during the design stage 6-2
89 Section 6 Regulatory Feasibility and Probable Cost As shown in Figure 6-1, the recommended Windsor Woods SMS improvements are located in the effective Federal Emergency Management Agency (FEMA floodway Construction of improvements in the floodway require approval from FEMA Fill in the floodway and modification the hydraulic conditions in the floodway will require analyses to demonstrate that the project will not increase flood elevations and documents revisions to the regulatory floodway A Conditional Letter of Map Revision (CLOMR will be required to obtain FEMA s concurrence that the proposed project will, upon construction, result in acceptable revisions to the floodway After construction of the project a Letter of Map Revision (LOMR will be required to officially modify the effective Flood Insurance Rate Map (FIRM, Base Flood Elevations (BFEs, and the Special Flood Hazard Area (SFHA 6-3
90 Section 6 Regulatory Feasibility and Probable Cost This page intentionally left blank 6-4
91 36'Φ 32'x 49' Ü I-264Ditc h : Co nc retelined Trapezo id Ch annel 'Φ Legend Proposed Improvements C\ Gated Co ntro lstruc ture Th aliacreek LakeWindso r 900c fs PumpStatio nand Gated Co ntro lstruc ture Brentw o o d Cresc ent 18'Φ So uth Blvd 43'x 68' Palac egreenblvd 38'x 60' 18'Φ 38'x 60' 18'Φ 37 PS PumpStatio n DredgeExistingDitc h Bo x Culvert Pipe So uth Blvd C\ 37 PS 264 6'X 8' 24'Φ 30'Φ 48'Φ 30'Φ 42'Φ 32'x 49' 30'Φ LakeWIndso r SilinaDr Co nc retecenterch annel Remo veand Dredge Efec tivefemaflo o dw ay 18'Φ 30Φ 18'Φ 18'Φ 30'Φ SPlazaTrail W Co lo nialpkw y 38'x 60' 43'x68' 30'Φ Windso rwo o ds Canal 38'x 60' Lake Trash mo re 6'X 10' 6'X 10' Th aliacreek 36'Φ 38'x 60' 18'Φ 54'Φ 36'Φ Old Fo rgerd 24'Φ Windso rgatepl 18'Φ 18'Φ 30'Φ 36'Φ 18'Φ 34'x 53' 36'Φ 24'Φ 38'x 60' 34'x 53' 24'Φ 36'Φ 36'Φ 43'x 68' 30'Φ 18'Φ 24'Φ Old Fo rgerd PresidentialBlvd 43'x 68' 58'x 91' 38'x 60' 30'Φ SilinaDr Ro semo ntrd 48'Φ Sh o relinelake Windso roaks WestDitc h #1 18'Φ 30'Φ 24'Φ SPlazaTrail 24'Φ 24'Φ Figure 6-1 City of Virginia Beach Windsor Woods Effective FEMA Floodway
92 Section 6 Regulatory Feasibility and Probable Cost This page intentionally left blank 6-6
93 Section 6 Regulatory Feasibility and Probable Cost 62 Opinion of Probable Construction Cost The planning-level opinion of probable project cost (OPPC developed for this study is at an Estimate Class 4 level as defined by AACE International (formerly the Association for the Advancement of Cost Engineering This estimate class is typical for projects at the concept or feasibility phase of project definition Quantities and unit costs to develop the OPPC are presented in Appendix D Unit costs were developed from major stormwater pumping station and gate/barrier projects in the southeast and local stormwater and roadway construction bid tabulations Where available, costs were compared with industry standard unit cost references and adjusted using engineering judgement The expected accuracy of Class 4 estimates can range from -30% to +50% Actual construction costs are largely dictated by market conditions at the time of bidding CDM Smith cannot guarantee that bids and actual costs will not vary from the OPPC presented in this section In addition, the OPPC does not include costs for change orders, the City s administrative costs, land acquisition, easement acquisition, financing or funding costs, legal fees, or any other costs that would not be specifically part of a contractor s scope of work Table 6-1 summarizes the recommended alternative estimated cost estimates, while additional details and quantities are provided in Appendix D Table 6-1 Planning-level Opinion of Probable Construction Cost for the Recommended Alternative Category Cost Alternative 5 Culverts $ 695,100 Ditch $ 2,764,728 Erosion and Sediment Control $ 751,000 Excavation $ 732,000 Pavement Replacement $ 3,994,143 Stormwater Piping $ 8,816,690 Pump Station (900 cfs $ 18,900,000 Control Structures $ 2,000,000 Miscellaneous $ 2,202,000 Subtotal $ 40,855,661 Mobilization $ 4,085,566 Contingency (40% $ 17,976,491 Engineering, Survey & Permitting (15% $ 9,437,658 Subtotal Cost, Today's dollars $ 72,355,376 Escalation to midpoint of construction (FY 26 based on inflation rate of 4% per year $ 26,667,952 Total Construction Cost $ 99,023,329 USE $ 99,000,
94 Section 6 Regulatory Feasibility and Probable Cost 63 Sea Level Rise Virginia Beach and the Hampton Roads area have been experiencing sea level rise at a slow, gradual pace since tide levels have been recorded Future increases in sea level will increase water levels in the Lynnhaven River, which will impact to performance of the existing WS 4 SMS For planning purposes, two sea level rise conditions were evaluated: 15 feet and 30 feet of increase in water levels above the existing tailwater condition for each storm Boundary conditions were included in the H/H model to represent tailwater conditions in Thalia Creek The existing conditions water elevation in Thalia Creek at Virginia Beach Boulevard was defined at 367 feet NAVD for the 100-year rainfall event The two sea level rise scenarios included downstream water elevations of 517 feet NAVD and 667 feet NAVD, respectively Model results for the two sea level rise scenarios are presented in Appendix C The recommended alternative was specifically formulated to provide sea level rise resiliency All the proposed elements of the recommended alternative are upstream of a gated structure, and are protected from downstream tidal conditions and sea level rise Future performance with sea level rise will require appropriate design of the gated structure on Thalia Creek to protect against increased downstream water elevations Similarly, the operation of the pump station in combination with upstream storage in Lake Windsor, Lake Trashmore and Thalia Creek prevents downstream impacts for both existing sea level conditions and with sea level rise 6-8
95 Section 7 Summary and Conclusions 71 Recommended Solution Set Windsor Woods has experienced repeated, significant flooding during recent rainfall events The City of Virginia Beach retained CDM Smith to develop a hydrologic and hydraulic (H/H model calibrated to multiple storm events and analyze flood risk to structures in the study area The H/H model provided the foundation for exploring improvement alternatives to alleviate flooding in Windsor Woods The model identified several key requirements for the Windsor Woods neighborhood Stormwater Management System (SMS to meet the LOS, which were categorized as near- and long-term flood mitigation options Near-term options include: Canal dredging of the Windsor Woods Canal, which is already planned, to reduce head loss along the canal, to maximize downstream storage, and to repair the canal to a conveyance capacity close to the original design Canal dredging of the Windsor Oaks Canal, also already planned, for similar reasons Repair or replacement of damaged or blocked pipes that were found during the field surveys Longer-term solutions include: Construct Lake Windsor Pump Station and gated control structure on Thalia Creek in the northwest corner of Lake Windsor, just south of I-264 Pump station capacity was sized to avoid downstream increases in water surface elevation (Thalia Creek, north of I-264 while providing maximum LOS within Windsor Woods To not cause offsite impacts, the pump station is designed to increase capacity as the stage in Lake Windsor increases (ie, the full 900 cfs capacity is not utilized until Lake Windsor is near full capacity The pump station should operate to lower stages in the entire system behind the gated structure to 0 feet NAVD prior to significant rainfall events Increase the size of the SMS significantly within the Windsor Woods neighborhood to improve conveyance toward the Windsor Woods Canal Increase the conveyance capacity of the I-264 ditch, primarily by adding a concrete center channel Incorporate additional storage in Lake Trashmore by lowering the normal water level and pumping down the lake prior to significant rainfall events 7-1
96 Section 7 Summary and Conclusions Alternative 5 is recommend to advance to preliminary engineering and engineering design, as this scenario meets the desired LOS in Windsor Woods, with noted exceptions, while preventing adverse impacts in the downstream system in Thalia Creek or elsewhere in the watershed The planning level opinion of probable construction cost for the recommended alternative is $99 million Several additional analyses are recommended for further evaluation during preliminary engineering and engineering design, including: Evaluate the feasibility and cost-effectiveness of constructing improvements in the Thalia Creek floodplain downstream (north of I-264 or acquiring property and/or easements to allow increased discharges Evaluate alternative scenarios for operating the gate and pump station The objective of additional evaluations is intended to clarify operating conditions, reduce operational complexity, and confirm environmental permit requirements Evaluate additional improvement options in the Windsor Woods neighborhood to reduce project cost and community impacts during construction The analyses performed as part of this study are conceptual, and the completed H/H models are intended to serve as planning level tools The conceptual improvements identified in this study should be advanced through engineering design The H/H models should also be refined during engineering design to evaluate additional details or modifications that are revealed during the design process 7-2
97 Appendix A Field Investigation Documentation A-1
98 Appendix A Field Investigation Documentation This page intentionally left blank A-2
99 Memorandum To: File From: Tom Nye Date: November 17, 2016 Subject: Video Stills from YouTube Video For the August 1 st, 2012 storm in Windsor Woods, the following Video was posted to YouTube : The video shows flooding at the intersections of South Boulevard and Palace Green Boulevard and South Plaza Trail and Palace Green Boulevard The following stills were captured from the video and examined to estimate peak flood depth In Figure 1, the second still shows that flooding does not reach the base of the electric pole in the background, the base of which is very close to the 7 ft NAVD contour Therefore, the approximate elevation is set to 68 ft NAVD The approximate error is set based on earlier CDM Smith estimates that estimated flood depth at this intersection to be 72 ft NAVD based on the road crown and approximate depth of flooding on the car wheels In Figure 2, the estimated flood depth is based on the approximate extent of flooding based on the small amount of flooding on Historyland Drive (first still, where the truck is pulling out, the likely depth where the woman is standing, and the depth on the trucks when they turn onto South Boulevard The table below summarize our findings Address Source Comment/Problem Approx Flood Elev (ft NAVD Uncertainty (ft S Plaza Trl and Palace Green Boulevard South Boulevard and Palace Green Boulevard YouTube Video YouTube Video Roadway Flooding 68 ± 04 Roadway Flooding 90 ± 03


100 Memorandum November 17, 2016 Page 2 Figure 1 Approximate Location: South Plaza Trail and Palace Green Boulevard Time Captured (Approximate: 2:00 PM 8/1/12 Water Surface Elevation (NAVD 88: 72 ft ± 05 ft


101 Memorandum November 17, 2016 Page 3 Figure 2 Approximate Location: South Boulevard and Palace Green Boulevard Time Captured (Approximate: 2:00 PM 8/1/12 Water Surface Elevation (NAVD 88: 90 ft ± 05 ft

102 Memorandum To: File From: James Duvall Date: November 9, 2016 Subject: ASC for Stormwater Master Planning WO2A Windsor Woods Stormwater Master Plan: Flooding Validation On August 1, 2016, James Duvall and Jay Gopal inspected the Windsor Woods study area for flooding following a local rainfall event The intention of the field visit was to provide validation points for the Windsor Woods model While the August 1, 2016 storm event did not end up being used as a validation event, the figures on the following pages are valuable in that they can be compared with photos of other events to document locations that repeatedly flood The map below shows the approximation location of each figure


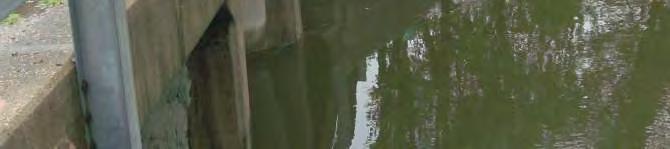
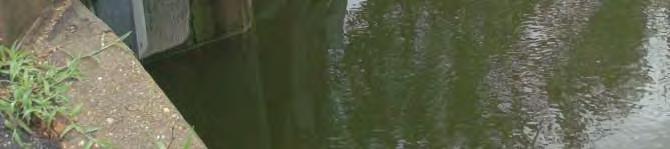

103 Memorandum November 9, 2016 Page 2 Figure 1 Approximate Location: South Blvd & Thalia Creek Time Captured: 3:28 PM 8/1/2016
104 Memorandum November 9, 2016 Page 3 Figure 2 Approximate Location: Lake Windsor near South Blvd Time Captured: 3:20 PM 8/1/2016


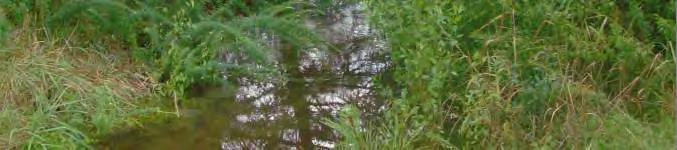


105 Memorandum November 9, 2016 Page 4 Figure 3 Approximate Location: Lake Windsor near South Blvd Time Captured: 3:21 PM 8/1/2016
106 Memorandum November 9, 2016 Page 5 Figure 4 Approximate Location: Lake Windsor near Old Forge Rd Time Captured: 3:37 PM 8/1/2016
107 Memorandum November 9, 2016 Page 6 Figure 5 Approximate Location: S Plaza Trl & Presidential Canal Time Captured: 3:03 PM 8/1/2016
108 Memorandum November 9, 2016 Page 7 Figure 6 Approximate Location: Silina Dr & S Plaza Trl Time Captured: 3:06 PM 8/1/2016
109 Memorandum November 9, 2016 Page 8 Figure 7 Approximate Location: South Blvd & Palace Green Blvd Time Captured: 3:11 PM 8/1/2016
110 Memorandum November 9, 2016 Page 9 Figure 8 Approximate Location: South Blvd & Palace Green Blvd Time Captured: 3:12 PM 8/1/2016
111 Memorandum November 9, 2016 Page 10 Figure 9 Approximate Location: South Blvd & Palace Green Blvd Time Captured: 3:16 PM 8/1/2016
112 Memorandum To: File From: James Duvall Date: November 7, 2016 Subject: ASC for Stormwater Master Planning WO2A Windsor Woods Stormwater Master Plan: Flooding Validation On September 21, 2016, James Duvall and Jay Gopal inspected the Windsor Woods study area for flooding caused by Tropical Storm Julia The purpose of the field investigation was to provide validation points for use in the calibration of the Windsor Woods stormwater model Photos and videos of flooding were taken throughout the study area and water surface elevation was estimated by matching the observed edge of flooding with visible landmarks in the aerial photography and LiDAR The uncertainty value for each validation point is associated with the local ground slope and describes a range that can reasonably be expected to contain the true elevation of flooding Further discussion and photos of each validation point are included on the following pages The map and table below summarize our findings ID Number Flood Elevation (ft, NAVD 88 Uncertainty (ft 1 57 ± ± ± ± ± ± ± ± ± ± ± ± ± ± N/A N/A

113 Memorandum November 7, 2016 Page 2 Map of the created validation points for Tropical Storm Julia


114 Memorandum November 7, 2016 Page 3 ID: 1 Approximate Location: Northbound Rosemont Road between Old Forge Rd and Club House Rd Time Captured: 10:01 AM 9/21/16 Water Surface Elevation (NAVD 88: 57 ft ± 02 ft
115 Memorandum November 7, 2016 Page 4 ID: 2 Approximate Location: Southbound Rosemont Road between Old Forge Rd and Club House Rd Time Captured: 10:46 AM 9/21/16 Water Surface Elevation (NAVD 88: 57 ft ± 02 ft


116 Memorandum November 7, 2016 Page 5 ID: 3 Approximate Location: Rosemont Road, southbound between Old Forge Rd and Club House Rd Near St Francis Church Time Captured: 10:46 AM 9/21/16 Water Surface Landmark: Flooding covers entire right lane on southbound Rosemont Rd Water Surface Elevation (NAVD 88: 57 ft ± 02 ft
117 Memorandum November 7, 2016 Page 6 ID: 4 Approximate Location: Intersection of S Plaza Trl and Palace Green Blvd Time Captured: 10:14 AM 9/21/16 Water Surface Elevation (NAVD 88: 55 ft ± 03 ft
118 Memorandum November 7, 2016 Page 7 ID: 5 Approximate Location: Intersection of S Plaza Trl and Palace Green Blvd Time Captured: 10:13 AM 9/21/16 Water Surface Elevation (NAVD 88: 59 ft ± 03 ft


119 Memorandum November 7, 2016 Page 8 ID: 6 Approximate Location: Intersection of Silina Dr and Palace Green Blvd Time Captured: 10:20 AM 9/21/16 Water Surface Elevation (NAVD 88: 57 ft ± 02 ft


120 Memorandum November 7, 2016 Page 9 ID: 7 Approximate Location: Starlighter Dr east of intersection with Palace Green Blvd Time Captured: 10:17 AM 9/21/16 Water Surface Elevation (NAVD 88: 58 ft ± 02 ft


121 Memorandum November 7, 2016 Page 10 ID: 8 Approximate Location: Silina Dr north of intersection with Windsor Woods Blvd Time Captured: 10:38 AM 9/21/16 Water Surface Elevation (NAVD 88: 60 ft ± 02 ft


122 Memorandum November 7, 2016 Page 11 ID: 9 Approximate Location: Silina Dr north of intersection with Colonial Pkwy Time Captured: 10:38 AM 9/21/16 Water Surface Elevation (NAVD 88: 57 ft ± 03 ft


123 Memorandum November 7, 2016 Page 12 ID: 10 Approximate Location: Brentwood Cres south of intersection with Cortland Ln Time Captured: 10:36 AM 9/21/16 Water Surface Elevation (NAVD 88: 65 ft ± 03 ft


124 Memorandum November 7, 2016 Page 13 ID: 11 Approximate Location: South Blvd west of intersection with Brentwood Cres Time Captured: 10:25 AM 9/21/16 Water Surface Elevation (NAVD 88: 66 ft ± 02 ft
125 Memorandum November 7, 2016 Page 14 ID: 12 Approximate Location: South Blvd and Lake Windsor Time Captured: 10:26 AM 9/21/16 Water Surface Elevation (NAVD 88: 52 ft ± 05 ft
126 Memorandum November 7, 2016 Page 15 ID: 13 Approximate Location: South Blvd and Lake Windsor Time Captured: 10:26 AM 9/21/16 Water Surface Elevation (NAVD 88: 51 ft ± 03 ft
127 Memorandum November 7, 2016 Page 16 ID: 14 Approximate Location: S Plaza Trl south of the Presidential Canal Time Captured: 10:40 AM 9/21/16 Water Surface Elevation (NAVD 88: 61 ft ± 03 ft
128 Memorandum November 7, 2016 Page 17 ID: 15 Approximate Location: Intersection of S Plaza Trl and Donnawood Dr, 800 ft west of the Fire Station 16 Time Captured: 10:11 AM 9/21/16 Water Surface Elevation (NAVD 88: No flooding Special Comment: The 2014 Windsor Woods Study by Parsons Brinckerhoff cited localized flooding at the fire station on S Plaza Trail; however, no flooding was observed in this area following Tropical Storm Julia The minimal ponding in the picture below is not concentrated at an inlet and is to be expected as the roadside conveyance system continues across Donnawood Dr
129 Memorandum To: File From: James Duvall Date: November 9, 2016 Subject: ASC for Stormwater Master Planning WO2A Windsor Woods Stormwater Master Plan: Flooding Validation On October 14, 2016, James Duvall and Jay Gopal inspected the Windsor Woods study area between 3:00 PM and 5:00 PM The purpose of the investigation was to look for sediment in the storm pipes following Hurricane Matthew A map is included on the following page to depict the investigation sites and the corresponding UNIT-ID of these structures The investigation found that with the exception of one location, sedimentation was not observed in the pipe network The table below summarizes our findings UNIT-ID Comment sediment in downstream end of 54 pipe No sediment No sediment No sediment No sediment No sediment No sediment No sediment No sediment No sediment No sediment

130 Memorandum November 9, 2016 Page 2
131 Memorandum To: File From: James Duvall Date: November 10, 2016 Subject: ASC for Stormwater Master Planning WO2A Windsor Woods Stormwater Master Plan: Flooding Validation On October 20, 2016, James Duvall and Jay Gopal inspected the drainage ditch that outfalls to the Northeast corner of Lake Windsor in the Windsor Woods study area The purpose of the field inspection was to aid in the determination of roughness coefficients for the ditch banks and to inspect the stormwater networks along Brentwood Crescent and Palace Green Boulevard that outfall to this ditch A map and photos of each location visited are included on the following pages The table below summarizes our findings UNITID Comments Upstream end of culvert is damaged Found backflow preventer on the end of the outfall pipe Sedimentation visible in catch basin, cannot confirm depth Less than 15 of sediment in outfall pipe Sticks and leaves visible at inlet Less than 1 of sediment in pipes of debris (loose sticks, leaves, concrete chunks in outfall pipe from Palace Green Blvd 701, West Drainage ditch between Windsor Lake and outfall from Brentwood Cres Medium density wooded vegetation on right bank Mowed grass on left bank Earthen channel grassy vegetation Rip-rap present at downstream culvert under South Blvd 2-3 large tree branches in the observed portion of the ditch 701, East Drainage ditch near outfall from Palace Green Blvd Medium density wooded vegetation on both sides of ditch Earthen channel with sparse grassy vegetation in channel

132 Memorandum November 10, 2016 Page 2
133 Memorandum November 10, 2016 Page 3 UNITID: Damaged culvert under South Boulevard (


134 Memorandum November 10, 2016 Page 4 UNITID: Backflow preventer installed at the outfall pipe that drains Brentwood Crescent to the drainage ditch (
135 Memorandum November 10, 2016 Page 5 UNITID: Incoming pipe from the eastern side of Brentwood Crescent ( Sedimentation in catch basin (


136 Memorandum November 10, 2016 Page 6 Outfall pipe from leading from Brentwood Crescent to the drainage ditch (
137 Memorandum November 10, 2016 Page 7 UNITID: Leaves and sticks in inlet catch basin (
138 Memorandum November 10, 2016 Page 8 UNITID: Outfall for pipe network from Palace Green Boulevard (


139 Memorandum November 10, 2016 Page 9 Looking upstream in the outfall pipe from the drainage ditch to Palace Green Blvd (
140 Memorandum November 10, 2016 Page 10 UNITID: 701 (West Looking upstream in the drainage ditch near Windsor Lake (701 Looking downstream in the drainage ditch near Windsor Lake (701
141 Memorandum November 10, 2016 Page 11 UNITID: 701 (East Looking upstream in the drainage ditch near Palace Green Boulevard (701
142 Memorandum To: File From: Gary St John/ James Duvall Date: October 31, 2016 Subject: ASC for Stormwater Master Planning WO2A Windsor Woods Stormwater Master Plan: Arched Pipe ( Inspection On October 28, 2016, Gary St John and James Duvall inspected the arched pipe (UNIT ID under South Blvd The following summarizes our findings: Dimensions: 61 H x 84 W Material: Corrugated Metal Pipe Condition: Pipe has a flat bottom Bottom of pipe is corroded at both entrances to the culvert In addition, the top of the pipe was damaged by a trencher that installed communication wire on the north side of South Blvd No significant obstructions or sediment was observed in the pipe See photos next page

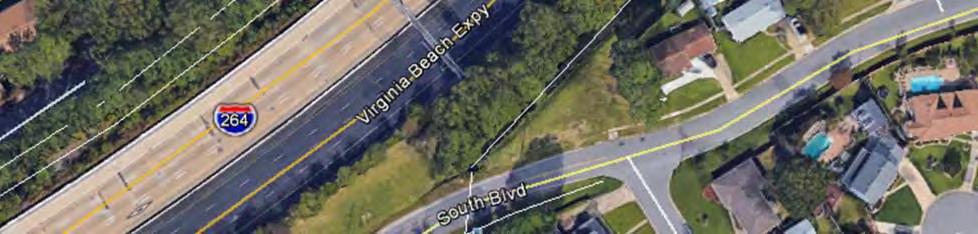


143 Memorandum October 31, 2016 Page 2 Culvert Location
144 Memorandum October 31, 2016 Page 3 Arched CMP 61 H x 84 W
145 Memorandum October 31, 2016 Page 4 Corroded pipe bottom Typical both ends of culvert
146 Memorandum October 31, 2016 Page 5 Top of pipe damaged by trencher
147 Memorandum To: File From: Gary St John/ James Duvall Date: October 31, 2016 Subject: ASC for Stormwater Master Planning WO2A Windsor Woods Stormwater Master Plan: South Plaza Trail/Presidential Blvd Catch Basin Inspections On October 28, 2016, Gary St John and James Duvall inspected the catch basins from the Fire Station on South Plaza Trail to the outfall at the Presidential Canal Of note, the water depth increases from 9 inches to 37 inches for the catch basins on Presidential Blvd There did appear to be some soil piping between catch basin and the outfall This maybe indicative of a hole in the pipe or a poorly backfilled test hole (though no evidence of excavated soils was apparent The following tables summarizes our observations Photos are also attached for information Catch Basin UNIT ID Obstructions Depth of Water (inches No Trickle No Trickle No Trickle Yes (minor Trickle No Trickle Yes (minor Trickle No Trickle No few inches No Unknown Unknown Unknown Unknown Unknown 42 Observations Piece of rubble in upstream pipe Small amount of sediment collected behind it See photo This catch basin appears to have been retrofitted Looks like they cut a hole in the top of the pipe Also concrete spoil material in the bottom from past repair of the catch basin See photo Soil piping in grassy area between catch basin and outlet to Presidential Canal Possible cave-in? See photo and video
148 Memorandum October 31, 2016 Page 2 South Plaza Trail Rubble-sediment


149 Memorandum October 31, 2016 Page 3 South Plaza Trail Catch Basin retrofit-concrete spoil
150 Memorandum October 31, 2016 Page 4 Presidential Blvd Full Pipe
151 Memorandum October 31, 2016 Page 5 Soil Piping Downstream of Manhole pick has been shoved down into the hole
152 Appendix B Stormwater Model Development Methodology B-1
153 Appendix B Stormwater Model Development Methodology This page intentionally left blank B-2
154 Appendix B Stormwater Model Development Methodology B1 Introduction The model used to investigate the flooding in the Windsor Woods neighborhood was derived from the Watershed 4 model, originally developed for the City of Virginia Beach as one of the City s stormwater management planning tools The methodology described below generically covers all the City s planning models Parameters and methodologies specific to Windsor Woods are noted in the main body of this report The primary objective for developing hydrologic and hydraulic (H/H models of the City of Virginia Beach watersheds was to provide a tool suitable for evaluating the performance of the City s stormwater management system as well as alternative improvements to meet the desired level of service for flood control This appendix describes the approach used to develop and apply the H/H model for this purpose, including data collection and evaluation, general model development considerations, summary of the modeling process, and development of H/H model parameters To support the planning level analysis described herein, the models developed have focused on the primary stormwater management system (PSMS for multiple size rainfall events and downstream tidal boundary conditions The PSMS includes constructed stormwater facilities and overland flow paths that drain to the downstream waterbody (ie, boundary condition In general, the PSMS includes open channels and pipes of 24-inch diameter and larger Furthermore, in some areas two dimensional (2D overland flow modeling was considered necessary to achieve modeling objectives In general, 2D overland flow modeling is preferable in flat areas where overland flows paths become complicated and variable over the course of a period of simulation However, 2D modeling comes at a cost in terms of data storage and computational time Therefore, the areas of 2D modeling were limited to those areas considered critical based on knowledge of the system performance B2 Model Development and Application B21 Stormwater Model Software Stormwater models were developed using PCSWMM Version 70 by CHI (Computational Hydraulics International PCSWMM uses the US Environmental Protection Agency (EPA Stormwater Management Model (SWMM Version computational engine, and includes a custom graphical user interface (GUI, which offers GIS functionality, model building, calibration, and post processing tools PCSWMM also includes a pseudo-2d development tool that allows gridded overland flow modeling using fully compliant EPA SWMM input B-1
155 Appendix B Stormwater Model Development Methodology B22 Levels of Detail, Temporal Scales, and Numerical Time Steps The levels of detail must be adequate to accurately define and characterize flooding problems and represent the local and sub watershed-wide effects of each alternative and/or series of alternatives to cost-effectively size projects to solve existing problems Typically, an adequate level of detail was considered to include the PSMS as defined by 24-inch diameter pipes and larger In general, this means that pipes smaller than this size are considered secondary and were not explicitly modeled Where areas of reasonably large size were served by pipes smaller than 24-inches in diameter, these pipes were included in the model In the 1D portion of the model, all pipes in the primary system have runoff loaded to the upstream terminus and thus help define subbasin delineation It should be noted that if pipes as small as 15 inches in diameter (or smaller were included in the model, the inlets providing runoff to these pipes would require loading from the hydrologic analysis and, therefore, further subbasin refinement This would require a level of delineation that could be as much as an order of magnitude more detailed, and well beyond the scope of this SMP Typically, the larger pipes will accurately represent the limitations and the level of service (LOS for a given intersection s stormwater system However, there may be some instances where the smaller pipes and/or the inlet capacities are the constraints on LOS In these cases, the model may underestimate flooding To accurately represent watershed hydrology, the rainfall interval should be less than the travel times within the smallest subbasin For this project, 5-minute and 6-minute rainfall intervals were used With respect to hydraulics, it is also important that time steps be considered that provide appropriate computational iterations within the shortest travel time associated with system hydraulic conveyances, thereby maintaining continuity (shortest travel times are typically associated with relatively short sections of large-diameter pipes For 2D modeling, relatively small time steps have been utilized to most directly simulate stormwater features and maintain continuity (05 seconds B3 Model Development Process This section presents an overview of the modeling development process that was applied for the watersheds included in this study B31 Collect Data and Characterize Watershed Table B-1 provides a list of data sources that were used for model development Table B-1 Virginia Beach Stormwater Master Plan Available GIS Data Data Type Name Description Topographic Data LiDAR_DSM_ feet DEM This digital surface model (DSM has been prepared from LiDAR data acquired in the spring of 2013 The fundamental vertical accuracy for bare earth elevations is 042 feet, with a consolidated vertical accuracy of 064 feet The bare earth DSM excludes buildings, trees, etc Soil Data Soils (2010 Soil information provided by City of Virginia Beach Department of Communications and Information Technology Center for Geospatial Information Services (ComIT/CGIS and generated by the USDA (United States Department of Agriculture B-2
156 Appendix B Stormwater Model Development Methodology Data Type Name Description Impervious Area Land Use Stormwater Infrastructure Structures and Physical Features (2017 LandTablemdb (2015 Stormwater (2017 Planimetric data including building footprints, road edges, hydrography edges, transportation surfaces such as driveways, parking lots, sidewalks, trails, poles, walls Land Use database provided based on City of Virginia Beach tax assessor information Public Works Stormwater Infrastructure data including drop inlets, manholes, outfalls, dam and spillways, pipes, pump stations, BMPs, ditches provided by City of Virginia Beach ComIT/CGIS Following review of the data, data gaps were identified and strategies were formulated to obtain the missing data City staff gathered and provided to CDM Smith the data necessary for model development The Public Works Stormwater infrastructure data included pipe invert elevations based on the date of implementation The elevation datum has changed from NGVD 1929, to NGVD 1929 datum with 1972 adjustment, to NAVD 88 during the lifetime of the current stormwater system The date of implementation attribute was used to adjust the invert elevation based on the following: pipes built before January 1, 1978, were considered to be on the NGVD 1929 datum, those built between January 1, 1978, and Dec 1, 1997, were considered to be on the NGVD 1929 datum with 1972 adjustment, and those built after January 1, 1998, were considered to be on the NAVD 88 datum Elevation adjustments were applied to the GIS pipe inverts so all expressed in the NAVD 88 datum The adjustment values vary by watershed and were provided by the City for each; however, the adjustment is generally NAVD = NGVD -11 ft for the earlier dates and NAVD = NGVD 08 ft for the latter The GIS data was converted to model input parameters using GIS and the methodologies below Critical attributes in the stormwater layers, aside from coordinates, include Unit Identification (UNITID in the junction shapefiles (Storm_Inletshp, Storm_Manholeshp, Storm_Nodeshp, and Storm_Miscshp For the conduit shapefile (Storm_Mainshp, critical attributes include UNITID, pipe type (pipe shape, pipe height (pipe ht, pipe diameter for circular pipes or pipe width for elliptical (pipe diam, and upstream (US_INV and downstream (DS_INV inverts For model naming, the UNITID is used for all junctions and outfalls, and most storages (the exception being named lakes For pipes, the naming convention is USN:DSN, where USN is the upstream node and DSN is the downstream node B32 Model Preparation Model preparation involved the following steps: The first step was to prepare a model schematic based on the defined levels of detail The figures depict the subbasins, nodes (junctions, links (conduits, pipes and channels, and identification codes (alphanumeric on an aerial photogrammetric base map In the preparation of the model schematic, model node placement helps define the level of detail for the overall stormwater model Model node placement was primarily based on the locations of inlets, manholes, and other miscellaneous nodes in the GIS layers Nodes have B-3
157 Appendix B Stormwater Model Development Methodology been added to the model, which were not in the GIS, at topographic low points and locations of hydraulic elements along the stormwater system (eg, storage, confluence of ditches, changes in stream cross-section Note that since the level of detail chosen for this project is a 24-inch diameter pipe, feeder (collector pipes from inlets to the primary system are often not modeled Therefore, each modeled inlet may represent multiple real inlets For example, an intersection may include eight curb inlets that all feed to a 24-inch diameter pipe At a stormwater management plan level of detail, it is expected that the critical element (the control point in the system is the 24-inch diameter pipe and not the curb/gutter inlets or the feeder pipes It is possible to redefine the level of refinement of any watershed model for future work Smaller pipes can be added to the SMP models and the subbasins redelineated at finer levels After the model network was defined, subbasins were delineated based on available topographic data and local stormwater system maps, and the hydrograph load points were assigned to each In general, subbasins were delineated for the area tributary to each node Occasionally, nodes were adjusted and/or added to define subbasins with relatively uniform hydrologic properties and/or to properly distribute the runoff from the subbasin to the modeled stormwater systems Each subbasin defines a model node as load point to route the corresponding hydrograph along the modeled network The load point generally corresponds to a node nearest to the lowest elevations in the subbasins Flat topography generally determined the areas where 2D overland flow routing was used During high-intensity storms, including the 100-year storm, it is expected that many roads and low-lying areas will be the first locations to flood If the topography shows a general downhill direction for this flooding to flow, the area may be represented with 1D modeling There are still above-ground model elements, including stage-storage area nodes and hydraulic overland flow links; but a full 2D model is not necessary In areas that are generally flat and the ponded areas may flow in more than one direction, 2D modeling is used to more accurately identify the flood elevations Boundary Conditions and Sea Level Rise (SLR for the stormwater system evaluation include design-frequency tailwater elevation in combination with coincident rainfall applicable to tidal flood conditions Section B59 below provides a more detailed discussion of the development of model boundary conditions B33 Model Validation Following initial model development, the simulation results were compared against known flooding conditions within the watershed Adjustments were made to model parameters to obtain a reasonable fit with available data Refer to the body of the report for the individual model validations storms, historical flood data, and results B-4
158 Appendix B Stormwater Model Development Methodology B4 Hydrologic Data and Parameters B41 Rainfall Data Rainfall data was used to generate stormwater runoff hydrographs for each subbasin represented in the design storm event hydrologic model Design storm rainfall data are generally characterized by a depth (measured in inches, intensity (inches per hour, return period (years, event duration (hours, spatial distribution (locational variance, and temporal distribution (time variance Design storm events are usually designated to reflect the return period of the rainfall depth and the event duration For example, a 25 year, 24 hour design event describes a rainfall depth over a 24-hour period that has a 4 percent (1/25 chance of occurring at a particular location in any given year Figure B-1 below presents rainfall data utilized for this study A normalized (unit rainfall hyetograph was adopted from the localized Type C distribution for the 25-year storm obtained from the NRCS The 25-year normalized distribution was used for storms of all recurrence periods by multiplying the unit hydrograph with the given return period volume Total storm volumes for the 2-, 10-, 25-, 50-, and 100-year storms are shown in Table B-2 These total storm volumes were also obtained from the NRCS based on the location of the centroid of the City 12 Normalized Rainfall Intensity (hr Time (min Figure B-1 Design Storm Rainfall Data B-5
159 Appendix B Stormwater Model Development Methodology Table B-2 Design Storm Volumes Return Period/ Duration Rainfall Depth (inches Peak Intensity (inches/hour 2 Year Year Year Year Year Year B42 Topography and Vertical Datum Topographic data are used to define hydrologic boundaries, runoff flow paths and slopes, out ofbank channel cross sections, overland hydraulic links, stage area storage relationships, and critical flood elevations For this study, the principle source of topographic data was the Digital Elevation Model (DEM provided by the City A DEM is a 2D surface with elevation values at discrete points on the surface These discrete points are tiles each having a specific elevation value and a resolution of 25 feet in length and width The fundamental vertical accuracy for bare earth elevations is 042 feet, with a consolidated vertical accuracy of 064 feet This DEM was used to determine hydrologic and hydraulic overland flow paths, stage areastorage relationships, and subbasin boundaries The DEM was also used to develop the 2D model The elevation data used in the computer models and provided in this report are referenced to the North American Vertical Datum of 1988 (NAVD88 B43 Subbasin Delineation Subbasins are defined by natural physical features, and by constructed stormwater conveyance systems that control and direct stormwater runoff to a common outfall Delineation of the study area subbasins was based primarily on the DEM, land use, and stormwater collection system data Once established, each subbasin is given specific hydrologic values that describe the area in terms of key hydrologic characteristics These values are among the critical inputs to the model The hydrologic parameters assigned to each subbasin included area, flow width, slope, impervious area, roughness, initial abstraction, and Green-Ampt soil parameters of saturated hydraulic conductivity, capillary suction, and initial moisture deficit Additionally, not all of the impervious surface is directly connected to the hydraulic system The percent of the impervious surface routed to pervious surfaces is an additional input parameter (see Section B441 and was estimated by land use Subbasin roughness and initial abstraction were also assigned according to the land use within the subbasin The total impervious area was directly estimated from the impervious coverage in GIS, while the soils parameters are estimated from the soils coverage Section B47 below describes how these data were reduced for use in the model B-6
160 Appendix B Stormwater Model Development Methodology B44 Land Use Parameters and Impervious Areas The City provided planimetric impervious coverage layers (see Table B-1 in Section B3 that were used to directly calculate the percentage of impervious area within each subbasin using GIS tools The land use coverage also provided by the City was used to estimate secondary hydrologic parameters, such as impervious to pervious routing, surface friction factors, and initial abstractions for each subbasin Aside from pervious area roughness, the models are not as sensitive to these secondary land use derived parameters as to impervious coverage and soil infiltration capacities Therefore, typical values derived from engineering experience and/or SWMM defaults were used for these parameters Local analysis of the secondary runoff parameters was not performed for the SMP as per scope Pervious area roughness was derived from land use type, as discussed below, and was often adjusted during calibration For this project, the land uses were grouped into 10 categories of relatively homogeneous geophysical parameters Present land uses within the study area include: Forests, Open Land, and Parks (Open Pasture (Past Golf Courses and Agriculture (Ag/GC Low Density Residential (LDR Medium Density Residential (MDR High Density Residential and Mixed Use (HDR Commercial, Light Industrial, and Institutional (Comm Heavy Industrial and Transportation (HInd Wetlands; and (Wetlnd Waterbodies (Water B441 Land Use Dependent Parameters Land cover was used to characterize the percent of the impervious area routed to pervious areas (the Routed parameter The infiltration and runoff routing parameters for the directly connected impervious area (DCIA differs from the non-dcia areas Non-DCIA areas may include roof surfaces that are routed to pervious yards as opposed to directly to the stormwater system, for example Some roads and minor parking lots all may runoff to grassy swales prior to loading to the PSMS Typically, about one-third of medium density residential impervious surfaces are routed to pervious; while only 10 percent of commercial surfaces are routed to pervious Land cover was also used to characterize the surface roughness (Manning n of the overland flow path and the depression storage within the subbasin Each modeled subbasin requires values defined for the following land cover model parameters: B-7
161 Appendix B Stormwater Model Development Methodology Surface Roughness (Pervious n and Impervious n The Manning n Roughness Coefficient along the representative overland flow Depression Storage (Pervious Ia and Impervious Ia Depression storage is the amount of rainfall at the beginning of a precipitation event that is trapped within areas (usually small and does not become surface runoff (in SWMM, generally a portion of the impervious area is given no (zero depression storage The impervious surface roughness represents the composite roughness of rooftops, sidewalks, streets, gutters, inlets, and collector pipes, if these are not modeled explicitly in the hydraulic model The pervious roughness is the composite roughness of sheet flow over pervious surfaces such as lawns and open areas Table B-3 lists ranges by land cover type Note the values are higher than Manning s n values for channel flow (for example, because the depth of flow is much less Table B-3 Published Values of Manning n Roughness Coefficients for Overland Flow Source Ground Cover Manning n Range Crawford and Linsley ( Smooth asphalt 0012 Asphalt of concrete paving Packed clay 0014 Packed clay 003 Light turf 02 Dense turf 035 Dense shrubbery and forest litter 04 Engman ( Concrete or asphalt Bare sand Graveled Surface Bare clay-loam (eroded Range (natural Bluegrass sod Short grass prairie Bermuda grass Depression storage characterizes the interception of runoff before it reaches the inlets of the collection system In SWMM, depression storage is treated as an initial abstraction, such that the depression storage volume must be filled prior to surface runoff Depression storage is expressed as a depth (in inches over the entire subbasin and values are required for both impervious and pervious areas The volume of depression storage within a subbasin represents the sum of depression areas including small cracks and voids in paved surfaces, puddles, sags in street profiles, rooftops, and interception due to vegetation In SWMM, water that ponds in these depression areas either evaporates from the impervious surface area or infiltrates into the soil from pervious surface areas The portion of the impervious area given zero depression storage is 1 Crawford, NH and Linsley, RK, Digital Simulation in Hydrology: Stanford Watershed Model IV, Tech Report No 39, Civil Engineering Department, Stanford University, Palo Alto, CA, July Engman, ET, Roughness Coefficients for Routing Surface Runoff, Journal of Irrigation and Drainage Engineering, ASCE, Vol 112, No 1, February 1986, pp B-8
162 Appendix B Stormwater Model Development Methodology set to 25 percent, unless adjusted during model calibration This SWMM default value was used to simulate impervious areas that are sloped and/or smooth enough to not allow ponding Typical depression storage values range from 005 to 05 inches and vary by subbasin and land cover Global values of land use dependent variables are compiled in Table B-4 Table B-4 Global Land Use Dependent Parameters Parameter Open Past Ag/GC LDR MDR HDR Comm HInd WetLnd Water Impervious n Pervious n Impervious Ia Pervious Ia Routed 80% 80% 80% 50% 34% 21% 10% 10% 0% 0% Note: Refer to Section B44 above for heading land use definitions The parameters in Table B-4 were incorporated into the model by intersecting the land use coverage with the subbasin polygons in GIS, and the resulting values were area weighted by subbasin to develop parameter values for inclusion in the model B442 Impervious Area Any rainfall that occurs on impervious area becomes surface runoff once its depression storage is filled The City provided multiple surface coverages in GIS: polygon features in plan view of buildings, streets, parking lots, sidewalks, waterbodies, and miscellaneous features such as pools and sheds These layers of impervious surfaces were combined in GIS to form one impervious surface layer of the City The combined impervious coverage was verified using recent aerial photography of the City and corrected, where necessary The impervious layer was then intersected with the subbasin polygons to provide the impervious area per subbasin The impervious area for future conditions was updated for parcels identified as zoned for future development by the City The impervious percentages corresponding to parcel zoning provided by the City are listed in Table B-5 B-9
163 Appendix B Stormwater Model Development Methodology Table B-5 Impervious Percentage Corresponding to Parcel Zoning Zoning Impervious Percentage A12 40* A18 50* B1 90** B2 90** B3 90** B4C 90** I1 90** O2 25 PDH1 85 PDH2 85 R20 25 R5D 40 R75 40 Note: *excludes recreational surfaces and buildings suggest +10% **no impervious listed assume 90% B45 Runoff Parameters For this project, kinematic wave flow routing techniques (EPA SWMM RUNOFF methodology were used as opposed to more traditional unit hydrograph techniques for the following reasons (note: kinematic wave routing applies only to the hydrologic or runoff layer, hydraulic routing is performed with dynamic wave methodologies: Unit hydrograph techniques have primary applicability on mid-size subbasins, on the order of 1 to 400 square miles, whereas kinematic wave techniques become more accurate with decreasing subbasin size One of the model selection criteria was the ability to run continuous simulations The Green-Ampt infiltration methodology is more applicable to continuous simulations than curve number methodologies SWMM runoff is a rigorous, parameter-based methodology that more readily lends itself to local, physical parameter changes (through calibration and/or detailed modeling of a watershed subset The time of concentration calculation in SCS methodology does not vary by storm depth; however, real travel times are shorter in larger storms due to increasing depth of flow, which is estimated in SWMM With the SWMM methodology, runoff parameters that affect the timing and shape of the stormwater runoff hydrograph are defined as opposed to a unit hydrograph Each model subbasin requires the following runoff parameters: B-10
164 Appendix B Stormwater Model Development Methodology Subbasin Area The total subbasin area calculated in GIS Representative runoff flow paths, which are developed within each subbasin that characterize the route runoff takes to the modeled stormwater network (to estimate the subbasin width and slope parameters below Subbasin widths The subbasin area divided by the average length of the runoff flow paths within the subbasin Average surface slopes The average slope of the subbasin along representative runoff flow paths The timing of the runoff is dependent on the subbasin geometry (average slope and average length, roughness of both the impervious and pervious surfaces, and total flow (developed from rainfall minus infiltration and initial abstraction Therefore, times of concentration are not calculated or input directly in SWMM To develop representative parameters for modeling, up to three flow paths were developed for each subbasin Each flow path was used to characterize routing of flow through an associated percentage of the subbasin Each of the portions of the subbasins are idealized as a rectangular runoff area of length equal to the flow path and width equal to the area divided by the flow path length Area weighted average of the flow path parameters is then used in the model These parameters, together with surface roughness and rainfall are used to calculate runoff hydrographs for each subbasin The formulation of each model parameter is further discussed in the paragraphs below B451 Length and Slope The length (L parameter is the average area-weighted travel length to the hydraulic model load point The load point is typically located at the lowest inlet within the subbasin For ponded or detention storage areas, the hydraulic model load point is typically represented by the edge of the pond or basin For areas where ponding does not occur, the hydraulic model load point is typically the downstream extent of the subbasin area The slope parameter is the average slope over the flowpath length and is calculated by dividing the difference in elevation by the length Length and slope information was obtained using the LiDAR topographic data (DEM Up to three flow paths were evaluated within the irregular shaped subbasins to develop the average area-weighted path, slope, width, and Manning n roughness Each flow path was defined in GIS and assigned an associated length, slope, and weight (ie, the percentage of the subbasin area that the individual flow path represents Flow paths begin at a high elevation located along the subbasin boundary and end at the hydraulic load point discussed above The average surface slope of each subbasin was determined as the area-weighted average of the representative flow paths Area-weighted flow path lengths and slopes were initially determined utilizing available topographic data B-11
165 Appendix B Stormwater Model Development Methodology B46 Soils and Geotechnical Data Soils in the pervious part of the subbasin affect the rate and volume of water infiltration The hydrologic model uses the Green-Ampt equations to determine infiltration and soil moisture accounting In PCSWMM, the Modified Green-Ampt option was chosen, because the original EPA SWMM Green-Ampt option may cause an inadvertent loss of infiltration capacity under certain hydrologic conditions and therefore may cause erroneous results The Green-Ampt equation was chosen because it may be adopted for continuous simulation of weeks, months, and years since it provides a more accurate recovery of soil storage for multiple events over a long time period This method for modeling infiltration assumes that a sharp wetting front exists in the soil column, separating soil with some initial moisture content below from saturated soil above The input parameters required are the initial moisture deficit of the soil, the soil's hydraulic conductivity, and the suction head at the wetting front The recovery rate of moisture deficit during dry periods is empirically related to the hydraulic conductivity The initial deficit for a completely drained soil is the difference between the soil's porosity and its field capacity Estimated values for all of these parameters can be found in Table B-6 Characteristics of various soils for the Green-Ampt Method were applied from EPA SWMM 5 Help, Green-Ampt Infiltration Parameters, Soil Characteristics Table; which in turn was developed from Rawls, Brakensiek, and Miller, Green Ampt Infiltration Parameters from Soils Data, Journal of Hydraulic Engineering, 109:1316 (1983 Table B-6 Soil Parameter Estimates Soil Texture Hydraulic Conductivity (inches/hour Initial Moisture Deficit (fraction Suction Head (inches Sand Loamy Sand Sandy Loam Loam Silt Loam Sandy Clay Loam Clay Loam Silty Clay Loam Sandy Clay Silty Clay Clay B-12
166 Appendix B Stormwater Model Development Methodology B47 Hydrologic Model Input The hydrologic parameters described above were either developed within a subbasin (area, width, slope, or developed from city-wide coverages of impervious surface, land-use, and soils (impervious percent, percent routed to pervious, impervious and pervious depression storage, impervious and pervious roughness values, saturated hydraulic conductivity, initial moisture deficit, and suction head These latter parameters may vary over a given subbasin; however, a single value must be entered in the model Therefore, the coverages and the subbasin polygons were intersected and the various parameters area weighted to find the representative value over each subbasin area For saturated hydraulic conductivity, because the values may vary by nearly two orders of magnitude, logarithmic area-weighting is performed The values within intersected sub-areas were converted to a log scale, area-weighted, then inverse logs were calculated Once the area-weighted parameters were set for each subbasins, the values were moved to PCSWMM using the PCSWMM import tools B5 Hydraulic Data and Parameters The H/H model uses a node/link (junction/conduit representation of the PSMS For this study, the PSMS links were primarily circular pipes ranging in size from 24 to 72 inches in diameter In some cases, smaller pipes down to 15 inches were included Links also may represent culverts, pumps, weirs, orifices, ditches, streams, canals, and overland flows (dual links, which are described below Nodes are located at: The ends of pipes or culverts Locations of inlets where the subbasin runoff is loaded Manholes Locations where the stormwater pipes change diameter Points representing the subbasin low surface elevations (storage units For nodes in the 2D modeling area (see Section B57, node rim elevations were set 30 ft above ground elevation by default because the 2D model builds overland conduits 30 ft deep To not have water flood out of the model, the node rim elevation needs to be as high as the highest linked conduit Similar methodology was used in the 1D modeling areas, where above ground features, such as stage-storage junctions and overland links, were used to not only keep flooding within model elements, but also to provide a relatively accurate estimate of flood depth Again, the node rim elevations need to be as high as the highest connecting link, and in the case of storage junctions, as high as the stage-storage curve All nodes in the 1D modeling area were set at least 10 ft above ground elevation, to provide a consistent offset In the case of manholes, adding 10 ft to the rim effectively seals the manhole, by not allowing water to flood out of the model at that location In the case of nodes representing points on ditches, stream, and canals, the rim may be set more than 10 ft above ground elevation because the connecting links may be more than 10 ft deep (and the node invert in this case is generally at ground elevation A column has been added to the model files to include the actual ground elevation at each node, labeled as Ground B-13
167 Appendix B Stormwater Model Development Methodology B51 Stage Area Relationships In the 1D portion of models, storage is accounted for explicitly as stage area storage relationships and in open (irregular conduits Actual starting water levels are also considered for dead storage accounting Stage storage area relationships are necessary for lakes and low lying areas that are not part of overland and street flow conduits An accurate accounting of the storage and conduit volumes is needed for accurate peak flood stage, flow, and velocity estimates Stage storage area relationships were computed for each storage node using the topography from LiDAR and GIS The plan areas for stages of depth above node invert were calculated from the surface as appropriate In general, the area attributed to each storage node is limited by the subbasin boundary around that node, though in practice, the maximum stage in the curve is not always deep enough to extend to the subbasin boundary Storage volume is calculated internally in the model Not all subbasins have related storage junctions, as some subbasins have no storage beyond that which is represented in the model links It is also important to avoid double counting surface area and conveyance system storage in the hydraulic models The project team verified that each conduit s storage capacity was not included in the stage storage relationships by removing an equivalent amount of storage from the LiDARbased stage storage relationships of the adjacent junctions Where appropriate, this was done by clipping the area within the storage node s subbasin, to remove the areal footprint of the overland conduits (ditches, streams, street flow conduits, see Section B56 Each subbasin was reviewed and areas of surface conduits were identified For each surface conduit, profiles at key locations were inspected to determine the top of bank locations These locations were then used as the basis of the area clipped from the area of storage analysis B52 Culverts and Pipes Survey data obtained for the project provided the necessary data for the stormwater pipes and structures that defined the PSMS The City provided GIS data files which contained culvert and pipe location, shape, size, material, upstream and downstream invert elevations, and date of installation The date of installation was used to determine the likely datum of the invert elevations as described in Section B31 Where size or invert elevations were missing from the City s GIS inventory, additional survey was performed For the purposes of initial model development, pipe roughness values in the model assume a clean, maintained system Therefore, reinforced concrete pipes (RCP were assigned a Manning s roughness value of 0013 and corrugated metal pipe (CMP roughness values were set to 0024 For HDPE and PVC pipes, a value of 0011 was used These values were used as a calibration parameter as the model was further refined with available calibration data Pipe lengths were determined using the survey and the GIS database Local losses were developed from the Virginia Department of Transportation (VDOT Drainage Manual, Section 9493 (Conservation of Energy and Energy Losses Head losses at each model junction are calculated internally in SWMM, using the user supplied loss coefficients Entrance loss coefficienst (Ke were set to 035 Exit loss coefficients (Ko were set to 025 for manholes, 05 for pipes and culverts discharging into moving water, and 10 for pipes and culverts discharging into still water Under the additional minor loss in SWMM, bend losses were added B-14
168 Appendix B Stormwater Model Development Methodology based on VDOT Table 9-9, Losses in Junction Due to Change in Direction of Flow Lateral For example, a K value 07 is used for 90-degree bends and T s, a value of approximately 05 is used for 45-degree bends and a value of approximately 025 is used for 20-degree bends The VDOT drainage manual includes adjustments to the total local losses (entrance plus exit plus bend losses based on plunging losses at upstream inlets and inlet shaping in manholes Due to the scope of the masterplan models, these loss corrections are ignored Plunging losses occur at the upstream elements in a drainage system, where the inflows are larger than 20 percent of the pipe flow For the masterplan models, these upstream elements are considered part of the secondary system, which are combined with the runoff elements and not explicitly modeled In general, the primary (modeled system contains 24-inch pipes and larger For City-wide master planning purposes, the larger system is tested for potential deficiencies and local inlets and feeder pipes are expected to convey the subbasin runoff to the PSMS Since these secondary systems are not included in the model, plunging losses are not included Inlet shaping refers to manhole design and the ability of flow to smoothly move through the structure VDOT allows for a 50 percent reduction in local losses for smooth flow conditions The City-wide masterplan models do not include this adjustment due to the tens of thousands of junctions in the model and the unknown condition of most of these, and to be conservative B53 Open Streams and Open Channels Open channels and streams typically consist of an incised or main channel surrounding the stream centerline that is capable of passing flows with return periods ranging from a few months to a few years, and a floodplain that stores and/or conveys flows that are greater than what the main channel can carry In SWMM, open channels are represented as prismatic channels, meaning that the hydraulic properties defined for the transect provided to each link are applied consistently throughout the length of the modeled link Open channel ditch, stream, and canal segments were modeled as irregular cross-sections with a center channel representing the ditch or canal, and left and right overbank areas representing the floodplain Roughness values for center channels ranged from 003 to 010 based on vegetation and engineering judgment Roughness in the overbanks ranged from 004 to 02 based on vegetation and engineering judgment Additional guidance on channel roughness is provided in Table B-7 (from Chow, VT, Open Channel Hydraulics, McGraw-Hill, 1959 B54 Stormwater Control Structures Review CDM Smith reviewed storm water control structure related information provided by the City for inclusion within the models, primarily in CAD drawings These represent weir or drop structures that regulate lake levels within the watersheds and allow for overflow B55 Outfalls Based on project specific survey and the GIS coverage of stormwater pipes provided by the City, stormwater points of discharge were identified and simulated as outfalls that discharge to water bodies These points of discharge or outfalls are modeled in SWMM as streams and pipes discharging into receiving waters with fixed boundary conditions For calibration and validation, time series boundary conditions were used where data was available For subbasins discharging B-15
169 Appendix B Stormwater Model Development Methodology to a water body without pipes, these may be simulated as sheet flow to the waterbodies from the subbasins along the shore Table B-7 Open Channel Manning s Roughness Values Channel Type Minimum Normal Maximum Main Channels a Clean, straight, full stage, no rifts or deep pools b Same as above, but more stones and weeds c Clean, winding, some pools and shoals d Same as above, but some weeds and stones e Same as above, lower stages, more ineffective slopes and sections f Same as d with more stones g Sluggish reaches, weedy, deep pools h Very weedy reaches, deep pools, or floodways with heavy stand of timber and underbrush Mountain streams, no vegetation in channel, banks usually steep, trees and brush along banks submerged at high stages a Bottom: gravels, cobbles, and few boulders b Bottom: cobbles with large boulders a Pasture, no brush Floodplains 1 Short grass High grass b Cultivated areas 1 No crop Mature row crops Mature field crops c Brush 1 Scattered brush, heavy weeds Light brush and trees, in winter Light brush and trees, in summer Medium to dense brush, in winter Medium to dense brush, in summer d Trees 1 Dense willows, summer, straight Cleared land with tree stumps, no sprouts Same as above, but with heavy growth of sprouts Heavy stand of timber, a few down trees, little undergrowth, flood stage below branches Same as 4 with flood stage reaching branches B-16
170 Appendix B Stormwater Model Development Methodology Channel Type Minimum Normal Maximum Excavated or Dredged a Earth, straight, and uniform 1 Clean, recently completed Clean, after weathering Gravel, uniform section, clean With short grass, few weeds b Earth winding and sluggish 1 No vegetation Grass, some weeds Dense weeds or aquatic plants in deep channels Earth bottom and rubble sides Stony bottom and weedy banks Cobble bottom and clean sides c Dragline-excavated or dredged 1 No vegetation Light brush on banks d Rock cuts 1 Smooth and uniform Jagged and irregular e Channels not maintained, weeds and brush uncut 1 Dense weeds, high as flow depth Clean bottom, brush on sides Same as above, highest stage of flow Dense brush, high stage Lined or Constructed a Cement 1 Neat surface Mortar b Wood 1 Planed, untreated Planed, creosoted Unplanned Plank with battens Lined with roofing paper c Concrete 1 Trowel finish Float finish Finished, with gravel on bottom B-17
171 Appendix B Stormwater Model Development Methodology Channel Type Minimum Normal Maximum Lined or Constructed 4 Unfinished Gunite, good section Gunite, wavy section On good excavated rock On irregular excavated rock d Concrete bottom float finish with sides of: 1 Dressed stone in mortar Random stone in mortar Cement rubble masonry, plastered Cement rubble masonry Dry rubble or riprap e Gravel bottom with sides of: 1 Formed concrete Random stone mortar Dry rubble or riprap f Brick 1 Glazed In cement mortar g Masonry 1 Cemented rubble Dry rubble h Dressed ashlar/stone paving i Asphalt 1 Smooth Rough j Vegetal lining B56 Overland Flow Conduits In the 1D portion of the model, depth of flooding, and movement of flood waters is controlled by two methods: stage storage curves in the storage nodes (see Section B51, and overland flow conduits (also known as multi-links, dual links, or major/minor systems Overland flow conduits serve two purposes, storage of floodwaters and conveyance of flood waters; both generally occurring when the subsurface stormwater system is overwhelmed by a large volume and/or a high intensity storm In some municipalities, the storage and conveyance in streets is a feature of the stormwater system and therefore need to be included in the model There are two basic types of overland flow conduits: a weir type and a channel type B-18
172 Appendix B Stormwater Model Development Methodology B561 Weir-type Overland Flow The weir-type overland flow link represents an equalizer between two low areas For this overland flow, there is generally a hydraulic boundary between two subbasins, such as a (relative high point in a road, a major road crossing, or a berm between two ponds A weir may be used to represent the boundary between the subbasins (and hence the storage node areas, but typically the boundary is irregular and therefore, the overland flow link is a cross section representative of the street or other defined boundary between the two subbasins The length of these channels is typically short (20 to 50 feet to minimize additional storage while maintaining computational stability The cross-section widths are on the order of 50 to 300 feet (though some may be much wider The Manning s roughness values range from 0015 to 005 and there may be different roughness values in the center channel (representing the street and overbank, although many have constant roughness values These values were selected based on published values included in Table B-7 and engineering judgement considering other obstructions within the street would result in a slightly high averaged roughness value Flow occurs in these links when ponding on either side of the link reaches the height of the topographic boundary (eg, road crown, curb, and landscape berm During high-intensity storm events, surface ponding is prevalent and flow transfer can occur from one subbasin to another B562 Channel-type Overland Flow (Street Flow The channel-type overland flow link represents flow in a street, typically parallel to the subsurface pipe Street flows are similar to the weir-type overflows in that they represent overland flow conduits linking two low-lying areas However, in a street flow link, flow is parallel to the direction of the street and the linked subbasins do not have a hydraulic boundary (high point separating them Street flows are implemented with the full length between nodes and account for both storage and conveyance It is critical to not double count this storage in the stage storage curves of the connecting nodes; therefore, the footprint of the conduit is removed from the subbasin area prior to the calculation of the storage curve (see above Flow occurs in these links as a very shallow channel connecting street inlets If the next inlet down the street has sufficient capacity, the flow may re-enter the subsurface system at that point The Manning s roughness values range from 0015 to 005 and there usually are different roughness values in the center channel (representing the street and overbank, representing yards, etc It is a judgment call by the modeler which of these types of overflows should be used in a given situation It is important to note that the stage-storage curves are a more accurate representation of storage than the conduit storage This is because the conduit has an accurate cross-section in one location (where it is extracted from the DEM, and this cross-section is extrapolated along the length of the conduit, with the only other control being upstream and downstream inverts Though in general, this extrapolation should be close to the correct storage, it is not as accurate as the stage-area calculation performed in GIS Therefore, most of the overland links are weir-types, with channel types used, as necessary, where there is no high point in the roads between subbasins and/or where there is significant slope in the road B-19
173 Appendix B Stormwater Model Development Methodology B57 2D Model Area The two dimensional model areas were initially selected as those areas with low lying, flat topography as well as known areas with local flooding problems provide by the City Trial 2D simulations were then performed to determine where significant overland flow was occurring that would benefit from the use of 2D modeling In PCSWMM, 2D flow is performed using similar methods as the overland flows in Section B56, though performed at a very fine resolution No storage areas are required, because the overland links cover all the area within the 2D model boundary PCSWMM internally calculates the length and widths of the overland conduits to maintain accurate calculations of storage while adding connectivity in up to 6 directions (for the hexagonal grid The grid spacing may be variable, depending on the resolution needed to meet the level of service for a given area For this project, a 10-foot spacing is used in the streets, while a 50-foot spacing is used in open fields and higher areas, where flooding is less likely Where flow is channelized, a directional mesh is used so that the overland links are directed parallel to flow The steps to develop the 2D model were: 1 Set up the 1D model in all areas where 2D is unnecessary using the overland components described above in Section B51 and Section B56 The 2D model cannot be used everywhere in the watershed at the resolution necessary to see flooding in roads (for example, so a determination of where to use 1D with overflows and stage-storage areas versus where to use 2D must be made For this project, 2D was used in the lowest portions of Windsor Woods, including the Windsor Woods Canal 2 In the 2D model area, 1D nodes and conduits (subsurface pipes, pumps, and force mains are built as for a 1D model The maximum depth in each node is set 30 feet higher than ground elevation (in SWMM, the maximum depth needs to be higher than the crown of the highest connecting link; in the 2D model, the highest links are the 2D conduits representing overflows 3 A 2D boundary polygon(s is built, outlining the 2D area, but also separating areas of differing resolution and/ or differing mesh shape (hexagonal, direction, etc 4 A grid of 2D nodes is automatically built in PCSWMM based on the resolution and mesh design within each boundary polygon At this step in the process, the 2D grid was transferred from PCSWMM to GIS to edit the mesh along the roads in Windsor Woods GIS tools were used to build the mesh so that the flowpaths would follow the road flowlines on each side, while also including the road crown as a potential barrier Once the 2D node grid was edited, the revised file was ported back to PCSWMM and the normal process was continued 5 Once, the 2D nodes are added, 2D conduits are added between these nodes based on the elevation in the DEM PCSWMM internally calculates the geometry of the conduits to maintain total storage 6 Once the 2D conduits are built, the 1D nodes are connected to the nearest 2D node on the 2D grid with orifices, such that once the subsurface system can no longer handle the flow, the 1D node floods onto the 2D grid B-20
174 Appendix B Stormwater Model Development Methodology 7 Finally, the 2D mesh is connected to the 1D model as appropriate For example, a 1D overflow that connects to a storage node outside of the mesh may be connected to a 2D node along a road flowline B58 Boundary Data and Conditions Boundary conditions for the model are necessary to represent the influence from downstream water levels in the downstream receiving water body When the receiving water body is low, the existing stormwater drainage system will be able to provide maximum conveyance; however, when the receiving water body is high, there will be portions of the existing drainage system that have reduced conveyance capacity The modeling software (both 1D and 2D provides flexibility for defining boundary conditions, and can adopt fixed stage boundaries or time series boundaries as necessary To account for long-duration tidal cycles, this analysis uses fixed stage boundaries The City supplied raster datasets of the tidal boundary conditions in the Lynnhaven River for the 2-year, 10-year, 25-year, 50-year, and 100-year storm events These 2-D surfaces represent the expected peak tidal surge that corresponds to the given storm s recurrence interval However, the 100-year rainfall event is not paired with a 100-year tidal surge, because the chance of the 100- year rainfall occurring at the same time as the 100-year tide is much less than 1 percent There is some correlation between the rainfall and tidal events and therefore the peak stages in the 100- year boundary condition take this into account See the main report for information on the boundary condition used for each model For each design storm, the boundary condition data was spatially joined to the model outfall locations in GIS to estimate the fixed stage at each model outfall Where the PSMS is below the fixed stage, initial depths were set in the model to match the boundary condition for each storm A spreadsheet was developed that linked each model node to a given outfall location For lakes and ponds with outfall structures, and all model junctions upstream of these elements, the initial depths were set using the maximum of the connecting outfall boundary condition and the structure s bleeder elevation (ie, normal pool elevation B-21
175 Appendix C Model Results for Recommended Alternative C-1
176 Appendix C Model Results for Recommended Alternative This page intentionally left blank C-2
177 Appendix C Model Results List of Tables Table C-1 10-year Existing Conditions C-5 Table C-2 10-year Existing Conditions with 15 Feet Sea Level Rise C-9 Table C-3 10-year Alternative 5 C-15 Table C-4 10-year Alternative 5 with 15 Feet Sea Level Rise C-19 Table C-5 10-year Alternative 5 with 30 Feet Sea Level Rise C-25 Table C-6 Existing Conditions C-31 Table C-7 Existing Conditions with 15 Feet Sea Level Rise C-37 Table C-8 Alternative 5 C-43 Table C-9 Alternative 5 with 15 Feet Sea Level Rise C-49 Table C-10 Alternative 5 with Hurricane Matthew Event C-55 C-3
178 Appendix C Model Results This page intentionally left blank C-4
179 Appendix C Table C-1 10-year Existing Conditions Table C-1 10-year Existing Conditions Model Node Location Windsor Woods Boulevard and Windsor Woods Court Estimated Crown (feet NAVD 10-year Base (feet NAVD Delta 10-year (feet South Boulevard and Brentwood Crescent South Boulevard and Palace Green Boulevard NW Silina Drive and Windsor Woods Boulevard Old Forge Road and Grist Mill Road Palace Green Boulevard and Starlighter Drive Presidential Boulevard and Gresham Court Presidential Boulevard and Kings Point Road Presidential Boulevard and Teakwood Drive Old Forge Road and S Kings Point Road Presidential Boulevard and Gladstone Drive South Boulevard and Palace Green Boulevard NE Woodlake Road and Woodlake Court Kings Point Road near Kings Point Court Presidential Boulevard and Old Forge Road Kings Point Road and Kings Point Arch W Kings Point Road and Kings Point Arch E Concord Bridge Road and Grist Mill Road S Kings Point Road and Kings Point Road Windsor Gate Circle William Penn Boulevard Brentwood Crescent and Cortland Lane PAP-87 Rosemont Road N Donnawood Drive and Appalachian Court South Boulevard and Palace Green Boulevard SE West Colonial Parkway and Silina Drive Old Forge Road and South Plaza Trail S West Colonial Parkway and Windsor Woods Boulevard Old Forge Road and S Gladstone Drive Old Forge Road and South Plaza Trail Palace Green Boulevard and South Plaza Trail Liberty Ridge Road West Colonial Parkway S Charter Oak Road C-5
180 Appendix C Table C-1 10-year Existing Conditions Model Node Location Estimated Crown (feet NAVD 10-year Base (feet NAVD Delta 10-year (feet Van Buren Drive and S Gladstone Arch Concord Bridge Road Cul-de-sac Silina Drive and Palace Green Boulevard Woodlake Road and Mill Stream Road Rosemont Road Shenandoah Court Windsor Woods Boulevard and Great Meadows Court Old Forge Road and Red Lion Road Water Oak Road near Woodlake Road Presidential Boulevard near Gladstone Drive Old Forge Road and Old Post Road Red Lion Road and Concord Bridge Road Kings Point Road and Rosemont Road Old Forge Road and Old Forge Court G Presidential Boulevard and Windsor Woods Elementary Entrance Gladstone Drive and S Gladstone Drive Piney Ridge Road and Windsor Gate Place Hillridge Court Waterside Court West Colonial Parkway and Parkway Court Old Forge Court Brentwood Crescent and Kerswick Court Kings Point Court South Plaza Trail and Windsor Woods Canal PAP-88 Rosemont Road Silina Drive and Cumberland Parkway South Plaza Trail and Fire Station Silina Drive and William Penn Boulevard Rosemont Road Red Lion Road Cul-de-sac Old Mill Court Kings Point Road and Loyalist Court N Donnawood Court Old Forge Road and Stonewall Court Windsor Gate Place and South Plaza Trail C-6
181 Appendix C Table C-1 10-year Existing Conditions Model Node Location Estimated Crown (feet NAVD 10-year Base (feet NAVD Delta 10-year (feet Water Oak Road and Brookside Lane J9385 Brentwood Crescent and Mintwood Court Rosemont Road and Kingdom Court SE Silina Drive and Presidential Boulevard Charter Oak Road Cul-de-sac Windsor Gate Road and Turtle Cove Road N Teakwood Drive and Rocky Mount Road Courtland Lane South Plaza Trail and Silina Drive N Donnawood Drive and South Plaza Trail Windsor Gate Road and Turtle Cove Road S Piney Ridge Road and Hillridge Court Rosemont Road and Kingdom Court NE Liberty Ridge Road Cul-de-sac South Boulevard and Silina Drive Pine Hill Road J16515 Old Forge Circle Rosemont Road and Old Forge Road Colonial Parkway and Palace Green Boulevard Presidential Boulevard and Van Buren Drive Kingdom Court S Gladstone Drive and S Gladstone Arch Presidential Boulevard and Donnawood Drive Presidential Boulevard and South Plaza Trail South Plaza Trail and Plaza Trail Court Mill Stream Road Rosemont Road and Silina Drive Windsor Gate Road near South Plaza Trail Presidential Boulevard and Starlighter Drive Parkwood Court Brentwood Circle Rosemont Road and Drivers World Way Palace Green Boulevard and Gateway Place J9405 Brentwood Crescent Windsor Gate Road and Old Post Road Windsor Gate Place near South Plaza Trail C-7
182 Appendix C Table C-1 10-year Existing Conditions Model Node Location Windsor Woods Boulevard and Green Springs Court Estimated Crown (feet NAVD 10-year Base (feet NAVD Delta 10-year (feet West Colonial Parkway N Presidential Boulevard Cul-de-sac Brentwood Court Drivers World Way Rosemont Road near Victoria Drive Sentara Way South Plaza Trail and Water Oak Lane Old Forge Road and Parkwood Court Rosemont Road William Penn Boulevard and Palace Green Boulevard Presidential Boulevard and Colonial Parkway A Sentara Way Kings Point Arch Cul-de-sac Bentley Gate Way J14082 Brentwood Crescent and Brentwood Court Rosemont Road and Sentara Way J6433 Loyalist Court Brentwood Crescent and Brentwood Circle J15283 Cumberland Parkway and Chancellor Drive Spruce Circle Cul-de-sac Sentara Way and Drivers World Way Piney Ridge Court Old Forge Road and Maplewood Court South Plaza Trail and Rosemont Road South Plaza Trail and Windsor Oaks Boulevard Old Forge Road Old Forge Road Old Forge Road and Windsor Castle Court C-8
183 Appendix C Table C-2 10-year Existing Conditions with 15 Feet Sea Level Rise Table C-2 10-year Existing Conditions with 15 Feet Sea Level Rise Model Node Location Estimated Crown (feet NAVD 10-year Base +15 feet SLR (feet NAVD Delta 10-year (feet Windsor Woods Boulevard and Windsor Woods Court South Boulevard and Brentwood Crescent South Boulevard and Palace Green Boulevard NW Silina Drive and Windsor Woods Boulevard Old Forge Road and Grist Mill Road Palace Green Boulevard and Starlighter Drive Presidential Boulevard and Gresham Court Presidential Boulevard and Kings Point Road Presidential Boulevard and Teakwood Drive Old Forge Road and S Kings Point Road Presidential Boulevard and Gladstone Drive South Boulevard and Palace Green Boulevard NE Woodlake Road and Woodlake Court Kings Point Road near Kings Point Court Presidential Boulevard and Old Forge Road Kings Point Road and Kings Point Arch W Kings Point Road and Kings Point Arch E Concord Bridge Road and Grist Mill Road S Kings Point Road and Kings Point Road Windsor Gate Circle William Penn Boulevard Brentwood Crescent and Cortland Lane PAP-87 Rosemont Road N Donnawood Drive and Appalachian Court South Boulevard and Palace Green Boulevard SE West Colonial Parkway and Silina Drive Old Forge Road and South Plaza Trail S C-9
184 Appendix C Table C-2 10-year Existing Conditions with 15 Feet Sea Level Rise Model Node Location Estimated Crown (feet NAVD 10-year Base +15 feet SLR (feet NAVD Delta 10-year (feet West Colonial Parkway and Windsor Woods Boulevard Old Forge Road and S Gladstone Drive Old Forge Road and South Plaza Trail Palace Green Boulevard and South Plaza Trail Liberty Ridge Road West Colonial Parkway S Charter Oak Road Van Buren Drive and S Gladstone Arch Concord Bridge Road Cul-de-sac Silina Drive and Palace Green Boulevard Woodlake Road and Mill Stream Road Rosemont Road Shenandoah Court Windsor Woods Boulevard and Great Meadows Court Old Forge Road and Red Lion Road Water Oak Road near Woodlake Road Presidential Boulevard near Gladstone Drive Old Forge Road and Old Post Road Red Lion Road and Concord Bridge Road Kings Point Road and Rosemont Road Old Forge Road and Old Forge Court G Presidential Boulevard and Windsor Woods Elementary Entrance Gladstone Drive and S Gladstone Drive Piney Ridge Road and Windsor Gate Place Hillridge Court Waterside Court West Colonial Parkway and Parkway Court Old Forge Court Brentwood Crescent and Kerswick Court Kings Point Court C-10
185 Appendix C Table C-2 10-year Existing Conditions with 15 Feet Sea Level Rise Model Node Location Estimated Crown (feet NAVD 10-year Base +15 feet SLR (feet NAVD Delta 10-year (feet South Plaza Trail and Windsor Woods Canal PAP-88 Rosemont Road Silina Drive and Cumberland Parkway South Plaza Trail and Fire Station Silina Drive and William Penn Boulevard Rosemont Road Red Lion Road Cul-de-sac Old Mill Court Kings Point Road and Loyalist Court N Donnawood Court Old Forge Road and Stonewall Court Windsor Gate Place and South Plaza Trail Water Oak Road and Brookside Lane J9385 Brentwood Crescent and Mintwood Court Rosemont Road and Kingdom Court SE Silina Drive and Presidential Boulevard Charter Oak Road Cul-de-sac Windsor Gate Road and Turtle Cove Road N Teakwood Drive and Rocky Mount Road Courtland Lane South Plaza Trail and Silina Drive N Donnawood Drive and South Plaza Trail Windsor Gate Road and Turtle Cove Road S Piney Ridge Road and Hillridge Court Rosemont Road and Kingdom Court NE Liberty Ridge Road Cul-de-sac South Boulevard and Silina Drive Pine Hill Road J16515 Old Forge Circle Rosemont Road and Old Forge Road Colonial Parkway and Palace Green Boulevard Presidential Boulevard and Van Buren Drive C-11
186 Appendix C Table C-2 10-year Existing Conditions with 15 Feet Sea Level Rise Model Node Location Estimated Crown (feet NAVD 10-year Base +15 feet SLR (feet NAVD Delta 10-year (feet Kingdom Court S Gladstone Drive and S Gladstone Arch Presidential Boulevard and Donnawood Drive Presidential Boulevard and South Plaza Trail South Plaza Trail and Plaza Trail Court Mill Stream Road Rosemont Road and Silina Drive Windsor Gate Road near South Plaza Trail Presidential Boulevard and Starlighter Drive Parkwood Court Brentwood Circle Rosemont Road and Drivers World Way Palace Green Boulevard and Gateway Place J9405 Brentwood Crescent Windsor Gate Road and Old Post Road Windsor Gate Place near South Plaza Trail Windsor Woods Boulevard and Green Springs Court West Colonial Parkway N Presidential Boulevard Cul-de-sac Brentwood Court Drivers World Way Rosemont Road near Victoria Drive Sentara Way South Plaza Trail and Water Oak Lane Old Forge Road and Parkwood Court Rosemont Road William Penn Boulevard and Palace Green Boulevard Presidential Boulevard and Colonial Parkway A Sentara Way Kings Point Arch Cul-de-sac C-12
187 Appendix C Table C-2 10-year Existing Conditions with 15 Feet Sea Level Rise Model Node Location Estimated Crown (feet NAVD 10-year Base +15 feet SLR (feet NAVD Delta 10-year (feet Bentley Gate Way J14082 Brentwood Crescent and Brentwood Court Rosemont Road and Sentara Way J6433 Loyalist Court J15283 Brentwood Crescent and Brentwood Circle Cumberland Parkway and Chancellor Drive Spruce Circle Cul-de-sac Sentara Way and Drivers World Way Piney Ridge Court Old Forge Road and Maplewood Court South Plaza Trail and Rosemont Road South Plaza Trail and Windsor Oaks Boulevard Old Forge Road Old Forge Road Old Forge Road and Windsor Castle Court C-13
188 Appendix C Table C-2 10-year Existing Conditions with 15 Feet Sea Level Rise This page intentionally left blank C-14
189 Appendix C Table C-3 10-year Alternative 5 Table C-3 10-year Alternative 5 Model Node Location Windsor Woods Boulevard and Windsor Woods Court Estimated Crown (feet NAVD 10-year Alternative 5 (feet NAVD Delta 10-year (feet South Boulevard and Brentwood Crescent South Boulevard and Palace Green Boulevard NW Silina Drive and Windsor Woods Boulevard Old Forge Road and Grist Mill Road Palace Green Boulevard and Starlighter Drive Presidential Boulevard and Gresham Court Presidential Boulevard and Kings Point Road Presidential Boulevard and Teakwood Drive Old Forge Road and S Kings Point Road Presidential Boulevard and Gladstone Drive South Boulevard and Palace Green Boulevard NE Woodlake Road and Woodlake Court Kings Point Road near Kings Point Court Presidential Boulevard and Old Forge Road Kings Point Road and Kings Point Arch W Kings Point Road and Kings Point Arch E Concord Bridge Road and Grist Mill Road S Kings Point Road and Kings Point Road Windsor Gate Circle William Penn Boulevard Brentwood Crescent and Cortland Lane PAP-87 Rosemont Road N Donnawood Drive and Appalachian Court South Boulevard and Palace Green Boulevard SE West Colonial Parkway and Silina Drive Old Forge Road and South Plaza Trail S West Colonial Parkway and Windsor Woods Boulevard Old Forge Road and S Gladstone Drive Old Forge Road and South Plaza Trail Palace Green Boulevard and South Plaza Trail Liberty Ridge Road C-15
190 Appendix C Table C-3 10-year Alternative 5 Model Node Location Estimated Crown (feet NAVD 10-year Alternative 5 (feet NAVD Delta 10-year (feet West Colonial Parkway S Charter Oak Road Van Buren Drive and S Gladstone Arch Concord Bridge Road Cul-de-sac Silina Drive and Palace Green Boulevard Woodlake Road and Mill Stream Road Rosemont Road Shenandoah Court Windsor Woods Boulevard and Great Meadows Court Old Forge Road and Red Lion Road Water Oak Road near Woodlake Road Presidential Boulevard near Gladstone Drive Old Forge Road and Old Post Road Red Lion Road and Concord Bridge Road Kings Point Road and Rosemont Road Old Forge Road and Old Forge Court G Presidential Boulevard and Windsor Woods Elementary Entrance Gladstone Drive and S Gladstone Drive Piney Ridge Road and Windsor Gate Place Hillridge Court Waterside Court West Colonial Parkway and Parkway Court Old Forge Court Brentwood Crescent and Kerswick Court Kings Point Court South Plaza Trail and Windsor Woods Canal PAP-88 Rosemont Road Silina Drive and Cumberland Parkway South Plaza Trail and Fire Station Silina Drive and William Penn Boulevard Rosemont Road Red Lion Road Cul-de-sac Old Mill Court Kings Point Road and Loyalist Court N Donnawood Court C-16
191 Appendix C Table C-3 10-year Alternative 5 Model Node Location Estimated Crown (feet NAVD 10-year Alternative 5 (feet NAVD Delta 10-year (feet Old Forge Road and Stonewall Court Windsor Gate Place and South Plaza Trail Water Oak Road and Brookside Lane J9385 Brentwood Crescent and Mintwood Court Rosemont Road and Kingdom Court SE Silina Drive and Presidential Boulevard Charter Oak Road Cul-de-sac Windsor Gate Road and Turtle Cove Road N Teakwood Drive and Rocky Mount Road Courtland Lane South Plaza Trail and Silina Drive N Donnawood Drive and South Plaza Trail Windsor Gate Road and Turtle Cove Road S Piney Ridge Road and Hillridge Court Rosemont Road and Kingdom Court NE Liberty Ridge Road Cul-de-sac South Boulevard and Silina Drive Pine Hill Road J16515 Old Forge Circle Rosemont Road and Old Forge Road Colonial Parkway and Palace Green Boulevard Presidential Boulevard and Van Buren Drive Kingdom Court S Gladstone Drive and S Gladstone Arch Presidential Boulevard and Donnawood Drive Presidential Boulevard and South Plaza Trail South Plaza Trail and Plaza Trail Court Mill Stream Road Rosemont Road and Silina Drive Windsor Gate Road near South Plaza Trail Presidential Boulevard and Starlighter Drive Parkwood Court Brentwood Circle Rosemont Road and Drivers World Way Palace Green Boulevard and Gateway Place J9405 Brentwood Crescent C-17
192 Appendix C Table C-3 10-year Alternative 5 Model Node Location Estimated Crown (feet NAVD 10-year Alternative 5 (feet NAVD Delta 10-year (feet Windsor Gate Road and Old Post Road Windsor Gate Place near South Plaza Trail Windsor Woods Boulevard and Green Springs Court West Colonial Parkway N Presidential Boulevard Cul-de-sac Brentwood Court Drivers World Way Rosemont Road near Victoria Drive Sentara Way South Plaza Trail and Water Oak Lane Old Forge Road and Parkwood Court Rosemont Road William Penn Boulevard and Palace Green Boulevard Presidential Boulevard and Colonial Parkway A Sentara Way Kings Point Arch Cul-de-sac Bentley Gate Way J14082 Brentwood Crescent and Brentwood Court Rosemont Road and Sentara Way J6433 Loyalist Court Brentwood Crescent and Brentwood Circle J15283 Cumberland Parkway and Chancellor Drive Spruce Circle Cul-de-sac Sentara Way and Drivers World Way Piney Ridge Court Old Forge Road and Maplewood Court South Plaza Trail and Rosemont Road South Plaza Trail and Windsor Oaks Boulevard Old Forge Road Old Forge Road Old Forge Road and Windsor Castle Court C-18
193 Appendix C Table C-4 10-year Alternative with 15 Feet Sea Level Rise Table C-4 10-year Alternative 5 with 15 Feet Sea Level Rise Model Node Location Windsor Woods Boulevard and Windsor Woods Court South Boulevard and Brentwood Crescent South Boulevard and Palace Green Boulevard NW Silina Drive and Windsor Woods Boulevard Estimated Crown (feet NAVD 10-year Alternative feet SLR (feet NAVD Delta 10-year (feet Old Forge Road and Grist Mill Road Palace Green Boulevard and Starlighter Drive Presidential Boulevard and Gresham Court Presidential Boulevard and Kings Point Road Presidential Boulevard and Teakwood Drive Old Forge Road and S Kings Point Road Presidential Boulevard and Gladstone Drive South Boulevard and Palace Green Boulevard NE Woodlake Road and Woodlake Court Kings Point Road near Kings Point Court Presidential Boulevard and Old Forge Road Kings Point Road and Kings Point Arch W Kings Point Road and Kings Point Arch E Concord Bridge Road and Grist Mill Road S Kings Point Road and Kings Point Road Windsor Gate Circle William Penn Boulevard Brentwood Crescent and Cortland Lane PAP-87 Rosemont Road N Donnawood Drive and Appalachian Court C-19
194 Appendix C Table C-4 10-year Alternative with 15 Feet Sea Level Rise Model Node Location South Boulevard and Palace Green Boulevard SE Estimated Crown (feet NAVD 10-year Alternative feet SLR (feet NAVD Delta 10-year (feet West Colonial Parkway and Silina Drive Old Forge Road and South Plaza Trail S West Colonial Parkway and Windsor Woods Boulevard Old Forge Road and S Gladstone Drive Old Forge Road and South Plaza Trail Palace Green Boulevard and South Plaza Trail Liberty Ridge Road West Colonial Parkway S Charter Oak Road Van Buren Drive and S Gladstone Arch Concord Bridge Road Cul-de-sac Silina Drive and Palace Green Boulevard Woodlake Road and Mill Stream Road Rosemont Road Shenandoah Court Windsor Woods Boulevard and Great Meadows Court Old Forge Road and Red Lion Road Water Oak Road near Woodlake Road Presidential Boulevard near Gladstone Drive Old Forge Road and Old Post Road Red Lion Road and Concord Bridge Road Kings Point Road and Rosemont Road Old Forge Road and Old Forge Court G Presidential Boulevard and Windsor Woods Elementary Entrance Gladstone Drive and S Gladstone Drive Piney Ridge Road and Windsor Gate Place Hillridge Court Waterside Court C-20
195 Appendix C Table C-4 10-year Alternative with 15 Feet Sea Level Rise Model Node Location West Colonial Parkway and Parkway Court Estimated Crown (feet NAVD 10-year Alternative feet SLR (feet NAVD Delta 10-year (feet Old Forge Court Brentwood Crescent and Kerswick Court Kings Point Court South Plaza Trail and Windsor Woods Canal PAP-88 Rosemont Road Silina Drive and Cumberland Parkway South Plaza Trail and Fire Station Silina Drive and William Penn Boulevard Rosemont Road Red Lion Road Cul-de-sac Old Mill Court Kings Point Road and Loyalist Court N Donnawood Court Old Forge Road and Stonewall Court Windsor Gate Place and South Plaza Trail Water Oak Road and Brookside Lane J9385 Brentwood Crescent and Mintwood Court Rosemont Road and Kingdom Court SE Silina Drive and Presidential Boulevard Charter Oak Road Cul-de-sac Windsor Gate Road and Turtle Cove Road N Teakwood Drive and Rocky Mount Road Courtland Lane South Plaza Trail and Silina Drive N Donnawood Drive and South Plaza Trail Windsor Gate Road and Turtle Cove Road S Piney Ridge Road and Hillridge Court Rosemont Road and Kingdom Court NE Liberty Ridge Road Cul-de-sac C-21
196 Appendix C Table C-4 10-year Alternative with 15 Feet Sea Level Rise Model Node Location Estimated Crown (feet NAVD 10-year Alternative feet SLR (feet NAVD Delta 10-year (feet South Boulevard and Silina Drive Pine Hill Road J16515 Old Forge Circle Rosemont Road and Old Forge Road Colonial Parkway and Palace Green Boulevard Presidential Boulevard and Van Buren Drive Kingdom Court S Gladstone Drive and S Gladstone Arch Presidential Boulevard and Donnawood Drive Presidential Boulevard and South Plaza Trail South Plaza Trail and Plaza Trail Court Mill Stream Road Rosemont Road and Silina Drive Windsor Gate Road near South Plaza Trail Presidential Boulevard and Starlighter Drive Parkwood Court Brentwood Circle Rosemont Road and Drivers World Way Palace Green Boulevard and Gateway Place J9405 Brentwood Crescent Windsor Gate Road and Old Post Road Windsor Gate Place near South Plaza Trail Windsor Woods Boulevard and Green Springs Court West Colonial Parkway N Presidential Boulevard Cul-de-sac Brentwood Court Drivers World Way Rosemont Road near Victoria Drive Sentara Way C-22
197 Appendix C Table C-4 10-year Alternative with 15 Feet Sea Level Rise Model Node Location Estimated Crown (feet NAVD 10-year Alternative feet SLR (feet NAVD Delta 10-year (feet South Plaza Trail and Water Oak Lane Old Forge Road and Parkwood Court Rosemont Road William Penn Boulevard and Palace Green Boulevard Presidential Boulevard and Colonial Parkway A Sentara Way Kings Point Arch Cul-de-sac Bentley Gate Way J14082 Brentwood Crescent and Brentwood Court Rosemont Road and Sentara Way J6433 Loyalist Court J15283 Brentwood Crescent and Brentwood Circle Cumberland Parkway and Chancellor Drive Spruce Circle Cul-de-sac Sentara Way and Drivers World Way Piney Ridge Court Old Forge Road and Maplewood Court South Plaza Trail and Rosemont Road South Plaza Trail and Windsor Oaks Boulevard Old Forge Road Old Forge Road Old Forge Road and Windsor Castle Court C-23
198 Appendix C Table C-4 10-year Alternative with 15 Feet Sea Level Rise This page intentionally left blank C-24
199 Appendix C Table C-5 10-year Alternative 5 with 30 Feet Sea Level Rise Table C-5 10-year Alternative 5 with 30 Feet Sea Level Rise Model Node Location Windsor Woods Boulevard and Windsor Woods Court Estimated Crown (feet NAVD 10-year Alternative feet SLR (feet NAVD Delta 10-year (feet South Boulevard and Brentwood Crescent South Boulevard and Palace Green Boulevard NW Silina Drive and Windsor Woods Boulevard Old Forge Road and Grist Mill Road Palace Green Boulevard and Starlighter Drive Presidential Boulevard and Gresham Court Presidential Boulevard and Kings Point Road Presidential Boulevard and Teakwood Drive Old Forge Road and S Kings Point Road Presidential Boulevard and Gladstone Drive South Boulevard and Palace Green Boulevard NE Woodlake Road and Woodlake Court Kings Point Road near Kings Point Court Presidential Boulevard and Old Forge Road Kings Point Road and Kings Point Arch W Kings Point Road and Kings Point Arch E Concord Bridge Road and Grist Mill Road S Kings Point Road and Kings Point Road Windsor Gate Circle William Penn Boulevard Brentwood Crescent and Cortland Lane PAP-87 Rosemont Road N Donnawood Drive and Appalachian Court South Boulevard and Palace Green Boulevard SE West Colonial Parkway and Silina Drive Old Forge Road and South Plaza Trail S West Colonial Parkway and Windsor Woods Boulevard Old Forge Road and S Gladstone Drive C-25
200 Appendix C Table C-5 10-year Alternative 5 with 30 Feet Sea Level Rise Model Node Location Estimated Crown (feet NAVD 10-year Alternative feet SLR (feet NAVD Delta 10-year (feet Old Forge Road and South Plaza Trail Palace Green Boulevard and South Plaza Trail Liberty Ridge Road West Colonial Parkway S Charter Oak Road Van Buren Drive and S Gladstone Arch Concord Bridge Road Cul-de-sac Silina Drive and Palace Green Boulevard Woodlake Road and Mill Stream Road Rosemont Road Shenandoah Court Windsor Woods Boulevard and Great Meadows Court Old Forge Road and Red Lion Road Water Oak Road near Woodlake Road Presidential Boulevard near Gladstone Drive Old Forge Road and Old Post Road Red Lion Road and Concord Bridge Road Kings Point Road and Rosemont Road Old Forge Road and Old Forge Court G Presidential Boulevard and Windsor Woods Elementary Entrance Gladstone Drive and S Gladstone Drive Piney Ridge Road and Windsor Gate Place Hillridge Court Waterside Court West Colonial Parkway and Parkway Court Old Forge Court Brentwood Crescent and Kerswick Court Kings Point Court South Plaza Trail and Windsor Woods Canal PAP-88 Rosemont Road Silina Drive and Cumberland Parkway South Plaza Trail and Fire Station Silina Drive and William Penn Boulevard C-26
201 Appendix C Table C-5 10-year Alternative 5 with 30 Feet Sea Level Rise Model Node Location Estimated Crown (feet NAVD 10-year Alternative feet SLR (feet NAVD Delta 10-year (feet Rosemont Road Red Lion Road Cul-de-sac Old Mill Court Kings Point Road and Loyalist Court N Donnawood Court Old Forge Road and Stonewall Court Windsor Gate Place and South Plaza Trail Water Oak Road and Brookside Lane J9385 Brentwood Crescent and Mintwood Court Rosemont Road and Kingdom Court SE Silina Drive and Presidential Boulevard Charter Oak Road Cul-de-sac Windsor Gate Road and Turtle Cove Road N Teakwood Drive and Rocky Mount Road Courtland Lane South Plaza Trail and Silina Drive N Donnawood Drive and South Plaza Trail Windsor Gate Road and Turtle Cove Road S Piney Ridge Road and Hillridge Court Rosemont Road and Kingdom Court NE Liberty Ridge Road Cul-de-sac South Boulevard and Silina Drive Pine Hill Road J16515 Old Forge Circle Rosemont Road and Old Forge Road Colonial Parkway and Palace Green Boulevard Presidential Boulevard and Van Buren Drive Kingdom Court S Gladstone Drive and S Gladstone Arch Presidential Boulevard and Donnawood Drive Presidential Boulevard and South Plaza Trail South Plaza Trail and Plaza Trail Court C-27
202 Appendix C Table C-5 10-year Alternative 5 with 30 Feet Sea Level Rise Model Node Location Estimated Crown (feet NAVD 10-year Alternative feet SLR (feet NAVD Delta 10-year (feet Mill Stream Road Rosemont Road and Silina Drive Windsor Gate Road near South Plaza Trail Presidential Boulevard and Starlighter Drive Parkwood Court Brentwood Circle Rosemont Road and Drivers World Way Palace Green Boulevard and Gateway Place J9405 Brentwood Crescent Windsor Gate Road and Old Post Road Windsor Gate Place near South Plaza Trail Windsor Woods Boulevard and Green Springs Court West Colonial Parkway N Presidential Boulevard Cul-de-sac Brentwood Court Drivers World Way Rosemont Road near Victoria Drive Sentara Way South Plaza Trail and Water Oak Lane Old Forge Road and Parkwood Court Rosemont Road William Penn Boulevard and Palace Green Boulevard Presidential Boulevard and Colonial Parkway A Sentara Way Kings Point Arch Cul-de-sac Bentley Gate Way J14082 Brentwood Crescent and Brentwood Court Rosemont Road and Sentara Way J6433 Loyalist Court Brentwood Crescent and Brentwood Circle J15283 Cumberland Parkway and Chancellor Drive Spruce Circle Cul-de-sac Sentara Way and Drivers World Way C-28
203 Appendix C Table C-5 10-year Alternative 5 with 30 Feet Sea Level Rise Model Node Location Estimated Crown (feet NAVD 10-year Alternative feet SLR (feet NAVD Delta 10-year (feet Piney Ridge Court Old Forge Road and Maplewood Court South Plaza Trail and Rosemont Road South Plaza Trail and Windsor Oaks Boulevard Old Forge Road Old Forge Road Old Forge Road and Windsor Castle Court C-29
204 Appendix C Table C-5 10-year Alternative 5 with 30 Feet Sea Level Rise This page intentionally left blank C-30
205 Appendix C Table C-6 Existing Conditions Table C-6 Existing Conditions Model Node Location Windsor Woods Boulevard and Windsor Woods Court South Boulevard and Brentwood Crescent South Boulevard and Palace Green Boulevard NW Silina Drive and Windsor Woods Boulevard Estimated Crown (feet NAVD 2-year Existing (feet NAVD 50-year Existing (feet NAVD 100-year Existing (feet NAVD Old Forge Road and Grist Mill Road Palace Green Boulevard and Starlighter Drive Presidential Boulevard and Gresham Court Presidential Boulevard and Kings Point Road Presidential Boulevard and Teakwood Drive Old Forge Road and S Kings Point Road Presidential Boulevard and Gladstone Drive South Boulevard and Palace Green Boulevard NE Woodlake Road and Woodlake Court Kings Point Road near Kings Point Court Presidential Boulevard and Old Forge Road Kings Point Road and Kings Point Arch W Kings Point Road and Kings Point Arch E Concord Bridge Road and Grist Mill Road S Kings Point Road and Kings Point Road Windsor Gate Circle William Penn Boulevard Brentwood Crescent and Cortland Lane PAP-87 Rosemont Road C-31
206 Appendix C Table C-6 Existing Conditions Model Node Location N Donnawood Drive and Appalachian Court South Boulevard and Palace Green Boulevard SE West Colonial Parkway and Silina Drive Old Forge Road and South Plaza Trail S West Colonial Parkway and Windsor Woods Boulevard Old Forge Road and S Gladstone Drive Old Forge Road and South Plaza Trail Palace Green Boulevard and South Plaza Trail Estimated Crown (feet NAVD 2-year Existing (feet NAVD 50-year Existing (feet NAVD 100-year Existing (feet NAVD Liberty Ridge Road West Colonial Parkway S Charter Oak Road Van Buren Drive and S Gladstone Arch Concord Bridge Road Cul-de-sac Silina Drive and Palace Green Boulevard Woodlake Road and Mill Stream Road Rosemont Road Shenandoah Court Windsor Woods Boulevard and Great Meadows Court Old Forge Road and Red Lion Road Water Oak Road near Woodlake Road Presidential Boulevard near Gladstone Drive Old Forge Road and Old Post Road Red Lion Road and Concord Bridge Road Kings Point Road and Rosemont Road Old Forge Road and Old Forge Court C-32
207 Appendix C Table C-6 Existing Conditions Model Node G Location Presidential Boulevard and Windsor Woods Elementary Entrance Gladstone Drive and S Gladstone Drive Piney Ridge Road and Windsor Gate Place Estimated Crown (feet NAVD 2-year Existing (feet NAVD 50-year Existing (feet NAVD 100-year Existing (feet NAVD Hillridge Court Waterside Court West Colonial Parkway and Parkway Court Old Forge Court Brentwood Crescent and Kerswick Court Kings Point Court South Plaza Trail and Windsor Woods Canal PAP-88 Rosemont Road Silina Drive and Cumberland Parkway South Plaza Trail and Fire Station Silina Drive and William Penn Boulevard Rosemont Road Red Lion Road Cul-de-sac Old Mill Court Kings Point Road and Loyalist Court N Donnawood Court J Old Forge Road and Stonewall Court Windsor Gate Place and South Plaza Trail Water Oak Road and Brookside Lane Brentwood Crescent and Mintwood Court Rosemont Road and Kingdom Court SE Silina Drive and Presidential Boulevard Charter Oak Road Cul-de-sac C-33
208 Appendix C Table C-6 Existing Conditions Model Node Location Windsor Gate Road and Turtle Cove Road N Teakwood Drive and Rocky Mount Road Estimated Crown (feet NAVD 2-year Existing (feet NAVD 50-year Existing (feet NAVD 100-year Existing (feet NAVD Courtland Lane South Plaza Trail and Silina Drive N Donnawood Drive and South Plaza Trail Windsor Gate Road and Turtle Cove Road S Piney Ridge Road and Hillridge Court Rosemont Road and Kingdom Court NE Liberty Ridge Road Cul-de-sac South Boulevard and Silina Drive Pine Hill Road J16515 Old Forge Circle Rosemont Road and Old Forge Road Colonial Parkway and Palace Green Boulevard Presidential Boulevard and Van Buren Drive Kingdom Court S Gladstone Drive and S Gladstone Arch Presidential Boulevard and Donnawood Drive Presidential Boulevard and South Plaza Trail South Plaza Trail and Plaza Trail Court Mill Stream Road Rosemont Road and Silina Drive Windsor Gate Road near South Plaza Trail Presidential Boulevard and Starlighter Drive Parkwood Court Brentwood Circle C-34
209 Appendix C Table C-6 Existing Conditions Model Node Location Rosemont Road and Drivers World Way Palace Green Boulevard and Gateway Place Estimated Crown (feet NAVD 2-year Existing (feet NAVD 50-year Existing (feet NAVD 100-year Existing (feet NAVD J9405 Brentwood Crescent Windsor Gate Road and Old Post Road Windsor Gate Place near South Plaza Trail Windsor Woods Boulevard and Green Springs Court West Colonial Parkway N Presidential Boulevard Cul-de-sac Brentwood Court Drivers World Way Rosemont Road near Victoria Drive Sentara Way South Plaza Trail and Water Oak Lane Old Forge Road and Parkwood Court Rosemont Road William Penn Boulevard and Palace Green Boulevard Presidential Boulevard and Colonial Parkway A Sentara Way Kings Point Arch Cul-de-sac Bentley Gate Way J14082 Brentwood Crescent and Brentwood Court Rosemont Road and Sentara Way J6433 Loyalist Court J15283 Brentwood Crescent and Brentwood Circle Cumberland Parkway and Chancellor Drive Spruce Circle Cul-de-sac Sentara Way and Drivers World Way Piney Ridge Court C-35
210 Appendix C Table C-6 Existing Conditions Model Node Location Old Forge Road and Maplewood Court South Plaza Trail and Rosemont Road South Plaza Trail and Windsor Oaks Boulevard Estimated Crown (feet NAVD 2-year Existing (feet NAVD 50-year Existing (feet NAVD 100-year Existing (feet NAVD Old Forge Road Old Forge Road Old Forge Road and Windsor Castle Court C-36
211 Appendix C Table C-7 Existing Conditions with 15 Feet Sea Level Rise Table C-7 Existing Conditions with 15 Feet Sea Level Rise Model Node Location Windsor Woods Boulevard and Windsor Woods Court South Boulevard and Brentwood Crescent South Boulevard and Palace Green Boulevard NW Silina Drive and Windsor Woods Boulevard Old Forge Road and Grist Mill Road Palace Green Boulevard and Starlighter Drive Presidential Boulevard and Gresham Court Presidential Boulevard and Kings Point Road Presidential Boulevard and Teakwood Drive Old Forge Road and S Kings Point Road Presidential Boulevard and Gladstone Drive South Boulevard and Palace Green Boulevard NE Woodlake Road and Woodlake Court Kings Point Road near Kings Point Court Presidential Boulevard and Old Forge Road Kings Point Road and Kings Point Arch W Kings Point Road and Kings Point Arch E Concord Bridge Road and Grist Mill Road S Kings Point Road and Kings Point Road Estimated Crown (feet NAVD 2-year Existing +15 feet SLR (feet NAVD 50-year Existing +15 feet SLR (feet NAVD 100-year Existing +15 feet SLR (feet NAVD Windsor Gate Circle William Penn Boulevard Brentwood Crescent and Cortland Lane C-37
212 Appendix C Table C-7 Existing Conditions with 15 Feet Sea Level Rise Model Node Location Estimated Crown (feet NAVD 2-year Existing +15 feet SLR (feet NAVD 50-year Existing +15 feet SLR (feet NAVD 100-year Existing +15 feet SLR (feet NAVD PAP-87 Rosemont Road N Donnawood Drive and Appalachian Court South Boulevard and Palace Green Boulevard SE West Colonial Parkway and Silina Drive Old Forge Road and South Plaza Trail S West Colonial Parkway and Windsor Woods Boulevard Old Forge Road and S Gladstone Drive Old Forge Road and South Plaza Trail Palace Green Boulevard and South Plaza Trail Liberty Ridge Road West Colonial Parkway S Charter Oak Road Van Buren Drive and S Gladstone Arch Concord Bridge Road Cul-de-sac Silina Drive and Palace Green Boulevard Woodlake Road and Mill Stream Road Rosemont Road Shenandoah Court Windsor Woods Boulevard and Great Meadows Court Old Forge Road and Red Lion Road Water Oak Road near Woodlake Road Presidential Boulevard near Gladstone Drive Old Forge Road and Old Post Road Red Lion Road and Concord Bridge Road Kings Point Road and Rosemont Road C-38
213 Appendix C Table C-7 Existing Conditions with 15 Feet Sea Level Rise Model Node G Location Old Forge Road and Old Forge Court Presidential Boulevard and Windsor Woods Elementary Entrance Gladstone Drive and S Gladstone Drive Piney Ridge Road and Windsor Gate Place Estimated Crown (feet NAVD 2-year Existing +15 feet SLR (feet NAVD 50-year Existing +15 feet SLR (feet NAVD 100-year Existing +15 feet SLR (feet NAVD Hillridge Court Waterside Court West Colonial Parkway and Parkway Court Old Forge Court Brentwood Crescent and Kerswick Court Kings Point Court South Plaza Trail and Windsor Woods Canal PAP-88 Rosemont Road Silina Drive and Cumberland Parkway South Plaza Trail and Fire Station Silina Drive and William Penn Boulevard Rosemont Road Red Lion Road Cul-de-sac Old Mill Court Kings Point Road and Loyalist Court N Donnawood Court J Old Forge Road and Stonewall Court Windsor Gate Place and South Plaza Trail Water Oak Road and Brookside Lane Brentwood Crescent and Mintwood Court Rosemont Road and Kingdom Court SE C-39
214 Appendix C Table C-7 Existing Conditions with 15 Feet Sea Level Rise Model Node Location Silina Drive and Presidential Boulevard Estimated Crown (feet NAVD 2-year Existing +15 feet SLR (feet NAVD 50-year Existing +15 feet SLR (feet NAVD 100-year Existing +15 feet SLR (feet NAVD Charter Oak Road Cul-de-sac Windsor Gate Road and Turtle Cove Road N Teakwood Drive and Rocky Mount Road Courtland Lane South Plaza Trail and Silina Drive N Donnawood Drive and South Plaza Trail Windsor Gate Road and Turtle Cove Road S Piney Ridge Road and Hillridge Court Rosemont Road and Kingdom Court NE Liberty Ridge Road Cul-de-sac South Boulevard and Silina Drive Pine Hill Road J16515 Old Forge Circle Rosemont Road and Old Forge Road Colonial Parkway and Palace Green Boulevard Presidential Boulevard and Van Buren Drive Kingdom Court S Gladstone Drive and S Gladstone Arch Presidential Boulevard and Donnawood Drive Presidential Boulevard and South Plaza Trail South Plaza Trail and Plaza Trail Court Mill Stream Road Rosemont Road and Silina Drive Windsor Gate Road near South Plaza Trail Presidential Boulevard and Starlighter Drive C-40
215 Appendix C Table C-7 Existing Conditions with 15 Feet Sea Level Rise Model Node Location Estimated Crown (feet NAVD 2-year Existing +15 feet SLR (feet NAVD 50-year Existing +15 feet SLR (feet NAVD 100-year Existing +15 feet SLR (feet NAVD Parkwood Court Brentwood Circle Rosemont Road and Drivers World Way Palace Green Boulevard and Gateway Place J9405 Brentwood Crescent Windsor Gate Road and Old Post Road Windsor Gate Place near South Plaza Trail Windsor Woods Boulevard and Green Springs Court West Colonial Parkway N Presidential Boulevard Cul-de-sac Brentwood Court Drivers World Way Rosemont Road near Victoria Drive Sentara Way South Plaza Trail and Water Oak Lane Old Forge Road and Parkwood Court Rosemont Road A William Penn Boulevard and Palace Green Boulevard Presidential Boulevard and Colonial Parkway Sentara Way Kings Point Arch Cul-de-sac Bentley Gate Way J14082 Brentwood Crescent and Brentwood Court Rosemont Road and Sentara Way J6433 Loyalist Court J15283 Brentwood Crescent and Brentwood Circle Cumberland Parkway and Chancellor Drive C-41
216 Appendix C Table C-7 Existing Conditions with 15 Feet Sea Level Rise Model Node Location Estimated Crown (feet NAVD 2-year Existing +15 feet SLR (feet NAVD 50-year Existing +15 feet SLR (feet NAVD 100-year Existing +15 feet SLR (feet NAVD Spruce Circle Cul-de-sac Sentara Way and Drivers World Way Piney Ridge Court Old Forge Road and Maplewood Court South Plaza Trail and Rosemont Road South Plaza Trail and Windsor Oaks Boulevard Old Forge Road Old Forge Road Old Forge Road and Windsor Castle Court C-42
217 Appendix C Table C-8 Alternative 5 Table C-8 Alternative 5 Model Node Location Windsor Woods Boulevard and Windsor Woods Court South Boulevard and Brentwood Crescent South Boulevard and Palace Green Boulevard NW Silina Drive and Windsor Woods Boulevard Old Forge Road and Grist Mill Road Palace Green Boulevard and Starlighter Drive Presidential Boulevard and Gresham Court Presidential Boulevard and Kings Point Road Presidential Boulevard and Teakwood Drive Old Forge Road and S Kings Point Road Presidential Boulevard and Gladstone Drive South Boulevard and Palace Green Boulevard NE Woodlake Road and Woodlake Court Kings Point Road near Kings Point Court Presidential Boulevard and Old Forge Road Kings Point Road and Kings Point Arch W Kings Point Road and Kings Point Arch E Concord Bridge Road and Grist Mill Road S Kings Point Road and Kings Point Road Estimated Crown (feet NAVD 2-year Alternative 5 (feet NAVD 50-year Alternative 5 (feet NAVD 100-year Alternative 5 (feet NAVD Windsor Gate Circle William Penn Boulevard Brentwood Crescent and Cortland Lane PAP-87 Rosemont Road C-43
218 Appendix C Table C-8 Alternative 5 Model Node Location N Donnawood Drive and Appalachian Court South Boulevard and Palace Green Boulevard SE West Colonial Parkway and Silina Drive Old Forge Road and South Plaza Trail S West Colonial Parkway and Windsor Woods Boulevard Old Forge Road and S Gladstone Drive Old Forge Road and South Plaza Trail Palace Green Boulevard and South Plaza Trail Estimated Crown (feet NAVD 2-year Alternative 5 (feet NAVD 50-year Alternative 5 (feet NAVD 100-year Alternative 5 (feet NAVD Liberty Ridge Road West Colonial Parkway S Charter Oak Road Van Buren Drive and S Gladstone Arch Concord Bridge Road Cul-de-sac Silina Drive and Palace Green Boulevard Woodlake Road and Mill Stream Road Rosemont Road Shenandoah Court Windsor Woods Boulevard and Great Meadows Court Old Forge Road and Red Lion Road Water Oak Road near Woodlake Road Presidential Boulevard near Gladstone Drive Old Forge Road and Old Post Road Red Lion Road and Concord Bridge Road Kings Point Road and Rosemont Road C-44
219 Appendix C Table C-8 Alternative 5 Model Node G Location Old Forge Road and Old Forge Court Presidential Boulevard and Windsor Woods Elementary Entrance Gladstone Drive and S Gladstone Drive Piney Ridge Road and Windsor Gate Place Estimated Crown (feet NAVD 2-year Alternative 5 (feet NAVD 50-year Alternative 5 (feet NAVD 100-year Alternative 5 (feet NAVD Hillridge Court Waterside Court West Colonial Parkway and Parkway Court Old Forge Court Brentwood Crescent and Kerswick Court Kings Point Court South Plaza Trail and Windsor Woods Canal PAP-88 Rosemont Road Silina Drive and Cumberland Parkway South Plaza Trail and Fire Station Silina Drive and William Penn Boulevard Rosemont Road Red Lion Road Cul-de-sac Old Mill Court Kings Point Road and Loyalist Court N Donnawood Court J Old Forge Road and Stonewall Court Windsor Gate Place and South Plaza Trail Water Oak Road and Brookside Lane Brentwood Crescent and Mintwood Court Rosemont Road and Kingdom Court SE Silina Drive and Presidential Boulevard C-45
220 Appendix C Table C-8 Alternative 5 Model Node Location Estimated Crown (feet NAVD 2-year Alternative 5 (feet NAVD 50-year Alternative 5 (feet NAVD 100-year Alternative 5 (feet NAVD Charter Oak Road Cul-de-sac Windsor Gate Road and Turtle Cove Road N Teakwood Drive and Rocky Mount Road Courtland Lane South Plaza Trail and Silina Drive N Donnawood Drive and South Plaza Trail Windsor Gate Road and Turtle Cove Road S Piney Ridge Road and Hillridge Court Rosemont Road and Kingdom Court NE Liberty Ridge Road Cul-de-sac South Boulevard and Silina Drive Pine Hill Road J16515 Old Forge Circle Rosemont Road and Old Forge Road Colonial Parkway and Palace Green Boulevard Presidential Boulevard and Van Buren Drive Kingdom Court S Gladstone Drive and S Gladstone Arch Presidential Boulevard and Donnawood Drive Presidential Boulevard and South Plaza Trail South Plaza Trail and Plaza Trail Court Mill Stream Road Rosemont Road and Silina Drive Windsor Gate Road near South Plaza Trail Presidential Boulevard and Starlighter Drive Parkwood Court Brentwood Circle C-46
221 Appendix C Table C-8 Alternative 5 Model Node Location Rosemont Road and Drivers World Way Palace Green Boulevard and Gateway Place Estimated Crown (feet NAVD 2-year Alternative 5 (feet NAVD 50-year Alternative 5 (feet NAVD 100-year Alternative 5 (feet NAVD J9405 Brentwood Crescent Windsor Gate Road and Old Post Road Windsor Gate Place near South Plaza Trail Windsor Woods Boulevard and Green Springs Court West Colonial Parkway N Presidential Boulevard Cul-desac Brentwood Court Drivers World Way Rosemont Road near Victoria Drive Sentara Way South Plaza Trail and Water Oak Lane Old Forge Road and Parkwood Court Rosemont Road William Penn Boulevard and Palace Green Boulevard Presidential Boulevard and Colonial Parkway A Sentara Way Kings Point Arch Cul-de-sac Bentley Gate Way J Brentwood Crescent and Brentwood Court Rosemont Road and Sentara Way J6433 Loyalist Court J15283 Brentwood Crescent and Brentwood Circle Cumberland Parkway and Chancellor Drive Spruce Circle Cul-de-sac C-47
222 Appendix C Table C-8 Alternative 5 Model Node Location Sentara Way and Drivers World Way Estimated Crown (feet NAVD 2-year Alternative 5 (feet NAVD 50-year Alternative 5 (feet NAVD 100-year Alternative 5 (feet NAVD Piney Ridge Court Old Forge Road and Maplewood Court South Plaza Trail and Rosemont Road South Plaza Trail and Windsor Oaks Boulevard Old Forge Road Old Forge Road Old Forge Road and Windsor Castle Court C-48
223 Appendix C Table C-9 Alternative 5 with 15 Feet Seal Level Rise Table C-9 Alternative 5 with 15 Feet Sea Level Rise Model Node Location Windsor Woods Boulevard and Windsor Woods Court Estimated Crown (feet NAVD 2-year Alternative feet SLR (feet NAVD 50-year Alternative feet SLR (feet NAVD 100-year Alternative feet SLR (feet NAVD 100-year Alternative 5 +3 feet SLR (feet NAVD South Boulevard and Brentwood Crescent South Boulevard and Palace Green Boulevard NW Silina Drive and Windsor Woods Boulevard Old Forge Road and Grist Mill Road Palace Green Boulevard and Starlighter Drive Presidential Boulevard and Gresham Court Presidential Boulevard and Kings Point Road Presidential Boulevard and Teakwood Drive Old Forge Road and S Kings Point Road Presidential Boulevard and Gladstone Drive South Boulevard and Palace Green Boulevard NE Woodlake Road and Woodlake Court Kings Point Road near Kings Point Court Presidential Boulevard and Old Forge Road Kings Point Road and Kings Point Arch W Kings Point Road and Kings Point Arch E Concord Bridge Road and Grist Mill Road S Kings Point Road and Kings Point Road Windsor Gate Circle William Penn Boulevard Brentwood Crescent and Cortland Lane C-49
224 Appendix C Table C-9 Alternative 5 with 15 Feet Seal Level Rise Model Node Location Estimated Crown (feet NAVD 2-year Alternative feet SLR (feet NAVD 50-year Alternative feet SLR (feet NAVD 100-year Alternative feet SLR (feet NAVD 100-year Alternative 5 +3 feet SLR (feet NAVD PAP-87 Rosemont Road N Donnawood Drive and Appalachian Court South Boulevard and Palace Green Boulevard SE West Colonial Parkway and Silina Drive Old Forge Road and South Plaza Trail S West Colonial Parkway and Windsor Woods Boulevard Old Forge Road and S Gladstone Drive Old Forge Road and South Plaza Trail Palace Green Boulevard and South Plaza Trail Liberty Ridge Road West Colonial Parkway S Charter Oak Road Van Buren Drive and S Gladstone Arch Concord Bridge Road Cul-de-sac Silina Drive and Palace Green Boulevard Woodlake Road and Mill Stream Road Rosemont Road Shenandoah Court Windsor Woods Boulevard and Great Meadows Court Old Forge Road and Red Lion Road Water Oak Road near Woodlake Road Presidential Boulevard near Gladstone Drive C-50
225 Appendix C Table C-9 Alternative 5 with 15 Feet Seal Level Rise Model Node Location Estimated Crown (feet NAVD 2-year Alternative feet SLR (feet NAVD 50-year Alternative feet SLR (feet NAVD 100-year Alternative feet SLR (feet NAVD 100-year Alternative 5 +3 feet SLR (feet NAVD Old Forge Road and Old Post Road Red Lion Road and Concord Bridge Road Kings Point Road and Rosemont Road Old Forge Road and Old Forge Court G Presidential Boulevard and Windsor Woods Elementary Entrance Gladstone Drive and S Gladstone Drive Piney Ridge Road and Windsor Gate Place Hillridge Court Waterside Court West Colonial Parkway and Parkway Court Old Forge Court Brentwood Crescent and Kerswick Court Kings Point Court South Plaza Trail and Windsor Woods Canal PAP-88 Rosemont Road Silina Drive and Cumberland Parkway South Plaza Trail and Fire Station Silina Drive and William Penn Boulevard Rosemont Road Red Lion Road Cul-de-sac Old Mill Court Kings Point Road and Loyalist Court N Donnawood Court Old Forge Road and Stonewall Court C-51
226 Appendix C Table C-9 Alternative 5 with 15 Feet Seal Level Rise Model Node Location Estimated Crown (feet NAVD 2-year Alternative feet SLR (feet NAVD 50-year Alternative feet SLR (feet NAVD 100-year Alternative feet SLR (feet NAVD 100-year Alternative 5 +3 feet SLR (feet NAVD Windsor Gate Place and South Plaza Trail Water Oak Road and Brookside Lane J9385 Brentwood Crescent and Mintwood Court Rosemont Road and Kingdom Court SE Silina Drive and Presidential Boulevard Charter Oak Road Cul-de-sac Windsor Gate Road and Turtle Cove Road N Teakwood Drive and Rocky Mount Road Courtland Lane South Plaza Trail and Silina Drive N Donnawood Drive and South Plaza Trail Windsor Gate Road and Turtle Cove Road S Piney Ridge Road and Hillridge Court Rosemont Road and Kingdom Court NE Liberty Ridge Road Cul-de-sac South Boulevard and Silina Drive Pine Hill Road J16515 Old Forge Circle Rosemont Road and Old Forge Road Colonial Parkway and Palace Green Boulevard Presidential Boulevard and Van Buren Drive Kingdom Court S Gladstone Drive and S Gladstone Arch Presidential Boulevard and Donnawood Drive C-52
227 Appendix C Table C-9 Alternative 5 with 15 Feet Seal Level Rise Model Node Location Estimated Crown (feet NAVD 2-year Alternative feet SLR (feet NAVD 50-year Alternative feet SLR (feet NAVD 100-year Alternative feet SLR (feet NAVD 100-year Alternative 5 +3 feet SLR (feet NAVD Presidential Boulevard and South Plaza Trail South Plaza Trail and Plaza Trail Court Mill Stream Road Rosemont Road and Silina Drive Windsor Gate Road near South Plaza Trail Presidential Boulevard and Starlighter Drive Parkwood Court Brentwood Circle Rosemont Road and Drivers World Way Palace Green Boulevard and Gateway Place J9405 Brentwood Crescent Windsor Gate Road and Old Post Road Windsor Gate Place near South Plaza Trail Windsor Woods Boulevard and Green Springs Court West Colonial Parkway N Presidential Boulevard Cul-de-sac Brentwood Court Drivers World Way Rosemont Road near Victoria Drive Sentara Way South Plaza Trail and Water Oak Lane Old Forge Road and Parkwood Court Rosemont Road C-53
228 Appendix C Table C-9 Alternative 5 with 15 Feet Seal Level Rise Model Node Location William Penn Boulevard and Palace Green Boulevard Estimated Crown (feet NAVD 2-year Alternative feet SLR (feet NAVD 50-year Alternative feet SLR (feet NAVD 100-year Alternative feet SLR (feet NAVD 100-year Alternative 5 +3 feet SLR (feet NAVD Presidential Boulevard and Colonial Parkway A Sentara Way Kings Point Arch Cul-de-sac Bentley Gate Way J14082 Brentwood Crescent and Brentwood Court Rosemont Road and Sentara Way J6433 Loyalist Court Brentwood Crescent and Brentwood Circle J15283 Cumberland Parkway and Chancellor Drive Spruce Circle Cul-de-sac Sentara Way and Drivers World Way Piney Ridge Court Old Forge Road and Maplewood Court South Plaza Trail and Rosemont Road South Plaza Trail and Windsor Oaks Boulevard Old Forge Road Old Forge Road Old Forge Road and Windsor Castle Court C-54
229 Appendix C Table C-10 Alternative 5 with Extreme Rainfall Event Table C-10 Alternative 5 with Extreme Rainfall Event Model Node Location Windsor Woods Boulevard and Windsor Woods Court Estimated Crown (feet NAVD Alternative 5 Matthew (feet NAVD Delta Alternative 5 Matthew (feet South Boulevard and Brentwood Crescent South Boulevard and Palace Green Boulevard NW Silina Drive and Windsor Woods Boulevard Old Forge Road and Grist Mill Road Palace Green Boulevard and Starlighter Drive Presidential Boulevard and Gresham Court Presidential Boulevard and Kings Point Road Presidential Boulevard and Teakwood Drive Old Forge Road and S Kings Point Road Presidential Boulevard and Gladstone Drive South Boulevard and Palace Green Boulevard NE Woodlake Road and Woodlake Court Kings Point Road near Kings Point Court Presidential Boulevard and Old Forge Road Kings Point Road and Kings Point Arch W Kings Point Road and Kings Point Arch E Concord Bridge Road and Grist Mill Road S Kings Point Road and Kings Point Road Windsor Gate Circle William Penn Boulevard Brentwood Crescent and Cortland Lane PAP-87 Rosemont Road N Donnawood Drive and Appalachian Court South Boulevard and Palace Green Boulevard SE West Colonial Parkway and Silina Drive Old Forge Road and South Plaza Trail S West Colonial Parkway and Windsor Woods Boulevard Old Forge Road and S Gladstone Drive C-55
230 Appendix C Table C-10 Alternative 5 with Extreme Rainfall Event Model Node Location Estimated Crown (feet NAVD Alternative 5 Matthew (feet NAVD Delta Alternative 5 Matthew (feet Old Forge Road and South Plaza Trail Palace Green Boulevard and South Plaza Trail Liberty Ridge Road West Colonial Parkway S Charter Oak Road Van Buren Drive and S Gladstone Arch Concord Bridge Road Cul-de-sac Silina Drive and Palace Green Boulevard Woodlake Road and Mill Stream Road Rosemont Road Shenandoah Court Windsor Woods Boulevard and Great Meadows Court Old Forge Road and Red Lion Road Water Oak Road near Woodlake Road Presidential Boulevard near Gladstone Drive Old Forge Road and Old Post Road Red Lion Road and Concord Bridge Road Kings Point Road and Rosemont Road Old Forge Road and Old Forge Court G Presidential Boulevard and Windsor Woods Elementary Entrance Gladstone Drive and S Gladstone Drive Piney Ridge Road and Windsor Gate Place Hillridge Court Waterside Court West Colonial Parkway and Parkway Court Old Forge Court Brentwood Crescent and Kerswick Court Kings Point Court South Plaza Trail and Windsor Woods Canal PAP-88 Rosemont Road Silina Drive and Cumberland Parkway South Plaza Trail and Fire Station Silina Drive and William Penn Boulevard C-56
231 Appendix C Table C-10 Alternative 5 with Extreme Rainfall Event Model Node Location Estimated Crown (feet NAVD Alternative 5 Matthew (feet NAVD Delta Alternative 5 Matthew (feet Rosemont Road Red Lion Road Cul-de-sac Old Mill Court Kings Point Road and Loyalist Court N Donnawood Court Old Forge Road and Stonewall Court Windsor Gate Place and South Plaza Trail Water Oak Road and Brookside Lane J9385 Brentwood Crescent and Mintwood Court Rosemont Road and Kingdom Court SE Silina Drive and Presidential Boulevard Charter Oak Road Cul-de-sac Windsor Gate Road and Turtle Cove Road N Teakwood Drive and Rocky Mount Road Courtland Lane South Plaza Trail and Silina Drive N Donnawood Drive and South Plaza Trail Windsor Gate Road and Turtle Cove Road S Piney Ridge Road and Hillridge Court Rosemont Road and Kingdom Court NE Liberty Ridge Road Cul-de-sac South Boulevard and Silina Drive Pine Hill Road J16515 Old Forge Circle Rosemont Road and Old Forge Road Colonial Parkway and Palace Green Boulevard Presidential Boulevard and Van Buren Drive Kingdom Court S Gladstone Drive and S Gladstone Arch Presidential Boulevard and Donnawood Drive Presidential Boulevard and South Plaza Trail South Plaza Trail and Plaza Trail Court C-57
232 Appendix C Table C-10 Alternative 5 with Extreme Rainfall Event Model Node Location Estimated Crown (feet NAVD Alternative 5 Matthew (feet NAVD Delta Alternative 5 Matthew (feet Mill Stream Road Rosemont Road and Silina Drive Windsor Gate Road near South Plaza Trail Presidential Boulevard and Starlighter Drive Parkwood Court Brentwood Circle Rosemont Road and Drivers World Way Palace Green Boulevard and Gateway Place J9405 Brentwood Crescent Windsor Gate Road and Old Post Road Windsor Gate Place near South Plaza Trail Windsor Woods Boulevard and Green Springs Court West Colonial Parkway N Presidential Boulevard Cul-de-sac Brentwood Court Drivers World Way Rosemont Road near Victoria Drive Sentara Way South Plaza Trail and Water Oak Lane Old Forge Road and Parkwood Court Rosemont Road William Penn Boulevard and Palace Green Boulevard Presidential Boulevard and Colonial Parkway A Sentara Way Kings Point Arch Cul-de-sac Bentley Gate Way J14082 Brentwood Crescent and Brentwood Court Rosemont Road and Sentara Way J6433 Loyalist Court Brentwood Crescent and Brentwood Circle J15283 Cumberland Parkway and Chancellor Drive Spruce Circle Cul-de-sac Sentara Way and Drivers World Way C-58
233 Appendix C Table C-10 Alternative 5 with Extreme Rainfall Event Model Node Location Estimated Crown (feet NAVD Alternative 5 Matthew (feet NAVD Delta Alternative 5 Matthew (feet Piney Ridge Court Old Forge Road and Maplewood Court South Plaza Trail and Rosemont Road South Plaza Trail and Windsor Oaks Boulevard Old Forge Road Old Forge Road Old Forge Road and Windsor Castle Court C-59
234 Appendix C Table C-10 Alternative 5 with Extreme Rainfall Event This page intentionally left blank C-60
235 Appendix D Planning-level Opinion of Probable Construction Costs D-1
236 Appendix D Planning-level Opinion of Probable Construction Costs This page intentionally left blank D-2
237 Table D-1 Winsdor Woods Stormwater Management System Flood Mitigation Plan Planning-Level Opinion of Probable Project Cost Item Alternative 5 Item Description Category Unit Unit Cost No Qty Total Cost 1 18 RCP, Class III Piping LF $ 80 3,051 $ 244, RCP, Class III Piping LF $ 99 3,704 $ 366, RCP, Class III Piping LF $ 121 7,177 $ 868, RCP, Class III Piping LF $ 162 2,611 $ 422, RCP, Class III Piping LF $ $ 65, RCP, Class III Piping LF $ 265 2,695 $ 714, RCP, Class III Piping LF $ $ 85, ' X 10' Box Culvert Culverts LF $ 1, $ 595, ' x 8' Box Culvert Culverts LF $ 1, $ 100, x 32 RECP Piping LF $ 260 2,031 $ 528, x 34 RECP Piping LF $ $ 223, x 38 RECP Piping LF $ 430 6,219 $ 2,672, x 43 RECP Piping LF $ 550 1,931 $ 1,062, x 58 RECP Piping LF $ $ 73, Dredge Existing Ditch Ditch CY $ 60 38,304 $ 2,298, Concrete Line Ditch Ditch SY $ 57 8,184 $ 466, Remove berm Excavation CY $ 60 12,200 $ 732, Pavement Demolition Pavement SY $ 16 25,430 $ 406, Select Material Pavement CY $ 36 8,477 $ 305, Aggregate Base Material No 21A Pavement TON $ 52 9,155 $ 476, Asphalt Concrete Base Course (Type BM-25 Pavement TON $ 115 4,196 $ 482, Asphalt Concrete (Type SM-95 Pavement TON $ 115 4,809 $ 553, Pump Station Pump Station LS $ 18,900,000 1 $ 18,900, Sluice Gate Control Structure LS $ 2,000,000 1 $ 2,000, Erosion and Sediment Control E&SC LS $ 751,000 1 $ 751, Maintenance of Traffic Miscellaneous LS $ 275,000 1 $ 275, Utility Relocation Miscellaneous LS $ 687,000 1 $ 687, Mill and Overlay Pavement SY $ ,538 $ 1,770, Water Quality Treatment Miscellaneous EA $ 40, $ 1,240, Replace Drop Inlets Piping EA $ 6, $ 852, Manholes Piping EA $ 13, $ 638,400 Subtotal Mobilization (10% Contingency (40% Engineering, Survey, & Permitting (15% Subtotal Cost, Today's dollars $ 40,855,661 $ 4,085,566 $ 17,976,491 $ 9,437,658 $ 72,355,376 Escalation to midpoint of construction (FY 26 based on inflation rate of 4% per year $ 26,667,952 Total Project Cost SAY $ 99,023,329 $ 99,000,000 Page 1 of 1
238
239 Appendix E Summary of Alternatives Evaluated E-1
240 Appendix E Summary of Alternatives Evaluated This page intentionally left blank E-2
241 Appendix E Summary of Alternatives Evaluated Table E-1 Summary of Alternatives Evaluated Alternative Description System Improvements 1 2 2A 3 4 4A Canal dredging and restoration to original design Implement Princess Anne Plaza Watershed Study recommendations (2014 I-264 ditch improvements and optimize Lake Windsor pump station Windsor Oaks Canal dredging Lake Windsor pump station and force main Windsor Woods Canal dredging (ie, Presidential Canal Fixed blocked outfalls, collapsed pipes at identified locations Lake Windsor pump station Gate structure Windsor Woods pipe improvements Same as ALT 2, plus: Set initial depth in Lake Windsor to 0 feet NAVD Same as ALT 2, plus: I-264 ditch capacity increased from Palace Green Boulevard to culvert under South Boulevard Increase Lake Windsor pump station capacity Set initial depth in Lake Windsor to 0 feet NAVD Expanded Windsor Woods pipe improvements Same as ALT 3, plus: Windsor Oaks Canal dredging Refined Windsor Woods pipe improvements Same as ALT 4, plus: Install 500 linear feet, 5-feet diameter force main to discharge from Lake Windsor pump station to Thalia Creek downstream (north of I-264 Refined Windsor Woods pipe improvements Pump Station Included 1 Performance Criteria Met Level-ofservice 2 Mitigate Adverse OffSite Impacts 3 No No Yes Yes Yes Yes, 400 cfs Yes, 300 cfs Yes Partially, but not entirely Partially, but not entirely Yes Partially, allowed for reduction in some pipe sizes Yes No No No No Partially; requires further alterations to Thalia Creek Comment Performance criteria not met Performance criteria not met Performance criteria not met Performance criteria not met Performance criteria not met Dropped from consideration due to constructability issues and dredging concerns downstream of I-264 E-3
242 Appendix E Summary of Alternatives Evaluated Alternative Description System Improvements Utilize Lake Trashmore storage; relocate pump station and gate structure to Thalia Creek Reduced Lake Windsor pump station capacity Reduce size of Windsor Woods pipe improvements Replace modified channel with existing channel between Lake Trashmore and Lake Windsor Set initial higher water surface elevation in Lakes Same as ALT 4, plus Relocate pump station and gate structure to Thalia Creek, connecting Lake Windsor to Lake Trashmore Channel improvements between Lake Trashmore and Lake Windsor 800 linear feet berm removed in Thalia Creek at entrance to Lake Windsor Set initial depth in Lake Trashmore to 0 feet NAVD Refined Windsor Woods pipe improvements Evaluate with future land use conditions Same as ALT 4, except: Reduce Lake Windsor pumps station capacity to 300 cfs to only resolve 100-year flooded structures LOS Same as ALT 4, except: Reduce diameter and size of Windsor Woods pipe improvements, where possible, to meet LOS Same as ALT 5, except: Remove channel improvements between Lake Trashmore and Lake Windsor to determine sensitivity of storage volume Same as ALT 5, except: Set initial depth in Lake Trashmore and Lake Windsor to 27 feet NAVD behind pump and gate structure, lessening available storage volume Pump Station Included 1 Yes, 900 cfs Yes, 300 cfs Yes, 300 cfs Yes, 625 cfs Yes, 625 cfs Performance Criteria Met Level-ofservice 2 Mitigate Adverse OffSite Impacts 3 Comment Yes Yes Selected alternative Partially, but not entirely Partially, but not entirely Partially, but not entirely Partially, but not entirely Yes Yes Yes Yes Performance criteria not met Performance criteria not met Performance criteria not met; storage volume and conveyance not adequate Performance criteria not met; storage volume not adequate E-4
243 Appendix E Summary of Alternatives Evaluated Alternative Description System Improvements Thalia Creek dredging downstream of I-264 Lake Windsor pump station and force main to Lynnhaven River Pump Station Included 1 Alternatives Considered but Not Evaluated Same as ALT 5, plus: Modify or dredge Thalia Creek downstream I-264 to allow higher flows from the Lake Windsor system Resulting Lake Windsor pump station expected to be smaller capacity Same as ALT 5, plus: Force main to terminate at a location where pumped discharge does not increase water surface elevations Approximately 1-mile long, large diameter force main would be required Force main routing options appear limited to along Thalia Creek, through mainly urban development Resulting Lake Windsor Pump Station expected to be smaller capacity Yes, < 900 cfs Yes, < 900 cfs Performance Criteria Met Level-ofservice 2 Not evaluated Not evaluated Mitigate Adverse OffSite Impacts 3 Not evaluated Not evaluated Comment Deemed not feasible and eliminated from further consideration due to risk and uncertainty associated with potential environmental permitting requirements, land acquisition, liability and legal exposure Deemed not feasible and eliminated from further consideration due to probable construction cost of large diameter force main and high horsepower pump station would be significantly higher than the cost of Alternative 5 Note: 1 Pump station capacity (cfs, cubic feet per second was sized to avoid downstream increases in water surface elevation 2 Level-of-service criteria must be met for both 10-year and 100-year design storms for the Windsor Woods study area (as defined in Section 41 of this report 3 Mitigate adverse offsite impacts is defined as modeled peak flood stages remaining the same (or lower at locations upstream and downstream of the proposed alternative (ie, outside of Windsor Woods for all design storms E-5
244 Appendix E Summary of Alternatives Evaluated This page intentionally left blank E-6
245


246
LOCATED IN INDIAN RIVER COUNTY PREPARED FOR S.J.R.W.M.D. AND F.W.C.D. DECEMBER, 2003 Updated 2007 Updated May 2014 PREPARED BY
 FELLSMERE WATER CONTROL DISTRICT EAST MASTER DRAINAGE PLAN AND STORMWATER HYDROLOGIC ANALYSIS OF THE GRAVITY DRAINAGE SYSTEM LOCATED BETWEEN THE EAST BOUNDARY, LATERAL U, THE MAIN CANAL, AND DITCH 24 LOCATED
Section 4: Model Development and Application
 Section 4: Model Development and Application The hydrologic model for the Wissahickon Act 167 study was built using GIS layers of land use, hydrologic soil groups, terrain and orthophotography. Within
Chapter 5 CALIBRATION AND VERIFICATION
 Chapter 5 CALIBRATION AND VERIFICATION This chapter contains the calibration procedure and data used for the LSC existing conditions model. The goal of the calibration effort was to develop a hydraulic
Stormwater Capacity Analysis for Westover Branch Watershed
 Stormwater Capacity Analysis for Westover Branch Watershed Pimmit Run Little Pimmit Run, Mainstem Stohman's Run Gulf Branch Pimmit Run Tributary Little Pimmit Run, W. Branch Little Pimmit Run, E. Branch
INFLOW DESIGN FLOOD CONTROL SYSTEM PLAN 40 C.F.R. PART PLANT YATES ASH POND 2 (AP-2) GEORGIA POWER COMPANY
 GEORGIA POWER COMPANY") INFLOW DESIGN FLOOD CONTROL SYSTEM PLAN 40 C.F.R. PART 257.82 PLANT YATES ASH POND 2 (AP-2) GEORGIA POWER COMPANY EPA s Disposal of Coal Combustion Residuals from Electric Utilities Final Rule (40 C.F.R.
INFLOW DESIGN FLOOD CONTROL SYSTEM PLAN 40 C.F.R. PART 257.82 PLANT YATES ASH POND 2 (AP-2) GEORGIA POWER COMPANY EPA s Disposal of Coal Combustion Residuals from Electric Utilities Final Rule (40 C.F.R.
Between 6 am to 4 pm the next day approximately 7.5 inches fell. Chesapeake Bay Bridge Tunnel NOAA Tide Gage
 Ocean Park Alternative Drainage Route Analysis February, 2012 November 11 14, 2009 Between 6 am to 4 pm the next day approximately 7.5 inches fell Chesapeake Bay Bridge Tunnel NOAA Tide Gage Hurricane
BUNCOMBE COUNTY NORTH CAROLINA
 PROJECT SITE ² 0 0. 75 1. 5 LOCATION MAP MARCH 2018 2. 25 3 Mil es AID: PROJECT # 2018-01122 18.05301 Sheet 1 of 7 Sources: Esri, HERE, DeLorme, USGS, Intermap, INCREMENT P, NRCan, Esri Japan, METI, Esri
A Cloud-Based Flood Warning System For Forecasting Impacts to Transportation Infrastructure Systems
 A Cloud-Based Flood Warning System For Forecasting Impacts to Transportation Infrastructure Systems Jon Goodall Associate Professor, Civil and Environmental Engineering Associate Director, Link Lab April
YELLOWSTONE RIVER FLOOD STUDY REPORT TEXT
 YELLOWSTONE RIVER FLOOD STUDY REPORT TEXT TECHNICAL REPORT Prepared for: City of Livingston 411 East Callender Livingston, MT 59047 Prepared by: Clear Creek Hydrology, Inc. 1627 West Main Street, #294
WELCOME Lake Wabukayne OPEN HOUSE
 WELCOME Lake Wabukayne Sediment Removal Project OPEN HOUSE We are here to: Update you, the community, on recent developments and activities at Lake Wabukayne Present the preferred alternative and receive
CITY OF CAPE CORAL STORMWATER MASTER PLAN PHASE II - PART 1 BASINS 4, 10, & 14 SUB-BASIN DRAINAGE IMPROVEMENTS HYDRAULIC ANALYSIS SUMMARY
 CITY OF CAPE CORAL STORMWATER MASTER PLAN PHASE II - PART 1 BASINS 4, 10, & 14 SUB-BASIN DRAINAGE IMPROVEMENTS HYDRAULIC ANALYSIS SUMMARY Cape Coral, FL Prepared for: The City of Cape Coral Public Works
Chapter 10 - Sacramento Method Examples
 Chapter 10 Sacramento Method Examples Introduction Overview This chapter presents two example problems to demonstrate the use of the Sacramento method. These example problems use the SACPRE and HEC-1 computer
BRANDON LAKES AVENUE PRE AND POST CONDITIONS DRAINAGE REPORT
 BRANDON LAKES AVENUE PRE AND POST CONDITIONS DRAINAGE REPORT Hillsborough County Public Works County Center, 22nd Floor 601 E. Kennedy Blvd. Tampa, FL 33602 BRANDON LAKES AVENUE DRAINAGE IMPROVEMENTS Capital
STREUVER FIDELCO CAPPELLI, LLC YONKERS DOWNTOWN DEVELOPMENT PHASE 1. DRAFT ENVIRONMENTAL IMPACT STATEMENT For: PALISADES POINT
 STREUVER FIDELCO CAPPELLI, LLC YONKERS DOWNTOWN DEVELOPMENT PHASE 1 DRAFT ENVIRONMENTAL IMPACT STATEMENT For: PALISADES POINT Prepared by: PAULUS, SOKOLOWSKI & SARTOR STORMWATER MANAGEMENT 1. Methodology
Stormwater Guidelines and Case Studies. CAHILL ASSOCIATES Environmental Consultants West Chester, PA (610)
") Stormwater Guidelines and Case Studies CAHILL ASSOCIATES Environmental Consultants West Chester, PA (610) 696-4150 www.thcahill.com Goals and Challenges for Manual State Stormwater Policy More Widespread
Stormwater Guidelines and Case Studies CAHILL ASSOCIATES Environmental Consultants West Chester, PA (610) 696-4150 www.thcahill.com Goals and Challenges for Manual State Stormwater Policy More Widespread
L OWER N OOKSACK R IVER P ROJECT: A LTERNATIVES A NALYSIS A PPENDIX A: H YDRAULIC M ODELING. PREPARED BY: LandC, etc, LLC
 L OWER N OOKSACK R IVER P ROJECT: A LTERNATIVES A NALYSIS A PPENDIX A: H YDRAULIC M ODELING PREPARED BY: LandC, etc, LLC TABLE OF CONTENTS 1 Introduction... 1 2 Methods... 1 2.1 Hydraulic Model... 1 2.2
Highland Lake Bathymetric Survey
 Highland Lake Bathymetric Survey Final Report, Prepared For: The Town of Highland Lake 612 Lakeshore Drive Oneonta, AL 35121 Prepared By: Tetra Tech 2110 Powers Ferry Road SE Suite 202 Atlanta, GA 30339
ARTICLE 5 (PART 2) DETENTION VOLUME EXAMPLE PROBLEMS
 DETENTION VOLUME EXAMPLE PROBLEMS") ARTICLE 5 (PART 2) DETENTION VOLUME EXAMPLE PROBLEMS Example 5.7 Simple (Detention Nomograph) Example 5.8 Offsite and Unrestricted Areas (HEC-HMS) Example 5.9 Ponds in Series w/ Tailwater (HEC-HMS) Example
ARTICLE 5 (PART 2) DETENTION VOLUME EXAMPLE PROBLEMS Example 5.7 Simple (Detention Nomograph) Example 5.8 Offsite and Unrestricted Areas (HEC-HMS) Example 5.9 Ponds in Series w/ Tailwater (HEC-HMS) Example
Appendix E Guidance for Shallow Flooding Analyses and Mapping
 Appendix E Guidance for Shallow Flooding Analyses and Mapping E.1 Introduction Different types of shallow flooding commonly occur throughout the United States. Types of flows that result in shallow flooding
Chapter 7 Mudflow Analysis
 Chapter 7 Mudflow Analysis 7.0 Introduction This chapter provides information on the potential and magnitude of mud floods and mudflows that may develop in Aspen due to rainfall events, snowmelt, or rain
D. MATHEMATICAL MODEL AND SIMULATION
 D. MATHEMATICAL MODEL AND SIMULATION D - i TABLE OF CONTENTS D.1 Objective of Model Development... D - 1 D.2 Selection of Software... D - 1 D.3 General Steps of Simulation by MOUSE... D - 1 D.4 Cases of
PENNSYLVANIA DEPARTMENT OF TRANSPORTATION ENGINEERING DISTRICT 3-0
 PENNSYLVANIA DEPARTMENT OF TRANSPORTATION ENGINEERING DISTRICT 3-0 LYCOMING COUNTY S.R.15, SECTION C41 FINAL HYDROLOGIC AND HYDRAULIC REPORT STEAM VALLEY RUN STREAM RELOCATION DATE: June, 2006 REVISED:
SAN FRANCISCO DISTRICT INFORMATION REQUESTED FOR VERIFICATION OF CORPS JURISDICTION
 DEPARTMENT OF THE ARMY SAN FRANCISCO DISTRICT, U.S. ARMY CORPS OF ENGINEERS 1455 MARKET STREET SAN FRANCISCO, CALIFORNIA 94103-1398 SAN FRANCISCO DISTRICT INFORMATION REQUESTED FOR VERIFICATION OF CORPS
Appendix C Fluvial Flood Hazards
 Appendix C Fluvial Flood Hazards Sea Level Rise Vulnerability Assessment and Adaptation Project March 2019 Contents Contents... i Figures... i Tables... i Definitions, Acronyms, & Abbreviations... ii
Chapter 7 Mudflow Analysis
 Chapter 7 Mudflow Analysis 7.0 Introduction This chapter provides information on the potential and magnitude of mud floods and mudflows that may develop in Aspen due to rainfall events, snowmelt, or rain
CASE STUDIES. Introduction
 Introduction The City of Winston-Salem faces the challenge of maintaining public infrastructure (e.g., water and sewer lines, storm drains, roads, culverts and bridges) while minimizing the potential impacts
Streams in the Ranching Country of South Texas
 Streams in the Ranching Country of South Texas Watershed Analysis of HUC 12110207 Sandranell Moerbe CE GIS in Water Resources Fall 2015 INTRODUCTION This project investigates the portion of South Texas
1 foot of Sea Level Rise
 1 foot of Sea Level Rise Schools Fire Stations $+ Law Enforcement u Hospitals 1ft SLR 0 0.25 0.55 1.1 Miles $+ Year 20 Population: the 2013 study A Geological Perspective U.S. Mid-Atlantic Coast a probable
Appendix O. Sediment Transport Modelling Technical Memorandum
 Appendix O Sediment Transport Modelling Technical Memorandum w w w. b a i r d. c o m Baird o c e a n s engineering l a k e s design r i v e r s science w a t e r s h e d s construction Final Report Don
Section 3.0 Existing Systems Hydrology and Hydraulics
 Section 3.0 Existing Systems Hydrology and Hydraulics This chapter summarizes the results and methodology of MACTEC s evaluation of the existing drainage systems and lakes for the City of Maitland, Florida.
WATER MANAGEMENT REPORT FOR PAGE ESTATES
 WATER MANAGEMENT REPORT FOR PAGE ESTATES SLB Consulting of SW Florida, LLC PO Box 2826 Bonita Springs, FL. 34133 Phone: 239-948-9566 sandra@slbconsult.com C.O.A. # 25395 September 1, 2014 Sandra L. Bottcher
Miami-Dade County Technical Update Meeting South Florida Coastal Study. May 11, 2016
 Miami-Dade County Technical Update Meeting South Florida Coastal Study May 11, 2016 Welcome and Introductions FEMA Region IV Christina Lindemer Technical Lead Production and Technical Services (PTS) Contractor
APPENDIX B DRAINAGE REPORT
 APPENDIX B DRAINAGE REPORT B-1 South Lamar Blvd. Transportation Corridor Study Drainage Report Prepared for: City of Austin and HDR, Inc. Prepared by: and Services, Inc. Final 07-09-2015 Michael C. Meriwether,
1 foot of Sea Level Rise
 1 foot of Sea Level Rise Schools Fire Stations Law Enforcement u Hospitals 1ft SLR 0 0.125 0.25 0.5 Miles the 2013 study A Geological Perspective U.S. Mid-Atlantic Coast a probable threat expected by 2050.
 Red River Flooding June 2015 Caddo and Bossier Parishes Presented by: Flood Technical Committee Where the Rain Falls Matters I-30 versus I-20 I-20 Backwater and Tributary Floods (Localized) 2016 Flood
The last three sections of the main body of this report consist of:
 Threatened and Endangered Species Geological Hazards Floodplains Cultural Resources Hazardous Materials A Cost Analysis section that provides comparative conceptual-level costs follows the Environmental
City of Thornton Attn: Tim Semones Development Engineeering 9500 Civic Center Dr. Thornton, CO 80229
 Development Engineering Land Surveying Construction Administration District Services October 20, 2017 City of Thornton Attn: Tim Semones Development Engineeering 9500 Civic Center Dr. Thornton, CO 80229
HISTORY OF CONSTRUCTION FOR EXISTING CCR SURFACE IMPOUNDMENT PLANT GASTON ASH POND 40 CFR (c)(1)(i) (xii)
(1)(i) (xii)") HISTORY OF CONSTRUCTION FOR EXISTING CCR SURFACE IMPOUNDMENT PLANT GASTON ASH POND 40 CFR 257.73(c)(1)(i) (xii) (i) Site Name and Ownership Information: Site Name: E.C. Gaston Steam Plant Site Location:
HISTORY OF CONSTRUCTION FOR EXISTING CCR SURFACE IMPOUNDMENT PLANT GASTON ASH POND 40 CFR 257.73(c)(1)(i) (xii) (i) Site Name and Ownership Information: Site Name: E.C. Gaston Steam Plant Site Location:
LOMR SUBMITTAL LOWER NEHALEM RIVER TILLAMOOK COUNTY, OREGON
 LOMR SUBMITTAL LOWER NEHALEM RIVER TILLAMOOK COUNTY, OREGON Prepared for: TILLAMOOK COUNTY DEPARTMENT OF COMMUNITY DEVELOPMENT 1510-B THIRD STREET TILLAMOOK, OR 97141 Prepared by: 10300 SW GREENBURG ROAD,
Pequabuck River Flooding Study and Flood Mitigation Plan The City of Bristol and Towns of Plainville and Plymouth, CT
 Pequabuck River Flooding Study and Flood Mitigation Plan The City of Bristol and Towns of Plainville and Plymouth, CT Raymond Rogozinski and Maged Aboelata The City of Bristol and Towns of Plainville and
3.11 Floodplains Existing Conditions
 Other stormwater control practices may be needed to mitigate water quality impacts. In addition to detention facilities, other practices such as vegetated basins/buffers, infiltration basins, and bioswales
Continuing Education Course #101 Drainage Design with WinTR-55
 1 of 5 Continuing Education Course #101 Drainage Design with WinTR-55 1. WinTR-55 uses the Kinematic Wave method for calculating storm runoff rates and volumes. 2. According to the Velocity Method, the
UPPER COSUMNES RIVER FLOOD MAPPING
 UPPER COSUMNES RIVER FLOOD MAPPING DRAFT BASIC DATA NARRATIVE FLOOD INSURANCE STUDY SACRAMENTO COUTY, CALIFORNIA Community No. 060262 November 2008 Prepared By: CIVIL ENGINEERING SOLUTIONS, INC. 1325 Howe
Mapping of Future Coastal Hazards. for Southern California. January 7th, David Revell, Ph.D. E.
 Mapping of Future Coastal Hazards for Southern California January 7th, 2014 David Revell, Ph.D. drevell@esassoc.com E. Vandebroek, 2012 Outline Coastal erosion hazard zones Flood hazard zones: Coastal
9. PROBABLE MAXIMUM PRECIPITATION AND PROBABLE MAXIMUM FLOOD
 9. PROBABLE MAXIMUM PRECIPITATION AND PROBABLE MAXIMUM FLOOD 9.1. Introduction Due to the size of Watana Dam and the economic importance of the Project to the Railbelt, the Probable Maximum Flood (PMF)
Technical Memorandum. City of Salem, Stormwater Management Design Standards. Project No:
 Technical Memorandum 6500 SW Macadam Avenue, Suite 200 Portland, Oregon, 97239 Tel: 503-244-7005 Fax: 503-244-9095 Prepared for: Project Title: City of Salem, Oregon City of Salem, Stormwater Management
Climate Adaptation Challenges for Boston s Water and Sewer Systems
 National Association of Flood & Stormwater Management Agencies Climate Adaptation Challenges for Boston s Water and Sewer Systems John P Sullivan P.E. October 15,2014 Boston 1630 Boston 1630-2012 Boston
Draft for Discussion 11/11/2016
 Coastal Risk Consulting (CRC) Climate Vulnerability Assessment for Village of Key Biscayne Deliverable 1.1 in Statement of Work. Preliminary Vulnerability Assessment Identifying Flood Hotspots Introduction...
Pompton Lakes Dam Downstream Effects of the Floodgate Facility. Joseph Ruggeri Brian Cahill Michael Mak Andy Bonner
 Pompton Lakes Dam Downstream Effects of the Joseph Ruggeri Brian Cahill Michael Mak Andy Bonner ASFPM 2013: Overview Page 2 Overview Page 3 Overview Page 4 Overview Page 5 Overview - Historical Pompton
Local Flood Hazards. Click here for Real-time River Information
 Local Flood Hazards Floods of the White River and Killbuck Creek are caused by runoff from general, and/or intense rainfall. Other areas of flooding concern are from the Boland Ditch and Pittsford Ditch.
Hydrology and Hydraulics Design Report. Background Summary
 To: National Park Services Montezuma Castle National Monument Richard Goepfrich, Facility Manager From: Multicultural Technical Engineers Date: Tuesday - February 13, 2018 Subject: 30% Hydrology and Hydraulics
CAUSES FOR CHANGE IN STREAM-CHANNEL MORPHOLOGY
 CAUSES FOR CHANGE IN STREAM-CHANNEL MORPHOLOGY Chad A. Whaley, Department of Earth Sciences, University of South Alabama, MobileAL, 36688. E-MAIL: caw408@jaguar1.usouthal.edu The ultimate goal of this
STORMWATER REPORT FRITO LAY SUBDIVISION NO. 3
 STORMWATER REPORT FRITO LAY SUBDIVISION NO. 3 May 2018 STORMWATER REPORT I. Subdivision Data a. The parcel is adjacent to the existing Frito Lay property in Topeka; and the subject plat application encompasses
A More Comprehensive Vulnerability Assessment: Flood Damage in Virginia Beach
 A More Comprehensive Vulnerability Assessment: Flood Damage in Virginia Beach By Raj Shah GIS in Water Resources Fall 2017 Introduction One of the most obvious effects of flooding events is death. Humans
Summary Description Municipality of Anchorage. Anchorage Coastal Resource Atlas Project
 Summary Description Municipality of Anchorage Anchorage Coastal Resource Atlas Project By: Thede Tobish, MOA Planner; and Charlie Barnwell, MOA GIS Manager Introduction Local governments often struggle
Village of Glenview: Community-wide Flood Risk Reduction Program (FRRP)
") Village of Glenview: Community-wide Flood Risk Reduction Program (FRRP) Sarah Pasquesi, P.E. Project Engineer AECOM sarah.pasquesi@aecom.com Shane Schneider, P.E. Village Engineer Village of Glenview shanes@glenview.il.us
Village of Glenview: Community-wide Flood Risk Reduction Program (FRRP) Sarah Pasquesi, P.E. Project Engineer AECOM sarah.pasquesi@aecom.com Shane Schneider, P.E. Village Engineer Village of Glenview shanes@glenview.il.us
City of Madison Flooding Event AUGUST 20 TH, 2018-PRESENT
 City of Madison Flooding Event AUGUST 20 TH, 2018-PRESENT Presentation Overview Review of Flash Flooding and Flooding from High Lake Levels (August 20 th -Present) Lake Level Information Damages FEMA How
Sea Level Rise and Hurricane Florence storm surge research methodology
 Sea Level Rise and Hurricane Florence storm surge research methodology Hurricane Florence storm surge analysis was conducted using a variety of input sources. In order to determine the maximum storm surge
PRELIMINARY CULVERT ANALYSIS REPORT FOR CULVERT NO. 008-C OREGON AVENUE OVER PINEHURST CREEK
 PRELIMINARY CULVERT ANALYSIS REPORT FOR CULVERT NO. 008-C OREGON AVENUE OVER PINEHURST CREEK Prepared for The District of Columbia Department of Transportation Washington, D.C. Prepared by Parsons Transportation
Objectives: After completing this assignment, you should be able to:
 Data Analysis Assignment #1 Evaluating the effects of watershed land use on storm runoff Assignment due: 21 February 2013, 5 pm Objectives: After completing this assignment, you should be able to: 1) Calculate
IJESRT INTERNATIONAL JOURNAL OF ENGINEERING SCIENCES & RESEARCH TECHNOLOGY
 IJESRT INTERNATIONAL JOURNAL OF ENGINEERING SCIENCES & RESEARCH TECHNOLOGY Use of Digital Elevation Model to compute Storm Water Drainage Network Manisha Desai *1, Dr. J. N. Patel 2 *1 Ph. D. Student of
Technical Memorandum No Sediment Model
 Pajaro River Watershed Study in association with Technical Memorandum No. 1.2.9 Sediment Model Task: Development of Sediment Model To: PRWFPA Staff Working Group Prepared by: Gregory Morris and Elsie Parrilla
Lecture 14: Floods. Key Questions
 Lecture 14: Floods Key Questions 1. What is an upstream flood? 2. What is a downstream flood? 3. What were the setup conditions that cause floods? 4. What is a 100-year flood? 5. How are 100-year flood
Ashville Park Stormwater Management System Scenarios with Village C
 Memorandum o: From: Greg Johnson P.E. Mike Morgan P.E. Date: February 16 201 Subject: Ashville Park Stormwater Management System Scenarios with Village Introduction his memo presents analysis performed
Preliminary Hydraulic Report
 Tarrant County, Texas Preliminary Hydraulic Report Prepared for: Texas Department of Transportation Fort Worth District Prepared by: AECOM Corporation Scott C. Williams, P.E. No. 101334, Date 2009 This
GIS Techniques for Floodplain Delineation. Dean Djokic
 GIS Techniques for Floodplain Delineation Dean Djokic (ddjokic@esri.com) Content What is a floodplain? How to get a floodplain? What can GIS do for floodplain modeling? Simple GIS techniques for floodplain
PRELIMINARY DRAFT FOR DISCUSSION PURPOSES
 Memorandum To: David Thompson From: John Haapala CC: Dan McDonald Bob Montgomery Date: February 24, 2003 File #: 1003551 Re: Lake Wenatchee Historic Water Levels, Operation Model, and Flood Operation This
StreamStats: Delivering Streamflow Information to the Public. By Kernell Ries
 StreamStats: Delivering Streamflow Information to the Public By Kernell Ries U.S. Department of the Interior U.S. Geological Survey MD-DE-DC District 410-238-4317 kries@usgs.gov StreamStats Web Application
THE NEED FOR AN ADDITIONAL SPILLWAY AT THE SANFORD DAM BOILING SPRING LAKES, NC. Presentation for The Brunswick County Commissioners April 20, 2015
 THE NEED FOR AN ADDITIONAL SPILLWAY AT THE SANFORD DAM BOILING SPRING LAKES, NC Presentation for The Brunswick County Commissioners April 20, 2015 The Sanford Dam Earth Dam constructed in 1961 Drainage
Rucker Pond. Background
 Rucker Pond Background The Rucker Basin consists of two subbasins (East and West) that drain to a single area known as Rucker Pond. Both subbasins have the same hydraulic parameters, but have different
QGIS FLO-2D Integration
 EPiC Series in Engineering Volume 3, 2018, Pages 1575 1583 Engineering HIC 2018. 13th International Conference on Hydroinformatics Karen O Brien, BSc. 1, Noemi Gonzalez-Ramirez, Ph. D. 1 and Fernando Nardi,
Technical Memorandum No
 Pajaro River Watershed Study in association with Technical Memorandum No. 1.2.10 Task: Evaluation of Four Watershed Conditions - Sediment To: PRWFPA Staff Working Group Prepared by: Gregory Morris and
Grant 0299-NEP: Water Resources Project Preparatory Facility
 Document Produced under Grant Project Number: 45206 May 2016 Grant 0299-NEP: Water Resources Project Preparatory Facility Final Report Volume 3 East Rapti (1 of 9) Prepared by Pvt. Ltd. For Ministry of
USING GIS TO MODEL AND ANALYZE HISTORICAL FLOODING OF THE GUADALUPE RIVER NEAR NEW BRAUNFELS, TEXAS
 USING GIS TO MODEL AND ANALYZE HISTORICAL FLOODING OF THE GUADALUPE RIVER NEAR NEW BRAUNFELS, TEXAS ASHLEY EVANS While the state of Texas is well-known for flooding, the Guadalupe River Basin is one of
Urban Street-Scale Hydrodynamic Flood Modeling of Micro-Burst Rainfall
 Urban Street-Scale Hydrodynamic Flood Modeling of Micro-Burst Rainfall Dr. Jon Derek Loftis Asst. Research Scientist, VA Inst. of Marine Science Sridhar Katragadda Systems Analyst, City of Virginia Beach
ATLANTIC INTRACOASTAL WATERWAY NORFOLK DISTRICT. Joel F. Scussel, Operations Support Section Dismal Swamp Canal July 27, 2017
 ATLANTIC INTRACOASTAL WATERWAY 1 255 255 255 237 237 237 0 0 0 217 217 217 163 163 163 200 200 200 131 132 122 239 65 53 80 119 27 NORFOLK DISTRICT 110 135 120 252 174.59 112 92 56 62 102 130 102 56 48
DRAFT. PRELIMINARY LANDSLIDE MODELING for KRAMER AVENUE LANDSLIDE SITKA, ALASKA. Prepared for: Andrew Friske 210 Kramer Ave. Sitka, Alaska 99835
 PRELIMINARY LANDSLIDE MODELING for KRAMER AVENUE LANDSLIDE SITKA, ALASKA Prepared for: Andrew Friske 210 Kramer Ave. Sitka, Alaska 99835 Prepared by: Northern Geotechnical Engineering, Inc. d.b.a. Terra
LOMR SUBMITTAL LOWER NESTUCCA RIVER TILLAMOOK COUNTY, OREGON
 LOMR SUBMITTAL LOWER NESTUCCA RIVER TILLAMOOK COUNTY, OREGON Prepared for: TILLAMOOK COUNTY DEPARTMENT OF COMMUNITY DEVELOPMENT 1510-B THIRD STREET TILLAMOOK, OR 97141 Prepared by: 10300 SW GREENBURG ROAD,
Workshop: Build a Basic HEC-HMS Model from Scratch
 Workshop: Build a Basic HEC-HMS Model from Scratch This workshop is designed to help new users of HEC-HMS learn how to apply the software. Not all the capabilities in HEC-HMS are demonstrated in the workshop
University of the Virgin Islands Conceptual Stormwater Management Plan Coral Bay Watershed Final Letter Report (May 2005)
") Final Letter Report (May 2005) Background The Coral Bay watershed, shown in Figure 1, is located in the southeastern portion of the island of St. John, U.S. Virgin Islands (USVI) and consists of approximately
Final Letter Report (May 2005) Background The Coral Bay watershed, shown in Figure 1, is located in the southeastern portion of the island of St. John, U.S. Virgin Islands (USVI) and consists of approximately
KINEROS2/AGWA. Fig. 1. Schematic view (Woolhiser et al., 1990).
.") KINEROS2/AGWA Introduction Kineros2 (KINematic runoff and EROSion) (K2) model was originated at the USDA-ARS in late 1960s and released until 1990 (Smith et al., 1995; Woolhiser et al., 1990). The spatial
KINEROS2/AGWA Introduction Kineros2 (KINematic runoff and EROSion) (K2) model was originated at the USDA-ARS in late 1960s and released until 1990 (Smith et al., 1995; Woolhiser et al., 1990). The spatial
South Florida Coastal Storm Surge and Mapping Study
 South Florida Coastal Storm Surge and Mapping Study Presented by Christopher Bender, Ph.D., P.E., D.CE June 2, 2015 Presentation Overview FEMA risk studies outline Overview South Florida surge study Work
DRAINAGE REPORT. Ministry of Transportation and Infrastructure. Highway 7 Four Laning Silverdale Avenue to Nelson Street 100% Detailed Design
 DRAINAGE REPORT Ministry of Transportation and Infrastructure Highway 7 Four Laning Silverdale Avenue to Nelson Street 100% Detailed Design December 14, 2017 Reviewed by: Amanda Rust, P. Eng. Senior Drainage
ENGINEERING HYDROLOGY
 ENGINEERING HYDROLOGY Prof. Rajesh Bhagat Asst. Professor Civil Engineering Department Yeshwantrao Chavan College Of Engineering Nagpur B. E. (Civil Engg.) M. Tech. (Enviro. Engg.) GCOE, Amravati VNIT,
Issue 44: Phase II & III H&H Issues Date: 07/03/2006 Page 1
 Background Phase I of the NCFMP studies have primarily focused on the coastal plain and sandhills physiographic regions in of the State. Phase II and III study areas will focus on the piedmont, foothills,
FLOOD HAZARD AND RISK ASSESSMENT IN MID- EASTERN PART OF DHAKA, BANGLADESH
 FLOOD HAZARD AND RISK ASSESSMENT IN MID- EASTERN PART OF DHAKA, BANGLADESH Muhammad MASOOD MEE07180 Supervisor: Prof. Kuniyoshi TAKEUCHI ABSTRACT An inundation simulation has been done for the mid-eastern
STORMWATER MANAGEMENT COMPUTATIONS. Mount Prospect
 STORMWATER MANAGEMENT COMPUTATIONS Mount Prospect MHG PROJECT No. 2011.173.11 November 6, 2014 Prepared for: Piney Meetinghouse Investments c/o Mr. Dennis Fling 14801 Clopper Road Boyds, MD 20841 (301)
Estimated Sediment Volume: Bridge Street Dam Impoundment, Royal River, Yarmouth, Maine
 University of Southern Maine USM Digital Commons Publications Casco Bay Estuary Partnership (CBEP) 2015 Estimated Sediment Volume: Bridge Street Dam Impoundment, Royal River, Yarmouth, Maine Stantec Follow
Appendix I. Dredged Volume Estimates. Draft Contractor Document: Subject to Continuing Agency Review
 Appendix I Dredged Volume Estimates Draft Contractor Document: Subject to Continuing Agency Review Interoffice Correspondence Date: April 6, 2007 To: L. Bossi (WHI) Copy: S. Thompson (WHI), B. Fidler (NNJ)
New Jersey Department of Transportation Extreme Weather Asset Management Pilot Study
 New Jersey Department of Transportation Extreme Weather Asset Management Pilot Study Overview Prepared for: June 26, 2018 Introduction Overview of Pilot Study New Jersey s Climate New Jersey s Transportation
FHWA - HIGHWAY HYDROLOGY
 The unit peak discharge is computed with Equation 5.6 by interpolating c 0, c, and c Table 5.5 using a type II distribution. The peak discharge is also calculated as follows. from Variable SI Unit U Unit.5444
Red River Levee Panel
 Red River Levee Panel Mississippi River Commission Monday, August 9, 2017 Red River Levees in LA & AR NONE along TX & OK Boarder Red River Levee Issues Caddo Levee Cherokee Park Authorization Bossier Levee
INTRODUCTION TO HYDROLOGIC MODELING USING HEC-HMS
 INTRODUCTION TO HYDROLOGIC MODELING USING HEC-HMS By Thomas T. Burke, Jr., PhD, PE Luke J. Sherry, PE, CFM Christopher B. Burke Engineering, Ltd. October 8, 2014 1 SEMINAR OUTLINE Overview of hydrologic
Observations on Surface Water in the Seminary Fen in Spring, Prepared 6/4/13 by Sam Wetterlin; updated 7/28/13
 Observations on Surface Water in the Seminary Fen in Spring, 2013 Prepared 6/4/13 by Sam Wetterlin; updated 7/28/13 Ordinarily, a calcareous fen is primarily dependent on upwelling mineral-rich, oxygen-poor
The effectiveness of the Natural Resource Conservation Service (NRCS) and Huff rainfall distribution methods for use in detention basin design
 and Huff rainfall distribution methods for use in detention basin design") Scholars' Mine Masters Theses Student Theses and Dissertations Spring 2010 The effectiveness of the Natural Resource Conservation Service (NRCS) and Huff rainfall distribution methods for use in detention
Scholars' Mine Masters Theses Student Theses and Dissertations Spring 2010 The effectiveness of the Natural Resource Conservation Service (NRCS) and Huff rainfall distribution methods for use in detention
Tool 2.1.4: Inundation modelling of present day and future floods
 Impacts of Climate Change on Urban Infrastructure & the Built Environment A Toolbox Tool 2.1.4: Inundation modelling of present day and future floods Authors M. Duncan 1 and G. Smart 1 Affiliation 1 NIWA,
Sediment Trap. At multiple locations within the project site where sediment control is needed.
 Sediment Trap SE-3 Objectives EC Erosion Control SE Sediment Control TR Tracking Control WE Wind Erosion Control Non-Stormwater NS Management Control Waste Management and WM Materials Pollution Control
software, just as word processors or databases are. GIS was originally developed and cartographic capabilities have been augmented by analysis tools.
 1. INTRODUCTION 1.1Background A GIS is a Geographic Information System, a software package for creating, viewing, and analyzing geographic information or spatial data. GIS is a class of software, just
A GIS-based Approach to Watershed Analysis in Texas Author: Allison Guettner
 Texas A&M University Zachry Department of Civil Engineering CVEN 658 Civil Engineering Applications of GIS Instructor: Dr. Francisco Olivera A GIS-based Approach to Watershed Analysis in Texas Author:
The following maps must be provided as a part of the ADA. The appropriate scale for each map should be determined at the pre application conference.
 Main Street @ Coconut Creek DRI QUESTION 9 MAPS The following maps must be provided as a part of the ADA. The appropriate scale for each map should be determined at the pre application conference. Map