Lecture 14: Floods. Key Questions
|
|
|
- Delphia Lucas
- 6 years ago
- Views:
Transcription
 Niigata Japan, 1964 liquefaction")
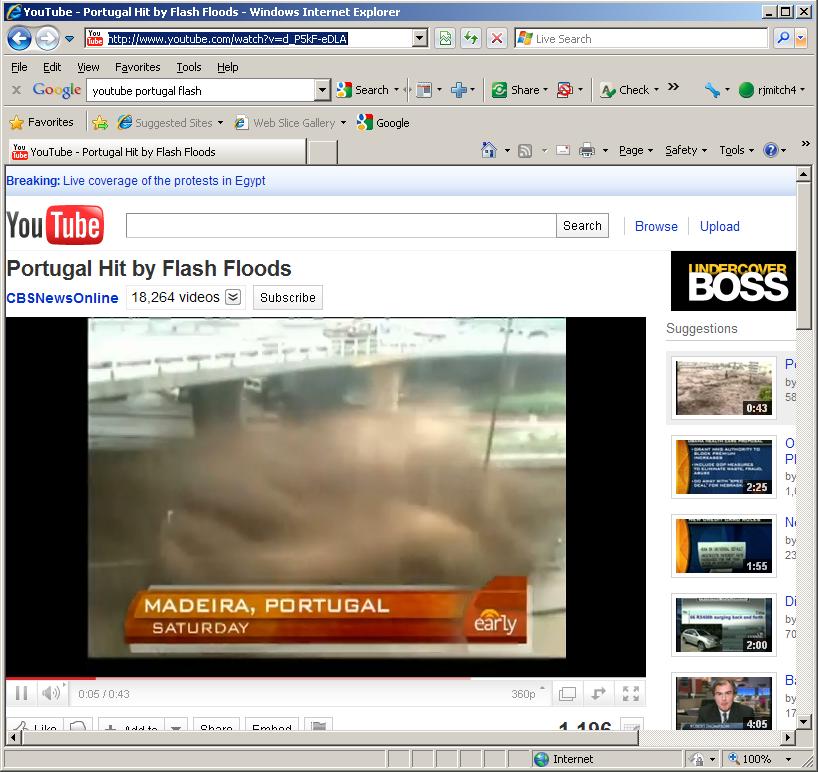
1 Lecture 14: Floods Key Questions 1. What is an upstream flood? 2. What is a downstream flood? 3. What were the setup conditions that cause floods? 4. What is a 100-year flood? 5. How are 100-year flood discharge magnitudes determined? 6. What is a 100-year flood inundation map? Chehalis Dec 2007 Flood (Seattle Times) Niigata Japan, 1964 liquefaction

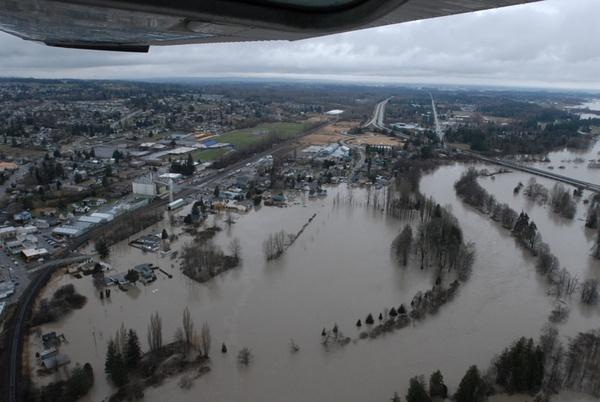
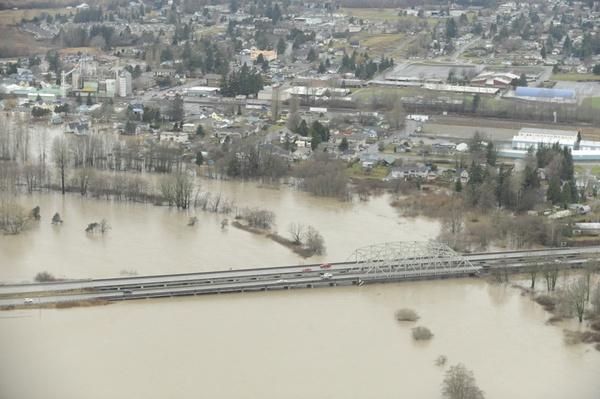
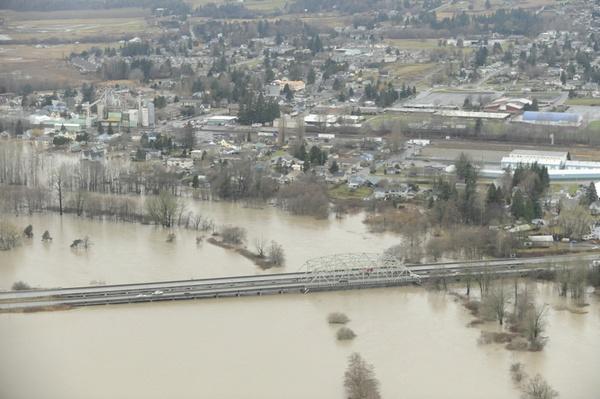
2 Flooding effects about 75 million people per year An aerial view of the flooded I-5 overpass looking south Flooding in Chehalis (December 04, 2007)
3 Floods are the #1 weather related killer in the U.S. Cowlitz River near Packwood, Washington

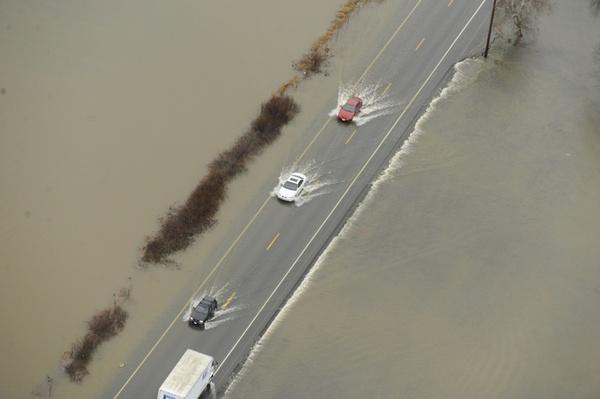
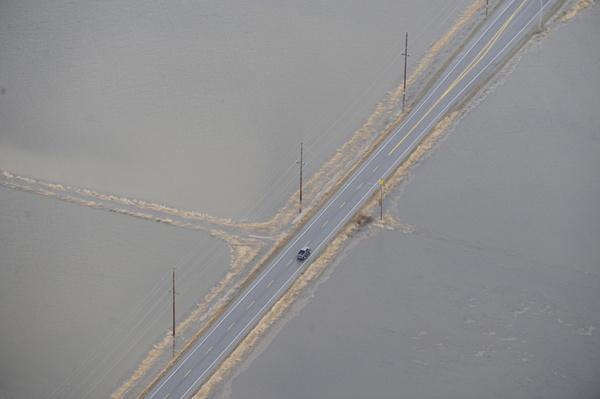
4 In the USA, about 50% of the flood related deaths occur in vehicles. A driver attempts to drive through the flood zone on 171st Street in Woodinville. (December 03, 2007)
5 FLOODS are usually caused by heavy rains and/or rapid snow melt their severity is controlled by the watershed characteristics. 1. Basin size (area) 2. Topography 3. Drainage dentistry (length of streams per area) 4. Vegetation type and distributions 5. Geology 6. Soil type and thickness 7. Runoff processes hydrograph Q Time


6 On occasion, there is a flood caused by a dam burst St. Franics Dam failure, Santa Clarita Valley, CA The March 12-13, 1928 disaster that claimed more than 470 lives.

7 On occasion, there is a flood caused by a dam burst The Teton Dam, 44 miles northeast of Idaho Falls in southeastern Idaho, failed abruptly on June 5, It released nearly 300,000 acre feet of water, then flooded farmland and towns downstream with the eventual loss of 14 lives, and with a cost estimated to be nearly $1 billion.

8 On occasion, there is a flood caused by a dam burst On May 31, 1889, failure of the South Fork dam led to a catastrophe in which 2,209 people died The Johnstown Flood, PA
 which is upriver from Kent, Renton, Auburn, Tukwila, located in South King County.")
9 On occasion, there is a flood caused by a dam burst Water flows into the Green River from the 48-year-old Howard Hanson Dam (earthen dam) which is upriver from Kent, Renton, Auburn, Tukwila, located in South King County. Howard Hanson Dam

10 On occasion, there is a flood caused by a dam burst Water seeping through Howard Hanson Dam. Engineers are concerned the dam could fail, creating catastrophic flooding in the valley below.


11 Upstream or Flash Floods High intensity and long duration rain Steep terrain Exposed bedrock or thin soils
12
13 Hydrograph Q very rapid response bedrock surfaces in mountain settings have low infiltration rates, hence very rapid surface runoff Time

14 Hortonian overland flow on bedrock

15 Flood Statistics Up to 15 inches of rain fell with an average of 10 inches over 60 square miles. Rapid City South Dakota, 1972 Flash Flood Peak flow on Rapid Creek 50,600 cubic feet per second...more than 10 times greater than the previous flood of record. During the flood, water rose as fast as 3.5 feet in 15 minutes. 238 people killed. 3,000 people injured. 1,335 homes destroyed. 5,000 automobiles destroyed. $160 million in total damages (1972 dollars, $644 million in 2002 dollars). 15 of the 23 bridges over Rapid Creek were destroyed.
 Debris flow on Mt.")
16 Debris Flows and Debris Torrents High intensity and long duration rain Steep terrain Loose saturated soils and organic matter (logging debris) Debris flow on Mt. Baker Highway east of Deming, January 8, 2009
17 Smith Creek Debris Torrents (similar to flash floods) The Smith Creek watershed is susceptible to debris torrents because of: Steep terrain (3000 feet of relief in about 2 miles) Exposed bedrock and a thin soil cover Clear-cut exposures

18 1983 Debris Torrent in the Smith Creek Watershed
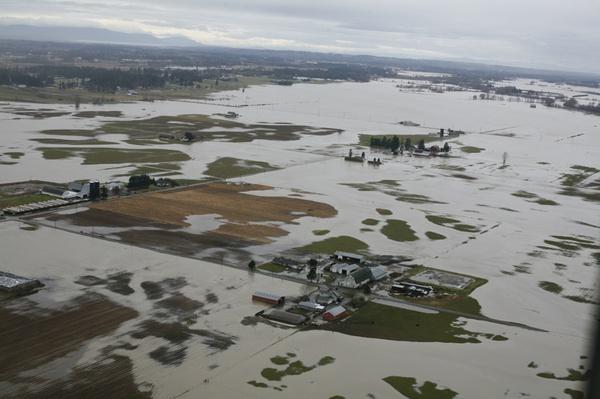
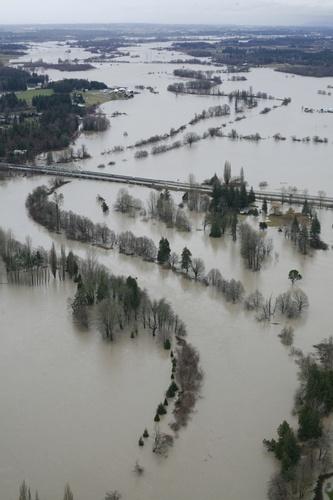
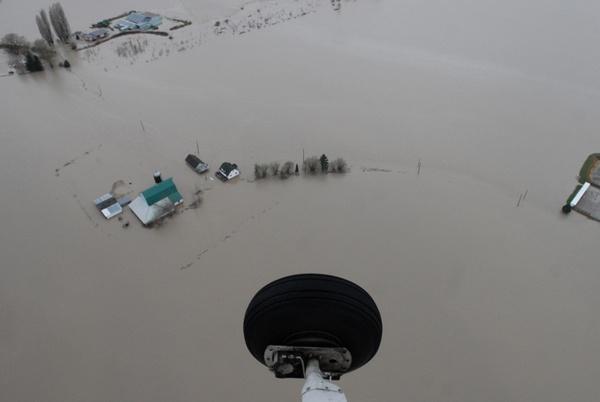
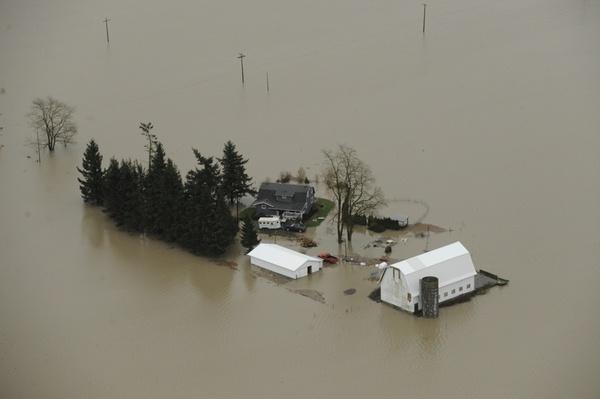
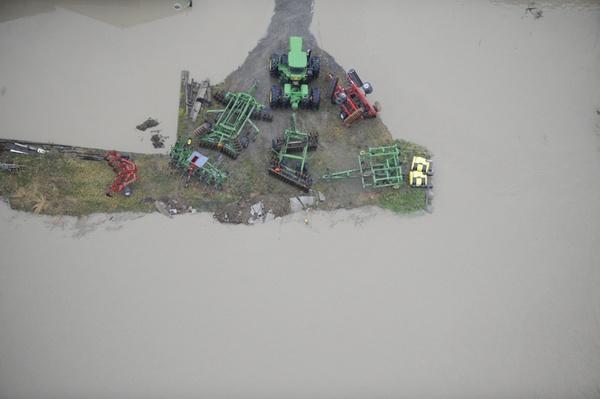
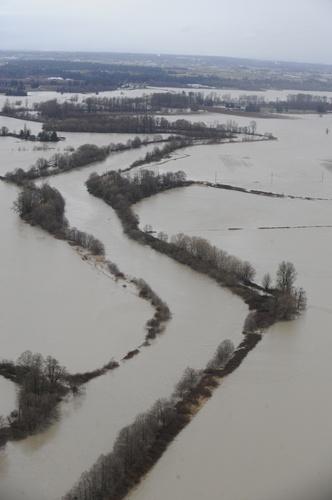
19 Down Stream Floods occur in areas of low relief (floodplains) Nooksack River at Ferndale, Jan 2009
20
21 Pineapple Express: December 3,

22 December 1-3, 2007 Flood Tons of earth and vegetation washed away from clear-cut hillsides last week and into Stillman Creek, a tributary of the south fork of the Chehalis River.

23 December 1-3, 2007 Flood Acres of timber and debris backed up behind this bridge in the Boistfort Valley, which was inundated by the flooding of the south fork of the Chehalis River.
, were inundated by water.")
24 December 1-3, 2007 Flood New buildings west of I-5 at Chehalis, including a Wal-Mart (upper right), were inundated by water. Some people believe the development exacerbated the flooding.

25 December 1-3, 2007 Flood A Home Depot store, above, along Interstate 5 resembles a floating barge in a photograph taken Tuesday

26 December 1-3, 2007 Flood Flooded Chehalis a new automobile dealership, at bottom of photo, is being built just off Interstate 5 on an island of fill in the Chehalis River floodplain. Some nearby stores, including a Home Depot and Wal-Mart.

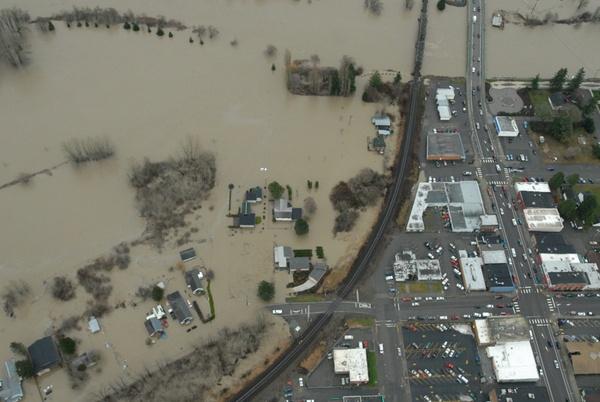
27 December 1-3, 2007 Flood An exit sign is seen on the submerged I-5 freeway in Chehalis

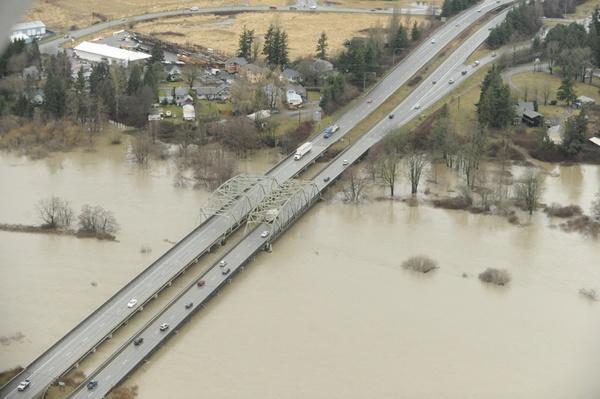
28 December 1-3, 2007 Flood A closed Interstate 5 is shown running directly into the flooding Chehalis River near Centralia

29 December 1-3, 2007 Flood A Centralia neighborhood that runs next to I-5 which is fully submerged at the right.

30 December 1-3, 2007 Flood Airplanes were moved to high ground at Chehalis Airport.

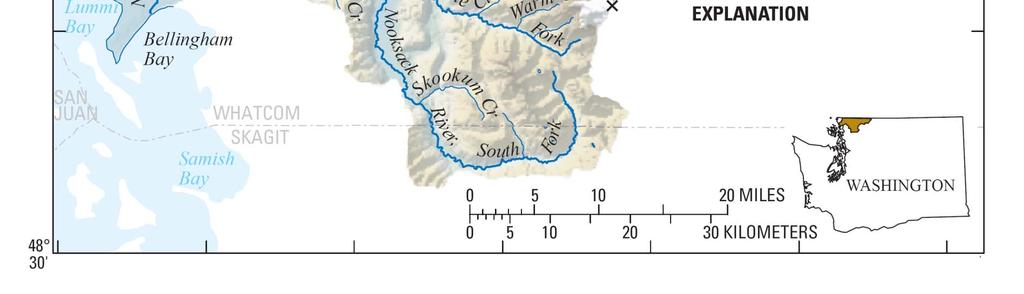
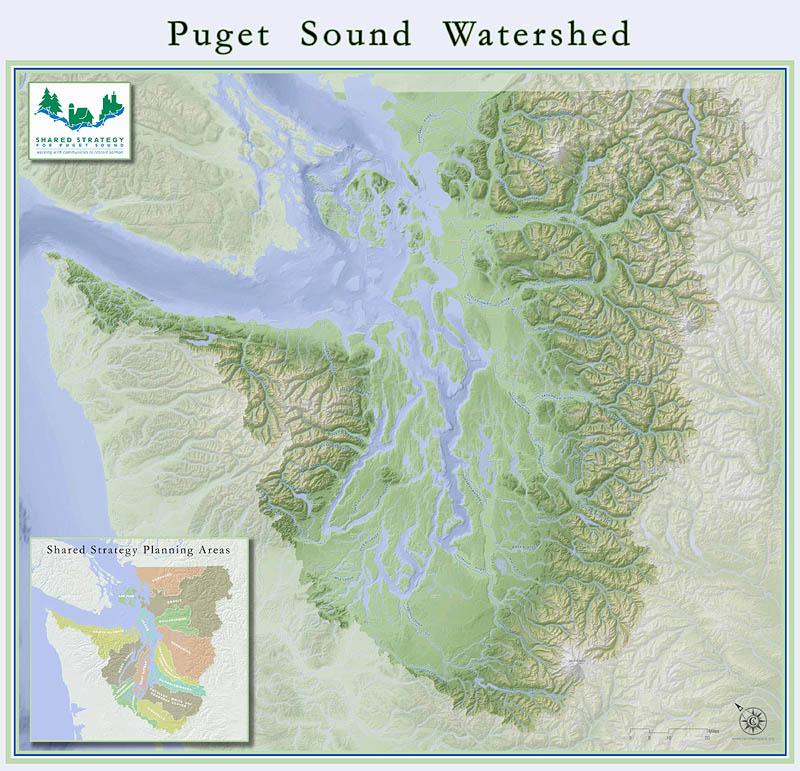
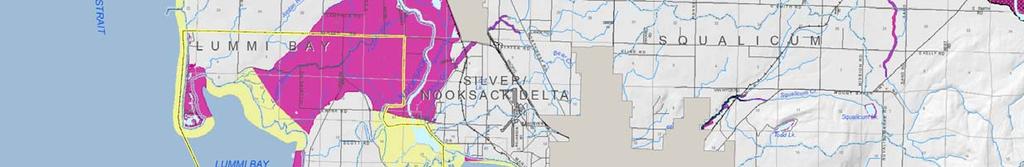
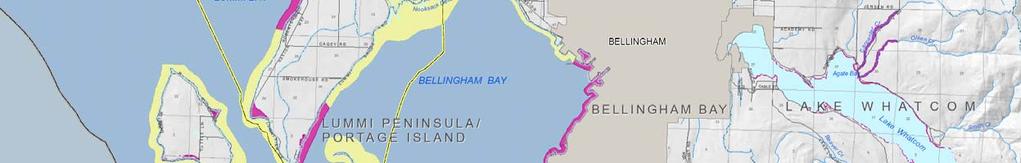
31 Nooksack River Basin About 2000 square kilometers or 780 square miles
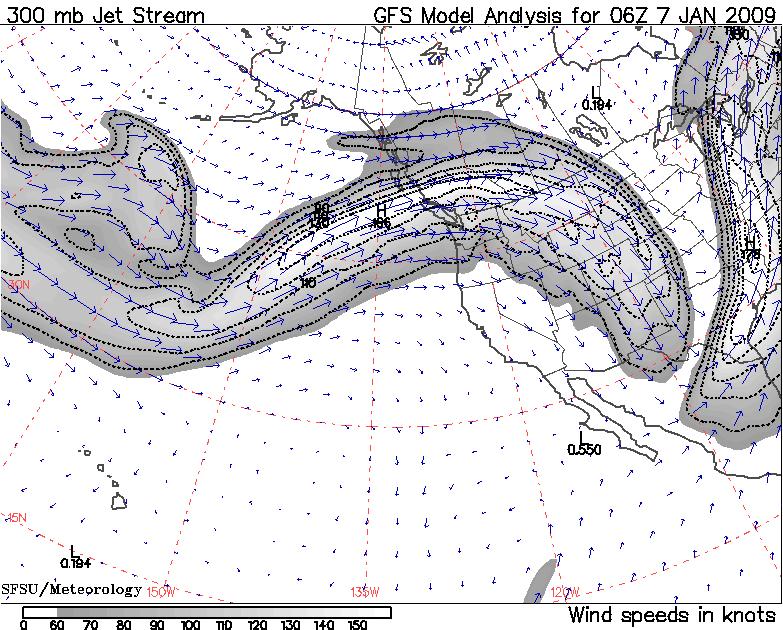
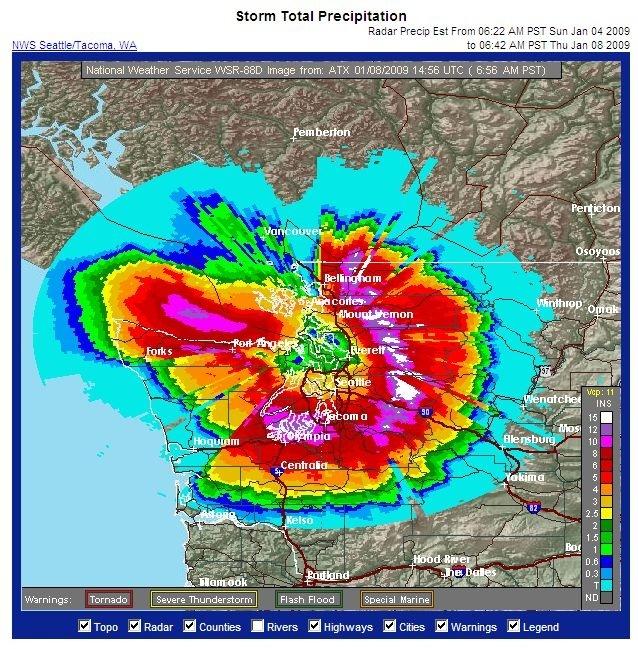
32 Pineapple Express: January 8,
33
 Bellingham had 3.15 inches Mount Baker had 7.")
34 Rainfall recorded at the Cedarville stream gauge (5.5 inches) Bellingham had 3.15 inches Mount Baker had 7.90 inches
35 Real-time stream gauges and historical discharge data are the most used tool for mitigating downstream floods.
36 Peak: 1/7/ :00 hr
37 Peak: 1/8/ :30 hr

38 Nooksack River at Nuggents Corner late January 7, 2009
39
40
41

42
43
44

45
46
47
48
49
50
51
52

53
54
55
56
57
58
59 Real-time stream gauges and historical discharge data are the most used tool for mitigating downstream floods.
60 November, 1990 Flood
61 November, 1990 Flood January, 2009 Flood
 5 inches of rain in Bellingham in 3 days 14 inches fell in the mountains due to the orographic effect http://seattlepi.nwsource.")
62 Conditions for Setup for the Nooksack River, November 10, 1990 Flood 1. Heavy Rain (Pineapple Express) 5 inches of rain in Bellingham in 3 days 14 inches fell in the mountains due to the orographic effect

63 Conditions for Setup for the Nooksack River, November 10, 1990 Flood 2. In November, soils are nearly saturated soils near saturation produce more runoff Hydrograph Q runoff Time
64 3. Rain on Snow November snow packs are relatively warm. Warm rains release heat into the snowapck causing some snow to melt. Snowmelt produced an additional 2 inches of runoff! Hydrograph Q runoff Time

65 NOAA Hydrologic Remote Sensing Center
66 Q no snow pack so rain falls on exposed bedrock and thin, wet soils Q snow pack Hydrograph Hydrograph Q more volume but less peaked Q Time Time

67 Conditions for Setup for the Nooksack River, November 10, 1990 Flood 4. High Tide High tide caused the river mouth to be higher (pushes water back on the floodplain). 5. Storm Surge Storm surge is simply water that is pushed toward the shore by the force of the winds swirling around the storm.
68 Nooksack River, November, 1990 Flood
69 Flood risk questions: 1. When are floods most likely to occur?

70 Real-time stream gauges and historical discharge data are the most used tool for mitigating downstream floods.
71 1. Collect the historical peak flows for a river (e.g., Nooksack at Ferndale). Year cfs Year cfs Year cfs Year cfs 10/26/ /27/ /10/ /31/ /1/ /31/ /19/ /4/ /10/ /17/ /30/ /23/ /16/ /8/ /20/ /27/ /31/ /4/ /14/ /26/ /5/ /5/ /31/ /6/ /26/ /17/ /21/ /3/ /18/ /3/ /8/ /15/ /27/ /15/ /11/ /5/ /27/ /25/ /24/ /6/ /16/ /11/ /10/ /24/ /25/ /2/ /20/ /30/ /20/ /30/ /14/ /16/ /21/ /23/
72 Flood risk questions: 1. When are flood most likely to occur? Highest risk months are Nov, Dec, & Jan Monthly Occurrence of Peak Flows at Ferndale
73 Flood risk questions: 1. When are flood most likely to occur? 2. How often do large magnitude floods occur?

74 A 100-year flood is a flood that has a 1% chance of occurring in any given year Nooksack River in Whatcom County, Jan 9, 2009
75 How to determine the discharge of a 100-year flood
76 1. Collect the historical peak flows for a river (e.g., Nooksack at Ferndale).
77 1. Collect the historical peak flows for a river (e.g., Nooksack at Ferndale). Year cfs Year cfs Year cfs Year cfs 10/26/ /27/ /10/ /31/ /1/ /31/ /19/ /4/ /10/ /17/ /30/ /23/ /16/ /8/ /20/ /27/ /31/ /4/ /14/ /26/ /5/ /5/ /31/ /6/ /26/ /17/ /21/ /3/ /18/ /3/ /8/ /15/ /27/ /15/ /11/ /5/ /27/ /25/ /24/ /6/ /16/ /11/ /10/ /24/ /25/ /2/ /20/ /30/ /20/ /30/ /14/ /16/ /21/ /23/
78 2. Rank the peak flow discharges from highest to lowest. Rank cfs
79 3. Estimate the exceedance probability using the ranked values and the Weibull position formula. P = m n + 1 m = rank n = total number of values in this case n = 61
80 2. Rank the peak flow discharges from highest to lowest. Rank cfs
81 Example: for m = 15 P = m n + 1 m = rank n = total number of values P = = 0.24 The discharge for m = 15 is 36,000 cfs. This means that in any given year there is a 0.24 probability or a 24% chance of a peak flow occurring that will equal or exceed a Q of 36,000 cfs.
82 4. The exceedance probability can be used to estimate the return period of a certain peak flow (i.e., how often can we expect a certain magnitude flood?) Return Period = 1 P Example: for m = 15 where P = 0.24 Return Period = = 4.13 years The means that one can expect a flood with a peak flow of about 36,000 cfs every 4.13 years.

83 A 100-year flood is a flood that has a return period of 100 years OR a probability of 0.01 of occurring in any given year OR a 1% chance of occurring in any given year
84 Estimate the Discharge of a 100-year flood 1. Plot all the peak flows on the vertical axis (arithmetic scale) versus their respective return periods on the horizontal axis (log 10 scale).
85 Estimate the Discharge of a 100-year flood 2. Add a linear trend line to the data and extrapolate out in time.
86 Estimate the Discharge of a 100-year flood 3. Extrapolate out in time (100 years) and estimate the discharge.

87 100-year Floodplain Map
88 Estimate the stage of a 100-year flood Rating Curve Discharge (cfs) Gauge Height (feet)
89 22.76 feet

90
February 1996 rain-on-snow flood: looking to the westnorthwest across the Nisqually River delta from I-5. Pat Pringle photo.
 February 1996 rain-on-snow flood: looking to the westnorthwest across the Nisqually River delta from I-5. Pat Pringle photo. Big Thompson Canyon, east of Estes Park, Colorado; bouldery deposits of July
Flooding. April 21, Notes 4/20 CONGRATULATIONS!!!!! Activity 2: AZ State Museum due TODAY. Extra Credit 2: Returned at end of class
 April 21, 2011 Flooding 1927 Mississippi Flood Notes 4/20 Activity 2: AZ State Museum due TODAY Extra Credit 2: Returned at end of class CONGRATULATIONS!!!!! Andrew Richard Undergraduate Research Grant
SEVERE WEATHER 101. Flood Basics
 SEVERE WEATHER 101 Flood Basics What is flooding? Flooding is an overflowing of water onto land that is normally dry. Floods can happen during heavy rains, when ocean waves come on shore, when snow melts
A Synopsis of the December 1-4, 2007 Storm Events
 A Synopsis of the December 1-4, 27 Storm Events An aerial view of the flooded I-5 overpass looking south Flooding in Chehalis. (Associated Press ) Maryanne Reiter, Hydrologist Weyerhaeuser Co. The Wind
April snowmelt and record rainfall resulted in flooding across portions of Vermont
 Vermont State Climate Office Climate Impacts Summary April 2011 Dr. Lesley-Ann Dupigny-Giroux Stephen Hogan April snowmelt and record rainfall resulted in flooding across portions of Vermont During the
Floods. Floods COMMUNITY EMERGENCY RESPONSE TEAM FLOODS CONTENT INSTRUCTOR GUIDANCE
 Floods Floods Introduce this topic by explaining that floods are one of the most common hazards in the United States. A flood occurs any time a body of water rises to cover what is usually dry land. Display
REDWOOD VALLEY SUBAREA
 Independent Science Review Panel Conceptual Model of Watershed Hydrology, Surface Water and Groundwater Interactions and Stream Ecology for the Russian River Watershed Appendices A-1 APPENDIX A A-2 REDWOOD
Floods Lecture #21 20
 Floods 20 Lecture #21 What Is a Flood? Def: high discharge event along a river! Due to heavy rain or snow-melt During a flood, a river:! Erodes channel o Deeper & wider! Overflows channel o Deposits sediment
The Great USA Flood of 1993
 Destructive Water: Water-Caused Natural Disasters, their Abatement and Control (Proceedings of the Conference held at Anaheim, California, June 1996). IAHS Publ. no, 239, 1997. 13 The Great USA Flood of
COMMUNITY EMERGENCY RESPONSE TEAM FLOODS INTRODUCTION
 INTRODUCTION Floods are one of the most common hazards in the United States. A flood occurs any time a body of water rises to cover what is usually dry land. Flood effects can be local, impacting a neighborhood
ENGINEERING HYDROLOGY
 ENGINEERING HYDROLOGY Prof. Rajesh Bhagat Asst. Professor Civil Engineering Department Yeshwantrao Chavan College Of Engineering Nagpur B. E. (Civil Engg.) M. Tech. (Enviro. Engg.) GCOE, Amravati VNIT,
Flooding in Western North Carolina: Some Spatial, Hydrologic, and Seasonal Characteristics CAUTION!! Outline. Basic Flood Facts.
 Flooding in Western North Carolina: Some Spatial, Hydrologic, and Seasonal Characteristics J. Greg Dobson CAUTION!! National Environmental Modeling and Analysis Center RENCI at UNC-Asheville Engagement
L OWER N OOKSACK R IVER P ROJECT: A LTERNATIVES A NALYSIS A PPENDIX A: H YDRAULIC M ODELING. PREPARED BY: LandC, etc, LLC
 L OWER N OOKSACK R IVER P ROJECT: A LTERNATIVES A NALYSIS A PPENDIX A: H YDRAULIC M ODELING PREPARED BY: LandC, etc, LLC TABLE OF CONTENTS 1 Introduction... 1 2 Methods... 1 2.1 Hydraulic Model... 1 2.2
3/3/2013. The hydro cycle water returns from the sea. All "toilet to tap." Introduction to Environmental Geology, 5e
 Introduction to Environmental Geology, 5e Running Water: summary in haiku form Edward A. Keller Chapter 9 Rivers and Flooding Lecture Presentation prepared by X. Mara Chen, Salisbury University The hydro
CASE STUDY #9 - Brushy Fork Dam, Sugar Grove, West Virginia
 CASE STUDY #9 - Brushy Fork Dam, Sugar Grove, West Virginia Brushy Fork Dam is a flood control structure built by the Soil Conservation Service southeast of the city of Franklin in Pendleton County, West
GG101 Lecture 22: Mass Wasting. Soil, debris, sediment, and broken rock is called regolith.
 GG101 Lecture 22: Mass Wasting Mass Wasting is the movement of rock and soil down a slope due to the force of gravity. Soil, debris, sediment, and broken rock is called regolith. Mass wasting creates broad
Assessment of the Hood River Delta Hood River, Oregon
 Assessment of the Hood River Delta Hood River, Oregon Pacific Northwest Waterways Association Annual Meeting October 13, 2010 Michael McElwee, Executive Director Port of Hood River Overview U.S. Army Corps
Monthly Long Range Weather Commentary Issued: APRIL 18, 2017 Steven A. Root, CCM, Chief Analytics Officer, Sr. VP,
 Monthly Long Range Weather Commentary Issued: APRIL 18, 2017 Steven A. Root, CCM, Chief Analytics Officer, Sr. VP, sroot@weatherbank.com MARCH 2017 Climate Highlights The Month in Review The average contiguous
Kentucky Weather Hazards: What is Your Risk?
 Kentucky Weather Hazards: What is Your Risk? Stuart A. Foster State Climatologist for Kentucky 2010 Kentucky Weather Conference Bowling Green, Kentucky January 16, 2010 Perspectives on Kentucky s Climate
Flood Risk Assessment
 Flood Risk Assessment February 14, 2008 Larry Schick Army Corps of Engineers Seattle District Meteorologist General Assessment As promised, La Nina caused an active winter with above to much above normal
Which map shows the stream drainage pattern that most likely formed on the surface of this volcano? A) B)
 B)") 1. When snow cover on the land melts, the water will most likely become surface runoff if the land surface is A) frozen B) porous C) grass covered D) unconsolidated gravel Base your answers to questions
1. When snow cover on the land melts, the water will most likely become surface runoff if the land surface is A) frozen B) porous C) grass covered D) unconsolidated gravel Base your answers to questions
UGRC 144 Science and Technology in Our Lives/Geohazards
 UGRC 144 Science and Technology in Our Lives/Geohazards Flood and Flood Hazards Dr. Patrick Asamoah Sakyi Department of Earth Science, UG, Legon College of Education School of Continuing and Distance Education
GEOL 1121 Earth Processes and Environments
 GEOL 1121 Earth Processes and Environments Wondwosen Seyoum Department of Geology University of Georgia e-mail: seyoum@uga.edu G/G Bldg., Rm. No. 122 Seyoum, 2015 Chapter 6 Streams and Flooding Seyoum,
Ground Water Protection Council 2017 Annual Forum Boston, Massachusetts. Ben Binder (303)
") Ground Water Protection Council 2017 Annual Forum Boston, Massachusetts Protecting Groundwater Sources from Flood Borne Contamination Ben Binder (303) 860-0600 Digital Design Group, Inc. The Problem Houston
Ground Water Protection Council 2017 Annual Forum Boston, Massachusetts Protecting Groundwater Sources from Flood Borne Contamination Ben Binder (303) 860-0600 Digital Design Group, Inc. The Problem Houston
Debris flow: categories, characteristics, hazard assessment, mitigation measures. Hariklia D. SKILODIMOU, George D. BATHRELLOS
 Debris flow: categories, characteristics, hazard assessment, mitigation measures Hariklia D. SKILODIMOU, George D. BATHRELLOS Natural hazards: physical phenomena, active in geological time capable of producing
2016 Fall Conditions Report
 2016 Fall Conditions Report Prepared by: Hydrologic Forecast Centre Date: December 13, 2016 Table of Contents TABLE OF FIGURES... ii EXECUTIVE SUMMARY... 1 BACKGROUND... 5 SUMMER AND FALL PRECIPITATION...
2011 Flood: Technical Review of Lake Manitoba, Lake St. Martin and Assiniboine River Water Levels Summary
 2011 Flood: Technical Review of Lake Manitoba, Lake St. Martin and Assiniboine River Water Levels Summary October 2013 Introduction Manitoba experienced unprecedented flooding in 2011. While flooding was
Monthly Long Range Weather Commentary Issued: NOVEMBER 16, 2015 Steven A. Root, CCM, Chief Analytics Officer, Sr. VP, sales
 Monthly Long Range Weather Commentary Issued: NOVEMBER 16, 2015 Steven A. Root, CCM, Chief Analytics Officer, Sr. VP, sales sroot@weatherbank.com OCTOBER 2015 Climate Highlights The Month in Review The
High-Gradient Streams
 Chapter 4 Surface Processes Section 4 High-Gradient Streams What Do You See? Learning Outcomes In this section, you will Use models and real-time streamflow data to understand the characteristics of highgradient
SIGNIFICANT EVENTS Severe Storms November 1994 January 1996 August 1998 and May 2000 March 2002 May 2002 Champaign County
 SIGNIFICANT EVENTS Severe Storms November 1994 On Nov. 1, 1994, high winds gusted over 60 mph at times across the northwest third of Ohio. The highest measured wind gust was 63 mph at Columbus Grove (Putnam).
Remote Sensing-based Flood Mapping and Flood Hazard Assessment in Haiti
 www.dartmouth.edu/~floods/ csdms.colorado.edu Remote Sensing-based Flood Mapping and Flood Hazard Assessment in Haiti Rebuilding for Resilience: How Science and Engineering Can Inform Haiti's Reconstruction,
NATIONAL WEATHER SERVICE
 January 2016 February 9, 2016 This was a dry month across the HSA despite one large and several smaller snowfalls. Most locations ended up 1-2 inches below normal for the month. The driest locations at
Chapter 5 CALIBRATION AND VERIFICATION
 Chapter 5 CALIBRATION AND VERIFICATION This chapter contains the calibration procedure and data used for the LSC existing conditions model. The goal of the calibration effort was to develop a hydraulic
1927 Flood: Then and Now Elizabeth Stanley Mann Meghan Kirsch
 1927 Flood: Then and Now Elizabeth Stanley Mann Meghan Kirsch Abstract: This study surveys the 1927 flood effects in Bethel, Cambridge, Montpelier, and Winooski, Vermont. This was done through re-photographing
THE RECURRENCE INTERVAL
 Floods GEOG 366 THE RECURRENCE INTERVAL How often can a storm of a given magnitude be expected to recur? Calculate as follows: Take list of annual peak flows (largest flow each year) and rank them. R.I.
NRC Workshop Probabilistic Flood Hazard Assessment (PFHA) Jan 29-31, Mel Schaefer Ph.D. P.E. MGS Engineering Consultants, Inc.
 Jan 29-31, Mel Schaefer Ph.D. P.E. MGS Engineering Consultants, Inc.") Stochastic Event Flood Model (SEFM) Stochastic Modeling of Extreme Floods A Hydrological Tool for Analysis of Extreme Floods Mel Schaefer Ph.D. P.E. MGS Engineering Consultants, Inc. Olympia, WA NRC Workshop
Stochastic Event Flood Model (SEFM) Stochastic Modeling of Extreme Floods A Hydrological Tool for Analysis of Extreme Floods Mel Schaefer Ph.D. P.E. MGS Engineering Consultants, Inc. Olympia, WA NRC Workshop
Flood Inundation Mapping under different climate change scenarios in the upper Indus River Basin, Pakistan
 Flood Inundation Mapping under different climate change scenarios in the upper Indus River Basin, Pakistan Sohaib Baig (doctoral student) 16 November 2017 Disaster Prevention Research Institute 1 Kyoto
RR#5 - Free Response
 Base your answers to questions 1 through 3 on the data table below and on your knowledge of Earth Science. The table shows the area, in million square kilometers, of the Arctic Ocean covered by ice from
2015 Fall Conditions Report
 2015 Fall Conditions Report Prepared by: Hydrologic Forecast Centre Date: December 21 st, 2015 Table of Contents Table of Figures... ii EXECUTIVE SUMMARY... 1 BACKGROUND... 2 SUMMER AND FALL PRECIPITATION...
Low Low Water in Puget Sound vs. Mean Sea Level. What do the flood event gauge readings at Sedro Woolley really mean?
 Low Low Water in Puget Sound vs. Mean Sea Level What do the flood event gauge readings at Sedro Woolley really mean? When you make the adjustment of 8.93 feet to the published values and then subtract
The hydrologic service area (HSA) for this office covers Central Kentucky and South Central Indiana.
 for this office covers Central Kentucky and South Central Indiana.") MONTH YEAR January 2011 February 15, 2011 X An X inside this box indicates that no flooding occurred within this hydrologic service area. January 2011 was drier than normal in all locations in the area.
MONTH YEAR January 2011 February 15, 2011 X An X inside this box indicates that no flooding occurred within this hydrologic service area. January 2011 was drier than normal in all locations in the area.
Ecological Context - Urban settlements are part of their surrounding ecosystem. Austin
 Ecological Context - Urban settlements are part of their surrounding ecosystem Austin Ecotone Division between West and East Flyway Uplift River Balcones Escarpment Central Texas Climate The principal
Hydrology and Hydraulics Design Report. Background Summary
 To: National Park Services Montezuma Castle National Monument Richard Goepfrich, Facility Manager From: Multicultural Technical Engineers Date: Tuesday - February 13, 2018 Subject: 30% Hydrology and Hydraulics
Working with Natural Stream Systems
 Working with Natural Stream Systems Graydon Dutcher Delaware County Soil & Water Conservation District Stream Corridor Management Program Tropical Storm Sandy October 29,2012 What is a Watershed?
Watershed Detectives:
 Watershed Detectives: Making Science Relevant Jessica Gordon City of Austin Watershed Protection Jessica.Gordon@austintexas.gov Watershed Detectives: Making Science Relevant The Fish Kill Mystery Austin-based,
January 2011 Calendar Year Runoff Forecast
 January 2011 Calendar Year Runoff Forecast 2010 Runoff Year Calendar Year 2010 was the third highest year of runoff in the Missouri River Basin above Sioux City with 38.8 MAF, behind 1978 and 1997 which
2. PHYSICAL SETTING FINAL GROUNDWATER MANAGEMENT PLAN. 2.1 Topography. 2.2 Climate
 FINAL GROUNDWATER MANAGEMENT PLAN 2. PHYSICAL SETTING Lassen County is a topographically diverse area at the confluence of the Cascade Range, Modoc Plateau, Sierra Nevada and Basin and Range geologic provinces.
International Snow Science Workshop
 FLOOD FIGHT: THE PINEAPPLE EXPRESS AND FLOODING IN WESTERN WASHINGTON Larry Schick * U.S. Army Corps of Engineers, Seattle, Washington ABSTRACT: Major flood risk, in Western Washington, typically begins
Hydrologic Forecast Centre Manitoba Infrastructure, Winnipeg, Manitoba. FEBRUARY OUTLOOK REPORT FOR MANITOBA February 23, 2018
 Page 1 of 17 Hydrologic Forecast Centre Manitoba Infrastructure, Winnipeg, Manitoba FEBRUARY OUTLOOK REPORT FOR MANITOBA February 23, 2018 Overview The February Outlook Report prepared by the Hydrologic
David R. Vallee Hydrologist-in-Charge NOAA/NWS Northeast River Forecast Center
 David R. Vallee Hydrologist-in-Charge NOAA/NWS Northeast River Forecast Center Record flooding along the Shawsheen River during the 2006 Mother s Day Floods Calibrate and implement a variety of hydrologic
Stream Discharge and the Water Budget
 Regents Earth Science Unit 6: Water Cycle & Climate Name: Lab # Stream Discharge and the Water Budget Introduction: The United States Geological Survey (USGS) measures and publishes values for the daily
3.0 TECHNICAL FEASIBILITY
 3.0 TECHNICAL FEASIBILITY 3.1 INTRODUCTION To enable seasonal storage and release of water from Lake Wenatchee, an impoundment structure would need to be constructed on the lake outlet channel. The structure
Upper Missouri River Basin December 2017 Calendar Year Runoff Forecast December 5, 2017
 Upper Missouri River Basin December 2017 Calendar Year Runoff Forecast December 5, 2017 Calendar Year Runoff Forecast Explanation and Purpose of Forecast U.S. Army Corps of Engineers, Northwestern Division
Managing Floods at Boscastle. Learning Objective: Examine the benefits of managing floods
 Managing Floods at Boscastle Learning Objective: Examine the benefits of managing floods Learning Outcomes: Describe how Boscastle has been affected by flooding Explain strategies to reduce the risk Evaluate
PRELIMINARY DRAFT FOR DISCUSSION PURPOSES
 Memorandum To: David Thompson From: John Haapala CC: Dan McDonald Bob Montgomery Date: February 24, 2003 File #: 1003551 Re: Lake Wenatchee Historic Water Levels, Operation Model, and Flood Operation This
Crystal Moncada. California State University San Bernardino. January- July Brett R. Goforth- Department of Geography and Environmental Studies
 A Geographical Information System (GIS) Based Evaluation of Landslide Susceptibility Mapped on the Harrison Mountain Quadrangle of the Santa Ana River Watershed Crystal Moncada California State University
1 INTRODUCTION AND MAJOR FINDINGS... 1
 Memorandum To: Lindsey Clark, Stillwater Valley Watershed Council Coordinator From: Chad Raisland, Pioneer Technical Services, Inc. and Karin Boyd, Applied Geomorphology, Inc. CC: Tanya Lester, Stillwater
HyMet Company. Streamflow and Energy Generation Forecasting Model Columbia River Basin
 HyMet Company Streamflow and Energy Generation Forecasting Model Columbia River Basin HyMet Inc. Courthouse Square 19001 Vashon Hwy SW Suite 201 Vashon Island, WA 98070 Phone: 206-463-1610 Columbia River
9. PROBABLE MAXIMUM PRECIPITATION AND PROBABLE MAXIMUM FLOOD
 9. PROBABLE MAXIMUM PRECIPITATION AND PROBABLE MAXIMUM FLOOD 9.1. Introduction Due to the size of Watana Dam and the economic importance of the Project to the Railbelt, the Probable Maximum Flood (PMF)
Current Climate Trends and Implications
 Current Climate Trends and Implications Dr. Mark Seeley Professor emeritus Department of Soil, Water, and Climate University of Minnesota St Paul, MN 55108 Crop Insurance Conference September 12, 2018
Hydrologic Forecast Centre Manitoba Infrastructure, Winnipeg, Manitoba. MARCH OUTLOOK REPORT FOR MANITOBA March 23, 2018
 Page 1 of 21 Hydrologic Forecast Centre Manitoba Infrastructure, Winnipeg, Manitoba MARCH OUTLOOK REPORT FOR MANITOBA March 23, 2018 Overview The March Outlook Report prepared by the Hydrologic Forecast
Local Flood Hazards. Click here for Real-time River Information
 Local Flood Hazards Floods of the White River and Killbuck Creek are caused by runoff from general, and/or intense rainfall. Other areas of flooding concern are from the Boland Ditch and Pittsford Ditch.
11/21/2014. Erosion and Sedimentation Control Planning and Design Workshop December 2, 2014
 Erosion and Sedimentation Control Planning and Design Workshop December 2, 2014 1 A STATE PRIMARILY OF A SUBTROPICAL CLIMATE WEATHER PATTERNS COME PREDOMINATELY FROM THE WEST APPALACHIAN MTNS SHIELDS IT
Science of Natural Disasters: RIVERS& FLOODS! 27 April 2016
 Science of Natural Disasters: RIVERS& FLOODS! 27 April 2016 Rebecca Clotts Department of Geology, University of St Thomas Flood in St Paul, 2014, Star Tribune 1 2 What is a watershed? 3 4 5 6 7 What is
FLOOD/SCS EVENT, APRIL 28 MAY 4
 REPORT DATE: May 4, 2017 EVENT DATE: April 28-May 4, 2017 FLOOD/SCS EVENT, APRIL 28 MAY 4 Event Summary General Significant Flood Outlook. SOURCE: National Weather Service. A significant severe thunderstorm
Flood and emergency preparedness CARNATION DUVALL CITIZEN CORPS DUVALL KING COUNTY FIRE DISTRICT 45 SEPTEMBER 11, 2018
 Flood and emergency preparedness CARNATION DUVALL CITIZEN CORPS DUVALL KING COUNTY FIRE DISTRICT 45 SEPTEMBER 11, 2018 Let s get started Important info! Presenters Kathy Brasch, Carnation-Duvall Citizen
Monthly Long Range Weather Commentary Issued: SEPTEMBER 19, 2016 Steven A. Root, CCM, Chief Analytics Officer, Sr. VP,
 Monthly Long Range Weather Commentary Issued: SEPTEMBER 19, 2016 Steven A. Root, CCM, Chief Analytics Officer, Sr. VP, sroot@weatherbank.com SEPTEMBER 2016 Climate Highlights The Month in Review The contiguous
Title: Concepts of Flood Risk
 Title: Concepts of Flood Risk Title Prepared by: Dr. Mohammed Abdulkadir and Dr. Micha Werner Outline of presentation Hazards Flood Event Flood losses Classification of floods Flood management Concepts
Mass Wasting. Mass Wasting. Earth s s External Processes
 1 Mass Wasting Presentation Modified from Instructor Resource Center on CD-ROM, Foundations of Earth Science, 4 th Edition, Lutgens & Tarbuck Mass Wasting 2 Down-slope movement of rock, loose material
YELLOWSTONE RIVER FLOOD STUDY REPORT TEXT
 YELLOWSTONE RIVER FLOOD STUDY REPORT TEXT TECHNICAL REPORT Prepared for: City of Livingston 411 East Callender Livingston, MT 59047 Prepared by: Clear Creek Hydrology, Inc. 1627 West Main Street, #294
The hydrologic service area (HSA) for this office covers Central Kentucky and South Central Indiana.
 for this office covers Central Kentucky and South Central Indiana.") January 2012 February 13, 2012 An X inside this box indicates that no flooding occurred within this hydrologic service area. January 2012 continued the string of wet months this winter. Rainfall was generally
January 2012 February 13, 2012 An X inside this box indicates that no flooding occurred within this hydrologic service area. January 2012 continued the string of wet months this winter. Rainfall was generally
NWS FORM E-5 U.S. DEPARTMENT OF COMMERCE I HYDRO SERVICE AREA NOAA, NATIONAL WEATHER SERVICE I Indianapolis, IN MONTHLY REPORT
 NWS FORM E-5 U.S. DEPARTMENT OF COMMERCE I HYDRO SERVICE AREA NOAA, NATIONAL WEATHER SERVICE I Indianapolis, IN. 1-------------------- MONTHLY REPORT OF RIVER AND FLOOD CONDITIONSI REPORT FOR I November
Beyond the Book. FOCUS Book
 FOCUS Book Suppose your city wants to build a new housing development on a steep slope outside town. Design a model to test whether the land is safe from the types of landslides you read about in this
STREAM SYSTEMS and FLOODS
 STREAM SYSTEMS and FLOODS The Hydrologic Cycle Precipitation Evaporation Infiltration Runoff Transpiration Earth s Water and the Hydrologic Cycle The Hydrologic Cycle The Hydrologic Cycle Oceans not filling
Precipitation Evaporation Infiltration Earth s Water and the Hydrologic Cycle. Runoff Transpiration
 STREAM SYSTEMS and FLOODS The Hydrologic Cycle Precipitation Evaporation Infiltration Earth s Water and the Hydrologic Cycle Runoff Transpiration The Hydrologic Cycle The Hydrologic Cycle Oceans not filling
EMERGENCY WARNING SYSTEM PROCEDURES FOR DEBRIS FLOWS IN WESTERN OREGON
 EMERGENCY WARNING SYSTEM PROCEDURES FOR DEBRIS FLOWS IN WESTERN OREGON Updated: 12/03/2007 by the Oregon Department of Forestry and the Oregon Department of Geology and Mineral Industries Debris flows
Lecture 5: Precipitation
 Lecture 5: Precipitation Key Questions 1. What physical concepts control the formation of precipitation (air pressure, expanding gases and cooling, and vapor pressure)? 2. What are some air mass lifting
Results of Intensity-Duration- Frequency Analysis for Precipitation and Runoff under Changing Climate
 Results of Intensity-Duration- Frequency Analysis for Precipitation and Runoff under Changing Climate Supporting Casco Bay Region Climate Change Adaptation RRAP Eugene Yan, Alissa Jared, Julia Pierce,
Upper Missouri River Basin February 2018 Calendar Year Runoff Forecast February 6, 2018
 Upper Missouri River Basin February 2018 Calendar Year Runoff Forecast February 6, 2018 Calendar Year Runoff Forecast Explanation and Purpose of Forecast U.S. Army Corps of Engineers, Northwestern Division
Engineering Hydrology
 Engineering Hydrology Prof. Rajesh Bhagat Asst. Professor Civil Engineering Department Yeshwantrao Chavan College Of Engineering Nagpur B. E. (Civil Engg.) M. Tech. (Enviro. Engg.) GCOE, Amravati VNIT,
Monthly Long Range Weather Commentary Issued: SEPTEMBER 19, 2015 Steven A. Root, CCM, Chief Analytics Officer, Sr. VP, sales
 Monthly Long Range Weather Commentary Issued: SEPTEMBER 19, 2015 Steven A. Root, CCM, Chief Analytics Officer, Sr. VP, sales sroot@weatherbank.com AUGUST 2015 Climate Highlights The Month in Review The
Hydrologic Forecast Centre. Manitoba Infrastructure. Winnipeg, Manitoba FEBRUARY FLOOD OUTLOOK REPORT FOR MANITOBA.
 Page 1 of 20 Hydrologic Forecast Centre Manitoba Infrastructure Winnipeg, Manitoba FEBRUARY FLOOD OUTLOOK REPORT FOR MANITOBA February 28, 2019 Overview The February Outlook Report prepared by the Hydrologic
What Are Disasters? The Rescue Kids Trio!
 The Rescue Kids Trio! What Are Disasters? This manual was made possible through funding by the Council of Local Authorities for International Relations. Disasters and emergency preparedness Emergency preparedness
2017 Fall Conditions Report
 2017 Fall Conditions Report Prepared by: Hydrologic Forecast Centre Date: November 15, 2017 Table of Contents TABLE OF FIGURES... ii EXECUTIVE SUMMARY... 1 BACKGROUND... 4 SUMMER AND FALL PRECIPITATION...
Prepared By: John Blair Sean Donahue Celeste Hoffman Kimberly Klinkers Megan Slater
 Prepared By: John Blair Sean Donahue Celeste Hoffman Kimberly Klinkers Megan Slater Green River Basin Location Green River Basin Stratigraphic Correlation Chart showing Study Map Units Sample of Existing
Tracking the Salt Front
 Tracking the Salt Front Students will use Hudson River salinity data to practice math skills as they track movements of the salt front in response to storms and other weather events. Objectives: Students
EFFICIENCY OF THE INTEGRATED RESERVOIR OPERATION FOR FLOOD CONTROL IN THE UPPER TONE RIVER OF JAPAN CONSIDERING SPATIAL DISTRIBUTION OF RAINFALL
 EFFICIENCY OF THE INTEGRATED RESERVOIR OPERATION FOR FLOOD CONTROL IN THE UPPER TONE RIVER OF JAPAN CONSIDERING SPATIAL DISTRIBUTION OF RAINFALL Dawen YANG, Eik Chay LOW and Toshio KOIKE Department of
Las Colonias Subdivision September 2010 Flood Study
 Las Colonias Subdivision September 2010 Flood Study Curtis Beitel, P.E., CFM Scott Muchard, P.E. Project Engineer William Badini, CFM Senior Meteorologist Location Map Background Los Colonias Subdivision
Heavy Rain and Potential for Dangerous Flooding for northeast SC and southeast NC
 US National Weather Service Wilmington NC @NWSWilmingtonNC http://weather.gov/ilm ***Life Threatening Flooding Possible*** Heavy Rain and Potential for Dangerous Flooding for northeast SC and southeast
3/8/17. #20 - Landslides: Mitigation and Case Histories. Questions for Thought. Questions for Thought
 #20 - Landslides: Mitigation and Case Histories Web Exercise #3 (Volcanoes) Due Wednesday There is a 2-point penalty for every day the assignment is late. Exam 1 Scores Scores and exam key are posted Vaiont
WATER ON AND UNDER GROUND. Objectives. The Hydrologic Cycle
 WATER ON AND UNDER GROUND Objectives Define and describe the hydrologic cycle. Identify the basic characteristics of streams. Define drainage basin. Describe how floods occur and what factors may make
 Red River Flooding June 2015 Caddo and Bossier Parishes Presented by: Flood Technical Committee Where the Rain Falls Matters I-30 versus I-20 I-20 Backwater and Tributary Floods (Localized) 2016 Flood
Weather Briefing. Coastal Storm Monday-Wednesday Dec 8-10, National Weather Service. Prepared 12/8/14 6:30 AM
 Weather Briefing Coastal Storm Monday-Wednesday Dec 8-10, 2014 National Weather Service http://www.weather.gov/nyc Prepared 12/8/14 6:30 AM Overview of Potential Hazards A strong low pressure system will
A Prepared Marylander Creates a Resilient Maryland
 Maryland Emergency Management Agency Operations Directorate Hazardous Winter Weather Outlook Briefing March 5, 2013 0800 A Prepared Marylander Creates a Resilient Maryland A strong low pressure will track
Hydrologic Briefing Tropical Storm Harvey
 Hydrologic Briefing Tropical Storm Harvey 10:30 AM CDT Sunday, August 27, 2017 Prepared by: John Metz NWSCorpus www.weather.gov/corpuschristi Situation Overview Tropical Storm Harvey Harvey to remain a
LAKE WHATCOM WATER AND SEWER DISTRICT COMPREHENSIVE SEWER PLAN UPDATE EXHIBIT N. STUDY AREA CHARACTERISTICS
 LAKE WHATCOM WATER AND SEWER DISTRICT COMPREHENSIVE SEWER PLAN - 2014 UPDATE EXHIBIT N. STUDY AREA CHARACTERISTICS EXHIBIT N - STUDY AREA CHARACTERISTICS A. Sudden Valley Sudden Valley is a planned community
Stop 1: Marmot Dam Stop 1: Marmot Dam
 Stop 1: Marmot Dam Stop 1: Marmot Dam Following the removal of Marmot Dam in 2007, the fate of the reservoir sediments has been monitored through a series of surveys and sediment transport measurements.
Appendix C Fluvial Flood Hazards
 Appendix C Fluvial Flood Hazards Sea Level Rise Vulnerability Assessment and Adaptation Project March 2019 Contents Contents... i Figures... i Tables... i Definitions, Acronyms, & Abbreviations... ii
SECTION II Hydrological risk
 Chapter 3 Understanding disaster risk: hazard related risk issues SECTION II Hydrological risk Peter Salamon Coordinating lead author Hannah Cloke Lead author 3.4 Giuliano di Baldassarre Owen Landeg Florian
Using Weather and Climate Information for Landslide Prevention and Mitigation
 Using Weather and Climate Information for Landslide Prevention and Mitigation Professor Roy C. Sidle Disaster Prevention Research Institute Kyoto University, Japan International Workshop on Climate and