APPENDIX B DRAINAGE REPORT
|
|
|
- Erik Newman
- 5 years ago
- Views:
Transcription

1 APPENDIX B DRAINAGE REPORT B-1
2 South Lamar Blvd. Transportation Corridor Study Drainage Report Prepared for: City of Austin and HDR, Inc. Prepared by: and Services, Inc. Final Michael C. Meriwether, P.E. #58563 Date Austin Office Cameron Road, Austin, TX (O) (F) State of Texas Registered Firm No. F-3572
3 Background The South Lamar Transportation Corridor Study identifies short-, medium-, and long-term transportation projects to improve safety; increase vehicular, pedestrian and bicycle mobility and accessibility; and improve quality of life for the corridor. and Services, Inc. (CAS), serving as a subconsultant to HDR, Inc., was tasked with studying the existing drainage conditions and proposing solutions for areas that are out of compliance with the city requirements. These solutions coordinate with the overall South Lamar Blvd. improvements developed with the Transportation Corridor Study. The focus of the drainage study is along South Lamar Blvd. and its right of way, extending from Ben White Blvd (US 290) to Lady Bird Lake. CAS was also tasked with providing an order of magnitude opinion of probable construction cost for drainage related items. Data Collection Data collection included performing a site visit and obtaining GIS data, the hydraulic models accepted by the City of Austin (COA), and record drawings. A site visit was performed in February 2015 to identify the major drainage crossings, inlets, and flow patterns. COA GIS information was obtained from the City of Austin Development Web Map, including the storm drain, zoning, land use, and watershed boundaries. Current hydraulic models (US Army Corp of Engineers HEC-RAS models), made available by the COA, were received for the West Bouldin Creek and Lady Bird Lake watersheds. The Lady Bird Lake model provided maximum water surface elevations for the 10-yr, 50-yr, 100-yr, and 500-yr storm frequency events. Record drawings for projects along South Lamar Blvd. were obtained through the city. Several recent projects and site plans along the study corridor were identified for drainage information. Flow lines were estimated for old storm sewer lines with incomplete data. A list of record drawings that served as sources of data for this study is provided in Appendix A. Evaluation Criteria The COA Drainage Criteria Manual (DCM) provides guidance for current city requirements for drainage systems and structures. This study will determine whether the following criteria are met: COA DCM section B states that street curbs, gutters, inlets and storm sewers shall be designed to intercept, contain, and transport all runoff from the 25-year frequency storm. COA DCM section states that the 25-year hydraulic grade line (HGL) shall remain six inches below the theoretical gutter flow line of the storm drain inlets. COA DCM section D states that for bridges and culverts in streets other than residential, runoff from the 100 year frequency storm shall not produce a headwater elevation at the roadway greater than six inches above the crown or six inches above any top of upstream curb elevation, whichever is lower. Drainage System Identification 1
4 South Lamar Blvd. between US 290 and Lady Bird Lake is located within three watersheds with most of the study area within West Bouldin Creek watershed. The watersheds drain from south to north, discharging in Lady Bird Lake. Fifteen drainage systems consisting of pipes and culverts were identified along South Lamar Blvd., based on data from a site visit, the COA storm drain GIS data and record drawings. A map of the location of the drainage systems and major existing drainage structures is provided in Appendix B. Table 1 summarizes the locations of each system's major conveyance structure along South Lamar Blvd., its watershed, and the type of data source used to identify its level of service or used to model and analyze the system. Table 1. Identified Drainage Systems along South Lamar Blvd. Drainage System Location Along S. Lamar Blvd. US 290 to Panther Trail West Side US 290 to Panther Trail East Side Panther Trail to Westforest Drive Westforest Drive to Barton Skyway Barton Skyway to Bluebonnet Drive Bluebonnet Drive to Kinney Road Watershed Barton Creek Barton Creek West Bouldin Creek Barton Creek West Bouldin Creek West Bouldin Creek Data Source COA Development Web Map COA Development Web Map Record Drawings & COA Dev. Web Map Record Drawings & COA Dev. Web Map COA Development Web Map Record Drawings & COA Dev. Web Map 7 Kinney Road to Oltorf Street West Bouldin Creek COA StormCAD 8 Oltorf Street to Hether Street West Bouldin Creek COA StormCAD 9 Collier Street Area West Bouldin Creek COA StormCAD 10 Lamar Square to Treadwell West Bouldin Creek COA StormCAD 11 Treadwell Street to Bluff Street 12 Bluff Street to Barton Springs Road West Bouldin Creek West Bouldin Creek COA StormCAD Record Drawings & COA StormCAD 13 Barton Springs Road West Bouldin Creek COA StormCAD 14 Barton Springs Road to Toomey Road 15 Toomey Road to Riverside Drive West Bouldin Creek Lady Bird Lake Record Drawings & COA StormCAD Record Drawings & COA Dev. Web Map 2

5 A description of each of the fifteen drainage systems follows. Land use for the study area is a mix of commercial, multi-family and single-family residences with commercial properties fronting Lamar and residential properties behind. Note that although South Lamar Blvd. is generally aligned from southwest to northeast, for the purposes of this narrative South Lamar Blvd was considered to run south to north with Barton Creek to the west and West Bouldin Creek to the east. System 1 This network consists of 1980 feet of 18 RCP and five curb inlets along the west side of S. Lamar Blvd. beginning at Panther Trail and draining south towards Ben White Blvd. This feeds into additional larger pipes in TxDOT ROW that outfall into Barton Creek Watershed. System 2 This network mirrors System 1 on the east side of S. Lamar Blvd and consists of 2021 feet of 24 to 48 RCP and five curb inlets with additional laterals feeding in from commercial developments to the east. This also feeds into additional larger pipes in TxDOT ROW that connect to the same outfall as System 1. 3

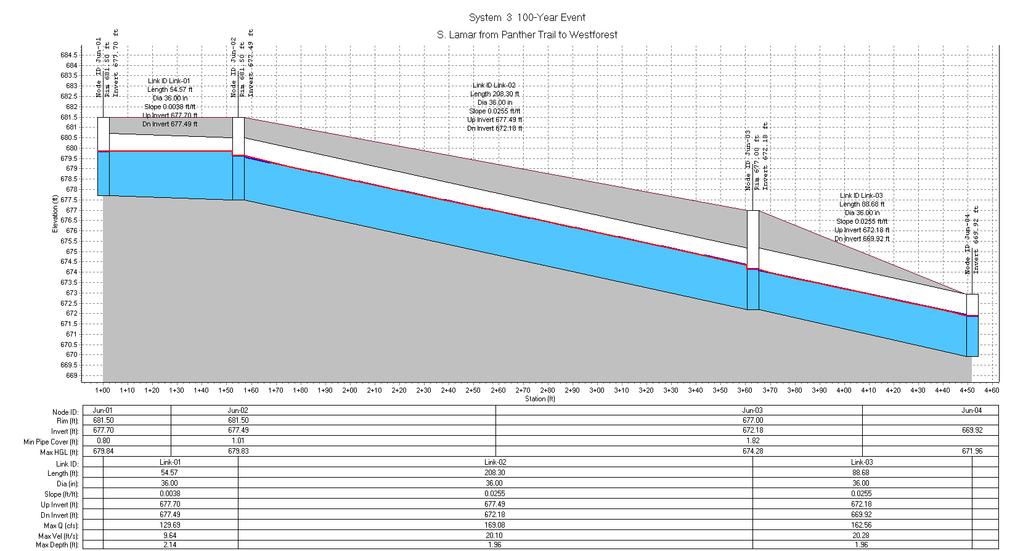
6 System 3 This system consists of a 4 x3 box culvert crossing Lamar from west to east about 500 south of Westrock. It drains 21 acres of land on the west side of Lamar, runs under a recently constructed apartment complex and outfalls into the West Bouldin Creek Watershed. Plans were found in DRG-5- A

7 System 4 System 4 crosses South Lamar from east to west via a 2 x2 box culvert and then runs north along Lamar for 330 feet through a 30 RCP before turning west to outfall into Barton Creek Watershed. Partial plans were found in SSM-B

8 System 5 System 5 runs north along Lamar from Barton Skyway to Bluebonnet collecting flows from residential and commercial areas on both sides of Lamar. The main line consists of 574 feet of 18 to 24 RCP along the east side of Lamar. There are two laterals feeding the system from the west: a 4 x1.5 box culvert crossing Lamar at La Casa and another 4 x1.5 box culvert crossing Lamar at Bluebonnet. The system then turns east at Bluebonnet and outfalls into a tributary of West Bouldin Creek Watershed via a 30 RCP. 6

9 System 6 System 6 collects flows from an area between Bluebonnet and Kinney. The main line consists of 850 feet of dual 24 RCP along the west side of Lamar. After crossing Lamar at Kinney, the 2-24 RCP feed into a 6 x1.5 box culvert that runs east into a tributary of West Bouldin Creek Watershed. Plans were found in SSM-B and SSM-B

10 System 7 System 7 drains the Lamar ROW from Kinney to Oltorf via street surface flow until just south of Oltorf where inlets on both sides of the road capture the flow. The west side inlet feeds an 18 RCP that increases to a 4 x1.5 box culvert that crosses Lamar at Oltorf and transitions back to 18 RCP. The system than picks up the flow from an 18 RCP that drains the east side inlet and runs east via a 21 RCP in Oltorf St. The system outfalls into West Bouldin Creek at Oltorf St. Partial plans were found in PPC-1-A

11 System 8 System 8 drains the Hether St. area and consists of dual 4 x4 box culverts that cross Lamar from west to east about 250 north of Hether St. The culverts daylight at a vertical headwall at the east edge of Lamar ROW in the West Bouldin Creek Watershed. Plans were found in DRG-5-A-540. System 9 System 9 drains the Collier St. area and crosses Lamar via a 24 RCP at Collier St. The system also includes a curb inlet about 140 feet north of Collier St. that captures flow extending 1200 feet north on Lamar to Lamar Square. This inlet feeds an 18 RCP that crosses Lamar from west to east, joins with the main 24 RCP and transitions to a 36 RCP that outfalls in a drainage ditch parallel to the Union Pacific Railroad ROW. Plans were found in DRG-1-A


12 System 10 System 10 encompasses the area from Lamar Square to Treadwell and crosses Lamar at Treadwell via 24 RCP. The 24 RCP runs east along Treadwell and outfalls into the drainage ditch parallel to the Union Pacific Railroad ROW. Plans were found in SSM-B System 11 System 11 drains an area on the west side of Lamar bounded by Bluff St., Jessie St. and Treadwell St. The system crosses Lamar from west to east at Bluff St. via a 36 RCP that daylights into West Bouldin Creek. 10

13 System 12 System 12 drains both sides of Lamar from Bluff to Barton Springs Road and consists of 643 feet of 18 to 48 RCP. The main line runs down the center of Lamar and then turns east at Barton Springs Road where it transitions to a 54 RCP that outfalls into West Bouldin Creek at Barton Springs Road. Plans were found in PPC-1-A System 13 System 13 drains Barton Springs Road west of Lamar. It crosses Lamar via a 54 RCP that runs parallel to the System 12 main. It also outfalls into West Bouldin Creek at Barton Springs Road. Plans were found in PPC-1-A

14 System 14 System 14 drains both sides of Lamar from Barton Springs Road to Toomey and consists of about 940 feet of 18 to 36 RCP. The main line runs down the center of Lamar and then turns east about 100 feet north of Barton Springs Road where it transitions to a 42 RCP that crosses under Lee Barton Road and outfalls into a ditch leading to West Bouldin Creek. Plans were found in PPC-1-A System 15 System 15 drains both sides of Lamar from Toomey to Riverside and includes about 100 feet of 18 RCP in the Lamar ROW. The main line starts at a curb inlet on the west side of Lamar, crosses Lamar, connects to another curb inlet and runs parallel to Riverside Drive and outfalls into Lady Bird Lake. Partial plans were found in PPC-1-A
15 Analysis Methodology In order to determine whether the drainage systems are in compliance, the evaluation focused on: the capacity of major drainage structures to convey the 25-year storm event; the 25-year hydraulic grade line remaining six inches below the theoretical gutter flow line of the storm drain inlets; the water surface elevation at the bridge or culvert upstream face to be within the allowable 100- year event overtopping depth of six inches above the crown or any top of upstream curb elevation, whichever is lower. Compliance with city code for the 15 systems was determined by either identifying the level of service in the City-provided StormCAD model, reviewing recent record drawings, or if recent documentation was not found, modeling the system with storm sewer analysis software. The evaluation of Systems 8 through 14 is documented in the City-provided StormCAD model. Systems 1 through 7 were evaluated using Autodesk Storm and Sanitary Analysis 2015 software (Autodesk SSA). This analysis does not evaluate for the capacity of storm drain inlets and the resulting spread, nor the capacity and velocity within the lateral lines of the storm drain systems. Due to the small size of System 15, pipe capacity was evaluated using Manning s equation. Model generation within Autodesk SSA requires determining the pipe invert elevations, pipe lengths, outfall information, and the network configuration. These parameters were based on record drawing information and reasonable assumptions based on ground elevations where no flowline information was available. Inlets were modeled as junctions to avoid identifying street and curb inlet details, which is beyond the scope of this study. Discharges for the 25-year storm event were determined using the Rational Method. Calculation of discharge required several steps. Drainage areas for each system were delineated based on COA 2-ft contours. Time of concentration values were calculated using COA DCM guidelines for determination of sheet flow, shallow concentrated and channel flow. Manning's n values for sheet flow and overland flow calculations were determined using existing conditions zoning maps and the land use. Rational method runoff coefficient C values were based on the maximum allowable impervious cover percentages as listed in the COA s zoning ordinance and maps. Calculations and data for the existing conditions analysis, including discharges, time of concentration calculations, and Rational Method parameters can be found in Appendix C. Existing Conditions Analysis This section summarizes the evaluation of existing drainage systems along South Lamar Blvd. A plan view schematic of the Autodesk SSA results is provided. The Autodesk SSA program identifies pipes that are surcharged or junctions with hydraulic grade lines that exceed the rim or ground elevation with the color red. The program considers pipes surcharged if the ratio of maximum flow depth to total depth exceeds one. Pipe capacity is exceeded if the ratio of maximum flow to design flow exceeds one. The existing drainage systems were modeled only within the South Lamar Transportation Corridor Study 13
16 area. Where systems extended well beyond the study area, the system was modeled to a point where down-gradient conditions no longer have an effect on the drainage systems in the study area. System 1 Analysis with Autodesk SSA shows that this system does not meet criteria for a 25-yr level of service. As summarized in Table 1A, the modeled system is surcharged (pipes are running full) during the 25-yr storm event at the third pipe in the system. Pipes 3 thru 5 need to be upsized to 24 diameter. Table 1A. System 1 Existing Conditions Results Pipe Design Peak Flow Dia. or Pipe Flow Peak Flow/ Depth/ Pipe Height Width Capacity Design Flow Total Depth Reported Pipe Shape (in) (in) (cfs) Ratio Ratio Condition Link-01 CIRCULAR Calculated Link-02 CIRCULAR Calculated Link-03 CIRCULAR SURCHARGED Link-04 CIRCULAR > CAPACITY Link-05 CIRCULAR > CAPACITY Figure 1. System 1 Existing Conditions Results Schematic 14
17 System 2 Analysis with Autodesk SSA shows that this system does not meet criteria for a 25-yr level of service. As summarized below in Figure 2 and Table 2, the modeled system is surcharged (pipes are running full) during the 25-yr storm event for Pipes 2 and 3 and Pipe 4 is over capacity. Pipes 2, 3 and 4 need to be upsized to 30, 36 and 42 diameter, respectively. Table 2. System 2 Existing Conditions Results Pipe Design Peak Flow Dia. or Pipe Flow Peak Flow/ Depth/ Pipe Height Width Capacity Design Flow Total Depth Reported Pipe Shape (in) (in) (cfs) Ratio Ratio Condition Link-01 CIRCULAR Calculated Link-02 CIRCULAR SURCHARGED Link-03 CIRCULAR SURCHARGED Link-04 CIRCULAR > CAPACITY Link-05 CIRCULAR Calculated Link-06 CIRCULAR Calculated Link-07 CIRCULAR Calculated Figure 2. System 2 Existing Conditions Results Schematic 15
18 System 3 Analysis with Autodesk SSA shows that the entire system meets the criteria for a 25-yr level of service. Although the modeled 3 x4 box culvert is over capacity for the 25-year storm event as summarized below in Figure 3 and Table 3, the hydraulic grade line criteria is met for the entire system. The 100- year flow is cfs and the box culvert needs to be upsized to 3 x6 to carry this flow. Table 3. System 3 Existing Conditions Results Pipe Design Peak Flow Dia. or Pipe Flow Peak Flow/ Depth/ Pipe Height Width Capacity Design Flow Total Depth Reported Pipe Shape (in) (in) (cfs) Ratio Ratio Condition Link-01 Rectangular > CAPACITY Link-02 Rectangular Calculated Link-03 Rectangular Calculated Figure 1. System 3 Existing Conditions Results Schematic 16
19 System 4 Analysis with Autodesk SSA shows that Pipes 2 and 3 do not meet criteria for a 25-yr level of service. As summarized below in Figure 4 and Table 4, pipes 2 and 3 are surcharged. In addition, the system has a 30 inch pipe flowing into a 27 inch pipe that in turn flows into a 24 inch pipe. This condition violates the DCM rule prohibiting larger diameter pipes flowing into smaller diameter pipes. Pipe 1 needs to be upsized from 15 to 18 diameter to meet the minimum pipe size requirement of the DCM. Table 2. System 4 Existing Conditions Results Pipe Design Peak Flow Dia. or Pipe Flow Peak Flow/ Depth/ Pipe Height Width Capacity Design Flow Total Depth Reported Pipe Shape (in) (in) (cfs) Ratio Ratio Condition Link-01 CIRCULAR Calculated Link-02 CIRCULAR SURCHARGED Link-03 CIRCULAR SURCHARGED Link-04 CIRCULAR Calculated Link-05 Rectangular Calculated Figure 2. System 4 Existing Conditions Results Schematic 17
20 System 5 Analysis with Autodesk SSA shows that the majority of the system meets criteria for a 25-yr level of service. Results, as summarized below in Figure 5 and Table 5, show that 25-yr storm event peak flows do not exceed pipe design flow capacity for the system, except at Pipes 1 and 2. These two pipes need to be upsized to 24 diameter. Pipes 7 and 8 cross Lamar Blvd. Table 3. System 5 Existing Conditions Results Pipe Design Peak Flow Dia. or Pipe Flow Peak Flow/ Depth/ Pipe Height Width Capacity Design Flow Total Depth Reported Pipe Shape (in) (in) (cfs) Ratio Ratio Condition Link-01 CIRCULAR SURCHARGED Link-02 CIRCULAR SURCHARGED Link-03 CIRCULAR Calculated Link-04 CIRCULAR Calculated Link-05 CIRCULAR Calculated Link-06 CIRCULAR Calculated Link-07 Rectangular Calculated Link-08 Rectangular Calculated Figure 3. System 5 Existing Conditions Results Schematic 18
21 System 6 Analysis with Autodesk SSA shows that this system does not meet criteria for a 25-yr level of service. As summarized below in Figure 2 and Table 3, the modeled system is surcharged (pipes are running full) during the 25-yr storm event for Pipes 1 and 2. The links shown as red lines in Figure 6 indicate that Pipes 3 through 7 need to be upsized as well. New sizes are: Pipe 1 30 ; Pipe 2 30 ; Pipe 3 30 ; Pipe 4 36 ; Pipe 5 42 ; Pipe 6 42 ; and Pipe 7 30 x72. Existing and proposed Pipes 1 through 6 are dual barrels. Table 6. System 6 Existing Conditions Results Pipe Design Peak Flow Dia. or Pipe Flow Peak Flow/ Depth/ Pipe Height Width Capacity Design Flow Total Depth Reported Pipe Shape (in) (in) (cfs) Ratio Ratio Condition Link-01 CIRCULAR SURCHARGED Link-02 CIRCULAR SURCHARGED Link-03 CIRCULAR Calculated Link-04 CIRCULAR Calculated Link-05 CIRCULAR Calculated Link-06 CIRCULAR Calculated Link-07 Rectangular Calculated Link-08 CIRCULAR Calculated Figure 6. System 6 Existing Conditions Results Schematic 19
22 System 7 Analysis with Autodesk SSA shows that the entire system meets the criteria for a 25-yr level of service. Although Pipe 4 is over capacity for the 25-year storm event as summarized below in Figure 7 and Table 7, the hydraulic grade line criteria is met for the entire system. Table 7. System 7 Existing Conditions Results Pipe Design Peak Flow Dia. or Pipe Flow Peak Flow/ Depth/ Pipe Height Width Capacity Design Flow Total Depth Reported Pipe Shape (in) (in) (cfs) Ratio Ratio Condition Link-01 CIRCULAR Calculated Link-02 Rectangular Calculated Link-03 CIRCULAR Calculated Link-04 CIRCULAR > CAPACITY Figure 7. System 7 Existing Conditions Results Schematic 20
23 System 8 System 8 was analyzed by the City using StormCAD. Line (dual 4 x4 box culvert) is undersized for the 25-year event. This line crosses Lamar and daylights at a headwall on the east ROW of Lamar. In order to accommodate the increased width of the proposed ideal roadway section, the headwall would need to be moved back 10 feet to the east and the box culverts extended to match. In addition, two 4 x4 box culverts would need to be added to satisfy the capacity requirements. Lateral line (18 RCP) is also undersized per the analysis and would need to be upsized to 30 diameter. Table 8. System 8 Existing Conditions Results Label Element Flow (cfs) Message Source Conduit Conduit discharge is above design discharge. Hydraulics Validation Conduit Conduit discharge is above design discharge. Hydraulics Validation Figure 8. System 8 Existing Conditions Schematic 21
24 System 9 System 9 was analyzed by the City using StormCAD. Lines (24 RCP), (36 RCP) and (18 RCP) are undersized for the 25-year event. Using Manning s equation, the proposed lines crossing Lamar (Conduit and 13840) need to be 30 and 36 diameter and Line running parallel to Lamar needs to be upsized to 42 diameter. Table 9. System 9 Existing Conditions Results Label Element Flow (cfs) Message Source Conduit Conduit discharge is above design discharge. Hydraulics Validation Conduit Conduit discharge is above design discharge. Hydraulics Validation Conduit Conduit discharge is above design discharge. Hydraulics Validation Figure 9. System 9 Existing Conditions Schematic 22
25 System 10 System 10 was analyzed by the City using StormCAD. Lines (18 RCP) and (24 RCP) are undersized for the 25-year event. To meet capacity requirements, the lines need to be upsized to 24 and 30 respectively. Conduit crosses Lamar Blvd. Table 10. System 10 Existing Conditions Results Label Element Flow (cfs) Message Source Conduit Conduit discharge is above design discharge. Hydraulics Validation Conduit None Conduit Conduit discharge is above design discharge. Hydraulics Validation Figure 10. System 10 Existing Conditions Schematic 23
26 System 11 System 11 was analyzed by the City using StormCAD. The results show that existing pipes and (both 36 RCP) have adequate capacity for the 25-year storm. Pipe needs to be upsized to 42 diameter to carry the 100-year flows (Q100= cfs). Conduit crosses Lamar Blvd. Table 11. System 11 Existing Conditions Results Label Element Flow (cfs) Message Source Conduit None Hydraulics Validation Conduit None Hydraulics Validation Figure 11. System 11 Existing Conditions Schematic 24
27 System 12 System 12 was analyzed by the City using StormCAD. The results show that existing pipe (30 RCP) is undersized for the 25-year storm and pipe (42 RCP) is oversized for minimum velocity. A review of the approved plans (PPC-1-A-7801) shows that pipes and meet the criteria of the DCM. The system experiences pressure flow in some cases, but the HGL is below pavement. No changes to this system are needed. Conduit crosses Lamar Blvd. Table 12. System 12 Existing Conditions Results Label Element Flow (cfs) Message Source Conduit Conduit discharge is above design discharge. Hydraulics Validation Conduit None Hydraulics Validation Conduit None Hydraulics Validation Conduit Conduit does not meet min. velocity constraint. Hydraulics Validation Conduit None Hydraulics Validation Figure 12. System 12 Existing Conditions Schematic 25
28 System 13 System 13 was analyzed by the City using StormCAD. This system was designed in 1992 to carry 135 cfs at the Lamar crossing. In 2000, the City constructed a bypass to the west that reduced the flow to 28 cfs. As a result, the pipes (54 RCP) are oversized and the velocity is below 2.5 fps. No changes to this system are needed. Conduit and cross Lamar Blvd. Table 13. System 13 Existing Conditions Results Label Element Flow (cfs) Message Source Conduit Conduit does not meet min. velocity constraint. Hydraulics Validation Conduit Conduit does not meet min. velocity constraint. Hydraulics Validation Figure 13. System 13 Existing Conditions Schematic 26
29 System 14 System 14 was analyzed by the City using StormCAD. This system design was approved by the City in 1992 despite having pressure flow in the trunk line. The HGL is above pavement level but this can be attributed in part to backwater effects from West Bouldin Creek. Upsizing the pipes in this system will have minimal effect and are not recommended. A solution that merits further study is diverting the flows from the west into System 13. Conduit crosses Lamar Blvd. Table 14. System 14 Existing Conditions Results Label Element Flow (cfs) Message Source Conduit Conduit discharge is above design discharge. Hydraulics Validation Conduit Conduit discharge is above design discharge. Hydraulics Validation Conduit Conduit discharge is above design discharge. Hydraulics Validation Conduit Conduit discharge is above design discharge. Hydraulics Validation Figure 14. System 14 Existing Conditions Schematic 27
30 System 15 Analysis with Autodesk SSA shows that the entire system meets the criteria for a 25-yr level of service. Although Pipe 4 is over capacity for the 25-year storm event as summarized below in Figure 15 and Table 15, the hydraulic grade line criteria is met for the entire system. Flow line elevations were assumed for System 15 as the record drawings did not have this information. Link 06 and 07 cross Lamar Blvd. Table 15. System 15 Existing Conditions Results Pipe Design Peak Flow Dia. or Pipe Flow Peak Flow/ Depth/ Pipe Height Width Capacity Design Flow Total Depth Reported Pipe Shape (in) (in) (cfs) Ratio Ratio Condition Link-06 CIRCULAR Calculated Link-07 CIRCULAR Calculated Link-08 CIRCULAR Calculated Link-09 CIRCULAR > CAPACITY Figure 4. System 15 Existing Conditions Results Schematic 28
31 Drainage System Do the major drainage structure(s) have capacity to convey the 25-yr event? Table 16. Summary of Existing Systems Is the 25-year hydraulic grade line six inches or less below the theoretical gutter flow line of the storm drain inlets? Is the water surface elevation at the bridge or culvert upstream face within the allowable 100-year event overtopping depth of six inches above the crown or any top of upstream curb elevation, whichever is lower? Is the COA criteria met? 1 no no ---- no 2 no no ---- no 3 yes yes no no 4 no no ---- no 5 no no ---- no 6 no no ---- no 7 yes yes ---- yes 8 no no no no 9 no no ---- no 10 no no ---- no 11 no no ---- no 12 no no ---- no 13 yes no ---- no 14 no no ---- no 15 yes yes ---- yes A summary of the hydrology calculations is found in Appendix C. A copy of the existing conditions Autodesk SSA analysis output is found in Appendix D. Proposed Improvements The transportation configuration proposed for South Lamar Blvd. will require modification of existing major storm drain systems due to reconfiguring the roadway. Most existing inlets and lateral lines will need to be replaced. Assuming the proposed roadway drains outward toward the right of way lines, the storm drain design includes the upsizing the existing lines as needed and adding trunk lines and laterals to connect to proposed curb inlets. 29
32 Table 4. Summary of Existing Major Drainage Structures and Proposed Improvements Drainage Existing Conditions Proposed Conditions System Existing Structures Evaluation Summary Proposed Improvement 1 18" RCP Design capacity<peak flow Replace with 1004 LF of 24" RCP 2 24" RCP, 30" RCP, 36" RCP, 42" RCP Design capacity<peak flow Replace with 909 LF of 30" to 48" RCP 3 3'X4' Box Culvert Design capacity<peak flow Replace with 55 LF of 3'x6' Box Culvert 4 15" RCP, 24" RCP, 27" RCP, 30" RCP, 2'x2' Box Culvert Design capacity<peak flow, larger diameter pipe drains to smaller diameter pipe 5 18" RCP, 24" RCP, 30" RCP Design capacity<peak flow " RCP, 1.5'X4' Box Culvert Design capacity<peak flow 11 36" RCP Design capacity<peak flow Design capacity>peak flow but street is inundated by West Bouldin Creek (inside 12 18" TO 54" RCP 25- & 100-year flood plain) Replace with 255 LF of 30" RCP Replace with 909 LF of 24" to 36" RCP Replace with 943 LF of 30" to 42" RCP & 2.5'x6' Box Culvert 7 18" RCP, 21" RCP, 1.5'X4' Box Culvert Meets code 'X4' Box Culverts Design capacity<peak flow Add two 4'X4' Box Culverts - 78 LF 9 18" RCP, 24" RCP, 36 RCP Design capacity<peak flow Replace with 238 LF of 30 TO 42 RCP 10 15" RCP, 18" RCP, 24" RCP Design capacity<peak flow Replace with 217 LF of 18" to 30" RCP Replace with 152 LF of 42" RCP Need to reduce West Bouldin Creek flooding - out of project scope See comment for 13 54" RCP Same as 12 System 12 See comment for 14 18" TO 36" RCP Same as 12 System " RCP Meets code --- Discharge calculations for proposed analysis can be found in Appendix E. A map of the location of the storm sewer systems is found in Appendix B, Exhibits 1 & 2. Detention and Water Quality Treatment Requirements The COA DCM states that peak flow rates under proposed development must be returned to existing peak flow rates as considered from a point of discharge. Controlling the peak flow rates can be done by either storage on-site or off-site (detention pond) or by participation in an approved Regional Stormwater Management Program (RSMP). To participate in the RSMP a fee is required based on the impervious acres and includes a cost for construction and land. Currently, West Bouldin Creek is not included in the list of watersheds eligible for participation in the RSMP per DCM If storm water runoff peak flow rates increase within the right of way due to the increase in impervious cover, then detention will be 30
33 required. Since raised, landscaped medians will be added where currently pavement exists it is not anticipated that detention will be required for this project. Water quality treatment is required if the proposed project increases the impervious cover amount. Sidewalks are excluded from impervious cover calculations for the purposes of water quality requirements. It is not anticipated that water quality treatment will be required for this project. Cost Estimate Drainage-related items included in the cost estimate are box culverts, pipes, inlets, headwalls, and manholes. The cost of pavement trench repair and non-drainage items such as traffic control and sedimentation/erosion control were assumed to be covered under the roadway cost estimate. Sources of cost were City of Austin bid tabs, and TxDOT bid information. Several design assumptions were made to determine the cost estimate for the drainage systems. The lateral lines draining from the inlet to the trunk line are assumed as 18" RCP. Lateral pipe sizes for the trunk will increase towards the system's major structure, starting at no more than 300 feet from the system's drainage divide. Inlets were assumed to be spaced 300 feet apart along the trunk line. Lateral pipe lengths were determined based on the location of the inlet with respect to the proposed typical section. The drainage system's trunk line segments were sized based on the number of inlets feeding into each segment. Headwalls were required if replacement or extension of the major structure was required. Storm sewer manholes were added to account for the DCM manhole spacing requirements. The order of magnitude opinion of probable construction cost is $3.13 million. A breakdown of costs are provided in Table 18. Table 5. Cost Estimate for Drainage-Related Items Item Units Quantity Unit Cost Cost 18" RCP LF 4260 $75 $319,475 24" RCP LF 5402 $90 $486,140 30" RCP LF 4345 $105 $456,187 36" RCP LF 2772 $120 $332,668 42" RCP LF 568 $135 $76,645 48" RCP LF 258 $195 $50, " RCP LF 847 $180 $152,383 30"x72" box culvert LF 96 $300 $28,836 36"x72" box culvert LF 55 $450 $24,557 48"x48" box culvert LF 196 $250 $49,000 Headwalls EA 1 $10,000 $10,000 Inlets EA 90 $5,300 $477,000 Manholes EA 10 $4,000 $40,000 Subtotal $2,503,260 25% Contingency $625,815 Total Cost $3,12,
34 APPENDIX A Data Sources
35 Record Drawings SSM-B Storm Sewer on South Lamar Blvd. from Kinney Road to Bluebonnet Lane, 1958 SSM-B Storm Sewer on Kinney Road Easement from South Lamar Blvd. to south of Thornton Road, 1959 SSM-B Storm Sewer on Treadwell Street from South Lamar Blvd. east 467 feet, 1959 SSM-B Storm Sewer on South Lamar Blvd. from Barton Skyway 160 north to 240 south, 1957 DRG-5-A-540 Miscellaneous Storm Sewers on Hether Street, Kinney Ave., Bauerle Ave., and Goodrich Ave., 1960 DRG-5-A-1019 Plan & Profile of 4 x3 Box Culvert for Jay Johnson Enterprises, prepared by Bury & Pittman, Inc., 1986 PPC-1-A-5952 Storm Sewer on Collier Street at South Lamar Blvd., 1969 PPC-1-A-5962 Storm Sewer on South Lamar Blvd. at Westrock Drive, 1969 PPC-1-A-5969 Storm Sewer on West Oltorf Street at South Lamar Blvd. DRG-1-A-6833 Shepherd Tract Drainage and Fill Plans, prepared by O.W. Holmes, 1980 PPC-1-A-7801 South Lamar Blvd./Barton Springs Road Intersection Improvements, prepared by HDR Engineering, Inc., 1992 PPC-1-A-7934 TSM Improvements, South Lamar at Oltorf Street, prepared by COA PW, 1990 SPL-SP State Farm Insurance Service Center, prepared by Clayton Rutter Engineers, Inc., 1986 SPL-SP C Wells Fargo Bank, 3931 S. Lamar, prepared by Prossner and Associates, Inc., 2011
36 APPENDIX B Exhibit 1 Existing Storm Sewer Systems (1 of 2) Exhibit 2 - Existing Storm Sewer Systems (2 of 2)
37 LEGEND C F ITY OU O N F A D E D U S TIN 1839 CITY OF AUSTIN SOUTH LAMAR TRANSPORTATION CORRIDOR STUDY EXHIBIT 1 EXISTING STORM SEWER SYSTEMS SHEET 1 OF 2
38 LEGEND C F ITY OU O N F A D E D U S TIN 1839 CITY OF AUSTIN SOUTH LAMAR TRANSPORTATION CORRIDOR STUDY EXHIBIT 2 EXISTING STORM SEWER SYSTEMS SHEET 2 OF 2
39 APPENDIX C Summary of Hydrology Calculations
40 Table 19. Calculated 25-Year Peak Flow Rates for Sub-basins for Storm Drain Analysis 25-Year Storm Event Drainage System Basins Area (ac) Time of Concentration, tc (min) Intensity, I (in/hr) Runoff Coefficient, C Ultimate Conditions Discharge, Q=CIA (cfs) Q/Acre A B A B A B C A B C A B C D E A B C D E F A B A B
41 Table 20. Calculated 100-Year Peak Flow Rates for Sub-basins for Storm Drain Analysis 100-Year Storm Event Drainage System Basins Area (ac) Time of Concentration, tc (min) Intensity, I (in/hr) Runoff Coefficient, C Ultimate Conditions Discharge, Q=CIA (cfs) Q/Acre A B A B A B C A B C A B C D E A B C D E F A B

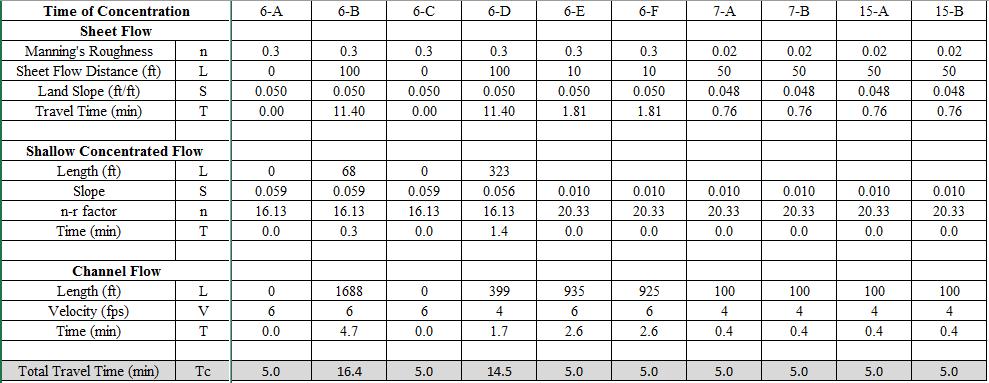
42 Table 21. Time of Concentration
43 APPENDIX D Exhibit 3 Drainage Area Map (1 of 2) Exhibit 4 Drainage Area Map (2 of 2) Existing Conditions Autodesk Storm and Sewer Analysis Output
44 LEGEND C F ITY OU O N F A D E D U S TIN 1839 CITY OF AUSTIN SOUTH LAMAR TRANSPORTATION CORRIDOR STUDY EXHIBIT 3 DRAINAGE AREA MAP SHEET 1 OF 2
45 LEGEND C F ITY OU O N F A D E D U S TIN 1839 CITY OF AUSTIN SOUTH LAMAR TRANSPORTATION CORRIDOR STUDY EXHIBIT 4 DRAINAGE AREA MAP SHEET 2 OF 2
46 Project Description File Name... System 1.SPF Description... S. Lamar Corridor System 1 Node Summary Lamar from Panther to US west side SN Element Element Invert Ground/Rim Initial Surcharge Ponded Peak Max HGL Max Min Time of Total Total Time ID Type Elevation (Max) Water Elevation Area Inflow Elevation Surcharge Freeboard Peak Flooded Flooded Elevation Elevation Attained Depth Attained Flooding Volume Attained Occurrence (ft) (ft) (ft) (ft) (ft²) (cfs) (ft) (ft) (ft) (days hh:mm) (ac-in) (min) 1 Jun-01 Junction : Jun-02 Junction : Jun-03 Junction : Jun-04 Junction : Jun-05 Junction : Out-01 Outfall Junction Input SN Element Invert Ground/Rim Ground/Rim Initial Initial Surcharge Surcharge Ponded Minimum ID Elevation (Max) (Max) Water Water Elevation Depth Area Pipe Elevation Offset Elevation Depth Cover (ft) (ft) (ft) (ft) (ft) (ft) (ft) (ft²) (in) 1 Jun Jun Jun Jun Jun Junction Results SN Element Peak Peak Max HGL Max HGL Max Min Average HGL Average HGL Time of Time of Total Total Time ID Inflow Lateral Elevation Depth Surcharge Freeboard Elevation Depth Max HGL Peak Flooded Flooded Inflow Attained Attained Depth Attained Attained Attained Occurrence Flooding Volume Attained Occurrence (cfs) (cfs) (ft) (ft) (ft) (ft) (ft) (ft) (days hh:mm) (days hh:mm) (ac-in) (min) 1 Jun : : Jun : : Jun : : Jun : : Jun : : Pipe Input SN Element Length Inlet Inlet Outlet Outlet Total Average Pipe Pipe Pipe Manning's Initial No. of ID Invert Invert Invert Invert Drop Slope Shape Diameter or Width Roughness Flow Barrels Elevation Offset Elevation Offset Height (ft) (ft) (ft) (ft) (ft) (ft) (%) (in) (in) (cfs) 1 Link CIRCULAR Link CIRCULAR Link CIRCULAR Link CIRCULAR Link CIRCULAR Pipe Results SN Element Peak Design Flow Peak Flow/ Peak Flow Peak Flow Peak Flow Reported ID Flow Capacity Design Flow Velocity Depth Depth/ Condition Ratio Total Depth Ratio (cfs) (cfs) (ft/sec) (ft) 1 Link Calculated 2 Link Calculated 3 Link SURCHARGED 4 Link > CAPACITY 5 Link > CAPACITY
47 Project Description File Name... System 2.SPF Description... S. Lamar Corridor Study System 2 from Panther Lane to US 290 Rainfall Details Return Period year(s) Node Summary SN Element Element Invert Ground/Rim Initial Surcharge Ponded Peak Max HGL Max Min Time of Total Total Time ID Type Elevation (Max) Water Elevation Area Inflow Elevation Surcharge Freeboard Peak Flooded Flooded Elevation Elevation Attained Depth Attained Flooding Volume Attained Occurrence (ft) (ft) (ft) (ft) (ft²) (cfs) (ft) (ft) (ft) (days hh:mm) (ac-in) (min) 1 Jun-01 Junction : Jun-02 Junction : Jun-03 Junction : Jun-04 Junction : Jun-05 Junction : Jun-06 Junction : Jun-07 Junction : Jun-08 Outfall Link Summary SN Element Element From To (Outlet) Length Inlet Outlet Average Diameter or Manning's Peak Design Flow Peak Flow/ Peak Flow Peak Flow Peak Flow Total Time Reported ID Type (Inlet) Node Invert Invert Slope Height Roughness Flow Capacity Design Flow Velocity Depth Depth/ Surcharged Condition Node Elevation Elevation Ratio Total Depth Ratio (ft) (ft) (ft) (%) (in) (cfs) (cfs) (ft/sec) (ft) (min) 1 Link-01 Pipe Jun-01 Jun Calculated 2 Link-02 Pipe Jun-02 Jun SURCHARGED 3 Link-03 Pipe Jun-03 Jun SURCHARGED 4 Link-04 Pipe Jun-04 Jun > CAPACITY 5 Link-05 Pipe Jun-05 Jun Calculated 6 Link-06 Pipe Jun-06 Jun Calculated 7 Link-07 Pipe Jun-07 Jun Calculated Junction Input SN Element Invert Ground/Rim Ground/Rim Initial Initial Surcharge Surcharge Ponded Minimum ID Elevation (Max) (Max) Water Water Elevation Depth Area Pipe Elevation Offset Elevation Depth Cover (ft) (ft) (ft) (ft) (ft) (ft) (ft) (ft²) (in) 1 Jun Jun Jun Jun Jun Jun Jun Junction Results SN Element Peak Peak Max HGL Max HGL Max Min Average HGL Average HGL Time of Time of Total Total Time ID Inflow Lateral Elevation Depth Surcharge Freeboard Elevation Depth Max HGL Peak Flooded Flooded Inflow Attained Attained Depth Attained Attained Attained Occurrence Flooding Volume Attained Occurrence (cfs) (cfs) (ft) (ft) (ft) (ft) (ft) (ft) (days hh:mm) (days hh:mm) (ac-in) (min) 1 Jun : : Jun : : Jun : : Jun : : Jun : : Jun : : Jun : :
48 Pipe Input SN Element Length Inlet Inlet Outlet Outlet Total Average Pipe Pipe Pipe Manning's Entrance Exit/Bend Additional Initial Flap No. of ID Invert Invert Invert Invert Drop Slope Shape Diameter or Width Roughness Losses Losses Losses Flow Gate Barre Elevation Offset Elevation Offset Height (ft) (ft) (ft) (ft) (ft) (ft) (%) (in) (in) (cfs) 1 Link CIRCULAR No 1 2 Link CIRCULAR No 1 3 Link CIRCULAR No 1 4 Link CIRCULAR No 1 5 Link CIRCULAR No 1 6 Link CIRCULAR No 1 7 Link CIRCULAR No 1 Pipe Results SN Element Peak Time of Design Flow Peak Flow/ Peak Flow Travel Peak Flow Peak Flow Total Time Froude Reported ID Flow Peak Flow Occurrence Capacity Design Flow Ratio Velocity Time Depth Depth/ Surcharged Number Condition Total Depth Ratio (cfs) (days hh:mm) (cfs) (ft/sec) (min) (ft) (min) 1 Link : Calculated 2 Link : SURCHARGED 3 Link : SURCHARGED 4 Link : > CAPACITY 5 Link : Calculated 6 Link : Calculated 7 Link : Calculated
49 Project Description File Name... System 3.SPF Description... S. Lamar from Panther Trail to Westforest Rainfall Details Return Period year(s) Node Summary SN Element Element Invert Ground/Rim Initial Surcharge Ponded Peak Max HGL Max Min Time of Total Total Time ID Type Elevation (Max) Water Elevation Area Inflow Elevation Surcharge Freeboard Peak Flooded Flooded Elevation Elevation Attained Depth Attained Flooding Volume Attained Occurrence (ft) (ft) (ft) (ft) (ft²) (cfs) (ft) (ft) (ft) (days hh:mm) (ac-in) (min) 1 Jun-01 Junction : Jun-02 Junction : Jun-03 Junction : Jun-04 Outfall Link Summary SN Element Element From To (Outlet) Length Inlet Outlet Average Diameter or Manning's Peak Design Flow Peak Flow/ Peak Flow Peak Flow Peak Flow Total Time Reported ID Type (Inlet) Node Invert Invert Slope Height Roughness Flow Capacity Design Flow Velocity Depth Depth/ Surcharged Condition Node Elevation Elevation Ratio Total Depth Ratio (ft) (ft) (ft) (%) (in) (cfs) (cfs) (ft/sec) (ft) (min) 1 Link-01 Pipe Jun-01 Jun > CAPACIT Y 2 Link-02 Pipe Jun-02 Jun Calculated 3 Link-03 Pipe Jun-03 Jun Calculated
50 S. Lamar Corridor Study System 3 - Panther Trail to Westforest Junction Input SN Element Invert Ground/Rim Ground/Rim Initial Initial Surcharge Surcharge Ponded Minimum ID Elevation (Max) (Max) Water Water Elevation Depth Area Pipe Elevation Offset Elevation Depth Cover (ft) (ft) (ft) (ft) (ft) (ft) (ft) (ft²) (in) 1 Jun Jun Jun Junction Results SN Element ID Peak Peak Max HGL Max HGL Max Min Average HGL Average HGL Inflow Lateral Elevation Depth Surcharge Freeboard Elevation Depth Inflow Attained Attained Depth Attained Attained Attained Attained (cfs) (cfs) (ft) (ft) (ft) (ft) (ft) (ft) Time of Max HGL Occurrence Time of Total Total Time Peak Flooded Flooded Flooding Volume Occurrence (days hh:mm) (ac-in) (min) (days hh:mm) 1 Jun : : Jun : : Jun : : Pipe Input SN Element Length Inlet Inlet Outlet Outlet Total Average Pipe Pipe Pipe Manning's Entrance Exit/Bend Additional Initial Flap No. of ID Invert Invert Invert Invert Drop Slope Shape Diameter or Width Roughness Losses Losses Barrels Elevation Offset Elevation Offset Height (ft) (ft) (ft) (ft) (ft) (ft) (%) (in) (in) (cfs) 1 Link Rectangular No 1 2 Link Rectangular No 1 3 Link Rectangular No 1 Pipe Results SN Element Peak Time of Design Flow Peak Flow/ Peak Flow Travel Peak Flow Peak Flow Total Time Froude Reported ID Flow Peak Flow Capacity Design Flow Velocity Time Depth Depth/ Surcharged Number Condition Occurrence Ratio Total Depth Ratio (cfs) (days hh:mm) (cfs) (ft/sec) (min) (ft) (min) 1 Link : > CAPACITY 2 Link : Calculated 3 Link : Calculated
51 Project Description File Name... System 4.SPF Description... S. Lamar from Westforest to Barton Skyway Rainfall Details Return Period... 2 year(s) Node Summary SN Element Element ID Type (ft) (ft) (ft) (ft) (ft²) (cfs) (ft) (ft) (ft) (days hh:mm) (ac-in) (min) 1 Jun-01 Junction : Jun-02 Junction : Jun-03 Junction : Jun-04 Junction : Jun-05 Junction : Jun-06 Junction : Link Summary SN Element Element From To (Outlet) Length Inlet Outlet Average Diameter or Manning's Peak Design Flow Peak Flow/ Peak Flow Peak Flow Peak Flow Total Time Reported ID Type (Inlet) Node Invert Invert Slope Height Roughness Flow Capacity Design Flow Velocity Depth Depth/ Surcharged Condition Node Elevation Elevation Ratio Total Depth Ratio (ft) (ft) (ft) (%) (in) (cfs) (cfs) (ft/sec) (ft) (min) 1 Link-01 Pipe Jun-06 Jun Calculated 2 Link-02 Pipe Jun-01 Jun SURCHARGED 3 Link-03 Pipe Jun-03 Jun SURCHARGED 4 Link-04 Pipe Jun-04 Jun Calculated 5 Link-05 Pipe Jun-02 Jun Calculated Junction Input SN Element Invert Ground/Rim Ground/Rim Initial Initial Surcharge Surcharge Ponded Minimum ID Elevation (Max) (Max) Water Water Elevation Depth Area Pipe Elevation Offset Elevation Depth Cover (ft) (ft) (ft) (ft) (ft) (ft) (ft) (ft²) (in) 1 Jun Jun Jun Jun Jun Jun Junction Results SN Element Peak Peak Max HGL Max HGL Max Min Average HGL Average HGL Time of Time of Total Total Time ID Inflow Lateral Elevation Depth Surcharge Freeboard Elevation Depth Max HGL Peak Flooded Flooded Inflow Attained Attained Depth Attained Attained Attained Occurrence Flooding Volume Attained Occurrence (cfs) (cfs) (ft) (ft) (ft) (ft) (ft) (ft) (days hh:mm) (days hh:mm) (ac-in) (min) 1 Jun : : Jun : : Jun : : Jun : : Jun : : Jun : : Pipe Input Invert Ground/Rim Initial Surcharge Ponded Peak Max HGL Max Min Elevation (Max) Water Elevation Area Inflow Elevation Surcharge Freeboard Elevation Elevation Attained Depth Attained Attained Time of Total Total Time Peak Flooded Flooded Flooding Volume Occurrence SN Element Length Inlet Inlet Outlet Outlet Total Average Pipe Pipe Pipe Manning's Entrance Exit/Bend Additional Initial Flap No. of ID Invert Invert Invert Invert Drop Slope Shape Diameter or Width Roughness Losses Losses Losses Flow Gate Barrels Elevation Offset Elevation Offset Height (ft) (ft) (ft) (ft) (ft) (ft) (%) (in) (in) (cfs) 1 Link CIRCULAR No 1 2 Link CIRCULAR No 1 3 Link CIRCULAR No 1 4 Link CIRCULAR No 1 5 Link Rectangular No 1
52 Pipe Results SN Element Peak Time of Design Flow Peak Flow/ Peak Flow Travel Peak Flow Peak Flow Total Time Froude Reported ID Flow Peak Flow Capacity Design Flow Velocity Time Depth Depth/ Surcharged Number Condition Occurrence Ratio Total Depth Ratio (cfs) (days hh:mm) (cfs) (ft/sec) (min) (ft) (min) 1 Link : Calculated 2 Link : SURCHARGED 3 Link : SURCHARGED 4 Link : Calculated 5 Link : Calculated
53 Project Description File Name... System 5.SPF Description... S. Lamar from La Casa to Bluebonnet System 5 Node Summary SN Element ID Element Type Invert Ground/Rim Initial Surcharge Ponded Peak Max HGL Max Min Time of Total Total Time Elevation (Max) Water Elevation Area Inflow Elevation Surcharge Freeboard Peak Flooded Flooded Elevation Elevation Attained Depth Attained Flooding Volume Attained Occurrence (ft) (ft) (ft) (ft) (ft²) (cfs) (ft) (ft) (ft) (days hh:mm) (ac-in) (min) 1 Jun-01 Junction : Jun-02 Junction : Jun-03 Junction : Jun-04 Junction : Jun-05 Junction : Jun-06 Junction : Jun-07 Junction : Jun-08 Junction : Out-01 Outfall Junction Input SN Element Invert Ground/Rim Ground/Rim Initial Initial Surcharge Surcharge Ponded Minimum ID Elevation (Max) (Max) Water Water Elevation Depth Area Pipe Elevation Offset Elevation Depth Cover (ft) (ft) (ft) (ft) (ft) (ft) (ft) (ft²) (in) 1 Jun Jun Jun Jun Jun Jun Jun Jun Junction Results SN Element Peak Peak Max HGL Max HGL Max Min Average HGL Average HGL Time of Time of Total Total Time ID Inflow Lateral Elevation Depth Surcharge Freeboard Elevation Depth Max HGL Peak Flooded Flooded Inflow Attained Attained Depth Attained Attained Attained Occurrence Flooding Volume Attained Occurrence (cfs) (cfs) (ft) (ft) (ft) (ft) (ft) (ft) (days hh:mm) (days hh:mm) (ac-in) (min) 1 Jun : : Jun : : Jun : : Jun : : Jun : : Jun : : Jun : : Jun : : Pipe Input SN Element Length Inlet Inlet Outlet Outlet Total Average Pipe Pipe Pipe Manning's Entrance Exit/Bend Additional Initial Flap No. of ID Invert Invert Invert Invert Drop Slope Shape Diameter or Width Roughness Losses Losses Losses Flow Gate Barrels Elevation Offset Elevation Offset Height (ft) (ft) (ft) (ft) (ft) (ft) (%) (in) (in) (cfs) 1 Link CIRCULAR No 1 2 Link CIRCULAR No 1 3 Link CIRCULAR No 1 4 Link CIRCULAR No 1 5 Link CIRCULAR No 1 6 Link CIRCULAR No 1 7 Link Rectangular No 1 8 Link Rectangular No 1
54 Pipe Results SN Element Peak Time of Design Flow Peak Flow/ Peak Flow Travel Peak Flow Peak Flow Total Time Froude Reported ID Flow Peak Flow Occurrence Capacity Design Flow Ratio Velocity Time Depth Depth/ Surcharged Number Condition Total Depth Ratio (cfs) (days hh:mm) (cfs) (ft/sec) (min) (ft) (min) 1 Link : SURCHARGED 2 Link : SURCHARGED 3 Link : Calculated 4 Link : Calculated 5 Link : Calculated 6 Link : Calculated 7 Link : Calculated 8 Link : Calculated
55 System 6 S. Lamar from Del Curto to Kinney Project Description File Name... System 6.SPF Description... S. Lamar from Del Curto to Kinney Rainfall Details Return Period year(s)ode Summary SN Element ID Element Type Invert Ground/Rim Initial Surcharge Peak Elevation (Max) Water Elevation Inflow Elevation Elevation Max HGL Max Min Elevation Surcharge Freeboard Attained Depth Attained Attained (ft) (ft) (ft) Time of Total Total Time Peak Flooded Flooded Flooding Volume Occurrence (days hh:mm) (ac-in) (min) (ft) (ft) (ft) (ft) (cfs) 1 Jun-01 Junction : Jun-02 Junction : Jun-03 Junction : Jun-04 Junction : Jun-05 Junction : Jun-06 Junction : Jun-07 Junction : Jun-08 Junction : Out-01 Outfall System 6 S. Lamar from Del Curto to Kinney Link Summary SN Element Element From To (Outlet) Length Inlet Outlet Average Diameter or Manning's Peak Design Flow Peak Flow/ Peak Flow Peak Flow Peak Flow Total Time Reported ID Type (Inlet) Node Invert Invert Slope Height Roughness Flow Capacity Design Flow Velocity Depth Depth/ Surcharged Condition Node Elevation Elevation Ratio Total Depth Ratio (ft) (ft) (ft) (%) (in) (cfs) (cfs) (ft/sec) (ft) (min) 1 Link-01 Pipe Jun-01 Jun SURCHARGED 2 Link-02 Pipe Jun-02 Jun SURCHARGED 3 Link-03 Pipe Jun-03 Jun SURCHARGED 4 Link-04 Pipe Jun-04 Jun SURCHARGED 5 Link-05 Pipe Jun-05 Jun SURCHARGED 6 Link-06 Pipe Jun-06 Jun SURCHARGED 7 Link-07 Pipe Jun-07 Jun SURCHARGED 8 Link-08 Pipe Jun-08 Out Calculated Junction Input SN Element Invert Ground/Rim Ground/Rim Initial Initial Surcharge Surcharge Ponded Minimum ID Elevation (Max) (Max) Water Water Elevation Depth Area Pipe Elevation Offset Elevation Depth Cover (ft) (ft) (ft) (ft) (ft) (ft) (ft) (ft²) (in) 1 Jun Jun Jun Jun Jun Jun Jun Jun Junction Results SN Element Peak Peak Max HGL Max HGL Max Min Average HGL Average HGL Time of Time of Total Total Time ID Inflow Lateral Elevation Depth Surcharge Freeboard Elevation Depth Max HGL Peak Flooded Flooded Inflow Attained Attained Depth Attained Attained Attained Occurrence Flooding Volume Attained Occurrence (cfs) (cfs) (ft) (ft) (ft) (ft) (ft) (ft) (days hh:mm) (days hh:mm) (ac-in) (min) 1 Jun : : Jun : : Jun : : Jun : : Jun : : Jun : : Jun : : Jun : :
56 System 6 S. Lamar from Del Curto to Kinney Pipe Input SN Element Length Inlet Inlet Outlet Outlet Total Average Pipe Pipe Pipe Manning's Entrance Exit/Bend Additional Initial Flap No. of ID Invert Invert Invert Invert Drop Slope Shape Diameter or Width Roughness Losses Losses Barrels Elevation Offset Elevation Offset Height (ft) (ft) (ft) (ft) (ft) (ft) (%) (in) (in) (cfs) 1 Link CIRCULAR No 2 2 Link CIRCULAR No 2 3 Link CIRCULAR No 2 4 Link CIRCULAR No 2 5 Link CIRCULAR No 2 6 Link CIRCULAR No 2 7 Link Rectangular No 1 8 Link CIRCULAR No 1 Pipe Results SN Element Peak Time of Design Flow Peak Flow/ Peak Flow Travel Peak Flow Peak Flow Total Time Froude Reported ID Flow Peak Flow Occurrence Capacity Design Flow Ratio Velocity Time Depth Depth/ Surcharged Number Condition Total Depth Ratio (cfs) (days hh:mm) (cfs) (ft/sec) (min) (ft) (min) 1 Link : SURCHARGED 2 Link : SURCHARGED 3 Link : SURCHARGED 4 Link : SURCHARGED 5 Link : SURCHARGED 6 Link : SURCHARGED 7 Link : SURCHARGED 8 Link : Calculated
57 Project Description File Name... System 15.SPF Description... S. Lamar Corridor System 15 Rainfall Details Return Period year(s) Node Summary SN Element Element Invert Ground/Rim Initial Surcharge Ponded Peak Max HGL Max Min Time of Total Total Time ID Type Elevation (Max) Water Elevation Area Inflow Elevation Surcharge Freeboard Peak Flooded Flooded Elevation Elevation Attained Depth Attained Flooding Volume Attained Occurrence (ft) (ft) (ft) (ft) (ft²) (cfs) (ft) (ft) (ft) (days hh:mm) (ac-in) (min) 1 Jun-06 Junction : Jun-07 Junction : Jun-08 Junction : Jun-09 Junction : Out-02 Outfall Link Summary SN Element Element From To (Outlet) Length Inlet Outlet Average Diameter or Manning's Peak Design Flow Peak Flow/ Peak Flow Peak Flow Peak Flow Total Time Reported ID Type (Inlet) Node Invert Invert Slope Height Roughness Flow Capacity Design Flow Velocity Depth Depth/ Surcharged Condition Node Elevation Elevation Ratio Total Depth Ratio (ft) (ft) (ft) (%) (in) (cfs) (cfs) (ft/sec) (ft) (min) 1 Link-06 Pipe Jun-06 Jun Calculated 2 Link-07 Pipe Jun-07 Jun Calculated 3 Link-08 Pipe Jun-08 Jun Calculated 4 Link-09 Pipe Jun-09 Out > CAPACITY Junction Input SN Element Invert Ground/Rim Ground/Rim Initial Initial Surcharge Surcharge Ponded Minimum ID Elevation (Max) (Max) Water Water Elevation Depth Area Pipe Elevation Offset Elevation Depth Cover (ft) (ft) (ft) (ft) (ft) (ft) (ft) (ft²) (in) 1 Jun Jun Jun Jun Junction Results SN Element Peak Peak Max HGL Max HGL Max Min Average HGL Average HGL Time of Time of Total Total Time ID Inflow Lateral Elevation Depth Surcharge Freeboard Elevation Depth Max HGL Peak Flooded Flooded Inflow Attained Attained Depth Attained Attained Attained Occurrence Flooding Volume Attained Occurrence (cfs) (cfs) (ft) (ft) (ft) (ft) (ft) (ft) (days hh:mm) (days hh:mm) (ac-in) (min) 1 Jun : : Jun : : Jun : : Jun : : Pipe Input SN Element Length Inlet Inlet Outlet Outlet Total Average Pipe Pipe Pipe Manning's Entrance Exit/Bend Additional Initial Flap No. of ID Invert Invert Invert Invert Drop Slope Shape Diameter or Width Roughness Losses Losses Barrels Elevation Offset Elevation Offset Height (ft) (ft) (ft) (ft) (ft) (ft) (%) (in) (in) (cfs) 1 Link CIRCULAR No 1 2 Link CIRCULAR No 1 3 Link CIRCULAR No 1 4 Link CIRCULAR No 1 Pipe Results SN Element Peak Time of Design Flow Peak Flow/ Peak Flow Travel Peak Flow Peak Flow Total Time Froude Reported ID Flow Peak Flow Occurrence Capacity Design Flow Ratio Velocity Time Depth Depth/ Surcharged Number Condition Total Depth Ratio (cfs) (days hh:mm) (cfs) (ft/sec) (min) (ft) (min) 1 Link : Calculated 2 Link : Calculated 3 Link : Calculated 4 Link : > CAPACITY
58 APPENDIX E Proposed Improvements Calculations and Data


59 Table 22. Proposed Pipe Size Calculations Table 23. Proposed Box Culvert Size Calculations
60
CITY OF CAPE CORAL STORMWATER MASTER PLAN PHASE II - PART 1 BASINS 4, 10, & 14 SUB-BASIN DRAINAGE IMPROVEMENTS HYDRAULIC ANALYSIS SUMMARY
 CITY OF CAPE CORAL STORMWATER MASTER PLAN PHASE II - PART 1 BASINS 4, 10, & 14 SUB-BASIN DRAINAGE IMPROVEMENTS HYDRAULIC ANALYSIS SUMMARY Cape Coral, FL Prepared for: The City of Cape Coral Public Works
Stormwater Capacity Analysis for Westover Branch Watershed
 Stormwater Capacity Analysis for Westover Branch Watershed Pimmit Run Little Pimmit Run, Mainstem Stohman's Run Gulf Branch Pimmit Run Tributary Little Pimmit Run, W. Branch Little Pimmit Run, E. Branch
******************* Project Description ******************* File Name... NAAF Stormwater Improvement Project 11_21_2014.SPF
 Autodesk Storm and Sanitary Analysis 2014 - Version 8.1.62 (Build 1) ----------------- *** Project Description *** File Name... NAAF Stormwater Improvement Project 11_21_2014.SPF Analysis Options Flow
Preliminary Hydraulic Report
 Tarrant County, Texas Preliminary Hydraulic Report Prepared for: Texas Department of Transportation Fort Worth District Prepared by: AECOM Corporation Scott C. Williams, P.E. No. 101334, Date 2009 This
City of Thornton Attn: Tim Semones Development Engineeering 9500 Civic Center Dr. Thornton, CO 80229
 Development Engineering Land Surveying Construction Administration District Services October 20, 2017 City of Thornton Attn: Tim Semones Development Engineeering 9500 Civic Center Dr. Thornton, CO 80229
Section 4: Model Development and Application
 Section 4: Model Development and Application The hydrologic model for the Wissahickon Act 167 study was built using GIS layers of land use, hydrologic soil groups, terrain and orthophotography. Within
September 6, City of Thornton 9500 Civic Center Drive Thornton, CO (303) RE: Maverik Thornton, CO - Drainage Report
 RE: Maverik Thornton, CO - Drainage Report") September 6, 2016 City of Thornton 9500 Civic Center Drive Thornton, CO 80229 (303) 538-7295 RE: Maverik Thornton, CO - Drainage Report As per your request, we are submitting to you the drainage report
September 6, 2016 City of Thornton 9500 Civic Center Drive Thornton, CO 80229 (303) 538-7295 RE: Maverik Thornton, CO - Drainage Report As per your request, we are submitting to you the drainage report
Project Description. Project Options. End Analysis On... Apr 26, :00:00. Rainfall Details
 Project Description File Name... 323 - Att Pond 3 East PIPES ONLY.SPF Project Options Flow Units... Elevation Type... Hydrology Method... EPA SWMM Infiltration Method... Link Routing Method... Enable Overflow
PRELIMINARY CULVERT ANALYSIS REPORT FOR CULVERT NO. 008-C OREGON AVENUE OVER PINEHURST CREEK
 PRELIMINARY CULVERT ANALYSIS REPORT FOR CULVERT NO. 008-C OREGON AVENUE OVER PINEHURST CREEK Prepared for The District of Columbia Department of Transportation Washington, D.C. Prepared by Parsons Transportation
BRANDON LAKES AVENUE PRE AND POST CONDITIONS DRAINAGE REPORT
 BRANDON LAKES AVENUE PRE AND POST CONDITIONS DRAINAGE REPORT Hillsborough County Public Works County Center, 22nd Floor 601 E. Kennedy Blvd. Tampa, FL 33602 BRANDON LAKES AVENUE DRAINAGE IMPROVEMENTS Capital
STORMWATER REPORT FRITO LAY SUBDIVISION NO. 3
 STORMWATER REPORT FRITO LAY SUBDIVISION NO. 3 May 2018 STORMWATER REPORT I. Subdivision Data a. The parcel is adjacent to the existing Frito Lay property in Topeka; and the subject plat application encompasses
ARTICLE 5 (PART 2) DETENTION VOLUME EXAMPLE PROBLEMS
 DETENTION VOLUME EXAMPLE PROBLEMS") ARTICLE 5 (PART 2) DETENTION VOLUME EXAMPLE PROBLEMS Example 5.7 Simple (Detention Nomograph) Example 5.8 Offsite and Unrestricted Areas (HEC-HMS) Example 5.9 Ponds in Series w/ Tailwater (HEC-HMS) Example
ARTICLE 5 (PART 2) DETENTION VOLUME EXAMPLE PROBLEMS Example 5.7 Simple (Detention Nomograph) Example 5.8 Offsite and Unrestricted Areas (HEC-HMS) Example 5.9 Ponds in Series w/ Tailwater (HEC-HMS) Example
Pressure Head: Pressure head is the height of a column of water that would exert a unit pressure equal to the pressure of the water.
 Design Manual Chapter - Stormwater D - Storm Sewer Design D- Storm Sewer Sizing A. Introduction The purpose of this section is to outline the basic hydraulic principles in order to determine the storm
Chapter 10 - Sacramento Method Examples
 Chapter 10 Sacramento Method Examples Introduction Overview This chapter presents two example problems to demonstrate the use of the Sacramento method. These example problems use the SACPRE and HEC-1 computer
Drainage Analysis. Appendix F
 Drainage Analysis Appendix F Golden View Drive Elizabeth Street LMORE CREEK Ricky Road Rabbit Creek Road LITTLE RABBIT CREEK East 156th Avenue MOA Project #10-026 Golden View Drive Intersection
INFLOW DESIGN FLOOD CONTROL SYSTEM PLAN 40 C.F.R. PART PLANT YATES ASH POND 2 (AP-2) GEORGIA POWER COMPANY
 GEORGIA POWER COMPANY") INFLOW DESIGN FLOOD CONTROL SYSTEM PLAN 40 C.F.R. PART 257.82 PLANT YATES ASH POND 2 (AP-2) GEORGIA POWER COMPANY EPA s Disposal of Coal Combustion Residuals from Electric Utilities Final Rule (40 C.F.R.
INFLOW DESIGN FLOOD CONTROL SYSTEM PLAN 40 C.F.R. PART 257.82 PLANT YATES ASH POND 2 (AP-2) GEORGIA POWER COMPANY EPA s Disposal of Coal Combustion Residuals from Electric Utilities Final Rule (40 C.F.R.
Hydrology Study Report
 Hafeez Consulting www.hafeezconsulting.com Civil/ Structural Engineering, Design & Construction 1451 S. Hacienda St. Anaheim CA 92804 (714) 225-4565 Fax (714)917-2977 engineer@hafeezconsulting.com Hydrology
DRAINAGE REPORT FOR THORNTON SELF STORAGE THORNTON, COLORADO
 DRAINAGE REPORT FOR THORNTON SELF STORAGE THORNTON, COLORADO Prepared by: Bowman Consulting 603 Park Point Dr. Suite 100 Golden, CO 80401 (303)-801-2900 June 29, 2015 Revised August 14, 2015 CERTIFICATE
Appendix E Guidance for Shallow Flooding Analyses and Mapping
 Appendix E Guidance for Shallow Flooding Analyses and Mapping E.1 Introduction Different types of shallow flooding commonly occur throughout the United States. Types of flows that result in shallow flooding
Final Drainage Report
 Final Drainage Report Expo Rail Operations and Maintenance Facility Santa Monica, California Prepared for: Exposition Metro Line Construction Authority Prepared by: W2 Design, Inc. 50 S. De Lacey Avenue
UTILITY REPORT FOR THORNTON SELF STORAGE THORNTON, COLORADO
 UTILITY REPORT FOR THORNTON SELF STORAGE THORNTON, COLORADO Prepared by: Bowman Consulting 63 Park Point Dr. Suite 1 Golden, CO 841 (33)-81-29 June 29, 215 Revised August 14, 215 Revised September 3, 215
LOCATED IN INDIAN RIVER COUNTY PREPARED FOR S.J.R.W.M.D. AND F.W.C.D. DECEMBER, 2003 Updated 2007 Updated May 2014 PREPARED BY
 FELLSMERE WATER CONTROL DISTRICT EAST MASTER DRAINAGE PLAN AND STORMWATER HYDROLOGIC ANALYSIS OF THE GRAVITY DRAINAGE SYSTEM LOCATED BETWEEN THE EAST BOUNDARY, LATERAL U, THE MAIN CANAL, AND DITCH 24 LOCATED
WATER MANAGEMENT REPORT FOR PAGE ESTATES
 WATER MANAGEMENT REPORT FOR PAGE ESTATES SLB Consulting of SW Florida, LLC PO Box 2826 Bonita Springs, FL. 34133 Phone: 239-948-9566 sandra@slbconsult.com C.O.A. # 25395 September 1, 2014 Sandra L. Bottcher
3301 East 120 th Avenue Assited Living & Memory Care
 UTILITY REPORT FOR 3301 East 120 th Avenue Assited Living & Memory Care 1 st Submittal January 23, 2016 2 nd Submittal March 04, 2016 Prepared for: 3301 E. 120 th Ave, LLC. 8200 E. Maplewood Ave., Suite
STREUVER FIDELCO CAPPELLI, LLC YONKERS DOWNTOWN DEVELOPMENT PHASE 1. DRAFT ENVIRONMENTAL IMPACT STATEMENT For: PALISADES POINT
 STREUVER FIDELCO CAPPELLI, LLC YONKERS DOWNTOWN DEVELOPMENT PHASE 1 DRAFT ENVIRONMENTAL IMPACT STATEMENT For: PALISADES POINT Prepared by: PAULUS, SOKOLOWSKI & SARTOR STORMWATER MANAGEMENT 1. Methodology
DRAINAGE REPORT. Ministry of Transportation and Infrastructure. Highway 7 Four Laning Silverdale Avenue to Nelson Street 100% Detailed Design
 DRAINAGE REPORT Ministry of Transportation and Infrastructure Highway 7 Four Laning Silverdale Avenue to Nelson Street 100% Detailed Design December 14, 2017 Reviewed by: Amanda Rust, P. Eng. Senior Drainage
Chapter 5 CALIBRATION AND VERIFICATION
 Chapter 5 CALIBRATION AND VERIFICATION This chapter contains the calibration procedure and data used for the LSC existing conditions model. The goal of the calibration effort was to develop a hydraulic
Eastlake Assited Living & Memory Care
 UTILITY REPORT FOR Eastlake Assited Living & Memory Care 1 st Submittal January 23, 2016 2 nd Submittal March 04, 2016 June 7, 2016 Final Submittal August 08, 2016 Prepared for: 3301 E. 120 th Ave, LLC.
Design Data 17. Partial Flow Conditions of Box Culverts
 Design Data 17 Partial Flow Conditions of Box Culverts Sewers, both sanitary and storm, are designed to carry a peak flow based on anticipated land development. The hydraulic capacity of sewers or culverts
STORMWATER DESIGN CALCULATIONS
 STORMWATER DESIGN CALCULATIONS REF : C7011-2390 AT 19a-23 MEMORIAL AVENUE BLACKWALL FOR MR KERR Contents 1.0 Detention System Requirements 1.1 Storage-Area calcs. 1.2 Data Files for Pre & Post Developed
Basic Hydraulics June 2007
 Basic Hydraulics www.concrete-pipe.org June 2007 2007 Overview Open Channel Flow Manning Equation Basic Culvert Design Sanitary Sewer Design Flow, Velocity Stormwater Sewer Design Flow, Velocity 2 Open
PENNSYLVANIA DEPARTMENT OF TRANSPORTATION ENGINEERING DISTRICT 3-0
 PENNSYLVANIA DEPARTMENT OF TRANSPORTATION ENGINEERING DISTRICT 3-0 LYCOMING COUNTY S.R.15, SECTION C41 FINAL HYDROLOGIC AND HYDRAULIC REPORT STEAM VALLEY RUN STREAM RELOCATION DATE: June, 2006 REVISED:
CASE STUDIES. Introduction
 Introduction The City of Winston-Salem faces the challenge of maintaining public infrastructure (e.g., water and sewer lines, storm drains, roads, culverts and bridges) while minimizing the potential impacts
SPRINGVILLE CITY, UTAH PRESSURE IRRIGATION SYSTEM DRAFT. MASTER PLAN & CAPITAL FACILITIES PLAN For the WEST FIELDS. February 11, 2014.
 SPRINGVILLE CITY, UTAH PRESSURE IRRIGATION SYSTEM MASTER PLAN & CAPITAL FACILITIES PLAN For the WEST FIELDS February 11, 2014 Prepared by: J-U-B ENGINEERS, INC. 240 West Center Street, Suite 200 Orem,
SPRINGVILLE CITY, UTAH
 SPRINGVILLE CITY, UTAH PRESSURE IRRIGATION SYSTEM MASTER PLAN & CAPITAL FACILITIES PLAN For the WEST FIELDS February 11, 2014 Adopted May 20, 2014 Prepared by: J-U-B ENGINEERS, INC. 240 West Center Street,
Submitted to: St. Johns River Power Park New Berlin Road Jacksonville, FL 32226
 RUN-ON/RUN-OFF CONTROL SYSTEM PLAN RUN-ON AND RUN-OFF CONTROL SYSTEM PLAN St. Johns River Power Park Byproduct Storage Area B Phase I Development Submitted to: St. Johns River Power Park 11201 New Berlin
2018 FINAL TOWN OF WAXHAW WASTEWATER SYSTEM PLANNING. Master Plan Addendum. Union County B&V PROJECT NO PREPARED FOR
 Black & Veatch Holding Company 2017. All rights reserved. 2018 FINAL TOWN OF WAXHAW WASTEWATER SYSTEM PLANNING Master Plan Addendum B&V PROJECT NO. 195982 PREPARED FOR Union County 7 MARCH 2018 Table of
EROSION CONTROL NARRATIVE
 EROSION CONTROL NARRATIVE Erosion and sediment control has been designed for the Willow Bend Phase I Subdivision according to UDFCD and the City of Thornton criteria, in order to minimize erosion and sediment
FINAL DRAINAGE REPORT Villages at Riverdale Carriage Homes Thornton, CO
 FINAL DRAINAGE REPORT Villages at Riverdale Carriage Homes Thornton, CO October 14, 2016 Revised: March 30, 2017 JN: 15096 Prepared for: PCS Group, Inc. 1001 16 th Street #3 B-180 Denver, CO 80265 P: 303.561.4905
UPPER COSUMNES RIVER FLOOD MAPPING
 UPPER COSUMNES RIVER FLOOD MAPPING DRAFT BASIC DATA NARRATIVE FLOOD INSURANCE STUDY SACRAMENTO COUTY, CALIFORNIA Community No. 060262 November 2008 Prepared By: CIVIL ENGINEERING SOLUTIONS, INC. 1325 Howe
Section 3.0 Existing Systems Hydrology and Hydraulics
 Section 3.0 Existing Systems Hydrology and Hydraulics This chapter summarizes the results and methodology of MACTEC s evaluation of the existing drainage systems and lakes for the City of Maitland, Florida.
3.11 Floodplains Existing Conditions
 Other stormwater control practices may be needed to mitigate water quality impacts. In addition to detention facilities, other practices such as vegetated basins/buffers, infiltration basins, and bioswales
FHWA - HIGHWAY HYDROLOGY
 The unit peak discharge is computed with Equation 5.6 by interpolating c 0, c, and c Table 5.5 using a type II distribution. The peak discharge is also calculated as follows. from Variable SI Unit U Unit.5444
Villages at Riverdale Thornton, CO
 FINAL UTILITY REPORT Villages at Riverdale Thornton, CO October 14, 216 Revised: March 29, 217 JN: 1539 Prepared for: PCS Group, Inc. 11 16 th Street #3 B-18 Denver, CO 8265 P: 33.531.495 Prepared by:
HYDROLOGY REPORT Tentative Tract No. 5978
 ATTACHMENT 5 October 2016 HYDROLOGY REPORT Tentative Tract No. 5978 City of Simi Valley County of Ventura Prepared For: Landsea Holdings Corporation 7525 Irvine Center Drive Suite 200 Irvine, CA 92618
Information for File # MMJ; Trunk Highway (TH) 7 / Louisiana Ave. Interchange Project
 7 / Louisiana Ave. Interchange Project") Information for File # 2013-00531-MMJ; Trunk Highway (TH) 7 / Louisiana Ave. Interchange Project Applicant: City of St. Louis Park Corps Contact: Melissa Jenny Address: U.S. Army Corps of Engineers Attn:
Information for File # 2013-00531-MMJ; Trunk Highway (TH) 7 / Louisiana Ave. Interchange Project Applicant: City of St. Louis Park Corps Contact: Melissa Jenny Address: U.S. Army Corps of Engineers Attn:
MS4: MAPPING CHALLENGES. Mike Towle Associate Planner, WestCOG
 MS4: MAPPING CHALLENGES Mike Towle Associate Planner, WestCOG mtowle@westcog.org Please contact or attribute author before using any images or data from this presentation Overview I. Theory and background
Notes: We all know that Toulmins Spring Branch is a sub-watershed of Three Mile Creek watershed. Some part of it is in Mobile area and rest of it is
 1 Notes: This presentation is about some of our findings from a study carried out over the last 3-4 months on stormwater management of Toulmins Spring Branch watershed by NEP. The objective of this study
A HYDROLOGIC STUDY OF THE EFFECTS OF URBAN DEVELOPMENT ON STORM RUNOFF: A CASE STUDY IN QUEENS, NY ABSTRACT
 154 A HYDROLOGC STUDY OF THE EFFECTS OF URBAN DEVELOPMENT ON STORM RUNOFF: A CASE STUDY N QUEENS, NY Monica Tsang-Rakovan, Kevin J. Phillips, Khalid Bajwa, John Ferrelli, Fanning, Phillips and Molnar Fanning,
Stormwater Guidelines and Case Studies. CAHILL ASSOCIATES Environmental Consultants West Chester, PA (610)
") Stormwater Guidelines and Case Studies CAHILL ASSOCIATES Environmental Consultants West Chester, PA (610) 696-4150 www.thcahill.com Goals and Challenges for Manual State Stormwater Policy More Widespread
Stormwater Guidelines and Case Studies CAHILL ASSOCIATES Environmental Consultants West Chester, PA (610) 696-4150 www.thcahill.com Goals and Challenges for Manual State Stormwater Policy More Widespread
Objectives: After completing this assignment, you should be able to:
 Data Analysis Assignment #1 Evaluating the effects of watershed land use on storm runoff Assignment due: 21 February 2013, 5 pm Objectives: After completing this assignment, you should be able to: 1) Calculate
Stormwater Drainage Design Report. Reeve & Associates, Inc. Maverik, Inc. 88th Avenue and Pecos Street. Thornton, CO
 88th Avenue and Pecos Street Stormwater Drainage Design Report Reeve & Associates, Inc. Solutions You Can Build On for Maverik, Inc. 88th Avenue and Pecos Street Thornton, CO submitted to Reeve & Associates,
Coal Combustion Residuals Unit Inflow Design Flood Control System Plan
 Coal Combustion Residuals Unit Inflow Design Flood Control System Plan Virginia Electric and Power Company Chesterfield Power Station Upper (East) Pond Chesterfield County, Virginia GAI Project Number:
Caledon Villas Corporation
 Caledon Villas Corporation Functional Servicing Report Caledon Villas Residential Subdivision Town of Caledon Project No. L11-557 April 2014 Caledon Villas Corporation Town of Caledon Caledon Villas Residential
CITY OF PUYALLUP TOSCANOS SINKHOLE EVALUATION
 CITY OF PUYALLUP PIERCE COUNTY WASHINGTON TOSCANOS SINKHOLE EVALUATION G&O #15470 OCTOBER 2015 TABLE OF CONTENTS BACKGROUND...1 EXISTING SYSTEM...1 Stormwater Conveyance System...1 Video Inspection...2
GIS Enabled Automated Culvert Design
 GIS Enabled Automated Culvert Design ASHTON GREER PH.D. STUDENT, THE UNIVERSITY OF ALABAMA DR. ANDREW GRAETTINGER, LEAH CLIFTON, ZACHARY WILBANKS, BRADFORD WILSON Outline Culvert Background Project Objectives
D. MATHEMATICAL MODEL AND SIMULATION
 D. MATHEMATICAL MODEL AND SIMULATION D - i TABLE OF CONTENTS D.1 Objective of Model Development... D - 1 D.2 Selection of Software... D - 1 D.3 General Steps of Simulation by MOUSE... D - 1 D.4 Cases of
Wellsgate Terrace SPECIFICATIONS.
 GRADING NOTES: 1. LOT GRADING SHALL BE COMPLETED TO PROVE SUFFICIENT DIRT ON EACH PAD TO ACHIEVE THE CRITICAL PAD GRADES AND SPOT GRADES ON EACH LOT. AFTER ACHIEVING CRITICAL PAD GRADES INDICATED ON THIS
ROCK EXCAVATION (GRADING) OPSS 206 INDEX
 OPSS 206 INDEX") 206-2 - OPSS 206 INDEX 206-2.1 GENERAL 206-2.1.1 Classification of Rock Materials 206-2.1.2 Tender Items 206-2.1.3 Other Excavation Tender Items 206-2.1.4 Specifications 206-2.1.5 Special Provisions 206-2.1.6
206-2 - OPSS 206 INDEX 206-2.1 GENERAL 206-2.1.1 Classification of Rock Materials 206-2.1.2 Tender Items 206-2.1.3 Other Excavation Tender Items 206-2.1.4 Specifications 206-2.1.5 Special Provisions 206-2.1.6
Phillips Ditch Drainage Study
 Phillips Ditch Drainage Study By: David L. McCormick, PE, D. WRE McCormick Engineering, LLC For: St. Joseph County, Indiana Revision Date: March 29, 2017 Table of Contents 1. INTRODUCTION... 1 1.1. Review
D. B. G R A Y E N G I N E E R I N G I N C.
 STORMWATER MANAGEMENT REPORT 948 Hunt lub Road Ottawa, Ontario Report No. 12020-SWM August 27, 2012 Revised April 21, 2014 Revised December 9, 2014 Revised April 14, 2015 D. B. G R A Y E N G I N E E R
Continuing Education Course #101 Drainage Design with WinTR-55
 1 of 5 Continuing Education Course #101 Drainage Design with WinTR-55 1. WinTR-55 uses the Kinematic Wave method for calculating storm runoff rates and volumes. 2. According to the Velocity Method, the
Stage Discharge Tabulation for Only Orifice Flow
 Stage Discharge Tabulation for Only Orifice Flow DEPTH STAGE DISCHARGE (meters) (feet) (meters) (feet) (m 3 /s) (ft 3 /s) 0 0.20 0.40 0.60 0.80 1.00 1.20 1.40 1.60 1.80 2.00 0.7 1.3 2.0 2.6 3.3 3.9 4.6
SERVICING BRIEF & STORMWATER MANAGEMENT REPORT Colonial Road Sarsfield (Ottawa), Ontario. Report No June 15, 2017
, Ontario. Report No June 15, 2017") SERVICING BRIEF & STORMWATER MANAGEMENT REPORT 2980 Colonial Road Sarsfield (Ottawa), Ontario Report No. 16033 June 15, 2017 D. B. G R A Y E N G I N E E R I N G I N C. Stormwater Management - Grading &
SERVICING BRIEF & STORMWATER MANAGEMENT REPORT 2980 Colonial Road Sarsfield (Ottawa), Ontario Report No. 16033 June 15, 2017 D. B. G R A Y E N G I N E E R I N G I N C. Stormwater Management - Grading &
HYDROLOGIC AND HYDRAULIC REPORT FOR SR. 0522, SECTION 5BN ALONG BLACKLOG CREEK CROMWELL TOWNSHIP HUNTINGDON COUNTY. Prepared for:
 HYDROLOGIC AND HYDRAULIC REPORT FOR SR. 0522, SECTION 5BN ALONG BLACKLOG CREEK CROMWELL TOWNSHIP Prepared for: KCI Technologies, Inc. Mechanicsburg, PA and Pennsylvania Department of Transportation Engineering
9/12/2014 O V E RV I E W
 K E E P I N G T H E N E W M I S S I O N R E AC H C L E A N T R A S H & F L O ATA B L E S B M P S T U D Y Russell Persyn, P.E., Ph.D. (SARA) Cris Parker, P.E., CFM (HDR) September 4, 2014 O V E RV I E W»
SAN FRANCISCO DISTRICT INFORMATION REQUESTED FOR VERIFICATION OF CORPS JURISDICTION
 DEPARTMENT OF THE ARMY SAN FRANCISCO DISTRICT, U.S. ARMY CORPS OF ENGINEERS 1455 MARKET STREET SAN FRANCISCO, CALIFORNIA 94103-1398 SAN FRANCISCO DISTRICT INFORMATION REQUESTED FOR VERIFICATION OF CORPS
Hydrology and Hydraulics Design Report. Background Summary
 To: National Park Services Montezuma Castle National Monument Richard Goepfrich, Facility Manager From: Multicultural Technical Engineers Date: Tuesday - February 13, 2018 Subject: 30% Hydrology and Hydraulics
12"CMP DIA. ELEV. PVC CI DI CMP VCP RCP RCAP LRCP LCPP STA. LA LB BM-2 ROW PI POT LF TH PVC
 PLANS FOR X-REFS: FILE PATH: Z:\WEST BRANCH 3682 MAIN STREET SIDEWALK IMPROVEMENTS - PHASE 3\DRAWINGS\_PRODUCTION DRAWINGS\TITLE & INDEX PLOTTED: Thursday, May 26, 216 4:7:42 PM MAIN STREET SIDEWALK PHASE
HOTEL KANATA 160 HEARST WAY KANATA, ONTARIO SERVICING REPORT. Prepared for: David Johnston Architect. Prepared By:
 HOTEL KANATA 160 HEARST WAY KANATA, ONTARIO SERVICING REPORT Prepared for: David Johnston Architect Prepared By: BaseTech Consulting Inc. 309 Roywood Crescent Newmarket, Ontario L3Y 1A6 BCI Project No.
City of Columbia BMP Manual. Detailed Unified Sizing Criteria Example Wet Pond Design
 City of Columbia BMP Manual Detailed Unified Sizing Criteria Example Wet Pond Design April 17, 2013 Wet Pond Example: Unified Sizing Criteria Methodology Base Data Location: Rome, GA Site Drainage Area
Appendix C Fluvial Flood Hazards
 Appendix C Fluvial Flood Hazards Sea Level Rise Vulnerability Assessment and Adaptation Project March 2019 Contents Contents... i Figures... i Tables... i Definitions, Acronyms, & Abbreviations... ii
Local Flood Hazards. Click here for Real-time River Information
 Local Flood Hazards Floods of the White River and Killbuck Creek are caused by runoff from general, and/or intense rainfall. Other areas of flooding concern are from the Boland Ditch and Pittsford Ditch.
The effectiveness of the Natural Resource Conservation Service (NRCS) and Huff rainfall distribution methods for use in detention basin design
 and Huff rainfall distribution methods for use in detention basin design") Scholars' Mine Masters Theses Student Theses and Dissertations Spring 2010 The effectiveness of the Natural Resource Conservation Service (NRCS) and Huff rainfall distribution methods for use in detention
Scholars' Mine Masters Theses Student Theses and Dissertations Spring 2010 The effectiveness of the Natural Resource Conservation Service (NRCS) and Huff rainfall distribution methods for use in detention
D.M. Wills Associates Limited PARTNERS IN ENGINEERING. Stormwater Management Report. City of Peterborough
 Stormwater Management Report City of Peterborough P-20-12 Parkway Corridor Class Environmental Assessment Jackson Park Parkhill Road West to Chemong Road D.M. Wills Project No. 12-5061 D.M. Wills Associates
SAN JACINTO RIVER / BAUTISTA CREEK LEVEE SYSTEM RIVERSIDE COUNTY, CALIFORNIA NLD ID #
 SAN JACINTO RIVER / BAUTISTA CREEK LEVEE SYSTEM RIVERSIDE COUNTY, CALIFORNIA NLD ID # 3805010019 PERIODIC INSPECTION REPORT NO 1 GENERALIZED EXECUTIVE SUMMARY FEBRUARY 2013 FINAL RATING: MINIMALLY ACCEPTABLE
THE TRINITY RIVER VISION/ GATEWAY PARK / PANTHER ISLAND Flood Control Project Update
 Quarterly Project Status Report September 2018 THE TRINITY RIVER VISION/ GATEWAY PARK / PANTHER ISLAND Flood Control Project Update TxDot s contractor has nearly completed the superstructure false work
Wal-mart Store # Ft. Walton Beach, FL NE Corner of Eglin Parkway/S.R. 85 and South Street STORMWATER REPORT. February 2017
 Wal-mart Store #6746-00 Ft. Walton Beach, FL NE Corner of Eglin Parkway/S.R. 85 and South Street STORMWATER REPORT February 2017 CPH Project No. W13900 1031-C W. 23rd Street Panama City, FL 32405 Phone
WATERVIEW EAST PRELIMINARY DRAINAGE REPORT EL PASO COUNTY, COLORADO
 WATERVIEW EAST PRELIMINARY DRAINAGE REPORT EL PASO COUNTY, COLORADO PROJECT NO. 181710214 Prepared for: CPR ENTITLEMENTS 31 N. TEJON, SUITE 500 COLORADO SPRINGS, CO 80903 719.377.0244 Prepared by: STANTEC
Las Colonias Subdivision September 2010 Flood Study
 Las Colonias Subdivision September 2010 Flood Study Curtis Beitel, P.E., CFM Scott Muchard, P.E. Project Engineer William Badini, CFM Senior Meteorologist Location Map Background Los Colonias Subdivision
Pequabuck River Flooding Study and Flood Mitigation Plan The City of Bristol and Towns of Plainville and Plymouth, CT
 Pequabuck River Flooding Study and Flood Mitigation Plan The City of Bristol and Towns of Plainville and Plymouth, CT Raymond Rogozinski and Maged Aboelata The City of Bristol and Towns of Plainville and
Chapter 7 Mudflow Analysis
 Chapter 7 Mudflow Analysis 7.0 Introduction This chapter provides information on the potential and magnitude of mud floods and mudflows that may develop in Aspen due to rainfall events, snowmelt, or rain
Appendix B Equations and Examples
 Equations and Examples Purpose The purpose of this appendix is to provide background equations and example problems for clarity of calculations used throughout the manual. This appendix is divided into
Pennypack Creek Watershed Act 167 Study
 Pennypack Creek Watershed Act 167 Study Progress Report December 17, 2009 Jeffrey Featherstone jeffrey.featherstone@temple.edu Mahbubur Meenar meenar@temple.edu Rick Fromuth richard.fromuth@temple.edu
APPENDIX B DESIGN CRITERIA FOR TEMPORARY WATER QUALITY BMPS USED DURING CONSTRUCTION
 APPENDIX B DESIGN CRITERIA FOR TEMPORARY WATER QUALITY BMPS USED DURING CONSTRUCTION This Appendix presents design criteria and example calculations for the following temporary water quality BMPs for use
This site will utilize an infiltration berm to manage the two-year/24-hour volume increase.
 Gates TETRA TECH, INC. By: RH Date: 1/30/2017 Subject: Gates Road Checked By: JB Date: 2/1/2017 PCSM Design and Evaluation PURPOSE: The purpose of these calculations is to design a Post-Construction Stormwater
APPENDIX E GREATER SPRINGFIELD RELIABILTIY PROJECT DRAINAGE ANALYSIS FOR THE NEWGATE/PHELPS ROAD AND THE HATCHETT HILL ROAD AREAS
 APPENDIX E GREATER SPRINGFIELD RELIABILTIY PROJECT DRAINAGE ANALYSIS FOR THE NEWGATE/PHELPS ROAD AND THE HATCHETT HILL ROAD AREAS New England East-West Solution (NEEWS) Greater Springfield Reliability
Rock & Aggregate Drop Inlet Protection
 Rock & Aggregate Drop Inlet Protection SEDIMENT CONTROL TECHNIQUE Type 1 System Sheet Flow Sandy Soils Type 2 System [1] Concentrated Flow Clayey Soils Type 3 System Supplementary Trap Dispersive Soils
FINAL UTILITY REPORT Creekside Thornton, CO
 FINAL UTILITY REPORT Creekside Thornton, CO March 4, 216 Revised: June 27, 216 JN: 1539 Prepared for: HW Sodbusters, LLC 2733 E. Parleys Way, Suite 3 Salt Lake City, UT 8419 P: 81.485.777 Prepared by:
THE TRINITY RIVER VISION/ GATEWAY PARK / PANTHER ISLAND
 Quarterly Project Status Report May 2018 THE TRINITY RIVER VISION/ GATEWAY PARK / PANTHER ISLAND Flood Control Project Update Construction of North Main Street Bridge by TxDOT s bridge contractor, Texas
CITY OF PERRIS FLOOD CONTROL MAINTENANCE DISTRICT NO. 1. ANNUAL ENGINEER S REPORT FISCAL YEAR 2015/2016 May 12, 2015
 CITY OF PERRIS FLOOD CONTROL MAINTENANCE DISTRICT NO. 1 ANNUAL ENGINEER S REPORT FISCAL YEAR 2015/2016 May 12, 2015 AGENCY: City of Perris PROJECT: Flood Control Maintenance District No. 1 TO: City Council
Determination of Urban Runoff Using ILLUDAS and GIS
 Texas A&M University Department of Civil Engineering Instructor: Dr. Francisco Olivera CVEN689 Applications of GIS to Civil Engineering Determination of Urban Runoff Using ILLUDAS and GIS Tae Jin Kim 03.
PRELIMINARY ENGINEERING REPORT FOR SANITARY SEWER COLLECTION SYSTEM OSKALOOSA, IOWA 2017
 PRELIMINARY ENGINEERING REPORT FOR SANITARY SEWER COLLECTION SYSTEM OSKALOOSA, IOWA 2017 PRELIMINARY ENGINEERING REPORT FOR SANITARY SEWER COLLECTION SYSTEM OSKALOOSA, IOWA 2017 I hereby certify that this
Monitoring Considerations and Costs
 Monitoring Considerations and Costs Stormwater BMP Selection, Design, and Monitoring Florida Stormwater Association September 9, 2016 Harvey H. Harper, Ph.D., P.E. Environmental Research & Design, Inc.
Analysis of Hydraulic Impacts on the Schuylkill River
 Analysis of Hydraulic Impacts on the Schuylkill River Manayunk Sewer Basin Construction Project and the Venice Island Recreation Center Reconstruction Project Venice Island, Manayunk, Philadelphia, PA
Drainage Study for Civic Center Way
 Drainage Study for 23401 Civic Center Way P.C.C.E. INC. CIVIL ENGINEERING AND DESIGN Drainage Study for 23401 Civic Center Way WHOLE FOODS AT THE PARK Prepared by: P.C.C.E. INC STEPHEN R. SMITH, P.E. 23801
This site will utilize an infiltration berm to manage the two-year/24-hour volume increase.
 Gates TETRA TECH, INC. By: RH Date: 11/11/2016 Subject: Gates Road Checked By: JB Date: 11/13/2016 PCSM Design and Evaluation PURPOSE: The purpose of these calculations is to design a Post-Construction
Climate Adaptation Challenges for Boston s Water and Sewer Systems
 National Association of Flood & Stormwater Management Agencies Climate Adaptation Challenges for Boston s Water and Sewer Systems John P Sullivan P.E. October 15,2014 Boston 1630 Boston 1630-2012 Boston
4. GIS Implementation of the TxDOT Hydrology Extensions
 4. GIS Implementation of the TxDOT Hydrology Extensions A Geographic Information System (GIS) is a computer-assisted system for the capture, storage, retrieval, analysis and display of spatial data. It
CITY OF PERRIS FLOOD CONTROL MAINTENANCE DISTRICT NO. 1. ANNUAL ENGINEER S REPORT FISCAL YEAR 2011/2012 April 26, 2011
 CITY OF PERRIS FLOOD CONTROL MAINTENANCE DISTRICT NO. 1 ANNUAL ENGINEER S REPORT FISCAL YEAR 2011/2012 April 26, 2011 AGENCY: City of Perris PROJECT: Flood Control Maintenance District No. 1 TO: City Council