Urban Street-Scale Hydrodynamic Flood Modeling of Micro-Burst Rainfall
|
|
|
- Julius Day
- 5 years ago
- Views:
Transcription


1 Urban Street-Scale Hydrodynamic Flood Modeling of Micro-Burst Rainfall Dr. Jon Derek Loftis Asst. Research Scientist, VA Inst. of Marine Science Sridhar Katragadda Systems Analyst, City of Virginia Beach Kyle Spencer GIS Team Supervisor City of Norfolk ESRI User Conference, July 11, 2017 Advanced Computational Methods in Water Resources
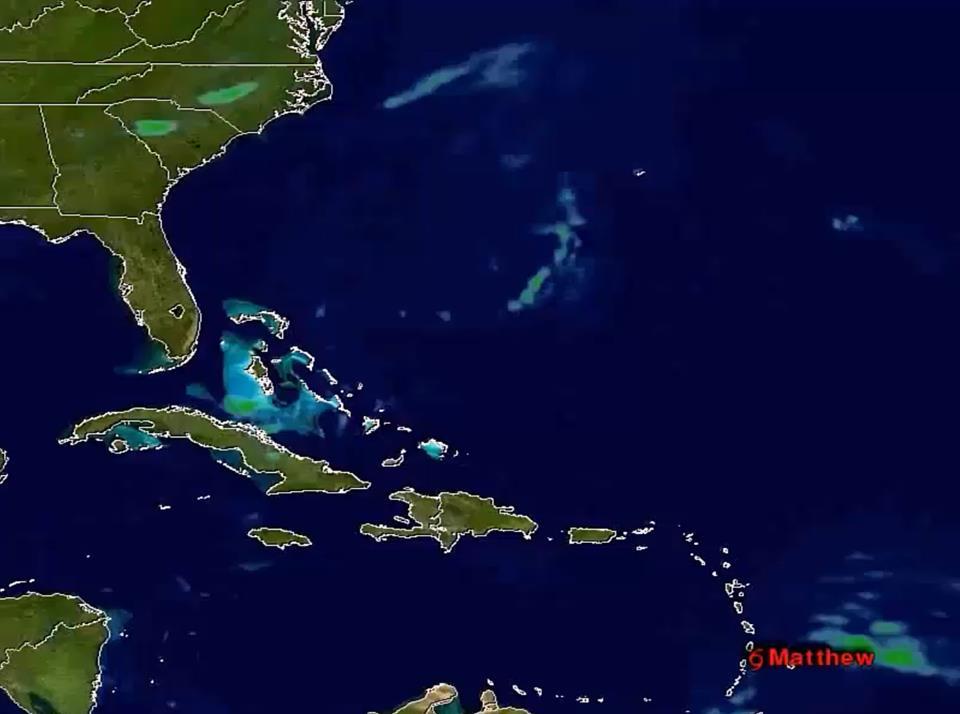
 Hurricane Matthew (Oct. 8-9, 2016) 4.")
2 Outline 1. Introduction Emerging Flood Model Verification Methods (Sensors, Citizen Science, and Drones) Sensor Network and Sub-Grid Modeling Approach 2. Methods: Model Setup and Grid Development 3. Results & Discussion Tropical Storm Julia (Sept , 2016) Hurricane Matthew (Oct. 8-9, 2016) 4. Conclusions
3 1. Introduction Emerging Flood Model Verification Methods (Sensors, Citizen Science, and Drones) Sensor Network and Sub-Grid Modeling Approach
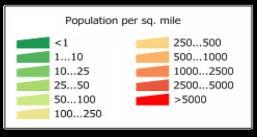
4 1. Introduction The Hampton Roads region is the second-largest population center in the U.S. at risk from sea level rise (Boon, Brubaker and Forrest, 2010; Mitchell et al., 2013) More than 400,000 properties exposed to flood or storm surge inundation (CoreLogic, 2015) Population of over 1.7 million people, living and traveling on roads exposed to severe and increasing frequent chronic nuisance flooding (Ezer and Atkinson, 2014) Existing flood communication and messaging systems have not yet responded to the changing risk patterns brought by sea level rise and have not been able to meet the needs of diverse at-risk communications audiences (IoT sensors and predictive models can help) A better understanding of flood risk perception, information-seeking behavior and decision-making can inform the development of new communications tools and flood risk messaging
5

 GPS Citizen-Science Sea Level Rise Mobile")
 Photosynth")
6 (less) Conventionality (more) Scientific Reliability Emerging Flood Model Verification Methods Water Level Sensors (NOAA, USGS, COOS, VIMS) Ultrasonic Sensors (Cities) GPS Citizen-Science Sea Level Rise Mobile App (Wetlands Watch) ArcGIS Collector App (ESRI) 4K Aerial Drone Surveys Drone2Map (ESRI) Photosynth (Microsoft)


7 Sea Level Rise App How it s used Collect GPS max. flood extent data Frequently flooded areas are identified in trouble section What information is gathered? Pics of flooding Text descriptions How do I use it? Assess accuracy of flood forecasts Web Map of Suggested App Features & Updates:


8 Project Partners Project Partners (as of July 2017):
9 2. Methods StormSense Model Setup Grid Development


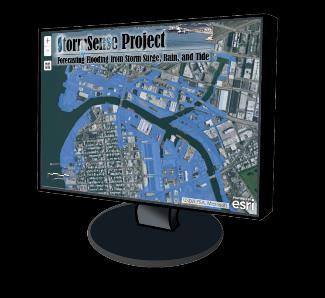


10 Sensor Network and StormSense Model Inputs Observations & Predictions 6-min automated retrieval script IoT Stream Gauge Network StormSense Hydrodynamic Forecast Model Server StormSense Web Portal stormsense.com


11 StormSense Model Output Methods Amazon Web Service for StormSense Sensor Data: Water levels extracted from grid cells with water level observations Perl and python scripts run in the background to produce geotiff rasters of water level and flood heights (water level- land elevation) for each 6-minute interval Spatial outputs are prepared as.kml files and javascript-layers for production of open layers maps, Google Maps, and Google Earth animations.


12 Model Grid Development with Lidar-Derived DEM Chesterfield Heights, Grandy Park, and Broad Creek City of Norfolk Central Norfolk Superposed with Chesterfield Heights Represented by Sub-Grid Downtown Norfolk and Hall City Hall Superposed with Sub-grid ODU ODU City Peninsula Peninsula Hall Represented Superposed Represented bycity with Sub-grid by Sub-grid Sub-grid Old Dominion University and Peninsula Central Norfolk Edgewater Haven Middle Towne Arch Norfolk Scope Arena ODU President s Residence Foreman Field Moseley Creek Grandy Park Norfolk City Hall 12 Norfolk s Stadium

 over 72 hours from Sept.")


13 Model Setup (Rainfall) *Radar Derived Cumulative Rainfall totals (in.) over 72 hours from Sept , HRSD Rainfall Sensors (15 min intervals) MMPS-004-RAINGAUGE-56 John B. Dey *Rainfall totals from HRSD (in/15 min)
 Hurricane Matthew (Oct.")
14 3. Results & Discussion Tropical Storm Julia (Sept , 2016) Hurricane Matthew (Oct. 8-9, 2016)

15 Tropical Storm Julia & Hurricane Matthew

16 City Dashboard Systems

17 Matthew - Crowd-Sourced Damage Assessments
 Edge Detection Laplace Transform of Pixel Values (Sobel) Supervised Classification Import to Drone2Map with XYZ Drone")
18 Hurricane Matthew Drone2Map Survey Workflow: Capture Video Parse to Images (0.25 sec) Edge Detection Laplace Transform of Pixel Values (Sobel) Supervised Classification Import to Drone2Map with XYZ Drone Video by John Ehlers, Norfolk

19 Hurricane Matthew Drone2Map Survey Drone video footage of Llewellyn Ave near Haven Creek Boat Ramp in Norfolk at 2:30pm on Oct. 9, 2016 Video > Images > Edge Detection > Laplace Transform of Pixel Values > Supervised Classification > Drone2Map

20 Drone2Map Survey Linear Path Forecast Modeled Extents at 2:30pm on Oct. 9, Llewellyn Ave Plotted with Maximum Inundation Extents from Drone2Map Legend: Drone Video Still Image SLR App Data Point Avg. Horizontal Dist. Diff. = (n = 263 GPS points)

21 So why is the model over-predicting flooding here? *Model DEM is sourced with 2009 lidar before the ground was raised

22 Drone2Map Survey Panoramic Path Drone video footage of Monticello Ave near Haven Creek Boat Ramp in Norfolk at 3:00pm on Oct. 9, 2016 Drone Video Footage > Images > Drone2Map Current Flooding Extent Avg. Horizontal Dist. Diff. = 14.39m (n = 137 points)


23 Crowd-Sourced Damage Assessments Drone2Map Flooding Extent at 3:00pm Avg. Horizontal Dist. Diff. = 14.39m (n = 137 points) Video > Images > Edge Detection > Laplace Transform of Pixel Values > Supervised Classification > Drone2Map
24 4. Conclusions The sub-grid model forecasted tidal flooding during Hurricane Matthew in Sept and was well validated via tide gauges and Sea Level Rise App GPS extent data: Vertical Accuracy: aggregate RMSE of 8.19 cm (n=5; 416ts each) Horizontal Accuracy: distance diff. of m (n=263; GPS pts) Through StormSense, 24 more sensors are planned for installation throughout Hampton Roads by the end of July, courtesy of NIST RSCT funds, VDEM, & Virginia Beach CIP.
25 4. Conclusions (cont d) Tropical Storm Julia caused more than 14 inches of rainfall over 3 days time in parts of Norfolk, Chesapeake, and Virginia Beach. The NWS under-predicted this amount by as much as 4 inches in some parts of Hampton Roads This caused model under-prediction for Hurricane Matthew in inland regions when compared with Drone2Map surveyed extents for an Avg. Horizontal Dist. Diff.=14.39m (n = 263 pts).


26 Thank You
Cities Becoming Smarter: Preparing for Regional Resilience
 Cities Becoming Smarter: Preparing for Regional Resilience Sridhar Katragadda Systems Analyst City of Virginia Beach Dr. Jon Derek Loftis Asst. Research Scientist VA Inst. of Marine Science Tammie Organski
A Cloud-Based Flood Warning System For Forecasting Impacts to Transportation Infrastructure Systems
 A Cloud-Based Flood Warning System For Forecasting Impacts to Transportation Infrastructure Systems Jon Goodall Associate Professor, Civil and Environmental Engineering Associate Director, Link Lab April
Embracing ArcGIS Server Technology A City s Balanced Approach
 Embracing ArcGIS Server Technology A City s Balanced Approach Sridhar Katragadda Virginia Johnston Esri UC2013. About the City Virginia Beach Metropolitan Statistical Area (MSA) is the 38th largest in
Sea level rise Web GIS Applications
 Florida International University FIU Digital Commons GIS Center GIS Center 2018 Sea level rise Web GIS Applications Zhaohui Fu GIS-RS Center, Florida International University, Fujen@fiu.edu Sheyla Santana
The Costs of Doing Nothing: Economic Consequences of Not Adapting to Sea Level Rise in the Hampton Roads Region. Photo courtesy of VIMS
 The Costs of Doing Nothing: Economic Consequences of Not Adapting to Sea Level Rise in the Hampton Roads Region Photo courtesy of VIMS Costs of Doing Nothing: Economic Consequences of Not Adapting to Sea
The Science of Sea Level Rise and the Impact of the Gulf Stream
 Old Dominion University ODU Digital Commons July 29, 2016: The Latest in Sea Level Rise Science Hampton Roads Sea Level Rise/Flooding Adaptation Forum 7-29-2016 The Science of Sea Level Rise and the Impact
Complete Weather Intelligence for Public Safety from DTN
 Complete Weather Intelligence for Public Safety from DTN September 2017 White Paper www.dtn.com / 1.800.610.0777 From flooding to tornados to severe winter storms, the threats to public safety from weather-related
John Callahan (Delaware Geological Survey) Kevin Brinson, Daniel Leathers, Linden Wolf (Delaware Environmental Observing System)
 Kevin Brinson, Daniel Leathers, Linden Wolf (Delaware Environmental Observing System)") John Callahan (Delaware Geological Survey) Kevin Brinson, Daniel Leathers, Linden Wolf (Delaware Environmental Observing System) Delaware is extremely vulnerable to the impacts of coastal flooding Tropical
John Callahan (Delaware Geological Survey) Kevin Brinson, Daniel Leathers, Linden Wolf (Delaware Environmental Observing System) Delaware is extremely vulnerable to the impacts of coastal flooding Tropical
Information. Information Technology. Geographic. Services (GIS) 119 W Indiana Ave Deland, FL 32720
 119 W Indiana Ave Deland, FL 32720") Information Technology Geographic Information Services (GIS) 119 W Indiana Ave Deland, FL 32720 A GIS consists of 5 primary components: Hardware Software People Data Methods or Business Processes --- Hardware
Information Technology Geographic Information Services (GIS) 119 W Indiana Ave Deland, FL 32720 A GIS consists of 5 primary components: Hardware Software People Data Methods or Business Processes --- Hardware
Evaluating e-government : implementing GIS services in Municipality
 Evaluating e-government : implementing GIS services in Municipality Municipality of Thessaloniki - G.I.S. Unit Misirloglou Symeon Head of the GIS Unit ESRI UC - 2016 The GIS Section - subset of the department
Challenges in providing effective flood forecasts and warnings
 Challenges in providing effective flood forecasts and warnings National Centre for Flood Research Inaugural Symposium Justin Robinson Bureau of Meteorology October 2018 Zero Lives Lost A key responsibility
ArcGIS is Advancing. Both Contributing and Integrating many new Innovations. IoT. Smart Mapping. Smart Devices Advanced Analytics
 ArcGIS is Advancing IoT Smart Devices Advanced Analytics Smart Mapping Real-Time Faster Computing Web Services Crowdsourcing Sensor Networks Both Contributing and Integrating many new Innovations ArcGIS
HURRICANE MATTHEW A GIS PERSPECTIVE GLYNN COUNTY GIS
 HURRICANE MATTHEW A GIS PERSPECTIVE GLYNN COUNTY GIS Situation September 25 th October 9 th 2016 Hurricane Matthew tracked its way up the east coast bringing hurricane force winds and flooding from Haiti
esri.com/apps Copyright 2017 Esri. All rights reserved.
 ArcGIS Apps esri.com/apps Copyright 2017 Esri. All rights reserved. 159913 G79379 ArcGIS Apps Survey123 for ArcGIS Included with ArcGIS Survey123 for ArcGIS Create survey style forms to capture accurate
NOAA Inundation Dashboard
 NOAA Inundation Dashboard Audra Luscher & Paul Fanelli NOS Center for Operational Oceanographic Products & Services (CO-OPS) Hampton Roads Sea Level Rise/Flooding Adaptation Forum July 29, 2016 http://tidesandcurrents.noaa.gov/inundationdb/newyork.html
GIS Resources for Local Governments
 ISSUE PAPER SERIES GIS Resources for Local Governments February 2018 NEW YORK STATE TUG HILL COMMISSION DULLES STATE OFFICE BUILDING 317 WASHINGTON STREET WATERTOWN, NY 13601 (315) 785-2380 WWW.TUGHILL.ORG
Application of high-resolution (10 m) DEM on Flood Disaster in 3D-GIS
 DEM on Flood Disaster in 3D-GIS") Risk Analysis V: Simulation and Hazard Mitigation 263 Application of high-resolution (10 m) DEM on Flood Disaster in 3D-GIS M. Mori Department of Information and Computer Science, Kinki University, Japan
Risk Analysis V: Simulation and Hazard Mitigation 263 Application of high-resolution (10 m) DEM on Flood Disaster in 3D-GIS M. Mori Department of Information and Computer Science, Kinki University, Japan
A New National Flood Inundation Mapping Science Initiative
 A New National Flood Inundation Mapping Science Initiative William Guertal, PhD. Director, USGS Indiana and Kentucky Water Science Centers U.S. Department of the Interior U.S. Geological Survey Courtesy
USING MIKE TO MODEL COASTAL CATASTROPHE RISK
 USING MIKE TO MODEL COASTAL CATASTROPHE RISK Nicola Howe, Christopher Thomas, Joss Matthewman, John Maskell* 1 SUMMARY About RMS Who are we and what do we do? How do we use MIKE in our workflow? Case study:
Sea Level Rise and Hurricane Florence storm surge research methodology
 Sea Level Rise and Hurricane Florence storm surge research methodology Hurricane Florence storm surge analysis was conducted using a variety of input sources. In order to determine the maximum storm surge
Leveraging ArcGIS Server Technology
 Leveraging ArcGIS Server Technology A Local Government Approach Virginia Johnston GIS Systems Analyst Virginia Beach 39 th Largest city in the United States 438,000 Residents City by the Sea Located in
ERDC Support for Hurricane Sandy
 ERDC Support for Hurricane Sandy Chris Massey, CHL; Aaron Byrd, CHL; Nawa Pradhan, CHL; Jeff Melby, CHL; Jane Smith, CHL; Robert Walker, ITL; and Jennifer Wozencraft, JALBTCX ERDC Support for Hurricane
Storm Surge/Coastal Inundation State of the Union. Jamie Rhome Storm Surge Team Lead NOAA/National Hurricane Center
 Storm Surge/Coastal Inundation State of the Union Jamie Rhome Storm Surge Team Lead NOAA/National Hurricane Center 2 Tampa: Cat 5 Scenario 3 4 The Stakes are High Combination of SLR and increasing coastal
Google Maps and Beyond
 Google Maps and Beyond Aaron Paul First American Title apaul@firstam.com 2015 APRA Symposium Association of Professional Reserve Analysts May 2 nd, 2015 Google Maps and Beyond - Overview Business case
12/07/2017. Flash Flood Warning Service, an advanced approach towards flood resilient cities Floodplain Management Association Conference, Newcastle
 12/07/2017 Worldwide problem: Flash Floods Flash Floods are a Global Problem Flash Flood Warning Service, an advanced approach towards flood resilient cities Floodplain Management Association Conference,
NWS HURRICANES June 3, 2015
 NWS HURRICANES June 3, 2015 Hurricane Season June 1 November 30 2 What s the concern? All tropical systems passing within 125nm of central Maryland since 1950 Mid-Atlantic Hurricanes Greatest Risk: August
Time Series Analysis with SAR & Optical Satellite Data
 Time Series Analysis with SAR & Optical Satellite Data Thomas Bahr ESRI European User Conference Thursday October 2015 harris.com Motivation Changes in land surface characteristics mirror a multitude of
Positioning the Pacific: NOAA s Geospatial Activities. Juliana Blackwell, Director NOAA s National Geodetic Survey March 6, 2012
 Positioning the Pacific: NOAA s Geospatial Activities Juliana Blackwell, Director NOAA s National Geodetic Survey March 6, 2012 A Common Problem of the Early 19 th Century 1807 President Thomas Jefferson
3301 Rickenbacker Causeway, Miami, FL 33149
 Virginia Key and Miami Beach 2016 King Tide Report and Projections (to 2045) using: 3301 Rickenbacker Causeway, Miami, FL 33149 *THIS REPORT IS PROVIDED SUBJECT TO THE COASTAL RISK CONSULTING, LLC, PRINTED
FLOOD HAZARD AND RISK ASSESSMENT IN MID- EASTERN PART OF DHAKA, BANGLADESH
 FLOOD HAZARD AND RISK ASSESSMENT IN MID- EASTERN PART OF DHAKA, BANGLADESH Muhammad MASOOD MEE07180 Supervisor: Prof. Kuniyoshi TAKEUCHI ABSTRACT An inundation simulation has been done for the mid-eastern
The Storm Surge and Inundation Modeling for Nor easter Event in the Chesapeake Bay, and Super-Regional Testbed in the Gulf of Mexico
 The Storm Surge and Inundation Modeling for Nor easter Event in the Chesapeake Bay, and Super-Regional Testbed in the Gulf of Mexico Harry Wang, Jie Gao, Derek Loftis and Yi-cheng Teng Department of Physical
BECQ 2017 SLR Map Layer Updates: Methodology for Coastal Flood Geoprocessing
 BECQ 2017 SLR Map Layer Updates: Methodology for Coastal Flood Geoprocessing This paper summarizes the local and regional sea level data used to develop coastal flooding scenarios for the island of Saipan,
Storm Surge Analysis Update Meeting Cross City, Florida June 17, 2014
 Big Bend Coastal Storm Surge Study Storm Surge Analysis Update Meeting Cross City, Florida June 17, 2014 Introductions Risk MAP Project Team FEMA Region IV Florida Division of Emergency Management (FDEM)
Modeling Storm Surge for Emergency Management
 Modeling Storm Surge for Emergency Management Study Area: Guam is the southern-most island of the Mariana Archipelago and is located at 13 28 N, 144 47 E. It has a total area of 541.3 sq. km. and the highest
3/29/11. Why bother with tools? Incorporating Decision Support Tools into Climate Adaptation Planning. A Simplified Planning Process
 Incorporating Decision Support Tools into Climate Adaptation Planning Why bother with tools? Tools don t eliminate complexity but they can help deal with it" Tools can:"! Help incorporate science into
Calhoun County, Texas Under 5 Meter Sea Level Rise
 Kyle Kacal GEO 327G Calhoun County, Texas Under 5 Meter Sea Level Rise PROBLEM AND PURPOSE: Sea level rise is threat to all coastal areas. Although natural sea level rise happens at a very slow rate, hurricanes
September 13, 2018 MEDIA RELEASE. Waynesboro Department of Emergency Management Waynesboro Police Department Waynesboro Fire Department
 MEDIA RELEASE September 13, 2018 The City continues to prepare for and monitor the track and potential impacts of Hurricane Florence. Current guidance from the National Weather Service, the National Hurricane
Fort Lauderdale s GIS Supports Response to. Hurricane Irma
 Fort Lauderdale s GIS Supports Response to Hurricane Irma By Monica Pratt, ArcUser Editor When Hurricane Irma first made landfall in the Florida Keys on September 10, 2017, it brought destructive 70 mph
USACE-ERDC Coastal Storm Modeling System Updates Chris Massey, PhD
 USACE-ERDC Coastal Storm Modeling System Updates Chris Massey, PhD Research Mathematician USACE-ERDC Coastal & Hydraulics Lab Chris.Massey@usace.army.mil ERDC s Coastal Storm-Modeling System (ERDC CSTORM-MS)
Lessons Learned and Shared
 Lessons Learned and Shared Plan for the worst. Hope for the best. Remember that hope is not a strategy. Agnes 8 Lessons 1. Identify Susceptible Communities 2. Develop a Plan 3. Threat Recognition 4. Review
Emergency Planning. for the. Democratic National. Convention. imaging notes // Spring 2009 //
 Emergency Planning for the Democratic National Convention The DRAPP Demonstrates Partnership among Local, Regional, State, Utility and Federal Governments 14 imaging notes // Spring 2009 // www.imagingnotes.com
Crystal Goodison & Alexis Thomas University of Florida GeoPlan Center
 Crystal Goodison & Alexis Thomas University of Florida GeoPlan Center A1A Fort Lauderdale, Hurricane Sandy, October 2012 Photo Credits: Susan Stocker, Sun Sentinel FAU s Research Report (completed Jan
Planning for Annapolis Sea Level Rise and Future Extreme Water Levels
 Planning for Annapolis Sea Level Rise and Future Extreme Water Levels U.S. Naval Academy Sea Level Rise Advisory Council 31 October 2017 CAPT Emil Petruncio, USN (Ret.), PhD Associate Professor Gina Henderson
Significant Flooding Expected
 Significant Flooding Expected Decision Support Briefing #5 As of: 9:00 AM September 14, 2018 What Has Changed? Flash Flood Watch now in effect for part of area, will be expanded later today 9/14/2018 9:23
Hydrologic Engineering Applications of Geographic Information Systems
 Hydrologic Engineering Applications of Geographic Information Systems Davis, California Objectives: The participant will acquire practical knowledge and skills in the application of GIS technologies for
Exelis and Esri Technologies for Defense and National Security. Cherie Muleh
 Exelis and Esri Technologies for Defense and National Security Cherie Muleh Cherie.Muleh@exelisinc.com ENVI IMAGERY AND DATA BECOME KNOWLEDGE > Add information from imagery to your GIS > Automated workflows
Write a report (6-7 pages, double space) on some examples of Internet Applications. You can choose only ONE of the following application areas:
 on some examples of Internet Applications. You can choose only ONE of the following application areas:") UPR 6905 Internet GIS Homework 1 Yong Hong Guo September 9, 2008 Write a report (6-7 pages, double space) on some examples of Internet Applications. You can choose only ONE of the following application
UPR 6905 Internet GIS Homework 1 Yong Hong Guo September 9, 2008 Write a report (6-7 pages, double space) on some examples of Internet Applications. You can choose only ONE of the following application
Flood Inundation Mapping
 KU GIS Day 2009 November 18, 2009 Flood Inundation Mapping Wendy L. Pearson NOAA s National Weather Service Central Region Headquarters Kansas City, Missouri Flood Inundation Mapping Objectives: Overview
Geoprocessing Hydrometeorological Datasets to Assess National Weather Service (NWS) Forecasts
 Forecasts") Geoprocessing Hydrometeorological Datasets to Assess National Weather Service (NWS) Forecasts Jack Settelmaier National Weather Service Southern Region HQ Fort Worth, Texas ABSTRACT The National Weather
Geoprocessing Hydrometeorological Datasets to Assess National Weather Service (NWS) Forecasts Jack Settelmaier National Weather Service Southern Region HQ Fort Worth, Texas ABSTRACT The National Weather
Climate Adaptation Challenges for Boston s Water and Sewer Systems
 National Association of Flood & Stormwater Management Agencies Climate Adaptation Challenges for Boston s Water and Sewer Systems John P Sullivan P.E. October 15,2014 Boston 1630 Boston 1630-2012 Boston
2017 Hurricane Season and Beyond
 2017 Hurricane Season and Beyond Ken Graham National Hurricane Center Building a Weather-Ready Nation Much of U.S. Coast Saw Tropical Wind Watches or Warnings 2017 Hurricane Season Facts and Figures 7th
PUBLIC OUTREACH THROUGH GIS
 PUBLIC OUTREACH THROUGH GIS Tim Witt, Department of Earth Sciences, University of South Alabama, Mobile, AL 36688. E-mail: tw501@jaguar1.usouthal.edu. In this paper, I propose a few ways, by using GIS
Miami-Dade County Technical Update Meeting South Florida Coastal Study. May 11, 2016
 Miami-Dade County Technical Update Meeting South Florida Coastal Study May 11, 2016 Welcome and Introductions FEMA Region IV Christina Lindemer Technical Lead Production and Technical Services (PTS) Contractor
Name NRS 409 Exam I. 1. (24 Points) Consider the following questions concerning standard data for GIS systems.
 Consider the following questions concerning standard data for GIS systems.") Read every question carefully. You may use a calculator if you wish. Conversion tables are provided at the end of the exam. If you have any questions, raise your hand. Be sure to show your work on computational
Read every question carefully. You may use a calculator if you wish. Conversion tables are provided at the end of the exam. If you have any questions, raise your hand. Be sure to show your work on computational
A More Comprehensive Vulnerability Assessment: Flood Damage in Virginia Beach
 A More Comprehensive Vulnerability Assessment: Flood Damage in Virginia Beach By Raj Shah GIS in Water Resources Fall 2017 Introduction One of the most obvious effects of flooding events is death. Humans
Tracking Storm Tide and Coastal Flooding During Hurricane Matthew
 Tracking Storm Tide and Coastal Flooding During Hurricane Matthew Stephen Harden, Jeanne Robbins, and Eric Frantz U.S. Geological Survey, South Atlantic Water Science Center Presented to: WRRI Annual Conference
TROPICAL STORM NATE BRIEFING
 TROPICAL STORM NATE BRIEFING 5:00 AM CDT Friday, October 6, 2017 Prepared by: NWS NWSNewOrleans www.weather.gov/neworleans Situation Overview No significant changes to the track forecast this morning.
COASTAL DATA APPLICATION
 2015 Coastal GeoTools Proactive By Design. Our Company Commitment COASTAL DATA APPLICATION Projecting Future Coastal Flood Risk for Massachusetts Bay Bin Wang, Tianyi Liu, Daniel Stapleton & Michael Mobile
Key Processes
 Data Manipulation and Extraction Key Processes Key Processes Re-Projecting Data Selecting by Attributes Exporting Data Hillshade Reclassification Conversion of Raster to Vector Re-Projecting Data Purpose
Communications and Lessons Learned from
 Weather Forecast Office Charleston, SC Communications and Lessons Learned from Southeast and Caribbean and Climate Community of Practice - April, 2017 Public Information and Communications During Extremes
A Realtime Forecasting System for the Chesapeake Bay Tributaries: Interoperability and Metadata for Automation
 A Realtime Forecasting System for the Chesapeake Bay Tributaries: Interoperability and Metadata for Automation David Forrest Virginia Institute of Marine Science drf@vims.edu East Coast ELCIRC grid Mixed
United States Multi-Hazard Early Warning System
 United States Multi-Hazard Early Warning System Saving Lives Through Partnership Lynn Maximuk National Weather Service Director, Central Region Kansas City, Missouri America s s Weather Enterprise: Protecting
ICAN Great Lakes 2010 Workshop
 ICAN Great Lakes 2010 Workshop Chris Cortina Maryland s Chesapeake & Coastal Program MD Department of Natural Resources Maryland s Coastal Atlas: What is it? The Coastal Atlas is an online mapping and
Between 6 am to 4 pm the next day approximately 7.5 inches fell. Chesapeake Bay Bridge Tunnel NOAA Tide Gage
 Ocean Park Alternative Drainage Route Analysis February, 2012 November 11 14, 2009 Between 6 am to 4 pm the next day approximately 7.5 inches fell Chesapeake Bay Bridge Tunnel NOAA Tide Gage Hurricane
KING GEORGE COUNTY DEPARTMENT OF COMMUNITY DEVELOPMENT
 GIS REPORT 2016 KING GEORGE COUNTY DEPARTMENT OF COMMUNITY DEVELOPMENT Background The GIS (Geographic Information System) coordinator was hired in 2001 to develop a GIS for King George County. Prior to
Leon Creek Watershed October 17-18, 1998 Rainfall Analysis Examination of USGS Gauge Helotes Creek at Helotes, Texas
 Leon Creek Watershed October 17-18, 1998 Rainfall Analysis Examination of USGS Gauge 8181400 Helotes Creek at Helotes, Texas Terrance Jackson MSCE Candidate University of Texas San Antonio Abstract The
Sea-Level Rise Impacts on South Florida
 Sea-Level Rise Impacts on South Florida Keren Prize Bolter, PhD Science Director, Coastal Risk Consulting. LLC 5/3/16 FAQ list What is happening? What impacts are we already seeing? Just how vulnerable
IRENE: Visitor from the Extratidal World
 IRENE: Visitor from the Extratidal World John Boon Professor Emeritus Virginia Institute of Marine Science School of Marine science College of William and Mary Hurricane Irene did not come to Hampton Roads
USING GIS CARTOGRAPHIC MODELING TO ANALYSIS SPATIAL DISTRIBUTION OF LANDSLIDE SENSITIVE AREAS IN YANGMINGSHAN NATIONAL PARK, TAIWAN
 CO-145 USING GIS CARTOGRAPHIC MODELING TO ANALYSIS SPATIAL DISTRIBUTION OF LANDSLIDE SENSITIVE AREAS IN YANGMINGSHAN NATIONAL PARK, TAIWAN DING Y.C. Chinese Culture University., TAIPEI, TAIWAN, PROVINCE
Portal for ArcGIS: An Introduction
 Portal for ArcGIS: An Introduction Derek Law Esri Product Management Esri UC 2014 Technical Workshop Agenda Web GIS pattern Product overview Installation and deployment Security and groups Configuration
What s New in Collector for ArcGIS (Aurora)
") What s New in Collector for ArcGIS (Aurora) Derek Law (dlaw@esri.com) Esri Apps Product Management @GIS_Bandit Oct 10 th, 2018 Agenda Product overview Use cases Preparing data for Collector for ArcGIS
What s New in Collector for ArcGIS (Aurora) Derek Law (dlaw@esri.com) Esri Apps Product Management @GIS_Bandit Oct 10 th, 2018 Agenda Product overview Use cases Preparing data for Collector for ArcGIS
What is CERA? Coastal Emergency Risks Assessment
 What is CERA? Coastal Emergency Risks Assessment Visualization tool using OGC standards Displays the outputs from the ADCIRC storm surge model or other coastal models Represents the maps on interactive
Geospatial Fire Behavior Modeling App to Manage Wildfire Risk Online. Kenyatta BaRaKa Jackson US Forest Service - Consultant
 Geospatial Fire Behavior Modeling App to Manage Wildfire Risk Online Kenyatta BaRaKa Jackson US Forest Service - Consultant Fire Behavior Modeling and Forest Fuel Management Modeling Fire Behavior is an
Hurricane Matthew Threats and Impacts Briefing for Eastern NC
 Hurricane Matthew Threats and Impacts Briefing for Eastern NC October 6 th, 2016 Date/Time Created: 10/6/2016, Noon EDT National Weather Service Newport/Morehead City, NC Hurricane Matthew Key Points Changes
Active Weather Threat Halloween Week Nor easter October 28 th 31 st 2012
 Active Weather Threat Halloween Week Nor easter October 28 th 31 st 2012 Prepared 1130 AM EDT Wednesday, October 24, 2012 Gary Szatkowski NOAA s NJ Forecast Office Weather.gov/phi Purpose of Briefing Briefing
Geospatial natural disaster management
 Geospatial natural disaster management disasters happen. are you ready? Natural disasters can strike almost anywhere at any time, with no regard to a municipality s financial resources. These extraordinarily
European Geosciences Union General Assembly Vienna, Austria 27 April - 02 May 2014
 European Geosciences Union General Assembly Vienna, Austria 27 April - 02 May 2014 Projecting the Current & Future Impact of Storm Surges on Coastal Flood Extent at Pigeon Point, South-West Tobago, through
Climate Change and Mapping of the Future Nature
 Climate Change and Mapping of the Future Nature The XXIV FIG International Congress 2010 TS 4E Coasts and Natural Resources Tuesday 13 April Mr. Jesper Rye Rasmussen Denmark on the map Sydney, Australia,
An Overview of Operations at the West Gulf River Forecast Center Gregory Waller Service Coordination Hydrologist NWS - West Gulf River Forecast Center
 National Weather Service West Gulf River Forecast Center An Overview of Operations at the West Gulf River Forecast Center Gregory Waller Service Coordination Hydrologist NWS - West Gulf River Forecast
A HURRICANE IS COMING. Presented by Atiba Upchurch Broward Emergency Management Division
 A HURRICANE IS COMING Presented by Atiba Upchurch Broward Emergency Management Division Mission Statement To safeguard the lives and property of the people of Broward County from major hazards and emergencies
Introducing the. a partnership of
 Introducing the a partnership of Background Need for online atlas identified by managers and researchers to make coastal data available Shoreline data Ocean and coastal resources Sea-level rise potential
Advanced Image Analysis in Disaster Response
 Advanced Image Analysis in Disaster Response Creating Geographic Knowledge Thomas Harris ITT The information contained in this document pertains to software products and services that are subject to the
NOAA s National Weather Service. National Weather Service
 NOAA s National Weather Service Serving the Nation s Environmental Forecasting Needs Lynn Maximuk Regional Director National Weather Service Central Region Headquarters Kansas City, Missouri America s
IH 35 at Blanco River May 2015
 IH 35 at Blanco River May 2015 Presentation Objectives Background of historical damage assessment processes Introduction to Collector App ( Mat Peck) Collector App and Flood Damage Assessment (Katie Steele)
Floodplain Mapping & Flood Warning Applications in North Carolina
 Floodplain Mapping & Flood Warning Applications in North Carolina Marc Stanard, IT Project Manager Ken Ashe, Assistant Director David Herlong, Flood Warning Program Manager NC Crime Control & Public Safety
Data Aggregation with InfraWorks and ArcGIS for Visualization, Analysis, and Planning
 Data Aggregation with InfraWorks and ArcGIS for Visualization, Analysis, and Planning Stephen Brockwell President, Brockwell IT Consulting, Inc. Join the conversation #AU2017 KEYWORD Class Summary Silos
Tools to Assess Flood Risk of Commercial Property Investment
 Tools to Assess Flood Risk of Commercial Property Investment NSERC Workshop March 1, 2016 Kate Collins, Tim Webster, Nathan Crowell AGRG, NSCC, Middleton, NS https://eatsleepride.com/ http://users.eastlink.ca/~tbulley/
Coastal Emergency Risks Assessment - CERA Real-Time Storm Surge and Wave Visualization Tool
 Coastal Emergency Risks Assessment - CERA Real-Time Storm Surge and Wave Visualization Tool Introduction This document provides guidance for using the Coastal Emergency Risks Assessment (CERA) visualization
Adaptation to Sea Level Rise A Regional Approach
 Adaptation to Sea Level Rise A Regional Approach Project Partners: in Saco Bay, ME Peter Slovinsky, Marine Geologist Maine Geological Survey, Department of Conservation Project Funding from: Saco Bay Hazards
8 th 12 th Designing a Monitoring Plan Mapping & Analysis (Activities 1 2)
") 8 th 12 th Designing a Monitoring Plan Mapping & Analysis (Activities 1 2) Objectives for All Activities - To be able to define and describe the purpose and uses of topographic maps. - To define rules
8 th 12 th Designing a Monitoring Plan Mapping & Analysis (Activities 1 2) Objectives for All Activities - To be able to define and describe the purpose and uses of topographic maps. - To define rules
3Chapter Three: Rescue and Response
 17 16 Report Science Title and the Storms: the USGS Response to the Hurricanes of 2005 3Chapter Three: Rescue and Response This chapter documents the U.S. Geological Survey s (USGS) humanitarian rescue
HIGH RESOLUTION BASE MAP: A CASE STUDY OF JNTUH-HYDERABAD CAMPUS
 HIGH RESOLUTION BASE MAP: A CASE STUDY OF JNTUH-HYDERABAD CAMPUS K.Manjula Vani, Abhinay Reddy, J. Venkatesh, Ballu Harish and R.S. Dwivedi ABSTRACT The proposed work High Resolution Base map: A Case study
How to Read These Flood Hazard Maps
 How to Read These Flood Hazard Maps The United States Geological Survey (USGS) has developed the Coastal Storms Modeling System (CoSMoS), which projects coastal flooding and erosion from coastal storms,
Web GIS: Architectural Patterns and Practices. Shannon Kalisky Philip Heede
 Web GIS: Architectural Patterns and Practices Shannon Kalisky Philip Heede Web GIS Transformation of the ArcGIS Platform Desktop Apps Server GIS Web Maps Web Scenes Layers Web GIS Transformation of the
GIS Workshop Data Collection Techniques
 GIS Workshop Data Collection Techniques NOFNEC Conference 2016 Presented by: Matawa First Nations Management Jennifer Duncan and Charlene Wagenaar, Geomatics Technicians, Four Rivers Department QA #: FRG
GC Briefing. Weather Sentinel Tropical Storm Michael. Status at 8 AM EDT (12 UTC) Today (NHC) Discussion. October 11, 2018
 Today (NHC) Discussion. October 11, 2018") GC Briefing Weather Sentinel Tropical Storm Michael October 11, 2018 After making landfall as a high-end category-4 hurricane on the Florida Panhandle, Michael weakened to tropical storm status early this
GC Briefing Weather Sentinel Tropical Storm Michael October 11, 2018 After making landfall as a high-end category-4 hurricane on the Florida Panhandle, Michael weakened to tropical storm status early this
ArcGIS for Defense: Analyzing Environmental Impact on Operations. Jim Weakland John Fry Matt Funk
 ArcGIS for Defense: Analyzing Environmental Impact on Operations Jim Weakland John Fry Matt Funk Terrain and Weather Photo: U.S. Air Force/Senior Airman Areca T. Wilson Photo: Lance Cpl. Preston McDonald
Mapping Coastal Change Using LiDAR and Multispectral Imagery
 Mapping Coastal Change Using LiDAR and Multispectral Imagery Contributor: Patrick Collins, Technical Solutions Engineer Presented by TABLE OF CONTENTS Introduction... 1 Coastal Change... 1 Mapping Coastal
Optimizing Field Operations
 Optimizing Field Operations with ArcGIS Ismael Chivite Jeff Shaner Chris Lesueur Agenda Notes from the field ArcGIS apps Concepts Demonstrations Q&A Who are we? Ismael Chivite Jeff Shaner Chris LeSueur
Developing a Subdivision Build- Out Study and Site Suitability Tool; Enabling Access Through a Web GIS Application
 Developing a Subdivision Build- Out Study and Site Suitability Tool; Enabling Access Through a Web GIS Application DOUG SEXTON GEOG 596A SUMMER 2017 ADVISOR: DR. JAMES O BRIEN Project Outline Introduction