2010 Washington Metropolitan Area Drought Operations Summary and Lessons Learned
|
|
|
- Sylvia Waters
- 5 years ago
- Views:
Transcription
1 2010 Washington Metropolitan Area Drought Operations Summary and Lessons Learned Prepared by S.N. Ahmed, K.R. Bencala and C.L. Schultz December 2011 Section for Cooperative Water Supply Operations on the Potomac Interstate Commission on the Potomac River Basin 51 Monroe Street, Suite PE-08 Rockville, Maryland ICPRB Report No
2 This report was prepared by the Interstate Commission on the Potomac River Basin, Section for Cooperative Water Supply Operations on the Potomac. Funds were provided for this report by the Washington Suburban Sanitary Commission, the Washington Aqueduct Division of the U.S. Army Corps of Engineers, and the Fairfax County Water Authority. The opinions expressed are those of the authors and should not be construed as representing the opinions or policies of the United States or any of its agencies, the several states, the Commissioners of the Interstate Commission on the Potomac River Basin, or the water suppliers.
3 Table of Contents List of Tables... iii List of Figures... iii 1 Introduction Cooperative Water Supply Operations on the Potomac Hydrometeorological Conditions Regional Context Metropolitan Washington Drought Plan State Drought Declarations Communications Drought Operations Technical Meeting Daily Updates Water Supply Release Authorizations Communications Regarding Little Seneca Reservoir Water Supply Outlooks Website Updates Operations Drought Operations Timeline System Demands and Constraints Water Demand System Constraints Reservoir Releases Little Seneca Time of Travel Test Release Drought Operations Analysis Tools Data Download Tool Flow Forecasting Tools Daily Flow Forecast Tool Hourly Flow Forecast Tool Flow Forecasting Algorithms Lag Times Stream Flow Recession Algorithms i
4 4.3 Performance of Flow Forecasting Tools during Drought of Accuracy of Flow Prediction Tools Accuracy of Short-term Forecasts Accuracy of Nine-Day Forecasts Reservoir Refill Forecast Tools Conclusion References Appendix A Drought Monitoring and Operations Distribution Lists Appendix B Appendix C External Resources Appendix D Photo-documentation of Little Seneca Test Release ii
5 List of Tables Table 1: Summary of ICPRB's Water Supply Outlooks between April and October Table 2: Summer 2010 WMA water treatment plant production capacities (MGD) Table 3: Water supply releases from the North Branch reservoirs made in September Table 4: USGS stream flow gage stations used by CO-OP in Table 5: Estimates of area adjustment factors, lag times, and recession coefficients used in 2010 drought operations Table 6: Flow-dependent lag times between Little Falls and upstream gages given a range of flows at Little Falls Table 7: Flow-dependent lag times between Little Falls and upstream gages given a range of flows at Point of Rocks Table 8: Percentile values and mean errors of the Little Falls short-term flow forecasts, on days when adjusted Little Falls flow was in the range of 300 to 750 MGD Table 9: Nine-day forecast error s (forecasted minus observed flows) for four periods of drought List of Figures Figure 1: Map of the Potomac River basin, showing areas served by WMA suppliers and WMA water supply system resources Figure 2: Monthly precipitation in the Potomac River basin upstream of Little Falls, observed in 2010 and compared to normal. (Data from the Middle Atlantic River Forecast Center, 4 Figure 3: Comparison of monthly precipitation departures from normal in the Potomac River basin upstream of Little Falls, for 2002 and (Data from the Middle Atlantic River Forecast Center, 5 Figure 4: Comparison of normalized monthly groundwater levels for the Potomac basin in 2002 and Figure 5: Potomac Basin Drought Monitor map for September 26, 2010, published on September 28, 2010 (courtesy of Rich Tinker, NOAA, September 2010) Figure 6: General drought watch and warning declarations for the state of Maryland Figure 7: Nine counties in West Virginia were declared drought disaster areas in Figure 8: Signs were posted along the stream by Maryland-National Capital Park and Planning Commission Figure 9: Cooperative Water Supply Operations on the Potomac section main page Figure 10: Monitoring Updates page Figure 11: Stream flow on the Potomac at Point of Rocks, Maryland. In July 2010, flow fell below 2,000 cubic feet per second (cfs), triggering daily flow monitoring iii
6 Figure 12: 2010 adjusted daily flow at Little Falls, compared with the trigger for CO-OP drought operations, and flow percentiles for each day of the year computed from historical data Figure 13: Hourly withdrawal rates of the three WMA suppliers as observed at the Little Falls gage, compared with recent average and maximum September daily means ( ) Figure 14: Washington Aqueduct s hourly withdrawal rates as observed at the Little Falls gage Figure 15: Measured flow at Little Falls compared to the estimate of flow that would have been observed without the Jennings Randolph Reservoir water supply releases Figure 16: Spatial distribution of precipitation observed in the Potomac basin on September 12, Figure 17: Spatial distribution of precipitation observed in the Potomac basin on September 17, Figure 18: Flow forecasts during the time of travel test release from Little Seneca Reservoir. This set of flow forecasts includes the Seneca release as observed at Seneca Creek at Dawsonville, Maryland Figure 19: Flow forecasts during the time of travel test release from Little Seneca Reservoir. This set of flow forecasts exclude the Seneca release as observed at Seneca Creek at Dawsonville, Maryland Figure 20: Locations of USGS stream flow gage stations used by CO-OP in Figure 21: Gaged drainage areas used in the Point of Rocks prediction of Little Falls flow Figure 22: Gaged drainage areas used in the Hancock prediction of Little Falls flow Figure 23: Gaged drainage areas used in the Luke prediction of Little Falls flow Figure 24: Forecasts of observed flow at Little Falls for the period from September 1 through 15 as predicted on August 31. This graph was generated using the daily forecast tool Figure 25: Forecasts of observed flow at Little Falls for the period from September 1 through 15 as predicted on September 10. This graph was generated using the daily forecast tool Figure 26: Cumulative distribution function of adjusted Little Falls flow forecast errors (forecasted minus actual), based on forecasts for low flow days (adjusted Little Falls flow in range of 300 to 750 MGD) from 6/1/1930 through 12/31/ Figure 27: Comparisons of actual adjusted Little Falls flow with nine-day forecasts during the droughts of 1966, 1999, 2002, and 2010, with legend appearing on bottom graph Figure 28: Predictions for end of month storage in Jennings Randolph Reservoir given the actual storage level on October 31, Figure 29: Predictions for end of month storage in Savage Reservoir given the actual storage level on October 31, Figure 30: Percent storage in Jennings Randolph Reservoir starting when releases began and continuing until water supply storage returned to 100 percent full iv
7 1 Introduction The Washington, D.C., metropolitan area (WMA) relies on the Potomac River to supply approximately three quarters of the water it uses. The three major WMA water suppliers, Fairfax County Water Authority (Fairfax Water), the Washington Aqueduct Division of the U.S. Army Corps of Engineers (Washington Aqueduct), and the Washington Suburban Sanitary Commission (WSSC), participate in a unique cooperative system of water supply management that is designed to optimize use of available resources and ensure that ample water is available during periods of drought. This system includes joint funding of water supply storage in reservoirs located upstream of the WMA and coordinated operations when flows in the Potomac River fall below specified thresholds. The Section for Cooperative Water Supply Operations on the Potomac (CO-OP) of the Interstate Commission on the Potomac River Basin (ICPRB) assists in the management of this system by coordinating WMA supplier water withdrawals from the Potomac River and from off-river reservoirs during droughts and in determining when releases need to be made from upstream reservoirs to augment flow in the Potomac River. Drought conditions in the summer and fall of 2010 caused flow in the Potomac River to fall to levels requiring augmentation from upstream reservoirs for the third time since establishment of the cooperative system in the early 1980s. Reservoir releases were also required in 1999 and CO-OP staff began daily monitoring of Potomac River flows and WMA withdrawals on July 6, 2010, and requested releases from upstream reservoirs from September 10 through September 23. Cooperative operations between the three major water suppliers during this period, with coordination and technical support provided by CO-OP, ensured that sufficient water was available in the river at all times to meet water supply needs and to maintain the environmental flow recommendations at Great Falls and Little Falls. This report has been written to document events that occurred and lessons that were learned during 2010 drought operations to provide assistance to CO-OP and water utility staff in future years. Reports on drought operations conducted in 1999 (ICPRB, 1999) and in 2002 (Kiang and Hagen, 2003) contained invaluable information and guidance for current staff during fall 2010 operations. Section 1 of the current report includes a description of hydrological and meteorological conditions in the Potomac River basin and in basin states during the summer and fall of Section 2 contains a discussion of methods and procedures used to communicate with the water suppliers, other agencies, and the public. Section 3 details the operational procedures used by CO-OP staff to coordinate and manage water withdrawals and reservoir releases. The current report also includes a section that documents the flow prediction and other tools currently used by CO-OP staff during drought operations. Section 4 describes the spreadsheets and models relied upon by CO-OP staff to provide the flow and reservoir refill forecasts used to make decisions concerning releases and withdrawals. This section also includes a discussion of the performance of the flow forecasts during 2010 drought operations and analyses of the accuracy of the forecasts during past low flow periods based on historical flow data. 1
8 1.1 Cooperative Water Supply Operations on the Potomac The three WMA water suppliers currently provide water to nearly 4.3 million WMA residents, either directly or via their wholesale customers. Fairfax Water serves most of Fairfax County, Virginia, and the following wholesale customers in Virginia: Dulles International Airport, Fort Belvoir, Town of Herndon, Loudoun Water, Prince William County Service Authority, and the Virginia American Water Company (serving the City of Alexandria and Dale City). Washington Aqueduct serves the District of Columbia via the DC Water and Sewer Authority (DC Water), as well as portions of northern Virginia - Arlington County, the City of Falls Church, and the Town of Vienna. WSSC serves Montgomery and Prince George s counties in Maryland, provides a limited amount of water to Howard and Charles counties, and supplies water on an emergency basis to the City of Rockville and DC Water. WMA system resources consist of the Potomac River, Fairfax Water s Occoquan Reservoir, WSSC s Patuxent reservoirs, and two jointly funded upstream reservoirs that can release water to augment flow in the Potomac during low flow periods. These reservoirs are Jennings Randolph Reservoir, located on the North Branch of the Potomac River more than 200 miles upstream of Washington, D.C., and Little Seneca Reservoir, located to the northwest of the city in Black Hill Regional Park in Montgomery County, Maryland. In addition, the three WMA suppliers provide 80 percent of the operations and maintenance costs of Savage Reservoir, which is owned by the Upper Potomac River Commission and operated according to direction from the U.S. Army Corps of Engineers (USACE). The USACE typically operates the two North Branch reservoirs, Jennings Randolph and Savage, in a coordinated fashion, matching water supply releases from Jennings Randolph Reservoir at a five-to-one ratio with releases from Savage. System resources, along with areas served by the WMA suppliers, are depicted in Figure 1. 2

9 Figure 1: Map of the Potomac River basin, showing areas served by WMA suppliers and WMA water supply system resources. The WMA s cooperative approach to water supply management was formalized in a series of agreements in the late 1970s and early 1980s. The first of these agreements was the Low Flow Allocation Agreement (LFAA), signed in 1978 by the United States (Secretary of the Army), Maryland, Virginia, District of Columbia, Fairfax Water, and WSSC. The LFAA allocates the amount of water each supplier can withdraw from the Potomac River in the event that total flow is not sufficient to meet all needs (LFAA, 1978). On July 22, 1982, a set of agreements was signed which provides for the sharing of capital and operations and maintenance costs for water supply storage in Jennings Randolph Reservoir and Little Seneca Reservoir and of operations and maintenance costs for Savage Reservoir. On that same date, the Water Supply Coordination Agreement (WSCA) was signed by the United States (District Engineer, Baltimore District, Corps of Engineers, U.S. Army), Fairfax Water, WSSC, District of Columbia, and ICPRB (WSCA, 1982). In the WSCA, the three WMA suppliers agree to operate their respective water supply systems in a coordinated manner so as to provide the optimal utilization of all available water supply facilities for the benefit of the inhabitants of the Washington Metropolitan Area, and CO-OP agrees to 3
.")
10 provide the necessary administrative and technical support. The WSCA also includes, as an attachment, the Drought-Related Operations Manual for the Washington Metropolitan Area Water Suppliers (Drought Operations Manual). This document specifies the operating rules and procedures to be used by the water suppliers and by CO-OP during drought operations Hydrometeorological Conditions Dry conditions began developing in the Potomac River basin in April By the beginning of July, shortly before commencement of CO-OP daily drought monitoring, total precipitation in the basin for the previous three months was 3.5 inches less than normal (7.2 inches actual compared to 10.7 inches normal), a 33 percent deficit. At the beginning of September, a week before CO-OP drought operations commenced, total precipitation for the previous five months was 5.4 inches less than normal (12.7 inches actual versus 18.1 inches normal), a 30 percent deficit. Figure 2 shows actual 2010 monthly precipitation averages versus normal averages for the portion of the Potomac basin upstream of the U.S. Geological Survey (USGS) gage at Little Falls, calculated by the National Weather Service s Middle Atlantic River Forecast Center (MARFC) (available at Figure 3 is a comparison of monthly precipitation in 2010 and 2002, the two most recent drought years. Both figures show that dry conditions abated the last week of September 2010 as remnants of Hurricane Nicole drenched the eastern seaboard. Rainfall for the two-day period from September 30 to October 1, totaled 2 to 7 inches in most parts of the basin. Figure 2: Monthly precipitation in the Potomac River basin upstream of Little Falls, observed in 2010 and compared to normal. (Data from the Middle Atlantic River Forecast Center, 4

11 Figure 3: Comparison of monthly precipitation departures from normal in the Potomac River basin upstream of Little Falls, for 2002 and (Data from the Middle Atlantic River Forecast Center, During dry periods most of the water flowing in basin streams is baseflow, that is, groundwater that is discharged from basin aquifers. Therefore, low groundwater levels are often a precursor to abnormally low stream flow conditions. Groundwater levels in the Potomac basin were above normal in the early months of After a large mid-march snowmelt event, groundwater levels began declining in April and May and fell below normal between June and October. Figure 4 is a comparison of monthly normalized groundwater well levels in 2010 and in Unlike in the 2002 drought, low groundwater well levels did not begin until late spring. The lack of precipitation between April and August combined with the above average temperatures of the 2010 summer exacerbated the drought conditions, driving the groundwater well levels below normal. 5
.")
12 Figure 4: Comparison of normalized monthly groundwater levels for the Potomac basin in 2002 and Figure 5 is a map from the Potomac Basin Drought Monitor, prepared by the Climate Prediction Center of the National Oceanographic and Atmospheric Administration (NOAA). This map depicts drought conditions across the entire Potomac River basin on September 26, based on an indicator computed from a variety of hydrologic, soil moisture, and precipitation metrics. At that time, 16.3 percent of the basin, located upstream of Point of Rocks, was in extreme drought (D3); 33.6 percent was in severe drought (D2); 24.7 percent was in moderate drought (D1); and 25.3 percent was abnormally dry (D0). It was not until early November that the extreme drought conditions lifted, leaving 44.9 percent of the basin in a D1 condition and another 19.6 percent as D0. 6

13 Figure 5: Potomac Basin Drought Monitor map for September 26, 2010, published on September 28, 2010 (courtesy of Rich Tinker, NOAA, September 2010). 1.3 Regional Context Metropolitan Washington Drought Plan The Metropolitan Washington Council of Government s (MWCOG) Metropolitan Washington Water Supply and Drought Awareness Response Plan: Potomac River System (MWCOG, 2000) is a coordinated response plan for the region that details various triggers, actions, and messages for three different water restriction stages (Watch, Warning, and Emergency). Drought stages are declared by the Drought Coordination Committee (DCC), whose members consist of Chief Administrative Officers from MWCOG's 21 member governments, the general managers of area water utilities, water supply officials from the 7
14 Maryland Department of the Environment and the Virginia Department of Environmental Quality, and ICPRB CO-OP staff. The DCC is supported by staff from MWCOG, NOAA s Climate Prediction Center, and the USGS. The Watch stage can be declared when the NOAA indicates D1 drought levels for most of the Potomac basin. The Warning stage can be declared when the combined water supply storage at Jennings Randolph and Little Seneca reservoirs has dropped to 60 percent of capacity for five consecutive days with five percent probability of not being able to meet unrestricted water supply demands over the next one to two months. The Emergency stage is declared when there is a 50 percent probability of not being able to meet water supply demands over the next month. The drought response plan calls for voluntary reductions in water use during the Watch and Warning stages and mandatory restrictions in the Emergency stage. A table detailing each of the stages can be found at Conference calls of the DCC s Drought Coordination Technical Committee (DCTC) took place on July 12 and September 7, Both calls were held to discuss the potential need to issue a Drought Watch statement in the near future. The second call resulted in a DCTC recommendation to the DCC for declaration of a Drought Watch for citizens of the Washington metropolitan region. A press release was issued on September 9. During such Drought Watch periods, citizens and businesses are encouraged to conserve water to reduce demand on the region's water supply system. The area returned to the Normal" stage of the drought response plan on October State Drought Declarations The MWCOG drought response plan discussed above is applicable to the WMA. In addition, Maryland, Virginia, and West Virginia each declared drought warnings and/or watches applicable to areas outside of the WMA at various times during These declarations are made independently, based on specific conditions and criteria within each state. The Maryland Department of the Environment first declared a stream flow drought warning in the western part of Maryland on April 30, Between May and August, the area under either a watch or warning shifted around the basin. By mid-september, the Eastern and Central regions were under a watch, and the Western region was under a warning. By the end of September, only the Eastern and Western regions remained under a watch. These two regions were under the greatest number of watches and warnings for both stream flow and groundwater during the summer months (Figure 6). It was not until November that Maryland s drought status returned to normal. A summary of Maryland s drought declarations can be viewed at: /WaterPrograms/Water_Conservation/Current_Conditions/index.aspx. The Virginia Department of Environmental Quality declared a drought watch for the entire state on July 14, By November 12, all Virginia drought regions were released from the drought watch except for the Northern Virginia, Shenandoah, and Upper Rappahannock River regions. All state drought regions 8
: Berkeley, Grant, Hampshire, Hardy, Jefferson, Mineral, Morgan, Pendleton, and")

15 were finally released from the drought watch in December. Virginia drought status reports can be viewed at: On September 13, the governor of West Virginia declared the following nine counties as drought disaster areas (Figure 7): Berkeley, Grant, Hampshire, Hardy, Jefferson, Mineral, Morgan, Pendleton, and Preston. The contiguous counties also eligible were Barbour, Monongalia, Pocahontas, Randolph, Taylor, and Tucker. Then on September 29, 2010, U.S. Department of Agriculture-Farm Service Agency (FSA) confirmed nine counties in West Virginia were eligible for FSA emergency disaster loans because of losses caused by the drought and excessive heat that began April 1, Figure 6: General drought watch and warning declarations for the state of Maryland. Figure 7: Nine counties in West Virginia were declared drought disaster areas in
16 2 Communications Providing up-to-date information on current water resource conditions and operational requests is essential to successful drought operations. The WMA water suppliers are the first priority in terms of communicating changing conditions and operations, but there are a number of other players that require this information. Specifically, the U.S. Army Corps of Engineers (Baltimore office) needs daily updates in the event of a requested release from Jennings Randolph Reservoir, the MWCOG requires information on general conditions to help determine if a drought stage needs to be declared, and all the relevant organizations need accurate and timely information to disseminate to the general public. This section provides an overview of ICPRB CO-OP s communication procedures and how they were implemented during the 2010 drought operations. 2.1 Drought Operations Technical Meeting A meeting of key drought operations technical staff was held on September 8, a date that had originally been reserved for an organizational meeting to prepare for CO-OP s Annual Drought Exercise. The drought exercise was cancelled at the onset of actual drought conditions. Meeting participants included staff from ICPRB s CO-OP Section, Fairfax Water, WSSC, Washington Aqueduct, and the USACE. The purpose of the meeting was to: Update information about maximum and minimum water treatment plant production capacities, share information on any other current operational constraints, meet the operational personnel from the other utilities, discuss drought operations procedures, update contact information, and review reservoir conditions. 2.2 Daily Updates Daily communications occurred between the staffs of ICPRB CO-OP and the water suppliers. CO-OP began sending out daily updates on July 6, 2010, after flow at the USGS Point of Rocks gage fell below the threshold for commencement of daily monitoring specified in the drought operations manual, 2,000 cubic feet per second (cfs). During daily drought monitoring, utility staff report the previous day s withdrawal amount to CO-OP. CO-OP staff then send out an to the water suppliers and to interested stakeholders, summarizing these withdrawals, current flow conditions, and regional weather forecasts. As conditions worsened, CO-OP drought operations commenced. This occurs when either i) daily adjusted flow in the Potomac at Little Falls (defined to be the flow that would have been observed at Little Falls dam if had no WMA withdrawals occurred, computed as yesterday s observed flow at Little Falls plus total WMA withdrawals), less the amount required for flow-by over Little Falls dam, is less than twice the daily withdrawals, or ii) based on flow projections, CO-OP determines that there is a significant chance that releases from Jennings Randolph and/or Little Seneca reservoirs will be needed 10
17 within the next 10 days. During drought operations, the utilities report to CO-OP the previous day s hourly and average daily withdrawal rates and withdrawal rate predictions for the current and next day. CO-OP staff sends out a twice daily summary of this information, along with flow and reservoir conditions, weather forecasts, and recommended operations for each utility. In addition to distributing this information via to the key contacts, the daily (or twice daily) reports were posted to the ICPRB website so that conditions and operations could be referred back to at any time. A list of people on the 2010 drought monitoring distribution list is given in Appendix A. While drought operations were in effect, CO-OP staff contacted each utility at least once a day to verify the utility s ability to meet CO-OP s requested withdrawal targets and to discuss any operational concerns or anticipated challenges. This level of communication proved invaluable for getting detailed information on operational issues being experienced by each utility. 2.3 Water Supply Release Authorizations Before CO-OP sends a request to dam operators to initiate water supply releases from Little Seneca Reservoir or Jennings Randolph Reservoir, concurrence from the CO-OP utility general managers is required. Requests for concurrence are typically made via or, if necessary, by telephone. Three such requests were made during the 2010 drought, one for the Little Seneca Reservoir time-of-travel test release (September 8, 2010), one for the initial water supply release from Jennings Randolph (September 9, 2010), and a final one on September 23, 2010, that reinitiated the Jennings Randolph release after it had been discontinued. 2.4 Communications Regarding Little Seneca Reservoir In anticipation of possible drought operations, CO-OP sent a letter on September 3 to the Montgomery County Executive, with copies to the County Council. This letter advised them that water supply releases for Potomac River flow augmentation and/or a time-of-travel test were possible in the coming weeks (see Appendix B). This letter was also forwarded to Jim McMahon, manager of Black Hill Regional Park, where Little Seneca Reservoir is located. Additionally, CO-OP staff contacted McMahon by phone to ensure proper notification. As a result of this, CO-OP has been asked in the future to also notify the Maryland-National Capital Park and Planning Commission Director of Parks. This request has been added to the operational guidance manual used internally by ICPRB CO-OP. On September 8, both McMahon and Parks Director Mary Bradford were advised that a 50 million gallon per day (MGD), 24-hour time-of-travel test release was scheduled to begin the next day. The staff of Black Hill Regional Park posted signs at public access points downstream of the reservoir to advise that water levels would be rising due to a water supply release (Figure 8). On the morning of the release, ICPRB CO-OP staff observed the release from the Montgomery County park, Lodge at Little Seneca Creek. Photographs at this site before and after the release are in Appendix D. 11
 are published on a monthly basis from April through October of every year, as specified by the Drought Operations Manual.")
18 Figure 8: Signs were posted along the stream by Maryland-National Capital Park and Planning Commission. 2.5 Water Supply Outlooks Water Supply Outlooks (Outlooks) are published on a monthly basis from April through October of every year, as specified by the Drought Operations Manual. Outlooks may be published more frequently during periods of drought. These Outlooks estimate the probability of Little Falls natural flow dropping below levels that may require reservoir releases from Potomac basin water supply storages. The probabilities are estimated by a model which uses nonparametric regression techniques and hydrological data from previous months. Data inputs for the WSO model are: 1. The past 30-day minimum of natural flow at Little Falls, where the natural flow is defined as USGS daily flows for the Potomac River at Little Falls plus total Potomac water supply withdrawals from the Washington metropolitan area (Fairfax Water, WSSC, Aqueduct, Rockville), with an adjustment made to remove the effects of flow regulation by Jennings Randolph Reservoir and Savage Reservoir, 2. past 12-month precipitation average for the Potomac basin upstream of Little Falls obtained from the MARFC, 3. monthly groundwater index calculated from the most recent readings from a subset of wells in the Potomac River basin, obtained from the USGS, and 4. Palmer Drought Severity Index (PDSI) for the basin estimated by taking the area weighted average of the index values for ten climate divisions obtained from the National Climate Data Center (NCDC). The 2010 Outlooks, starting in July and continuing through October, reported that the conditional probability was higher than the historical probability for natural flow at Little Falls to fall below the model s thresholds of 600 MGD and 700 MGD (see Table 1). This indicated that the basin was currently and could continue to experience drier than normal conditions in the near future. However, with the conditional probabilities of low flow conditions ranging from 10 to 27 percent, there was still a good chance that reservoir releases would not be needed. 12
19 The September Outlook, issued a few days before the commencement of reservoir releases, indicated a 11 and 17 percent conditional probability that natural flow at Little Falls would fall below thresholds of 600 MGD or 700 MGD, respectively (see Table 1). Given the dry conditions and the obvious likelihood of a release, at least one stakeholder questioned why these probabilities were not higher. This confusion indicates that the meaning of the Outlook probabilities could have been better explained to the Outlook audience. The Outlook model uses a monthly time step, and therefore it is only appropriate to interpret results at a similar time scale. The rather low probabilities of future reservoir releases predicted by the model were a reflection of the fact that even if flows had dropped to very low levels sometime in the previous 30-day period, there was a significant chance that there would be a change in hydrometeorological conditions leading to higher flows in the ensuing 30-day period. It should also be noted that the Outlook model does not spatially differentiate between conditions at various locations in the basin. For example, upstream conditions were consistently much worse than downstream conditions throughout the 2010 drought operations. Therefore, it is possible that average basin conditions used in the conditional probability calculation were misrepresenting the local conditions at Little Falls. Most importantly, a small or lower-than-normal probability does not necessarily mean that natural flow at Little Falls will not drop to levels requiring reservoir releases in the near future. Table 1: Summary of ICPRB's Water Supply Outlooks between April and October Month Historical probability of natural flow lower than: Conditional probability of natural flow lower than: Number of days in 2010 with natural flow lower than: Releases made in MGD 700 MGD 600 MGD 700 MGD 600 MGD 700 MGD April 10% 16% 3% 5% 0 0 None May 10% 16% 7% 11% 0 0 None June 10% 16% 5% 6% 0 0 None July 10% 16% 20% 27% 0 0 None August 10% 14% 11% 19% 0 0 None September 8% 13% 11% 17% Jennings Randolph October 1% 4% 9% 10% 0 0 None 2.6 Website Updates The Cooperative Water Supply Operations on the Potomac section of ICPRB s main webpage ( was updated to reflect 2010 drought operation activities, as shown in the screenshot in Figure 9. This page displays a prominent message on the CO-OP drought monitoring status. The status is identified as either ACTIVE daily, ACTIVE hourly, or NOT ACTIVE. 13

20 Additional drought material could be navigated to by clicking on one of the link options on the left side of the main CO-OP page or any subsequent pages within the CO-OP section of ICPRB s website. For example, more detailed documentation of the most recent drought activities could be viewed by clicking on Monitoring Updates. The monitoring update page documented the updates, reservoir releases, and significant weather events (Figure 10). Figure 9: Cooperative Water Supply Operations on the Potomac section main page. 14

21 Figure 10: Monitoring Updates page. 3 Operations Throughout each day of drought operations, CO-OP staff analyzes flow conditions and evaluates the need for operational changes. These include changes in the release rates from Jennings Randolph and Little Seneca reservoirs, and demand load shifting. Load shifting means the shifting of a water supplier s withdrawals from one intake to another. Fairfax Water and WSSC are able to shift a portion of their withdrawals between their Potomac River intakes and their off-potomac intakes at the Occoquan and the Patuxent reservoirs. Washington Aqueduct may shift withdrawals between its two Potomac River intakes, located at Great Falls and at Little Falls. CO-OP operational decisions are made after evaluation of information from a variety of sources. In 2010, these included predictions from in-house flow forecasting tools (discussed in Section 4.2) and reservoir refill forecasting tools (discussed in Section 4.5), recent National Weather Service (NSW) one- to five-day quantitative precipitation forecasts, and NWS Meteorological Model-based Experimental Forecasting System (MMEFS) one- to seven-day stream flow forecasts. CO-OP faces several challenges during drought operations. Flow in the Potomac River must be sufficient to meet WMA demand and to maintain the recommended minimum flows of 300 MGD at Great Falls and 100 MGD at Little Falls. This requires accurate forecasts of flows one to nine days in the future. This timeframe is required since it has been estimated that releases from the North Branch reservoirs and from Little Seneca Reservoir take approximately nine days and 1.2 days, respectively, to reach Little Falls during low flow periods. Use of storage in upstream and off-river reservoirs must be balanced in order to meet two objectives of the WSCA Drought Operations Manual: make efficient use of system storage, and maintain the probability of not filling any system reservoir to 90 percent by June 1 of the following year to less than 5 percent during a repeat of the historical stream flow record. 15
22 This section includes performance assessments of CO-OP s procedures and tools during fall 2010 drought operations and recommended actions to improve CO-OP s ability to meet these challenges during future droughts Drought Operations Timeline CO-OP conducted drought-related activities for most of the three month period from July 6 to October 1, This entailed actively tracking reservoir storage, Potomac River flow, and water use, and verifying that flow was adequate to meet environmental and water supply needs. Over the fourth of July weekend, reported flow in the Potomac River at Point of Rocks fell below 2,000 cfs, the threshold specified in the Drought Operations Manual for commencement of daily monitoring. Daily monitoring of Potomac basin stream flows and CO-OP utility withdrawals began on Tuesday, July 6. 1 Daily monitoring serves to prepare CO-OP and WMA staff for dealing with the possibility of reservoir releases. On September 7, again after a long holiday weekend of falling flows, Potomac River flows dropped below a second threshold specified in the Drought Operations Manual, triggering commencement of CO-OP drought operations. Drought operations are initiated when adjusted daily flow in the Potomac River at Little Falls, less the amount required for flow-by over Little Falls dam, is less than twice the total daily withdrawals. (CO-OP may also initiate drought operations when projections of flow recession indicate a significant chance that releases from Jennings Randolph and/or Little Seneca reservoirs will be needed within the next ten days.) During drought operations, CO-OP staff review flow and withdrawal data and update flow prediction tools throughout each day in order to forecast needed North Branch reservoir releases nine days in advance. A Jennings Randolph Reservoir water supply release was first initiated on September 10 and continued until September 21. A second water supply release from the same reservoir was made on September 23 and 24. Except for a 24-hour test release from Little Seneca Reservoir, made on September 9 and 10, no other reservoir releases were made. Enhanced drought operations ended on September 28, at which point daily monitoring was re-initiated until its discontinuation on October 1. Daily monitoring was briefly re-initiated one more time between November 1 and November 8. Figure 11 and Figure 12 show Potomac River flow at Point of Rocks and Little Falls during 2010, along with CO-OP drought operations thresholds and flow statistics. A timeline summarizing the major events of the 2010 drought season is given below: July 6: CO-OP daily monitoring of flows and withdrawals initiated 1 The USGS s provisional mean daily flow at Point of Rocks on July 6 was 1,930 cfs (1,250 mgd), though this number has since been revised to 1,760 cfs. 16

23 July 14: daily monitoring discontinued July 22: daily monitoring re-commenced September 7: CO-OP drought operations began September 9: a 24-hour 50 MGD time-of-travel test release from Little Seneca Reservoir was initiated at 8 am September 10: water supply releases from Jennings Randolph and Savage reservoirs commenced September 23: water supply releases from Jennings Randolph and Savage reservoirs concluded September 28: CO-OP drought operations discontinued September 29: daily monitoring re-initiated October 1: daily monitoring discontinued November 1: daily monitoring re-initiated November 8: daily monitoring discontinued Figure 11: Stream flow on the Potomac at Point of Rocks, Maryland. In July 2010, flow fell below 2,000 cubic feet per second (cfs), triggering daily flow monitoring. 17

24 Figure 12: 2010 adjusted daily flow at Little Falls, compared with the trigger for CO-OP drought operations, and flow percentiles for each day of the year computed from historical data. 3.2 System Demands and Constraints Decisions concerning drought operations require consideration of the WMA suppliers recent water demands as well as their water treatment and distribution system capacities and constraints. System demands and constraints in September 2010 are discussed below Water Demand During drought operations, each WMA supplier provides CO-OP with data on recent demand at both the daily and hourly time scale, as well as forecasts of daily demand for the current day and the next day. Since the goal of the WMA cooperative water supply system is to ensure adequate supply to meet unrestricted demand, these data are taken into account, along with historic system demand data for the current month of the year, when evaluating the need for reservoir releases. The Potomac River supplies approximately three quarters of the WMA system demand. Fairfax Water withdraws water from both the Potomac River and from its Occoquan Reservoir. WSSC relies on the Potomac River and its Patuxent reservoirs. Washington Aqueduct s sole source of water is the Potomac, but it has two intakes on the river, one located at Great Falls and one located just above the Little Falls dam. Average daily WMA water demand in September 2010 was slightly higher than the historic average. (The historic average and maximum were both computed from September WMA withdrawal data for the years 1995 through 2008.) In September 2010, the average and maximum daily demand for the WMA system (Potomac River plus Occoquan and Patuxent withdrawals) was 535 MGD and 611 MGD, respectively. This compares to the total daily demand historical average of 513 MGD and historical maximum of 645 MGD for the month of September. 18
25 The average and maximum total daily WMA Potomac River withdrawal values in September 2010 were 437 and 493 MGD, respectively. In comparison, the historical average and maximum total daily Potomac withdrawals for the month of September are 405 MGD and 533 MGD. There is significant variability in WMA withdrawals at the hourly time scale. Hourly withdrawals from the Potomac River by the three WMA suppliers during the month of September 2010 are shown in Figure 13. This graph takes into account the fact that the WMA suppliers Potomac River intakes are all upstream of Little Falls dam and that it takes varying lengths of lag time for their withdrawals to be observed at the Little Falls gage. Under low flow conditions, a withdrawal by Fairfax Water takes approximately 15 hours to be observed at the Little Falls gage, a withdrawal by WSSC takes approximately 10 hours, and a withdrawal by Washington Aqueduct from its Great Falls intake takes approximately 9 hours. It is assumed that a withdrawal from Washington Aqueduct s Little Falls intake is observed instantaneously at the Little Falls gage. The x-axis in Figure 13 represents the time at which the effect of a withdrawal is observed at Little Falls. The graph also shows the sum of the lagged withdrawals, along with the WMA suppliers historic average and maximum September total daily Potomac withdrawal. It is evident from this graph that on an hourly basis, Potomac withdrawals sometimes exceeded the daily historic maximum of 533 MGD Potomac River Withdrawals (lagged), MGD WSSC Fairfax Water Washington Aqueduct Total Historic Sept average Historic Sept maximum Figure 13: Hourly withdrawal rates of the three WMA suppliers as observed at the Little Falls gage, compared with recent average and maximum September daily means ( ). 19
26 The greatest short-term variability in Potomac withdrawal rates was observed in Washington Aqueduct withdrawals. This is partly due to the impact of load shifting between the Great Falls and Little Falls intakes. Figure 14 shows Washington Aqueduct s Little Falls, Great Falls (lagged), and total withdrawals during September When Washington Aqueduct increases its Little Falls withdrawal, the benefit of a corresponding reduction in its Great Falls withdrawal will not be evident at the Little Falls gage for a number of hours due to the lag time. Therefore, there are periods of time when the sum of an increased Little Falls withdrawal and the original Great Falls withdrawal is impacting the stage recorded at the Little Falls gage. Another cause of the variability in total Washington Aqueduct withdrawals is the presence of unexplained spikes in its Great Falls withdrawals. Recommendation: High intra-daily variability in Potomac withdrawal rates increases the uncertainty in flow forecasts, and requires use of higher margins of safety when determining the need for reservoir releases. CO-OP staff will meet with each WMA utility to discuss the feasibility of reducing variability in withdrawal rates during drought operations. Potomac River withdrawals (lagged), MGD Washington Aqueduct Washington Aqueduct - Great Falls Washington Aqueduct - Little Falls Figure 14: Washington Aqueduct s hourly withdrawal rates as observed at the Little Falls gage System Constraints Load shifts are used during drought operations to help optimize the use of available supplies and to help meet the environmental flow recommendations at Great Falls and Little Falls. Fairfax Water and WSSC may be asked to shift a portion of their withdrawals from the Potomac River to their off-potomac reservoirs in order to avoid or postpone release of water from Jennings Randolph or Little Seneca reservoirs. Alternatively, they may be asked to shift a portion of their withdrawals away from their off- Potomac reservoirs in order to preserve storage and take advantage of a temporary rise in flow in the Potomac. Washington Aqueduct is sometime asked to shift a portion of its withdrawal away from its 20
27 Great Falls intake to its intake downstream at Little Falls in order to help meet the 300 MGD minimum recommended flow between Great Falls and Little Falls. There are limits on the amount of water that can be withdrawn from a given intake, and these limits, determined by water treatment plant capacities and water distribution system constraints, must be taken into account when devising load shift requests. Updates on treatment plant capacities, provided to CO-OP staff by the WMA suppliers at the Drought Operations Technical Meeting held on September 8, 2010, are given in Table 2. Fairfax Water has two supply sources, the Potomac River and Occoquan Reservoir, with an interconnected distribution system. Water transfers between certain areas of the system are limited, however. The minimum production from its Corbalis treatment plant on the Potomac River is a function of demand in the Potomac service area as well as pump capacities and the need to furnish part of Loudoun County Sanitation Authority demand directly from Corbalis. Roughly, Fairfax Water s minimum withdrawal from its Potomac intake is the demand in its Potomac service area minus 35 MGD, where 35 MGD is the maximum amount of finished water that can be transferred out of the Occoquan service area. Such a shift requires a notice of approximately 24 hours to configure yard piping at the Pohick pumping station in order to implement this transfer. Fairfax Water s minimum production from its Griffith treatment plant on the Occoquan Reservoir is approximately 45 MGD (25 MGD for Prince William County East plus 20 MGD for the Occoquan service area). More accurately, it is a function of total demand in the Occoquan service area and the maximum possible transfer of finished water from the Corbalis plant (65 MGD). Minimal advance notice is required for this change. In addition to this constraint, there is also a hydraulic limitation requiring a minimum Occoquan withdrawal of 45 MGD. The minimum Occoquan withdrawal is the greater of these two constraints. The Potomac service area demand is currently about 56% of total Fairfax Water demand, and this percentage is expected to increase in future years. In addition to the constraints discussed above, there were some other issues which affected September 2010 operations. WSSC had temporary difficulties in processing solids from its Patuxent water treatment plant. This had an impact on its ability to shift withdrawals to the Patuxent reservoirs. This problem was partially resolved by the rental of a centrifuge unit for the Patuxent waste water treatment plant. On the morning of September 9, WSSC had a temporary power outage at its Potomac water treatment plant. CO-OP staff was warned of the possibility of high fluctuations in WSSC s Potomac withdrawals throughout the day as the plant conducted tests and resumed operations. Fairfax Water was experiencing high levels of organic carbon and dissolved manganese in the Occoquan Reservoir, requiring additional chemicals to be added to the raw water. This problem limited the quantity of water that could easily be shifted from the Potomac intake to the Occoquan supply. Thus, Fairfax Water requested four or more days of notice for initiation of load shifts, which contradicted past 21
28 guidance and assumptions in CO-OP s water supply planning tool, Potomac River Interactive Simulation Model (PRRISM). Finally, it should be noted that Washington Aqueduct prefers that requests for load shifting from its Great Falls to its Little Falls intake be minimized in order to avoid the high costs associated with use of the Little Falls intake. Water withdrawn from Great Falls travels to Washington Aqueduct s treatment plant at Dalecarlia Reservoir via a gravity fed system, but water withdrawn from Little Falls must be pumped up to Dalecarlia. In fall of 2010, pumping costs at Little Falls were $4,000/day to operate the 65 MGD pump, $6,000/day to operate the 94 MGD, and $9,000/day to operate one of the 125 MGD pumps. Recommendations 1. CO-OP staff should meet with water utility staff to further discuss constraints and notification times related to load shifting. 2. CO-OP staff should explore strategies for minimizing requests to Washington Aqueduct to use the Little Falls intake. The Edwards Ferry stage monitor, which is expected to be operational again in 2011, should be helpful in this regard. The gage is expected to improve confidence in short-term Great Falls and Little Falls flow forecasts. 22
29 Table 2: Summer 2010 WMA water treatment plant production capacities (MGD). WSSC Potomac max 200 Potomac min 100 Patuxent max a Patuxent min Fairfax Water Potomac max 225 b Potomac min MGD range, lower in the winter and higher in the summer c Occoquan max 120 d Occoquan min The greater of: 45, or (Occoquan service area demand minus 65) e Aqueduct Dalecarlia max 200 Dalecarlia min 60 McMillan max flat rate constrained by turbidity although short term can increase to 120 max McMillan min 63 TOTALS, maximum Total Potomac 735 with short term increases possible Total System 920 with short term increases possible a The Patuxent plant maximum depends on reservoir levels. Within ten years, when the new plant is completed, it will be rated at 72 MGD with an emergency maximum of 120 MGD. b Capacity of the Corbalis plant will be expanded to 300 MGD at some point in the future. c The minimum current production from the Potomac is a function of demand in the Potomac service area as well as pump capacities and the need to furnish part of Loudoun County Sanitation Authority demand directly from Corbalis (Potomac) plant. Roughly, the minimum Potomac demand is the fraction of the total demand service by Potomac minus 35 MGD. (35 MGD is the maximum that can be transferred from the Occoquan service area, but note that approximately 24 hours notice is required to configure yard piping at Pohick pumping station.) d The Occoquan plant capacity will be increased to 160 MGD at some time in the future. e The minimum current production from Occoquan is approximately 45 MGD (25 to Pr Will East + 20 Main Service area). More accurately, it is a function of total demand in the Occoquan service area, and the maximum possible transfer from Potomac plant. The maximum transfer rate from the Potomac plant to the Occoquan service area is 65 MGD, and minimal advance notice is required to effect this change. In addition to this constraint, there is also a hydraulic limitation requiring a minimum Occoquan withdrawal of 45 MGD. The minimum Occoquan demand is the greater of these two constraints. The fraction of demand that comes from the Potomac service area is currently about 0.56, but will grow with time. 3.3 Reservoir Releases The CO-OP utilities jointly own water supply storage in two facilities that can be used to augment Potomac River flow upstream of the WMA. One of these, Jennings Randolph Reservoir, is located more than 200 miles upstream of Washington, D.C., on the North Branch of the Potomac River between Garrett County, Maryland, and Mineral County, West Virginia. The other, Little Seneca Reservoir, is located in Black Hill Regional Park in Montgomery County, Maryland. In addition, water supply releases from Jennings Randolph are typically supplemented, at a five-to-one ratio, with releases from Savage Reservoir. This reservoir is located on Savage River, a tributary of the North Branch of the Potomac River. Requests for water supply releases from the North Branch reservoirs are made by CO-OP staff to the U.S. Army Corps of Engineers, Baltimore District Office, which operates Jennings Randolph and makes 23
30 release decisions for Savage Reservoir. The Corps prefers that release requests be made by 9 a.m., or earlier, if possible. Requests for water supply releases from Little Seneca Reservoir are made to WSSC, the operator of this reservoir. Because the dam at Little Seneca can be operated remotely and an operator is on call 24 hours a day, releases from Little Seneca can be initiated or revised quickly. This is subject to the constraint that Black Hill Regional Park staff has been notified ahead of time that water supply releases may occur in the coming days. CO-OP s primary goals during drought operations are to meet WMA demand and to meet the minimum environmental flow recommendation of 100 MGD (155 cfs) for the Potomac River at Little Falls dam. This dam is located below all WMA water supply intakes and is the location of a USGS stream flow gage station. There is also a minimum flow recommendation of 300 MGD in the section of the river between Great Falls and Little Falls. Reservoir releases are requested when staff estimates that natural Potomac River flows in the coming days will not be adequate to achieve these goals. CO-OP staff has estimated that releases from the North Branch reservoirs and Little Seneca Reservoir take approximately 9 days and 1.2 days, respectively, to reach Little Falls during low flow periods. These times are approximate since travel times are dependent on both the river flow rate and the release volume. Therefore, in evaluating the need for a release, flow forecasts one to nine days in the future are needed. To determine the need for reservoir releases to augment Potomac River flow, CO-OP staff makes estimates of both supply and demand one to nine days in the future. Future scenarios for total demand are developed by reviewing a variety of information, including recent withdrawal data from the water suppliers, today and tomorrow s forecasts of total demand from the suppliers, average and maximum historical total demands for each supplier (which, during fall 2010 operations, was based on 1995 through 2008 withdrawal data), and current and forecasted local weather conditions. Future Potomac demand, that is, the portion of total demand that will be supplied by the Potomac River, is then computed as the difference between forecasted total demand and the amount of demand that can be supplied by the Occoquan and Patuxent reservoirs. Future withdrawals from these off-potomac reservoirs are estimated based on information concerning current system constraints from the water suppliers and on predictions from CO-OP s reservoir refill tools. The Potomac demand scenarios for one to nine days in the future are then entered, along with the most recent flow data, into CO-OP s Potomac River flow forecasting tools. In the drought of 2010, a release was initiated from Jennings Randolph Reservoir at approximately 8:30 a.m. on September 10, That morning s flow forecast indicated a need for additional water at the Little Falls dam in nine days time under a number of conservative assumptions. These assumptions are discussed below. A decision was made to request an additional 170 MGD (263 cfs) from the North Branch reservoirs. Release requests are made to the Corps in the form of a target for flow at the USGS gage station on the North Branch of the Potomac River at Luke, Maryland. Because flow at Luke had been approximately 173 cfs in recent days, staff requested a Luke flow target of approximately 435 cfs (173 cfs plus 263 cfs). Table 3 is a summary of water supply releases made from the North Branch reservoirs in No water 24
31 supply releases were made from Little Seneca Reservoir, apart from the time-of-travel test release, described in the next section. During water supply releases, the Corps uses a water accounting procedure to determine how water released from Jennings Randolph Reservoir should be allocated between the water quality and water supply storage accounts. This procedure assumes that water quality releases are reduced to the minimum required level during water supply releases. Therefore, the Corps deduction from the water supply account is generally somewhat greater than CO-OP s original estimate of water supply need (see the second and fifth columns of Table 3). However, on two days during which water supply releases were made, September 18 and 19, the Corps released more than the minimum required water quality quantities in order to support the needs of downstream fishermen. Figure 15 shows the effects of the Jennings Randolph Reservoir water supply release on downstream gaged flow at Little Falls. Table 3: Water supply releases from the North Branch reservoirs made in September ICPRB-calculated volumes USACE-calculated volumes and allocations Estimated water supply need a Luke target Luke observed Release from JRR water supply account Release from JRR water quality account Savage Reservoir release Local inflow above Luke (MGD) (cfs) (MGD) (MGD) (MGD) (MGD) (MGD) (MGD) 9/10/ /11/ /12/ /13/ /14/ /15/ /16/ /17/ /18/ /19/ /20/ /23/ Total b a Calculated from an assumed baseline of 173 cfs, the observed flow at Luke in the days prior to the first water supply release. b Total does not include values from 9/21 and 9/22, which were days in which no water supply releases were made. The decision to request a water supply release from Jennings Randolph Reservoir is based on a number of factors, including the nine-day flow forecasts from CO-OP s flow forecasting tools (see Section 4.2), long-term forecasts from CO-OP s reservoir refill tools (see Section 4.5), an estimate of total WMA Potomac demand nine days in the future, and information from the National Weather Service on recent and forecasted precipitation in the basin. 25
, which had provided the most")
32 In the fall of 2010, CO-OP staff used several conservative assumptions in determining the need for a Jennings Randolph release. First, the nine day flow forecast was based primarily on observed flow at Point of Rocks (see Section 4 for a description of the flow forecasting algorithms used in 2010), which had provided the most accurate short-term prediction of flow at Little Falls over the course of the summer during low flow periods, but generally gave the lowest flow prediction of the three forecast algorithms. Second, total WMA Potomac demand nine days in the future was estimated to be the maximum historical daily withdrawal for the month of September, based on 1995 to 2008 data. This assumption was not unreasonable given the observed hourly withdrawals in September of 2010 (see Figure 13), but was more conservative than that used in CO-OP s long-term planning tool, PRRISM. Finally, staff used a margin of safety of 100 MGD for the Jennings release, in an effort to account for potential water losses, as observed in 2002 (Kiang and Hagen, 2003). No such margin of safety is used by PRRISM for Jennings Randolph releases. Figure 15: Measured flow at Little Falls compared to the estimate of flow that would have been observed without the Jennings Randolph Reservoir water supply releases. Two rain events occurred during the September releases. The basin received between 0.10 to 0.75 inches on September 12, and between 0.25 to 1.5 inches on September 17. National Weather Service maps of gridded multi-sensor precipitation observations for these dates (from are shown in Figure 16 and Figure 17. These rain events were judged by CO-OP staff to be too small to have a significant impact on Potomac River flows given 26
33 the extremely dry soil moisture conditions throughout the basin. Therefore, CO-OP continued to rely on recession-based flow forecasts to make decisions concerning releases. However, this judgment proved to be incorrect; flows at Little Falls were in the range of 400 to 700 MGD after September 12. Thus, as is evident from Figure 15, WMA demand would have been met without the September water supply releases. As has been noted before (Kiang and Hagen, 2003), CO-OP is in need of a quantitative flow forecasting tool that takes into account recent rain events. (Section 4.3 of this report contains more details and discussion on the use and on the accuracy of CO-OP s flow forecasting tools during drought monitoring and drought operations.) The conservative assumptions used to determine the need for a Jennings Randolph release in September 2010 reduced the likelihood that flows would drop below desired levels due to forecast uncertainties. Because it was autumn, flows were soon expected to rise due to decreasing evapotranspiration and demands were expected to fall. Additionally, CO-OP s reservoir storage prediction tools (see Section 4.5) showed that reservoir storage levels were not expected to drop to levels that would prevent refill by June 1 of the coming year. These conservative assumptions relied too heavily on Jennings Randolph to provide a margin of safety for uncertainties and too little on Little Seneca Reservoir and were not consistent with those used in CO-OP s long-term planning tool, PRRISM. However, if the drought had continued, CO-OP s overall goal of balancing storage in Jennings Randolph and Little Seneca reservoirs would have shifted use of these two reservoirs towards increased reliance on Little Seneca, to address any growing imbalance between Jennings and Little Seneca storage. Recommendations: CO-OP should better align current drought operations procedures with planning tool assumptions in order to guarantee that operational procedures are appropriate to sustain supply during a drought similar to the drought of record: o Planning tool assumptions should be periodically reviewed by drought operations staff and included in operations guidance material. o Though CO-OP s reservoir refill tools provide valuable information for release decisions for individual reservoirs, potential decision support tools should be identified which could help balance use of reservoirs from the point of view of the entire system, based on historic flow probabilities and operational decisions incorporated into the planning tool. CO-OP should continue to investigate and pursue options for flow forecasting tools that can predict the impact of recent rain events and account for inhomogeneities in the spatial distribution of precipitation in the basin: o CO-OP staff will meet with the Middle Atlantic River Forecast Center (MARFC) to discuss the performance of the newly available stream ensemble forecasts under low flow conditions. o CO-OP staff will continue to communicate with researchers working on the Chesapeake Bay Forecast System, which will couple meteorological forecasts from the Weather Research & Forecasting Model with the SWAT watershed model to provide 20-day flow forecasts for major rivers in the Bay. The Potomac River is the team s second pilot model. 27

 release began at 8:00 a.m. and lasted approximately 24 hours.")
34 Figure 16: Spatial distribution of precipitation observed in the Potomac basin on September 12, Figure 17: Spatial distribution of precipitation observed in the Potomac basin on September 17, Little Seneca Time of Travel Test Release A test release from Little Seneca Reservoir was initiated on September 9, The 50 MGD (77.36 cfs) release began at 8:00 a.m. and lasted approximately 24 hours. Prior to the release, staff at the Black Hill Regional Park was notified, as discussed above in the section on communications. The purpose of the release was to provide an additional data point for estimating the flow-dependent travel time from the 28
35 reservoir to Little Falls dam. The arrival time at Little Falls of many of the past test releases has been obscured by rain and other unexpected events. The release took about five hours to travel to the USGS Seneca Creek gage station at Dawsonville, Maryland, arriving at approximately 13:00 hours. On the following day, flow at Little Falls dropped more rapidly than expected, and Washington Aqueduct was requested to shift a portion of their withdrawal from their Great Falls intake to their Little Falls intake in order to ensure that the Great Falls minimum flow recommendation was met. This operational change made the arrival of the release at Little Falls difficult to detect. However, a comparison of the flow at Little Falls predicted by the hourly forecast tool, with and without the augmentation provided by the release, indicates that the travel time was within the range expected from past data. Figure 18 and Figure 19 show flow downstream of Seneca Reservoir as well as flow at Little Falls. Figure 18 includes observed data from the Seneca release in order to make three projection estimates for possible Little Falls flow. Figure 19 excludes the Seneca release from the observed data in order to make three projections for possible Little Falls flow without the influence of the Seneca release. By comparing these two figures, one can estimate that the Seneca release arrived sometime on September 10 between 10:00 a.m. and 4:00 p.m. This corresponds to a travel time from Seneca Reservoir to Little Falls of 1.1 to 1.3 days. Prior to the release, concerns were raised by the Maryland-National Capital Park and Planning Commission regarding whether or not the release would stay within the existing stream channel. ICPRB staff observed the release approximately one mile downstream of the reservoir at the Lodge at Seneca Creek, a Montgomery County park. An increase in flow was noticeable approximately an hour after the release began. Stream levels were photographed on the mornings of September 9 and 10 (see Appendix C). The observed flow remained well within the channel. 29
36 Figure 18: Flow forecasts during the time of travel test release from Little Seneca Reservoir. This set of flow forecasts includes the Seneca release as observed at Seneca Creek at Dawsonville, Maryland. Figure 19: Flow forecasts during the time of travel test release from Little Seneca Reservoir. This set of flow forecasts exclude the Seneca release as observed at Seneca Creek at Dawsonville, Maryland. 30
37 4 Drought Operations Analysis Tools During drought operations, CO-OP staff makes decisions throughout each day concerning reservoir releases and withdrawal targets for Potomac River and off-potomac reservoir intakes. A suite of computer models and analytical tools are used to assist in these operational decisions. Forecasted Potomac River flow nine days in the future is a key input for determining the need for a release from the North Branch reservoirs. Forecasts of flows nine to 36 hours in the future are used to determine the need for a release from Little Seneca Reservoir and to develop the daily strategy for use of the Occoquan and Patuxent reservoirs and Washington Aqueduct s intake at Little Falls. In 2010, CO-OP drought operations and flow forecasting procedures were updated with the creation of three new spreadsheet tools: Data download tool to automate compilation of daily and real-time stream flow and reservoir level data from USGS websites, based on user-provided start and end dates; Daily operations and flow forecasting tool to provide forecasts of Potomac River flow at Little Falls dam at a daily time scale, based on recent daily stream flow and demand data; and Hourly flow forecasting tool to provide forecasts of Potomac River flow at Little Falls dam at an hourly time scale, based on recent real-time stream flow data and hourly demand data. 4.1 Data Download Tool The new drought operations tools rely on recent daily and hourly data from 15 stream gages in the Potomac River drainage area upstream of Little Falls dam. Additionally, stream gages on the mainstem of the Potomac River and North Branch of the Potomac River provide useful data to verify and adjust model inputs such as time of travel estimates. Lastly, four stream gages and two reservoir elevation gages provide information on the inflow, outflow, and reservoir storage at the North Branch reservoirs. Stream flow and elevation gages currently used in CO-OP flow forecasting tools are shown in Figure 20 and listed in Table 4. A Data Download tool was created using Visual Basic for Excel to automate the compilation of data from these gages. The tool consists of a spreadsheet file with the following pages: Readme: Contains instructions on use of the tool Links for Manual Download: Allows the user to specify the start time and end time for the data download. Different time periods may be specified for the hourly data and daily data. Sites File: Contains a table which generates the links to the data and defines the copy/paste cells. The user may add a gage to this list or switch a gage out with another one. Daily Download: Contains button options to start download of average daily flow data, delete dates with no data, or fill blanks with #N/A. Hourly Download: Contains button options to start download of real-time data and delete dates with no data. Copy-DailyFlowDownload-cfs: Contains button options to generate a table of compiled daily data that can be copied and used elsewhere. Copy-HrlyFlowDownload-cfs: Contains button options to generate a table of compiled hourly data that can be copied and used elsewhere. 31
38 Table 4: USGS stream flow gage stations used by CO-OP in Station No. Station Name Upstream gages used to predict flow at Little Falls SENECA CREEK AT DAWSONVILLE, MD GOOSE CREEK NEAR LEESBURG, VA MONOCACY RIVER AT JUG BRIDGE NEAR FREDERICK, MD POTOMAC RIVER AT POINT OF ROCKS, MD SHENANDOAH RIVER AT MILLVILLE, WV ANTIETAM CREEK NEAR SHARPSBURG, MD OPEQUON CREEK NEAR MARTINSBURG, WV CONOCOCHEAGUE CREEK AT FAIRVIEW, MD POTOMAC RIVER AT HANCOCK, MD CACAPON RIVER NEAR GREAT CACAPON, WV SIDELING HILL CREEK NEAR BELLEGROVE, MD TOWN CREEK NEAR OLDTOWN, MD SOUTH BRANCH POTOMAC RIVER NEAR SPRINGFIELD, WV Drainage Area (mi 2 ) Period of Record (YYYY-MM-DD) Uses to present Point of Rocks, Hancock, and Luke predictions of flow at Little Falls to present Point of Rocks, Hancock, and Luke predictions of flow at Little Falls to present Point of Rocks, Hancock, and Luke predictions of flow at Little Falls to present Point of Rocks predictions of flow at Little Falls to present Hancock and Luke predictions of flow at Little Falls to present Hancock and Luke predictions of flow at Little Falls to present Hancock and Luke predictions of flow at Little Falls to present Hancock and Luke predictions of flow at Little Falls to present Hancock prediction of flow at Little Falls to present Luke prediction of flow at Little Falls to present Luke prediction of flow at Little Falls to ; to ; to ; to present Luke prediction of flow at Little Falls to present Luke prediction of flow at Little Falls 32
39 Station No. Station Name PATTERSON CREEK NEAR HEADSVILLE, WV Drainage Area (mi 2 ) Period of Record (YYYY-MM-DD) Uses to present Luke prediction of flow at Little Falls WILLS CREEK NEAR CUMBERLAND, MD to present Luke prediction of flow at Little Falls NORTH BRANCH POTOMAC RIVER AT LUKE, MD to ; Luke prediction of flow at to present Little Falls Gages used to calibrate model inputs and assess model accuracy POTOMAC RIVER NEAR WASH, DC LITTLE FALLS PUMP STA 11, to present Minimum flow target of 100 MGD to present Calibration point for POTOMAC RIVER AT PAW PAW, WV 3129 adjustment of flowdependent time of travel estimates to present Calibration point for NORTH BRANCH POTOMAC RIVER NEAR CUMBERLAND, MD 877 adjustment of flowdependent time of travel estimates Additional gages NORTH BRANCH POTOMAC RIVER AT BARNUM, WV to ; October 1985 to September 2003 (operated as a partial-record station only), to present Approximate Jennings release SAVAGE RIV BELOW SAVAGE RIV DAM NEAR BLOOMINGTON, MD to present Approximate Savage release NORTH BRANCH POTOMAC RIVER AT KITZMILLER, MD to present Unadjusted Jennings inflow SAVAGE RIVER NEAR BARTON, MD to present Unadjusted Savage inflow BLOOMINGTON LAKE NEAR ELK GARDEN, WV NA to present Reservoir elevation SAVAGE RIVER RESERVOIR NEAR BLOOMINGTON, MD NA to present Reservoir elevation 33
40 Figure 20: Locations of USGS stream flow gage stations used by CO-OP in
41 4.2 Flow Forecasting Tools Forecasts of Potomac River flow can be based on a variety of meteorological and hydrological inputs, including stream flows, precipitation, temperature, and soil moisture conditions. Currently, CO-OP s quantitative flow prediction tools are based solely on current and recently observed stream flows at locations on the Potomac River and its tributaries. In the early years of CO-OP, the procedures for forecasting Potomac River flow upstream of the WMA intakes were based primarily on current flow at Point of Rocks (CO-OP Drought Operations Manual, 1988). More recently, nine-day flow forecasts used in drought operations and in CO-OP s long-term planning tool, the PRRISM model, have been made using two alternative methods (Prelewicz et al., 2004): 1) a hydrographic recession equation based on historical daily flow at Little Falls during periods of drought, and 2) a flow accumulation algorithm, which sums flows at five stream flow gage locations upstream of Little Falls (Potomac River at Hancock, Shenandoah River at Millville, Monocacy River, Conococheague Creek at Fairview, Antietam Creek, and Seneca Creek at Dawsonville) and incorporates stream flow recession forecasts and appropriate lag times and area adjustment factors. In recent years, ICPRB staff has also been evaluating the usefulness of stage data from ICPRB s water level monitor on the Potomac River at Edwards Ferry for making short-term forecasts of flow at Little Falls. These forecasts are based on correlations between Edwards Ferry stage and Little Falls flow (Hagen et al., 2006). The Edwards Ferry monitoring equipment was not operational in 2010, so this last method of flow forecasting will not be discussed in this report. The latest versions of CO-OP s Potomac River flow forecasts were implemented in two new Microsoft Excel spreadsheet files, one based on daily and another based on real-time stream flow data. These are discussed in the following sections Daily Flow Forecast Tool This set of spreadsheets (DroughtOps_Daily.xlsx) is based on average daily flow and withdrawal data. Its data input tables can be easily updated. This tool allows CO-OP staff to quickly generate flow predictions needed for drought operations. Because of its daily time step, this tool is appropriate for predicting flow nine days in the future in order to determine if releases from the North Branch reservoirs are needed. Recent daily flow and withdrawal data are entered into a separate spreadsheet (Data_Daily.xls) and automatically read by the daily forecast spreadsheet. The user can input a future scenario of Potomac River withdrawals and reservoir releases and see a graphical display of flow predictions generated from four different forecasting algorithms. The four algorithms are described below in Section This tool also contains a page which assembles the current day s flow and withdrawal information into the drought reporting Hourly Flow Forecast Tool This set of spreadsheets (DroughtOps_Hourly.xlsx) is based on real-time flow data, interpolated to an hourly time step, and hourly withdrawal data. Because of its hourly time step, it is appropriate for making short-term predictions (nine to 36 hours in the future) that inform operational decisions 35
42 regarding releases from Little Seneca Reservoir, load shifting to or from the Occoquan and Patuxent reservoirs, and load shifting between Washington Aqueduct s Great Falls and Little Falls intakes. Similar to the daily tool, the hourly tool automatically reads hourly flows and withdrawals from a separate spreadsheet (Data_Hourly.xls). The user can input a future withdrawal and reservoir release scenario and see a graphical display of flow predictions at an hourly time step from three different forecasting algorithms, described below. This tool also includes an estimate of flow at Great Falls, which is approximately nine hours upstream of the USGS gage at Little Falls Flow Forecasting Algorithms Both the daily and the hourly flow forecasting tools provide three predictions of Potomac River flow at Little Falls based on data from different sets of upstream gages: 1) Point of Rocks forecast: Based on the sum of recent and forecasted flows for the Potomac River at the Point of Rocks gage plus three tributaries between Point of Rocks and Little Falls. The watersheds contributing to this prediction, indicated in Table 4 and shown in Figure 21, comprise a total of 10,901 mi 2, or 94% of the Potomac basin drainage area upstream of Little Falls. 2) Hancock forecast: Based on the sum of recent and forecasted flows for the Potomac River at the Hancock gage plus seven tributaries between Hancock and Little Falls, including the Shenandoah River. The watersheds contributing to this prediction, indicated in Table 4 and shown in Figure 22, comprise a total of 9,403 mi 2, or 81% of the Potomac basin drainage area upstream of Little Falls. 3) Luke forecast: Based on the sum of recent and forecasted flows for the North Branch Potomac River at the Luke gage plus 13 tributaries between Luke and Little Falls, the two largest being the South Branch Potomac River and the Shenandoah River. The watersheds contributing to this prediction, indicated in Table 4 and shown in Figure 23, comprise a total of 8,595 mi 2, or 74% of the Potomac basin drainage area upstream of Little Falls. In addition, the daily flow prediction tool includes a fourth prediction: 4) Little Falls flow recession forecast: This prediction is obtained from the Little Falls recession curve, an empirical equation for Little Falls recession flows derived from a data set of natural flows at Little Falls during historic periods of drought. Natural flow is defined as the flow that would have been observed at the Little Falls gage without the effects of Washington metropolitan Potomac withdrawals and without the presence of the North Branch reservoirs. According to this equation, natural flow at Little Falls in nine days time, Q Little Falls (t + 9), is related to natural flow at Little Falls on the current day, Q Little Falls (t), by the expression, (Equation 1) where flow is measured in MGD and t represents time in days. The flow predictions described above (Point of Rocks, Hancock, and Luke), are all made using a simple flow accumulation algorithm which sums observed and forecasted flows from upstream watersheds, 36
43 taking into account lag times, that is, the time it takes for flow from an upstream location to arrive at Little Falls, and applying area adjustment factors to compensate for the fact that only a portion of the watershed is represented by the gaged locations. The forecasted flows are obtained from a simple recession model described below. Potomac River flow at Little Falls at time t, Q Little Falls (t), is estimated to be the accumulated flow from all contributing watersheds, that is, where (Equation 2) Q i (t) A i = flow from contributing watershed, i, at time, t = area adjustment factor for watershed, i TLAG i = lag time, that is, time of travel of a flow profile between the gage, i, and the gage at Little Falls dam N = number of contributing watersheds Lag Times The flow accumulation algorithm used for the three forecasts based on upstream gage data incorporates lag times which account for the time it takes for a flow profile observed at an upstream gage to travel downstream and, in this case, arrive at Little Falls. It should be noted that lag times are flow-dependent increasing as flow decreases. Both the daily and the hourly forecast tools allow the user to optimize lag times and area adjustment factors for current conditions. The user can adjust these model inputs and observe the effects visually by looking at graphs of measured versus predicted flows at five Potomac River gage locations: Paw Paw, Cumberland, Hancock, Point of Rocks, and Little Falls. Lag time and area adjustment factor changes can also be evaluated quantitatively by observing changes in mean errors and mean square errors for flow predictions, which are computed in the spreadsheets. Typical lag times and area adjustment factors used in fall 2010 drought operations are given in Table 5. Lag times are implemented in the daily flow forecast tool by means of an interpolation function which is not native to Excel but is available for free download at XlXtrFun Extra Functions for Microsoft Excel. This function provides estimates of lagged flows even for non-integer lag times. Lag times, converted to units of hours, are implemented in the hourly flow forecast tool by means of the Excel offset function. Strictly speaking, the forecast range of the flow accumulation equation is determined by the smallest lag time involved in the forecast. For example, the Point of Rocks forecast provides estimates of flow at Little Falls up to one day in the future, since flows measured at the gages at Goose Creek near Leesburg and Seneca Creek at Dawsonville both arrive at Little Falls approximately one day later. Practically 37
44 speaking, the Point of Rocks forecast provides an estimate of flow at Little Falls up to two days in the future, since the travel time between Point of Rocks and Little Falls is approximately two days (under low flow conditions), and flow at Point of Rocks accounts for the majority of the accumulated flow. Similarly, the Hancock prediction gives a pretty good estimate of flows at Little Falls three to five days in the future, since the lag times during low flow conditions for the largest contributing watersheds, the Shenandoah River above Millville and the Potomac River above Hancock, are approximately 3.4 and 5.2 days, respectively. Finally, the Luke forecast, based on flows from 14 different watersheds with lag times ranging from one day to over eight days, provides the most advance warning of upstream flow conditions Stream Flow Recession Algorithms To extend the time horizon of the forecasts, the flow accumulation equation is coupled with stream flow recession equations, developed for each gage based on past data, which predict future flows under the assumption that little or no rainfall will occur. A simple exponential decay model is commonly used in hydrology to model the gradual falloff in stream flow during dry periods (for review, see Hall, 1968). In this model, flow, Q, at time, t + t, is related to flow at an earlier time, t, by the equation (Equation 3) where k is a parameter, the recession coefficient, which is obtained empirically from an analysis of past data. Table 5 contains the set of recession coefficients used in 2010 drought operations. These were derived from several long recession periods that occurred in summer

45 Figure 21: Gaged drainage areas used in the Point of Rocks prediction of Little Falls flow. 39
46 Figure 22: Gaged drainage areas used in the Hancock prediction of Little Falls flow. 40

47 Figure 23: Gaged drainage areas used in the Luke prediction of Little Falls flow. 41
48 Table 5: Estimates of area adjustment factors, lag times, and recession coefficients used in 2010 drought operations. Low flow Recession Drainage Area time of constants, k Station/Location Area adjustment travel to i (mi 2 (days -1 ) ) factors, A i Little Falls, TLAG (days) SENECA CREEK AT DAWSONVILLE, MD ( ) GOOSE CREEK NEAR LEESBURG, VA ( ) MONOCACY RIVER AT JUG BRIDGE NEAR FREDERICK, MD ( ) POTOMAC RIVER AT POINT OF ROCKS, MD ( ) SHENANDOAH RIVER AT MILLVILLE, WV ( ) ANTIETAM CREEK NEAR SHARPSBURG, MD ( ) OPEQUON CREEK NEAR MARTINSBURG, WV ( ) CONOCOCHEAGUE CREEK AT FAIRVIEW, MD ( ) POTOMAC RIVER AT HANCOCK, MD ( ) CACAPON RIVER NEAR GREAT CACAPON, WV ( ) SIDELING HILL CREEK NEAR BELLEGROVE, MD ( ) TOWN CREEK NEAR OLDTOWN, MD( ) SOUTH BRANCH POTOMAC RIVER NEAR SPRINGFIELD, WV ( ) PATTERSON CREEK NEAR HEADSVILLE, WV ( ) WILLS CREEK NEAR CUMBERLAND, MD ( ) NORTH BRANCH POTOMAC RIVER AT LUKE, MD NA ( ) Little Seneca Reservoir NA NA 1.2 NA Fairfax Water Potomac River intake NA NA NA WSSC Potomac River intake NA NA NA Washington Aqueduct Potomac River intake at Great Falls NA NA NA 42
49 4.3 Performance of Flow Forecasting Tools during Drought of 2010 The new flow forecasting tools were used by CO-OP staff in the summer and fall of 2010 during drought operations. Experience gained during the summer months helped build confidence in predictive abilities of the new tools and the three flow accumulation models. For example, throughout mid- to late-june, the flow forecast tools provided a fairly accurate prediction of when flow at Point of Rocks would drop below 2,000 cfs, the trigger for CO-OP daily drought monitoring. Forecasts made at the end of August (see Figure 24) accurately alerted CO-OP staff to the fact that towards the end of the long Labor Day weekend, flows would drop to the range of 400 to 600 MGD, requiring commencement of CO-OP drought operations. These forecasts were made under the assumption that no significant precipitation would occur throughout the forecast period. This assumption is required for model validity. This assumption proved true in both cases. The flow forecasting tools were used during drought operations to determine the need for releases from Jennings Randolph Reservoir and the need for load shifting. On September 10, the nine-day flow forecasts indicated to CO-OP staff that a release was needed from the North Branch reservoirs to meet the 100 MGD flowby at Little Falls in nine days time (see Figure 25). This determination was based on three conservative assumptions: i) that no precipitation would occur during the next nine days, ii) that future flow at Little Falls would track the Point of Rocks forecast, and iii) that Potomac withdrawals by the WMA suppliers would fall midway between their historic average and historic maximum. Conservative assumptions were used because flow at Little Falls was observed to drop to a level below all of the flow forecasts on September 9 and 10. Throughout the summer, differences in the three flow accumulation model forecasts had been in the range of 100 to 200 MGD during dry periods. Point of Rocks had consistently provided the lowest flow forecast and Luke the highest forecast, with the Hancock forecast falling somewhere in between. Flow at Little Falls had tracked the Hancock forecast during most dry periods of the summer. The fact that Little Falls flow dropped below the Point of Rocks forecast on September 9 and 10 suggested to CO-OP staff that processes resulting in downstream water loss might have been increasing as flows dropped, as had been investigated during CO-OP drought operations in 2002 (Kiang and Hagen, 2003). In subsequent days, the flow forecasting tools continued to indicate a need for flow augmentation to meet the Little Falls flow-by. However, two rain events occurred, which violated assumptions used by the forecasting models: a small event on September 12 and a larger event on September 17. As discussed in Section 3 of this report, these rain events were judged by CO-OP staff to be too small to have a significant impact on Potomac River flows given the extremely dry soil moisture conditions throughout the basin, and CO-OP continued to rely on its recession-based flow forecasts to make decisions concerning releases. However, after the rain events the flow forecasts based on the simple recession algorithms proved to be unreliable, and flows at Little Falls remained in the range of 400 to 700 MGD. 43
50 MGD LF Obs LF Obs from POR LF Obs from Hancock LF Obs from Luke Lfall flowby Figure 24: Forecasts of observed flow at Little Falls for the period from September 1 through 15 as predicted on August 31. This graph was generated using the daily forecast tool MGD LF Obs LF Obs from POR LF Obs from Hancock LF Obs from Luke Lfall flowby Figure 25: Forecasts of observed flow at Little Falls for the period from September 1 through 15 as predicted on September 10. This graph was generated using the daily forecast tool. 4.4 Accuracy of Flow Prediction Tools Forecasts of flow at Little Falls nine days in the future are used to help determine whether or not releases are needed from the North Branch reservoirs. Shorter term forecasts are used for load shifting 44
51 and Little Seneca release decisions. In both cases, an understanding of the uncertainty inherent in the forecasts is important. For example, a margin of safety is added to Little Seneca release targets to ensure that the recommended Little Falls environmental flow minimum of 100 MGD is not missed because of forecast errors. A Little Seneca release margin of safety of 30 MGD is currently used in the CO-OP planning tool, PRRISM. The large forecasting uncertainties observed in 2002 prompted CO-OP staff at that time to use a margin of safety of 100 MGD for Little Seneca releases (Kiang and Hagen, 2003). This practice was continued in Because the tools used for forecasting flows in 2010 drought operations are new, an analysis of their accuracy and expected error is needed to inform future use of the tools. In this section, results from analyses of forecasting errors are presented. The error analyses are based on the daily forecast model and the long-term record of daily flows at the gages listed in Table 4. The analysis of short-term forecasts does not use data from Instead, the long-term, historical data set was used to provide more data points from previous periods of drought. The daily tool was used for this analysis because records of daily flow data are available since at least 1949 for key Potomac basin gages. In contrast, intra-daily data is only available since Since both the hourly and the daily flow forecast models are based on the same flow accumulation and stream flow recession algorithms, results are largely applicable to both models Accuracy of Short-term Forecasts Methods The daily forecast tool was used to analyze errors in predictions of adjusted flow at Little Falls over the historical period of record for the three prediction tools used in 2010 drought operations (Point of Rocks, Hancock, and Luke). As discussed above, the three predictions are based on flows measured at upstream gage locations and on forecasts of future upstream flows from flow recession equations. Because the model data sets were populated with historical flow data, forecasts of future upstream flows were not necessary, so this error analysis does not quantify the additional error that would be introduced by using the recession analyses to predict future flows. The analysis is based on historical flow and demand data from June 1, 1930 through December 31, Because the accuracy of the flow accumulation algorithm depends on lag times, flow-dependent lag times were used for the three largest gaged drainage areas: Potomac River at Point of Rocks, Potomac River at Hancock, and Shenandoah River at Millville. These lag times, given in Table 6, were estimated using an optimization procedure which minimized the mean sum of the square of the forecast errors for a given range of flows at Little Falls for the Point of Rocks lag times and at Point of Rocks for the Hancock and Millville lag times. 45
52 Table 6: Flow-dependent lag times between Little Falls and upstream gages given a range of flows at Little Falls. Little Falls flow ranges (MGD) Lag time from Potomac River at Point of Rocks (days) Lag time from Potomac River at Hancock (days) Lag time from Shenandoah River at Millville (days) 300 to to to to to to Table 7: Flow-dependent lag times between Little Falls and upstream gages given a range of flows at Point of Rocks. Point of Rocks flow ranges (MGD) Lag time from Potomac River at Hancock (days) Lag time from Shenandoah River at Millville (days) 500 to to to to to to Forecast errors were computed for adjusted flow at Little Falls, that is, flow that would have been observed without the impact of WMA withdrawals. For the years 1990 through 2008, adjusted flow was computed by adding total daily WMA Potomac withdrawals to observed daily flow at the Little Falls gage. For years prior to 1990, USGS estimates of Little Falls adjusted flow were used. These data are available at the USGS s National Water Information System (NWIS) website under station number Forecast error was defined by the following: Forecast error = (forecasted flow actual flow) (Equation 4) 46
53 Statistical analyses were conducted on the forecast errors made on days when adjusted Little Falls flow was at a level which might require a release from Little Seneca Reservoir. This level was defined as days when Little Falls adjusted flow was less than or equal to 750 MGD. This threshold is the approximate sum of the maximum historical combined withdrawal from the Potomac River by the WMA suppliers between 1995 and 2008 (608 MGD), the Little Falls minimum flow target (100 MGD), and a margin of safety (30 MGD). Results The mean errors of the three forecasts of Little Falls adjusted flow under low flow conditions are given in Table 8. The probabilities that the given error is not exceeded are also shown. The cumulative distribution function of the three sets of forecast errors is shown in Figure 26. The analyses of the forecast errors show that on average, the Point of Rocks forecast is the most accurate, with a median error of -20 MGD and a mean error of -11 MGD. Thus, over the period of record considered, 1930 through 2008, the Point of Rocks forecast slightly under-predicts flow at Little Falls. In comparison, the forecasts based on Hancock and Luke data almost always over-predict flow at Little Falls. The Hancock forecast has a median error of 117 MGD and a mean error of 135 MGD. The Luke forecast has a median error of 175 MGD and a mean error of 197 MGD. 47
54 Discussion Of particular concern during drought operations is over-prediction of Little Falls flow. This could cause CO-OP staff to underestimate the amount of water needed from upstream reservoirs and result in a drop in flow at Little Falls below the recommended flow-by of 100 MGD. Results in Table 8 indicate that the best available forecast, Point of Rocks, will over-predict flow at Little Falls by 97 MGD five percent of the time, and it will over-predict by 175 MGD two percent of the time. These errors are quite significant given that they are approximately 100% and 200% of the minimum flow-by. Of course during actual drought operations strategies may be found to reduce this error, perhaps by tracking and adjusting for errors observed over the past several days. On the other hand, other uncertainties inherent in drought operations, such as uncertainties in future demand, are not taken into account in the analysis presented here. The cause of the large mean errors of the Hancock and Luke forecasts needs further investigation, specifically an investigation of seasonality and changes over time. It is unlikely that the cause of the errors is gage uncertainty. That said, USGS stream flow gage data is generally considered to only be accurate within ±10%. But over a long period of time it is likely these errors would be random rather than systematic. It is possible that the use of constant, rather than flow-adjusted lag times, in the flow accumulation equation, for all gages other than Point of Rocks, Hancock, and Millville, could introduce significant errors. Also, the area adjustment factors used in the analysis (see Table 5) were not determined using a systematic optimization procedure and may be a source of error. However, use of simple area adjustment factors to predict flow at downstream locations from upstream gage data would tend to cause under-prediction of downstream flows during low flow periods. This is due to the fact that flows in upstream watersheds tend to diminish, and eventually cease, due to dewatering of aquifers feeding headwater streams. Finally, water loss in the ungaged downstream reaches of the river may be occurring (see Kiang and Hagen, 2003, for a discussion of potential causes of water loss). If water loss is the sole explanation of these errors, the mean errors appearing in Table 8 provide an estimate for upstream losses. This indicates that on average during low flow periods, approximately 135 MGD is being lost downstream of the gages used in the Hancock forecast, approximately 197 MGD is lost in reaches of the river downstream of the gages used in the Luke forecast, and no significant water is lost in reaches of the river downstream of the gages used in the Point of Rocks forecast. 48
55 Table 8: Percentile values and mean errors of the Little Falls short-term flow forecasts, on days when adjusted Little Falls flow was in the range of 300 to 750 MGD. Percentiles of forecast error (probabilities of non-exceedance) Point of Rocks forecast error, MGD Hancock forecast error, MGD Luke forecast error, MGD 2% % % % % % % Mean Error % Probability (of non-exceedance) 80% 60% 40% 20% POR forecast Hancock forecast Luke forecast 0% Forecast error (MGD) Figure 26: Cumulative distribution function of adjusted Little Falls flow forecast errors (forecasted minus actual), based on forecasts for low flow days (adjusted Little Falls flow in range of 300 to 750 MGD) from 6/1/1930 through 12/31/
56 4.4.2 Accuracy of Nine-Day Forecasts The accuracies of the nine-day predictions of adjusted flow at Little Falls from three of the flow forecasting algorithms discussed in Section 4.2.3, the Point of Rocks forecast, the Hancock forecast, and the Little Falls recession equation forecast, were evaluated for several historical periods of drought. The Luke forecast was not included because its prediction error was determined in the previous analysis to be significantly higher than the Point of Rocks and Hancock forecasts. Adjusted flow was estimated as described in the previous section. Flow data for Sideling Hill and Town creeks were unavailable for some of the years considered in the analysis. Flows in these streams were assumed to be negligible during periods of drought. The daily forecasting tool was reconfigured to make nine-day flow forecasts for any user-selected date, based on the flow accumulation model and the recession algorithm described above. Nine-day predictions from each of the three forecasting methods were made for a selected range of dates for three historic droughts: the droughts of 1966, 1999, 2002, and also for September For each day of the selected period, a prediction of Little Falls adjusted flow was obtained from each of the flow forecast algorithms, based on flows observed on that day and on previous days, and on flows predicted over the nine-day forecast period by the recession algorithms. These three sets of nine-day forecasts were recorded. Results appear in Figure 27, which shows predictions of Little Falls adjusted flow nine days in the future from the Point of Rocks forecast (LF adj from POR), the Hancock forecast (LF adj from Hancock), and from the Little Falls recession algorithm (LF adj from LF recession), compared with flows actually observed at Little Falls nine days later (LF adj 9 days hence). 50
57 Flow (MGD) /19/1966 7/29/1966 8/8/1966 8/18/1966 8/28/1966 9/7/ Flow (MGD) /24/1999 7/4/1999 7/14/1999 7/24/1999 8/3/1999 8/13/1999 8/23/1999 9/2/ Flow (MGD) /8/2002 7/18/2002 7/28/2002 8/7/2002 8/17/2002 8/27/2002 9/6/2002 9/16/2002 9/26/2002 Flow (MGD) /2/2010 9/7/2010 9/12/2010 9/17/2010 9/22/2010 9/27/ /2/2010 LF adj - 9 days hence LF adj from POR LF adj from Hancock LF adj from LF recession Figure 27: Comparisons of actual adjusted Little Falls flow with nine-day forecasts during the droughts of 1966, 1999, 2002, and 2010, with legend appearing on bottom graph. 51
58 From Figure 27, it is apparent that the nine-day prediction of Little Falls adjusted flow from the Point of Rocks forecast is significantly lower than the Hancock and the Little Falls recession equation forecasts. The Point of Rocks forecast does the best job of predicting flows during the period preceding the lowest flow ever recorded at Point of Rocks, on September 11, The Little Falls recession equation forecast tends to make the highest nine-day flow predictions. The Hancock prediction usually falls somewhere in between the other two forecasts. The value of a quantitative error analysis of the nine-day forecasts is limited, because all three forecasts are based on the assumption that no precipitation occurs in the forecast period. This assumption was violated at times during each of the four droughts considered above and all three forecast methods produce significant errors when flows in the river begin to rise. However, results in Table 9 give an indication of the performance of the three forecasts during drought conditions. The Point of Rocks forecast is the most conservative of the three methods, under-predicting Little Falls flows in most forecast periods and consistently producing the smallest maximum error. The Little Falls recession equation is the least conservative and is the most accurate prediction in terms of mean error. The Hancock forecast is most accurate as measured by mean absolute error. Table 9: Nine-day forecast errors (forecasted minus observed flows) for four periods of drought. 1966: Forecast made on: 7/19/1966 to 9/4/1966 (forecasts made for: 7/28 to 9/13 forecasted flows) 1999: Forecasts made on: 7/10/1999 to 8/23/1999 (forecasts made for: 7/1 to 8/14 forecasted flows) 2002: Forecasts made on: 8/6/2002 to 9/16/2002 (forecasts made for: 8/15 to 9/25 forecasted flows) 2010: Forecasts made on: 9/6/2010 to 9/27/2010 (forecasts made for: 9/15 to 10/6 forecasted flows) Point of Rocks Hancock Little Falls recession Minimum error Maximum error Mean error Standard deviation Mean absolute error Minimum error Maximum error Mean error Standard deviation Mean absolute error Minimum error Maximum error Mean error Standard deviation Mean absolute error Minimum error Maximum error Mean error Standard deviation Mean absolute error
59 4.5 Reservoir Refill Forecast Tools Use of reservoir storage must be balanced in order to meet an objective of the Drought Operations Manual: Maintain the probability of not filling any reservoir used for Washington Metropolitan Area water supply to 90 percent of usable capacity by the following June 1 at less than 5 percent during a repeat of the historical streamflow record (WSCA, 1982). To assist in making decisions to meet this requirement, CO-OP has developed Microsoft Excel spreadsheet tools that forecast the likelihood of refill of each of the system s reservoirs. Results from these tools provide input into decisions concerning load shifting to and from off-river reservoirs and water supply releases from upstream reservoirs. These reservoir refill tools allow the user to input current storage levels and evaluate potential scenarios for future withdrawals and releases. Four storage predictions are obtained by assuming different monthly reservoir inflow scenarios. The first month s storage is determined by the user-defined start value. Inflow scenarios are constructed from ICPRB's estimates of historical daily inflows over the period October 1929 to November Figure 28 and Figure 29 show examples of storage predictions starting with observed values on October 31, 2010 for Jennings Randolph and Savage reservoirs, respectively. The storage and inflow assumptions for the four scenarios predicting the total storage at the end of each future month are: 1. Worst trace inflows: The starting month s storage is determined by the user-defined start value. The predicted storage for a given future month is determined by the user-defined withdrawals and the worst sequence of inflows (sequence with the smallest total volume) between that month and the starting month, over the entire period of record. 2. 5th percentile inflows: The starting month s storage is determined by the user-defined start value. Predictions for each subsequent month are dependent on the previous month s storage, inflow values, and user-defined withdrawals. The inflow value for a given month is the 5 th percentile of total inflows for that month over the 78 year historic period of record. 3. Worst monthly inflows: The starting month s storage is determined by the user-defined start value. Predictions for each subsequent month are dependent on the previous month s storage, inflow values, and user-defined withdrawals. The inflow value for a given month is the worst (lowest) total inflow for that month over the 78 year historic period of record. 4. User-selected year inflows: The starting month s storage is determined by the user-defined start value. Predictions for each subsequent month are dependent on the previous month s storage, inflow values, and user-defined withdrawals. The inflow for a given month is taken from a single year selected by the user. The examples in Figure 28 and Figure 29 use the year


60 Figure 28: Predictions for end of month storage in Jennings Randolph Reservoir given the actual storage level on October 31, Figure 29: Predictions for end of month storage in Savage Reservoir given the actual storage level on October 31,
61 Based on the figures above, a user could see that on October 31, 2010 both Jennings Randolph and Savage reservoirs were expected to refill to their usable storage capacities by June 1, On November 2, 2010, Jennings Randolph Reservoir total storage (which includes both water quality and water supply accounts) had been holding at about 65 percent full and was at an elevation of 1,426 feet. The breakdown by account is shown in Figure 30 and is described as follows: (a) the water supply storage account had been holding at about 91 percent full for several weeks and (b) the water quality storage account continued to steadily decline and was approximately 43 percent full. Savage Reservoir storage was also continuing to decline and was at about 35 percent full at an elevation of 1,421 feet. Customarily the Baltimore District's U.S. Army Corps of Engineers likes to hold both reservoirs somewhere between elevations of 1,430 feet and 1,440 feet for the winter. However, both reservoirs were already below those normal targets. In the first week of December a rainfall runoff event occurred that was sufficient to completely refill the water supply storage space in Jennings Randolph Reservoir. Figure 30: Percent storage in Jennings Randolph Reservoir starting when releases began and continuing until water supply storage returned to 100 percent full. 55
62 5 Conclusion In the fall of 2010, flow in the Potomac River dropped to levels indicating that augmentation from upstream reservoirs was required. Cooperative operations between the three major WMA water suppliers during this period, with coordination and technical support provided by ICPRB CO-OP, ensured that sufficient water was available in the river at all times to meet water supply needs and to maintain the environmental flow recommendations at Great Falls and Little Falls. This report documents events and lessons learned during 2010 drought operations. This report has identified the following issues and recommended actions: High intra-daily variability in Potomac withdrawal rates increases the uncertainty in flow forecasts and requires the use of higher margins of safety when determining the need for reservoir releases. CO-OP staff should meet with each WMA utility to discuss the feasibility of reducing variability in withdrawal rates during drought operations. WMA suppliers have distribution system constraints that limit the amount of water and the speed with which withdrawals can be shifted from one intake to another. o CO-OP should meet with water supplier staff to further discuss constraints and notification times related to load shifting. o CO-OP staff should explore strategies for minimizing requests to Washington Aqueduct to use the Little Falls intake. The Edwards Ferry stage monitor, expected to be operational again in 2011, should be helpful in this regard. It will improve confidence in short-term Great Falls and Little Falls flow forecasts. CO-OP should better align current drought operations procedures with planning tool assumptions in order to guarantee that operational procedures are appropriate to sustain supply during a drought similar to the drought of record. o Planning tool assumptions should be periodically reviewed by drought operations staff and included in operations guidance material. o Though CO-OP s reservoir refill tools provide valuable informational support for release decisions for individual reservoirs, potential decision support tools should be identified which could help balance use of reservoirs from the point of view of the entire system, based on historic flow probabilities and operational decisions incorporated into the planning tool. The Potomac OASIS (Operational Analysis and Simulation of Integrated Systems) model may be a candidate for such a tool. CO-OP currently has no quantitative tools which predict the impact of recent rain events on flows. o CO-OP staff should meet with the Middle Atlantic River Forecast Center to discuss the performance of the newly available stream ensemble forecasts under low flow conditions. o CO-OP staff should continue to communicate with researchers working on the Chesapeake Bay Forecast System, which will couple meteorological forecasts from the Weather Research & Forecasting Model with the SWAT watershed model to provide 20-day flow forecasts for 56
63 major rivers in the Chesapeake Bay watershed. The Potomac River is the team s second pilot model. CO-OP staff will also continue to make improvements to the recent version of its flow forecasting models, described in Section 4. Potential improvements include: Analyses of longer periods of records of stream flow data to obtain better estimates of recession constants (Table 5), use of optimization procedures and analytical models to obtain flow-dependent estimates of travel times, and adjustments of predictions based on recent prediction errors. 6 References Hagen, E.R., M.A. Lorie, C.L. Schultz, Drought Exercise and Operations Guide, Interstate Commission on the Potomac River Basin, ICPRB Report No. 07-3, Rockville, Maryland, May Hall, F.R., Base flow recessions a review, Water Resour. Res., 4(5): ICPRB, Washington Area 1999 Drought Operations, Interstate Commission on the Potomac River Basin, ICPRB Report No. 99-6, Rockville, Maryland, October Kiang, J.E., E.R. Hagen, Drought Operations Report and Lessons Learned - Washington Metropolitan Area, Interstate Commission on the Potomac River Basin, ICPRB Report No , Rockville, Maryland, July LFAA, Potomac River Low Flow Allocation Agreement. signed by: the Secretary of the Army for the United States of America, the Governor for the State of Maryland, the Governor for the Commonwealth of Virginia, the Mayor for the District of Columbia, the Chairman of the Washington Suburban Sanitary Commission, and the Chairman of the Fairfax County Water Authority, January 11, 1978; as modified by Modification No. 1, April 15, 1982, and Modification No. 2, April 19, Prelewicz, G.J., E.R. Hagen, and A. Kame enui, Potomac Reservoir and River Simulation Model - User s Guide and Documentation, Interstate Commission on the Potomac River Basin, ICPRB Report No , Rockville, Maryland, WSCA, Water Supply Coordination Agreement, signed by: The District Engineer Baltimore District COE for the United States of America, the Chairman of the Fairfax County Water Authority, the General Manager of the Washington Suburban Sanitary Commission, The Mayor of the District of Columbia, General Counsel for the Interstate Commission on the Potomac River Basin, July 22, 1982, including: Drought-Related Operations Manual for the Washington Metropolitan Area Water Suppliers, Attachment to the Water Supply Coordination Agreement July 22, 1982, revised June 13,
64 Appendix A Drought Monitoring and Operations Distribution Lists Daily Monitoring Contacts First Name Last Name Company Address Charles Murray FW cmurray@fairfaxwater.org Gregory Prelewicz FW gprelewicz@fairfaxwater.org Jamie Hedges FW jhedges@fairfaxwater.org Joel Thompson FW jthompson@fairfaxwater.org Niffy Saji FW nsaji@fairfaxwater.org Steven Edgemon FW sedgemon@fairfaxwater.org Traci Goldberg FW tgoldberg@fairfaxwater.org Carlton Haywood ICPRB chaywood@icprb.org CO-OP staff ICPRB coop@icprb.org Curtis Dalpra ICPRB cdalpra@icprb.org Jennifer Willoughby ICPRB jwilloughby@icprb.org Joe Hoffman ICPRB jhoffman@icprb.org Christine Howard MWCOG cdhoward@mwcog.org Steve Bieber MWCOG sbieber@mwcog.org Stuart Freudberg MWCOG sfreudberg@mwcog.org Bill Haines USACE James.W.Haines@usace.army.mil Ed Doheny USGS ejdoheny@usgs.gov Jonathan Dillow USGS jjdillow@usgs.gov Ricky Davie WA Ricky.A.Davie@usace.army.mil Thomas Jacobus WA Thomas.P.Jacobus@usace.army.mil Lloyd Stowe WA Lloyd.D.Stowe@wad01.usace.army.mil Louis Levesque WA Louis.A.Levesque@wad01.usace.army.mil Anne Spiesman WA Anne.L.Spiesman@usace.army.mil Woody Peterson WA John.W.Peterson@usace.army.mil Elin Betanzo WSSC ebetanz@wsscwater.com Alesia Gibbs WSSC agibbs@wsscwater.com Jerry Johnson WSSC GMCEO@wsscwater.com Karen Wright WSSC kwright@wsscwater.com John Kasprzak WSSC jkasprz@wsscwater.com James Price WSSC jprice@wsscwater.com Roland Steiner WSSC rsteine@wsscwater.com Todd Supple WSSC tsupple@wsscwater.com Teresa Daniel WSSC tdaniel@wsscwater.com 58
65 Drought Operations Contacts First Name Last Name Company Address Charles Murray FW Gregory Prelewicz FW Jamie Hedges FW Jeane Bailey FW Joe Darby FW Joel Thompson FW Melissa Billman FW Niffy Saji FW Steven Edgemon FW Traci Goldberg FW Carlton Haywood ICPRB CO-OP staff ICPRB Curtis Dalpra ICPRB Jennifer Willoughby ICPRB Joe Hoffman ICPRB Jay Bellingham Mirant Mickey Lynn Mirant Jim McMahon MNCPPC Christine Howard MWCOG Steve Bieber MWCOG Stuart Freudberg MWCOG Bill Haines USACE Barry Flickinger USACE Julia Fritz USACE Ed Doheny USGS Jonathan Dillow USGS Robert Shedlock USGS Steven Baker USGS Ricky Davie WA Patricia Gamby WA Thomas Jacobus WA Lloyd Stowe WA Louis Levesque WA Anne Spiesman WA Woody Peterson WA Elin Betanzo WSSC Alesia Gibbs WSSC James Neustadt WSSC Jerry Johnson WSSC 59
66 John White WSSC Joseph Johnson WSSC Karen Wright WSSC John Kasprzak WSSC Lyn Riggins WSSC James Price WSSC Roland Steiner WSSC Todd Supple WSSC Teresa Daniell WSSC Todd Supple WSSC 60
67 2010 CO-OP Drought Operation Appendix B Letter to Montgomery County Executive and Council 61
68 62
69 Appendix C External Resources There were a number of websites that were either reporting on current conditions during the drought or showed the potential to do so in the future. Websites relied upon by CO-OP staff in 2010 are listed below. Organization Website Link Main Product The Weather The Weather Channel 10-day forecast Channel NOAA National Weather Service Middle Atlantic River Forecast Center marfc 24-hour observed precipitation 48-hour forecasted precipitation State Drought NOAA NOAA NOAA NOAA NOAA NOAA NOAA NOAA National Weather Service Forecast Office Baltimore/Washington National Weather Service Forecast Office Baltimore/Washington National Weather Service Middle Atlantic River Forecast Center National Weather Service Hydrometeorological Prediction Center National Weather Service Middle Atlantic River Forecast Center National Weather Service Middle Atlantic River Forecast Center National Weather Service Middle Atlantic River Forecast Center National Weather Service Advanced Hydrologic Prediction Service climate/index.php?wfo=lwx er/lwx/ marfc/maps/qpf/ qpf/qpf2.shtm marfc/maps/precip.shtml marfc/precipitation/ marfc/maps/xmrg/index_java.html Status Daily Climate Report Preliminary Monthly Climate Data Quick Glimpse at the Weather Gridded QPF Images for the entire MARFC Area Quantitative Precipitation Forecasts Precipitation Departure Maps Daily MARFC Precipitation Reports MPE: Multisensor Precipitation Estimate Precipitation Analysis Download Precipitation Shape File National Maps 63
70 USGS NOAA NOAA MWCOG NOAA NOAA National Integrated Drought Information System MD-DE-DC Water Science Center Drought Watch National Weather Service Hydrometeorological Prediction Center National Weather Service Middle Atlantic River Forecast Center Metropolitan Washington Council of Governments Environment NWS Experimental Shortterm Hydrologic Ensembles (MMEFS) National Weather Service Climate Prediction Center pqpf_6hr/conus_hpc_pqpf_6hr.php marfc/wro_south.shtml environment/water/watersupply/ current_conditions.asp mmefs/index.php products/expert_assessment/ seasonal_drought.html Maps of monthly groundwater conditions and monthly stream flow conditions Experimental HPC 6-hour Probabilistic Precipitation Guidance for Days 1-3 Water Resources Outlook Southern MARFC Area Current Water Supply and Drought Conditions 7-day river forecasts U.S Seasonal Drought Outlook U.S. Drought Portal Drought Monitors Palmer Drought Index Soil Moisture 64


71 Appendix D Photo-documentation of Little Seneca Test Release The release from Little Seneca Reservoir was observed approximately one mile downstream of the dam at a county park, Lodge at Little Seneca. Photographs were taken on the mornings of September 9 and 10. Pictures at multiple vantage points were taken to compare flows before and after the release. The first column of pictures was taken before the release reached the location. The other pictures follow the arrival of the release. For instances when more than one photo was taken on September 9, the time is noted. Thursday, Sep 9, 2010 photo A Thursday, Sep 9, 2010 photo B Friday, September 10, :49 am (upstream) 9:19 am 2 8:49 am (upstream) 9:20 am 65


72 Thursday, Sep 9, 2010 photo A Thursday, Sep 9, 2010 photo B Friday, September 10, :50 am (upstream) 9:10 am 4 8:51 am (upstream) 9:22 am 5 8:53 am (downstream) 66


 7")


73 Thursday, Sep 9, 2010 photo A Thursday, Sep 9, 2010 photo B Friday, September 10, :24 am (downstream) 7 8:54 am first wall (downstream) 8 9:13 am - (downstream) 67


 10")
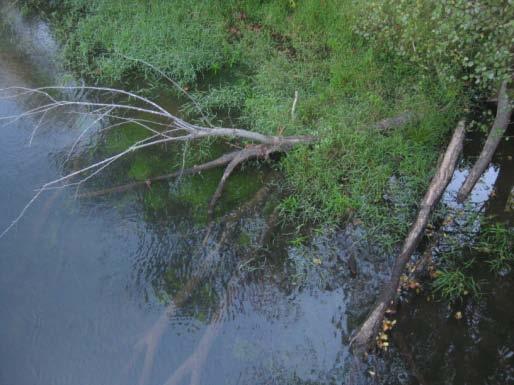
74 Thursday, Sep 9, 2010 photo A Thursday, Sep 9, 2010 photo B Friday, September 10, :14 am upstream side of bridge (upstream) 10 9:14 am upstream side of bridge 68


75 Little Seneca Reservoir - Friday, September 10, 2010 Photos were taken at Black Hill Regional Park around Little Seneca Reservoir following the termination of the release on September 10. These pictures show where the water level was prior to the release and how much it reduced the reservoir level. 69


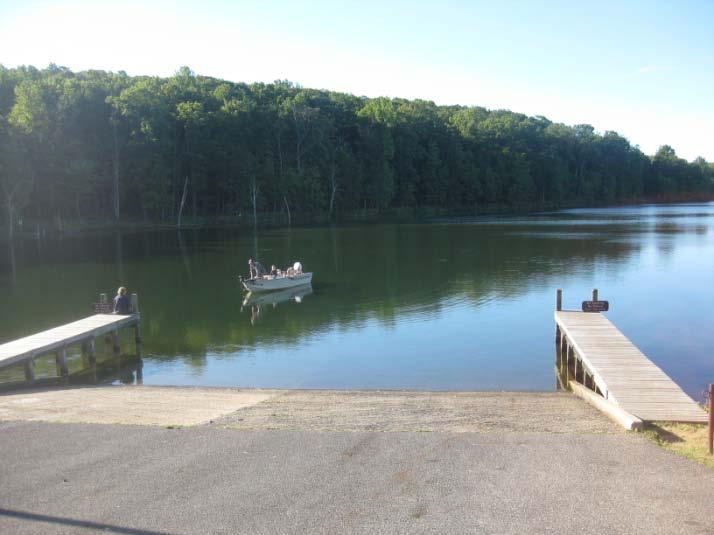
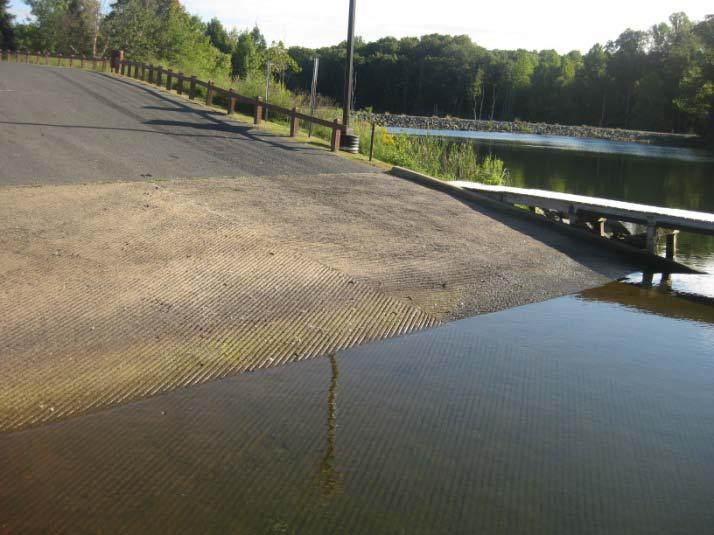
76 70
Water Supply Outlook. Interstate Commission on the Potomac River Basin (ICPRB) 30 W. Gude Drive, Suite 450 Rockville, MD Tel: (301)
 30 W. Gude Drive, Suite 450 Rockville, MD Tel: (301)") Water Supply Outlook June 2, 2016 To subscribe: please email aseck@icprb.org Interstate Commission on the Potomac River Basin (ICPRB) 30 W. Gude Drive, Suite 450 Rockville, MD 20850 Tel: (301) 274-8120
Water Supply Outlook June 2, 2016 To subscribe: please email aseck@icprb.org Interstate Commission on the Potomac River Basin (ICPRB) 30 W. Gude Drive, Suite 450 Rockville, MD 20850 Tel: (301) 274-8120
Brian McGurk, P.G. DEQ Office of Water Supply. Contents. Overview of Virginia s Drought Assessment & Response Plan
 Drought Preparedness in Virginia Or, Whatcha Gonna Do When the Well, Creek, River, or Reservoir (Might) Run Dry? Rappahannock-Rapidan Regional Commission Living Lands Workshop November 18, 2014 Brian McGurk,
Illinois Drought Update, December 1, 2005 DROUGHT RESPONSE TASK FORCE Illinois State Water Survey, Department of Natural Resources
 Illinois Drought Update, December 1, 2005 DROUGHT RESPONSE TASK FORCE Illinois State Water Survey, Department of Natural Resources For more drought information please go to http://www.sws.uiuc.edu/. SUMMARY.
January 25, Summary
 January 25, 2013 Summary Precipitation since the December 17, 2012, Drought Update has been slightly below average in parts of central and northern Illinois and above average in southern Illinois. Soil
Great Lakes Update. Volume 193: 2015 January through June Summary. Vol. 193 Great Lakes Update August 2015
 Great Lakes Update Volume 193: 2015 January through June Summary The U.S. Army Corps of Engineers (USACE) monitors the water levels of each of the Great Lakes. This report provides a summary of the Great
Hydrologic Conditions in the Delaware River Basin
 2017 Hydrologic Conditions in the Delaware River Basin Prepared by Operations Staff June 2018 Hydrologic Highlights Hydrologic Conditions in the Delaware River Basin Annual Report 2017 At the start of
Missouri River Basin Water Management
 Missouri River Basin Water Management US Army Corps of Engineers Missouri River Navigator s Meeting February 12, 2014 Bill Doan, P.E. Missouri River Basin Water Management US Army Corps of Engineers BUILDING
Missouri River Basin Water Management Monthly Update
 Missouri River Basin Water Management Monthly Update Participating Agencies 255 255 255 237 237 237 0 0 0 217 217 217 163 163 163 200 200 200 131 132 122 239 65 53 80 119 27 National Oceanic and Atmospheric
Missouri River Basin Water Management Monthly Update
 Missouri River Basin Water Management Monthly Update Participating Agencies 255 255 255 237 237 237 0 0 0 217 217 217 163 163 163 200 200 200 131 132 122 239 65 53 80 119 27 National Oceanic and Atmospheric
Upper Missouri River Basin December 2017 Calendar Year Runoff Forecast December 5, 2017
 Upper Missouri River Basin December 2017 Calendar Year Runoff Forecast December 5, 2017 Calendar Year Runoff Forecast Explanation and Purpose of Forecast U.S. Army Corps of Engineers, Northwestern Division
Missouri River Basin Water Management Monthly Update
 Missouri River Basin Water Management Monthly Update Participating Agencies 255 255 255 237 237 237 0 0 0 217 217 217 163 163 163 200 200 200 131 132 122 239 65 53 80 119 27 National Oceanic and Atmospheric
Missouri River Basin Water Management Monthly Update
 Missouri River Basin Water Management Monthly Update Participating Agencies 255 255 255 237 237 237 0 0 0 217 217 217 163 163 163 200 200 200 131 132 122 239 65 53 80 119 27 National Oceanic and Atmospheric
Doug Kluck NOAA Kansas City, MO National Center for Environmental Information (NCEI) National Integrated Drought Information System (NIDIS)
 National Integrated Drought Information System (NIDIS)") National Integrated Drought Information System (NIDIS) for the Missouri River Basin Drought Early Warning Information System (DEWS) & Runoff Trends in the Missouri Basin & Latest Flood Outlook Doug Kluck
National Integrated Drought Information System (NIDIS) for the Missouri River Basin Drought Early Warning Information System (DEWS) & Runoff Trends in the Missouri Basin & Latest Flood Outlook Doug Kluck
NIDIS Intermountain West Drought Early Warning System November 21, 2017
 NIDIS Drought and Water Assessment NIDIS Intermountain West Drought Early Warning System November 21, 2017 Precipitation The images above use daily precipitation statistics from NWS COOP, CoCoRaHS, and
NIDIS Intermountain West Drought Early Warning System December 11, 2018
 NIDIS Drought and Water Assessment NIDIS Intermountain West Drought Early Warning System December 11, 2018 Precipitation The images above use daily precipitation statistics from NWS COOP, CoCoRaHS, and
NIDIS Intermountain West Drought Early Warning System October 30, 2018
 10/30/2018 NIDIS Drought and Water Assessment NIDIS Intermountain West Drought Early Warning System October 30, 2018 Precipitation The images above use daily precipitation statistics from NWS COOP, CoCoRaHS,
Great Lakes Update. Volume 194: 2015 Annual Summary
 Great Lakes Update Volume 194: 2015 Annual Summary Background The U.S. Army Corps of Engineers (USACE) tracks and forecasts the water levels of each of the Great Lakes. This report summarizes the hydrologic
United States Multi-Hazard Early Warning System
 United States Multi-Hazard Early Warning System Saving Lives Through Partnership Lynn Maximuk National Weather Service Director, Central Region Kansas City, Missouri America s s Weather Enterprise: Protecting
NIDIS Intermountain West Drought Early Warning System April 18, 2017
 1 of 11 4/18/2017 3:42 PM Precipitation NIDIS Intermountain West Drought Early Warning System April 18, 2017 The images above use daily precipitation statistics from NWS COOP, CoCoRaHS, and CoAgMet stations.
Oregon Water Conditions Report April 17, 2017
 Oregon Water Conditions Report April 17, 2017 Mountain snowpack continues to maintain significant levels for mid-april. By late March, statewide snowpack had declined to 118 percent of normal after starting
NIDIS Intermountain West Regional Drought Early Warning System February 7, 2017
 NIDIS Drought and Water Assessment NIDIS Intermountain West Regional Drought Early Warning System February 7, 2017 Precipitation The images above use daily precipitation statistics from NWS COOP, CoCoRaHS,
HyMet Company. Streamflow and Energy Generation Forecasting Model Columbia River Basin
 HyMet Company Streamflow and Energy Generation Forecasting Model Columbia River Basin HyMet Inc. Courthouse Square 19001 Vashon Hwy SW Suite 201 Vashon Island, WA 98070 Phone: 206-463-1610 Columbia River
Oregon Water Conditions Report May 1, 2017
 Oregon Water Conditions Report May 1, 2017 Mountain snowpack in the higher elevations has continued to increase over the last two weeks. Statewide, most low and mid elevation snow has melted so the basin
NIDIS Intermountain West Drought Early Warning System July 18, 2017
 NIDIS Drought and Water Assessment NIDIS Intermountain West Drought Early Warning System July 18, 2017 Precipitation The images above use daily precipitation statistics from NWS COOP, CoCoRaHS, and CoAgMet
2012 USACE Drought Actions
 2012 USACE Drought Actions for Inland Waterway Users Board 68 Jim Walker Navigation Branch Chief 19 December 2012 US US Army Corps of of Engineers US Drought Monitor 1 2 3 4 6 5 Impacts: 1. The area in
Delaware River Flood Advisory Committee
 Delaware River Flood Advisory Committee A Partnership to Support Flood Mitigation Alan Tamm Pennsylvania Emergency Management Agency Bureau of Recovery and Mitigation atamm@state.pa.us Peter Gabrielsen
Precipitation. Standardized Precipitation Index. NIDIS Intermountain West Drought Early Warning System September 5, 2017
 9/6/2017 NIDIS Drought and Water Assessment NIDIS Intermountain West Drought Early Warning System September 5, 2017 Precipitation The images above use daily precipitation statistics from NWS COOP, CoCoRaHS,
PUBLIC SAFETY POWER SHUTOFF POLICIES AND PROCEDURES
 PACIFIC GAS AND ELECTRIC COMPANY PUBLIC SAFETY POWER SHUTOFF POLICIES AND PROCEDURES SEPTEMBER 2018 1 PACIFIC GAS AND ELECTRIC COMPANY PUBLIC SAFETY POWER SHUTOFF POLICIES AND PROCEDURES SEPTEMBER 2018
Water Supply Conditions and Outlook October 1, 2018
 Water Supply Conditions and Outlook October 1, 2018 Flow Forecasting & Operations Planning Water Security Agency Overview Water supply conditions across Saskatchewan remain near normal, with most reservoirs
NIDIS Intermountain West Drought Early Warning System March 26, 2019
 NIDIS Intermountain West Drought Early Warning System March 26, 2019 The images above use daily precipitation statistics from NWS COOP, CoCoRaHS, and CoAgMet stations. From top to bottom, and left to right:
NIDIS Intermountain West Drought Early Warning System April 16, 2019
 NIDIS Intermountain West Drought Early Warning System April 16, 2019 Precipitation The images above use daily precipitation statistics from NWS COOP, CoCoRaHS, and CoAgMet stations. From top to bottom,
NIDIS Intermountain West Drought Early Warning System November 13, 2018
 NIDIS Intermountain West Drought Early Warning System November 13, 2018 Precipitation The images above use daily precipitation statistics from NWS COOP, CoCoRaHS, and CoAgMet stations. From top to bottom,
NATIONAL HYDROPOWER ASSOCIATION MEETING. December 3, 2008 Birmingham Alabama. Roger McNeil Service Hydrologist NWS Birmingham Alabama
 NATIONAL HYDROPOWER ASSOCIATION MEETING December 3, 2008 Birmingham Alabama Roger McNeil Service Hydrologist NWS Birmingham Alabama There are three commonly described types of Drought: Meteorological drought
NIDIS Intermountain West Drought Early Warning System December 30, 2018
 1/2/2019 NIDIS Drought and Water Assessment NIDIS Intermountain West Drought Early Warning System December 30, 2018 Precipitation The images above use daily precipitation statistics from NWS COOP, CoCoRaHS,
Hydrologic Forecast Centre Manitoba Infrastructure, Winnipeg, Manitoba. FEBRUARY OUTLOOK REPORT FOR MANITOBA February 23, 2018
 Page 1 of 17 Hydrologic Forecast Centre Manitoba Infrastructure, Winnipeg, Manitoba FEBRUARY OUTLOOK REPORT FOR MANITOBA February 23, 2018 Overview The February Outlook Report prepared by the Hydrologic
NIDIS Intermountain West Drought Early Warning System September 4, 2018
 NIDIS Drought and Water Assessment NIDIS Intermountain West Drought Early Warning System September 4, 2018 Precipitation The images above use daily precipitation statistics from NWS COOP, CoCoRaHS, and
Climate Outlook through 2100 South Florida Ecological Services Office Vero Beach, FL September 9, 2014
 Climate Outlook through 2100 South Florida Ecological Services Office Vero Beach, FL September 9, 2014 Short Term Drought Map: Short-term (
NIDIS Intermountain West Drought Early Warning System August 8, 2017
 NIDIS Drought and Water Assessment 8/8/17, 4:43 PM NIDIS Intermountain West Drought Early Warning System August 8, 2017 Precipitation The images above use daily precipitation statistics from NWS COOP,
USING GIS TO MODEL AND ANALYZE HISTORICAL FLOODING OF THE GUADALUPE RIVER NEAR NEW BRAUNFELS, TEXAS
 USING GIS TO MODEL AND ANALYZE HISTORICAL FLOODING OF THE GUADALUPE RIVER NEAR NEW BRAUNFELS, TEXAS ASHLEY EVANS While the state of Texas is well-known for flooding, the Guadalupe River Basin is one of
SEPTEMBER 2013 REVIEW
 Monthly Long Range Weather Commentary Issued: October 21, 2013 Steven A. Root, CCM, President/CEO sroot@weatherbank.com SEPTEMBER 2013 REVIEW Climate Highlights The Month in Review The average temperature
NIDIS Intermountain West Drought Early Warning System May 23, 2017
 NIDIS Drought and Water Assessment NIDIS Intermountain West Drought Early Warning System May 23, 2017 Precipitation The images above use daily precipitation statistics from NWS COOP, CoCoRaHS, and CoAgMet
NIDIS Intermountain West Drought Early Warning System November 14, 2017
 NIDIS Intermountain West Drought Early Warning System November 14, 2017 Precipitation The images above use daily precipitation statistics from NWS COOP, CoCoRaHS, and CoAgMet stations. From top to bottom,
MUNICIPALITY OF ANCHORAGE PUBLIC TRANSPORTATION DEPARTMENT AnchorRIDES TRANSPORTATION SYSTEM
 Purpose: The Public Transportation Department and contracted provider will provide safe transportation for AnchorRIDES customers and employees during severe weather or emergency conditions. AnchorRIDES
The following information is provided for your use in describing climate and water supply conditions in the West as of April 1, 2003.
 Natural Resources Conservation Service National Water and Climate Center 101 SW Main Street, Suite 1600 Portland, OR 97204-3224 Date: April 8, 2003 Subject: April 1, 2003 Western Snowpack Conditions and
SOUTHERN CLIMATE MONITOR
 SOUTHERN CLIMATE MONITOR MARCH 2011 VOLUME 1, ISSUE 3 IN THIS ISSUE: Page 2 to 4 Severe Thunderstorm Climatology in the SCIPP Region Page 4 Drought Update Page 5 Southern U.S. Precipitation Summary for
Hydrologic Conditions in the Delaware River Basin
 Hydrologic Conditions in the Delaware River Basin April : Flooding in Lambertville, New Jersey Aerial photo used with permission of www.elevated-images.com Annual Report Prepared by Operations Staff June
Mobile District River System Status for November 17, 2017
 Mobile District River System Status for November 17, 2017 Weather Update The Quantitative Precipitation Forecast (QPF) in Figure 1 shows forecasted precipitation for the next 7 days. Figure 2 shows the
Folsom Dam Water Control Manual Update Joint Federal Project, Folsom Dam
 Folsom Dam Water Control Manual Update Joint Federal Project, Folsom Dam Public Workshop May 25, 2016 Sacramento Library Galleria 828 I Street, Sacramento, CA US Army Corps of Engineers BUILDING STRONG
Great Lakes Update. Volume 199: 2017 Annual Summary. Background
 Great Lakes Update Volume 199: 2017 Annual Summary Background The U.S. Army Corps of Engineers (USACE) tracks and forecasts the water levels of each of the Great Lakes. This report is primarily focused
Mobile District River System Status for October 25, 2018
 Mobile District River System Status for October 25, 2018 Weather Update The Quantitative Precipitation Forecast (QPF) in Figure 1 shows 0.4 to 2.5 inches of precipitation forecasted for the next 7 days.
Speakers: NWS Buffalo Dan Kelly and Sarah Jamison, NERFC Jeane Wallace. NWS Flood Services for the Black River Basin
 Speakers: NWS Buffalo Dan Kelly and Sarah Jamison, NERFC Jeane Wallace NWS Flood Services for the Black River Basin National Weather Service Who We Are The National Oceanic and Atmospheric Administration
Multiple-Year Droughts In Nebraska
 University of Nebraska - Lincoln DigitalCommons@University of Nebraska - Lincoln Drought Mitigation Center Faculty Publications Drought -- National Drought Mitigation Center 2005 Multiple-Year Droughts
NIDIS Intermountain West Drought Early Warning System May 1, 2018
 NIDIS Intermountain West Drought Early Warning System May 1, 2018 Precipitation The images above use daily precipitation statistics from NWS COOP, CoCoRaHS, and CoAgMet stations. From top to bottom, and
REDWOOD VALLEY SUBAREA
 Independent Science Review Panel Conceptual Model of Watershed Hydrology, Surface Water and Groundwater Interactions and Stream Ecology for the Russian River Watershed Appendices A-1 APPENDIX A A-2 REDWOOD
PRELIMINARY DRAFT FOR DISCUSSION PURPOSES
 Memorandum To: David Thompson From: John Haapala CC: Dan McDonald Bob Montgomery Date: February 24, 2003 File #: 1003551 Re: Lake Wenatchee Historic Water Levels, Operation Model, and Flood Operation This
Overview of a Changing Climate in Rhode Island
 Overview of a Changing Climate in Rhode Island David Vallee, Hydrologist in Charge, National Weather Service Northeast River Forecast Center, NOAA Lenny Giuliano, Air Quality Specialist, Rhode Island Department
NIDIS Intermountain West Drought Early Warning System February 12, 2019
 NIDIS Intermountain West Drought Early Warning System February 12, 2019 Precipitation The images above use daily precipitation statistics from NWS COOP, CoCoRaHS, and CoAgMet stations. From top to bottom,
Great Lakes Update. Volume 188: 2012 Annual Summary
 Great Lakes Update Volume 188: 2012 Annual Summary Background The U.S. Army Corps of Engineers (USACE) tracks the water levels of each of the Great Lakes. This report highlights hydrologic conditions of
National Wildland Significant Fire Potential Outlook
 National Wildland Significant Fire Potential Outlook National Interagency Fire Center Predictive Services Issued: September, 2007 Wildland Fire Outlook September through December 2007 Significant fire
February 10, Mr. Jeff Smith, Chairman Imperial Valley Water Authority E County Road 1000 N Easton, IL Dear Chairman Smith:
 February 1, 1 Mr. Jeff Smith, Chairman Imperial Valley Water Authority 8 E County Road 1 N Easton, IL Dear Chairman Smith: The Illinois State Water Survey (ISWS), under contract to the Imperial Valley
Monthly Long Range Weather Commentary Issued: APRIL 1, 2015 Steven A. Root, CCM, President/CEO
 Monthly Long Range Weather Commentary Issued: APRIL 1, 2015 Steven A. Root, CCM, President/CEO sroot@weatherbank.com FEBRUARY 2015 Climate Highlights The Month in Review The February contiguous U.S. temperature
Climate Change Impact on Air Temperature, Daily Temperature Range, Growing Degree Days, and Spring and Fall Frost Dates In Nebraska
 EXTENSION Know how. Know now. Climate Change Impact on Air Temperature, Daily Temperature Range, Growing Degree Days, and Spring and Fall Frost Dates In Nebraska EC715 Kari E. Skaggs, Research Associate
Upper Missouri River Basin February 2018 Calendar Year Runoff Forecast February 6, 2018
 Upper Missouri River Basin February 2018 Calendar Year Runoff Forecast February 6, 2018 Calendar Year Runoff Forecast Explanation and Purpose of Forecast U.S. Army Corps of Engineers, Northwestern Division
Folsom Dam Water Control Manual Update
 Folsom Dam Water Control Manual Update Public Workshop April 3, 2014 Location: Sterling Hotel Ballroom 1300 H Street, Sacramento US Army Corps of Engineers BUILDING STRONG WELCOME & INTRODUCTIONS 2 BUILDING
Precipitation. Standardized Precipitation Index. NIDIS Intermountain West Regional Drought Early Warning System December 6, 2016
 12/9/2016 NIDIS Drought and Water Assessment NIDIS Intermountain West Regional Drought Early Warning System December 6, 2016 Precipitation The images above use daily precipitation statistics from NWS COOP,
Summary of the 2017 Spring Flood
 Ottawa River Regulation Planning Board Commission de planification de la régularisation de la rivière des Outaouais The main cause of the exceptional 2017 spring flooding can be described easily in just
Great Lakes Update. Great Lakes Winter and Spring Summary January June Vol. 187 Great Lakes Update August 2012
 Great Lakes Update Great Lakes Winter and Spring Summary January June 2012 The US Army Corps of Engineers (USACE) Detroit District monitors hydraulic and hydrologic conditions of the Great Lakes. This
The hydrologic service area (HSA) for this office covers Central Kentucky and South Central Indiana.
 for this office covers Central Kentucky and South Central Indiana.") January 2012 February 13, 2012 An X inside this box indicates that no flooding occurred within this hydrologic service area. January 2012 continued the string of wet months this winter. Rainfall was generally
January 2012 February 13, 2012 An X inside this box indicates that no flooding occurred within this hydrologic service area. January 2012 continued the string of wet months this winter. Rainfall was generally
The Kentucky Mesonet: Entering a New Phase
 The Kentucky Mesonet: Entering a New Phase Stuart A. Foster State Climatologist Kentucky Climate Center Western Kentucky University KCJEA Winter Conference Lexington, Kentucky February 9, 2017 Kentucky
Precipitation. Standardized Precipitation Index. NIDIS Intermountain West Regional Drought Early Warning System January 3, 2017
 1/3/2017 NIDIS Drought and Water Assessment NIDIS Intermountain West Regional Drought Early Warning System January 3, 2017 Precipitation The images above use daily precipitation statistics from NWS COOP,
STRUCTURAL ENGINEERS ASSOCIATION OF OREGON
 STRUCTURAL ENGINEERS ASSOCIATION OF OREGON P.O. Box 3285 PORTLAND, OR 97208 503.753.3075 www.seao.org E-mail: jane@seao.org 2010 OREGON SNOW LOAD MAP UPDATE AND INTERIM GUIDELINES FOR SNOW LOAD DETERMINATION
NIDIS Intermountain West Drought Early Warning System January 15, 2019
 NIDIS Drought and Water Assessment NIDIS Intermountain West Drought Early Warning System January 15, 2019 Precipitation The images above use daily precipitation statistics from NWS COOP, CoCoRaHS, and
NIDIS Intermountain West Drought Early Warning System October 17, 2017
 NIDIS Drought and Water Assessment NIDIS Intermountain West Drought Early Warning System October 17, 2017 Precipitation The images above use daily precipitation statistics from NWS COOP, CoCoRaHS, and
Lower Tuolumne River Accretion (La Grange to Modesto) Estimated daily flows ( ) for the Operations Model Don Pedro Project Relicensing
 Estimated daily flows ( ) for the Operations Model Don Pedro Project Relicensing") Lower Tuolumne River Accretion (La Grange to Modesto) Estimated daily flows (1970-2010) for the Operations Model Don Pedro Project Relicensing 1.0 Objective Using available data, develop a daily time series
Lower Tuolumne River Accretion (La Grange to Modesto) Estimated daily flows (1970-2010) for the Operations Model Don Pedro Project Relicensing 1.0 Objective Using available data, develop a daily time series
Great Lakes Update. Volume 191: 2014 January through June Summary. Vol. 191 Great Lakes Update August 2014
 Great Lakes Update Volume 191: 2014 January through June Summary The U.S. Army Corps of Engineers (USACE) monitors the water levels of each of the Great Lakes. This report provides a summary of the Great
Technical Memorandum. City of Salem, Stormwater Management Design Standards. Project No:
 Technical Memorandum 6500 SW Macadam Avenue, Suite 200 Portland, Oregon, 97239 Tel: 503-244-7005 Fax: 503-244-9095 Prepared for: Project Title: City of Salem, Oregon City of Salem, Stormwater Management
Climate Outlook through 2100 South Florida Ecological Services Office Vero Beach, FL January 13, 2015
 Climate Outlook through 2100 South Florida Ecological Services Office Vero Beach, FL January 13, 2015 Short Term Drought Map: Short-term (
NIDIS Intermountain West Drought Early Warning System January 16, 2018
 NIDIS Drought and Water Assessment NIDIS Intermountain West Drought Early Warning System January 16, 2018 Precipitation The images above use daily precipitation statistics from NWS COOP, CoCoRaHS, and
NIDIS Drought and Water Assessment
 NIDIS Drought and Water Assessment PRECIPITATION The images above use daily precipitation statistics from NWS COOP, CoCoRaHS, and CoAgMet stations. From top to bottom, and left to right: most recent 7-days
NIDIS Intermountain West Drought Early Warning System December 18, 2018
 NIDIS Intermountain West Drought Early Warning System December 18, 2018 Precipitation The images above use daily precipitation statistics from NWS COOP, CoCoRaHS, and CoAgMet stations. From top to bottom,
5.2 IDENTIFICATION OF HAZARDS OF CONCERN
 5.2 IDENTIFICATION OF HAZARDS OF CONCERN 2015 HMP Update Changes The 2010 HMP hazard identification was presented in Section 6. For the 2015 HMP update, the hazard identification is presented in subsection
Souris River Basin Spring Runoff Outlook As of March 1, 2019
 Souris River Basin Spring Runoff Outlook As of March 1, 2019 Prepared by: Flow Forecasting & Operations Planning Water Security Agency Basin Conditions Summer rainfall in 2018 over the Saskatchewan portion
Executive Summary. Water Quantity
 Executive Summary Stakeholders in the Rock-Glade Watershed have taken the initiative to proceed with watershed planning as provided by the State of Washington under the Watershed Management Act (Chapter
NIDIS Intermountain West Drought Early Warning System January 22, 2019
 NIDIS Drought and Water Assessment NIDIS Intermountain West Drought Early Warning System January 22, 2019 Precipitation The images above use daily precipitation statistics from NWS COOP, CoCoRaHS, and
Weather and Climate Summary and Forecast October 2017 Report
 Weather and Climate Summary and Forecast October 2017 Report Gregory V. Jones Linfield College October 4, 2017 Summary: Typical variability in September temperatures with the onset of fall conditions evident
Current Water Conditions in Massachusetts January 11, 2008
 Current Water Conditions in Massachusetts January 11, 2008 December precipitation was above normal December streamflows were below normal and normal December ground-water levels were below normal and normal
January 2011 Calendar Year Runoff Forecast
 January 2011 Calendar Year Runoff Forecast 2010 Runoff Year Calendar Year 2010 was the third highest year of runoff in the Missouri River Basin above Sioux City with 38.8 MAF, behind 1978 and 1997 which
March 1, 2003 Western Snowpack Conditions and Water Supply Forecasts
 Natural Resources Conservation Service National Water and Climate Center 101 SW Main Street, Suite 1600 Portland, OR 97204-3224 Date: March 17, 2003 Subject: March 1, 2003 Western Snowpack Conditions and
2001 ANNUAL REPORT on INTERBASIN TRANSFERS for RTP South and the Towns of Cary, Apex, and Morrisville
 2001 ANNUAL REPORT on INTERBASIN TRANSFERS for RTP South and the Towns of Cary, Apex, and Morrisville Prepared for: Town of Cary Town of Apex Town of Morrisville RTP South/Wake County Submitted to: North
 Red River Flooding June 2015 Caddo and Bossier Parishes Presented by: Flood Technical Committee Where the Rain Falls Matters I-30 versus I-20 I-20 Backwater and Tributary Floods (Localized) 2016 Flood
Hydrologic Forecast Centre Manitoba Infrastructure, Winnipeg, Manitoba. MARCH OUTLOOK REPORT FOR MANITOBA March 23, 2018
 Page 1 of 21 Hydrologic Forecast Centre Manitoba Infrastructure, Winnipeg, Manitoba MARCH OUTLOOK REPORT FOR MANITOBA March 23, 2018 Overview The March Outlook Report prepared by the Hydrologic Forecast
Range Cattle Research and Education Center January CLIMATOLOGICAL REPORT 2012 Range Cattle Research and Education Center.
 1 Range Cattle Research and Education Center January 2013 Research Report RC-2013-1 CLIMATOLOGICAL REPORT 2012 Range Cattle Research and Education Center Brent Sellers Weather conditions strongly influence
DK DM M EMORANDUM D ECEMBER 28, 2018 SUBJECT:
 TO: CC: FROM: SUBJECT: BOARD OF DIRECTORS M EMORANDUM D ECEMBER 28, 2018 ANDY MUELLER, GENERAL MANAGER DAVE DK KANZER, P.E. & DON MEYER, P.E. DK DM COLORADO RIVER BASIN WATER SUPPLY CONDITIONS UPDATE AND
CATEX Hurricane Zachary
 CATEX Hurricane Zachary EXERCISE, EXERCISE,EXERCISE East Coast CATEX Power Restoration Functional Exercise 2013 This document was prepared under a grant from FEMA's Grants Programs Directorate, U.S. Department
NIDIS Intermountain West Drought Early Warning System February 19, 2019
 NIDIS Intermountain West Drought Early Warning System February 19, 2019 Precipitation The images above use daily precipitation statistics from NWS COOP, CoCoRaHS, and CoAgMet stations. From top to bottom,
Drought History. for Southeast Oklahoma. Prepared by the South Central Climate Science Center in Norman, Oklahoma
 Drought History for Southeast Oklahoma Prepared by the South Central Climate Science Center in Norman, Oklahoma May 28, 2013 http://southcentralclimate.org/ info@southcentralclimate.org (This page left
2017 Fall Conditions Report
 2017 Fall Conditions Report Prepared by: Hydrologic Forecast Centre Date: November 15, 2017 Table of Contents TABLE OF FIGURES... ii EXECUTIVE SUMMARY... 1 BACKGROUND... 4 SUMMER AND FALL PRECIPITATION...
NATIONAL WEATHER SERVICE
 January 2016 February 9, 2016 This was a dry month across the HSA despite one large and several smaller snowfalls. Most locations ended up 1-2 inches below normal for the month. The driest locations at
Christopher ISU
 Christopher Anderson @ ISU Excessive spring rain will be more frequent (except this year). Will it be more manageable? Christopher J. Anderson, PhD 89th Annual Soil Management and Land Valuation Conference
NWS FORM E-5 U.S. DEPARTMENT OF COMMERCE I HYDRO SERVICE AREA NOAA, NATIONAL WEATHER SERVICE I Indianapolis, IN MONTHLY REPORT
 NWS FORM E-5 U.S. DEPARTMENT OF COMMERCE I HYDRO SERVICE AREA NOAA, NATIONAL WEATHER SERVICE I Indianapolis, IN. 1-------------------- MONTHLY REPORT OF RIVER AND FLOOD CONDITIONSI REPORT FOR I November