Precipitation. Standardized Precipitation Index. NIDIS Intermountain West Regional Drought Early Warning System December 6, 2016
|
|
|
- Ambrose Houston
- 5 years ago
- Views:
Transcription


1 12/9/2016 NIDIS Drought and Water Assessment NIDIS Intermountain West Regional Drought Early Warning System December 6, 2016 Precipitation The images above use daily precipitation statistics from NWS COOP, CoCoRaHS, and CoAgMet stations. From top to bottom, and left to right: most recent 7 days of accumulated precipitation in inches current month to date accumulated precipitation in inches last month's precipitation as a percent of average water year to date precipitation as a percent of average. Standardized Precipitation Index 1/12

2 Standardized Precipitation Index standardizes precipitation accumulations for a specified time period into percentile rankings. 1.0 to 1.5 is equivalent to a D1 to D to 2.0 is equivalent to a D2 to D and worse is equivalent to a D3 to D4. 30 and 60 day SPIs focus on short term conditions while 6 and 9 month SPIs focus on long term conditions. SPI data provided by High Plains Regional Climate Center. Snotel and Snowpack The top left image shows the Natural Resources Conservation Service's SNOTEL water yearto date precipitation percentile rankings. The top right image shows sub basin averaged snow water equivalent accumulations as a percent of average. The images below show accumulated 2/12
3 snow water equivalent in inches (green) compared to average (blue) and last year (red) for several different sub basins across the UCRB (and were created by the Colorado Basin River Forecast Center). Streamflow 3/12
4 4/12


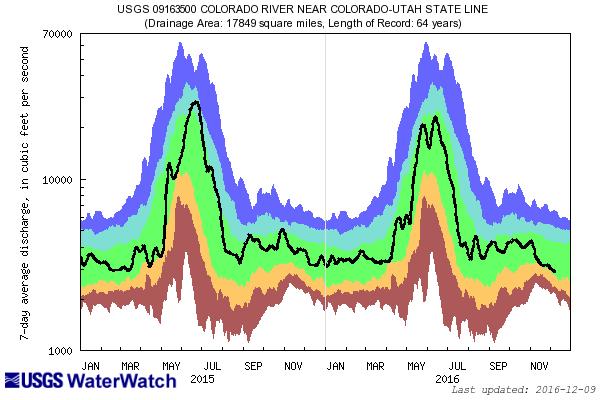
5 The top left image shows 7 day averaged streamflows as a percentile ranking across the UCRB. The top right image shows 7 day averaged discharge over time at three key sites around the UCRB: The Colorado River at the CO UT state line; the Green River at Green River, UT; and the San Juan River near Bluff, UT. All streamflow data provided by United States Geological Survey. Surface Water The top left image shows VIC modeled soil moisture as a percentile ranking. The top right 5/12
.")


6 image shows satellite derived vegetation from the VegDRI product (which updates on Mondays). The graphs shown below are plots of reservoir volumes over the past full year and current year to date (black). The dashed line at the top of each graphic indicates the reservoir's capacity, and the background color coded shading provides context for the range of reservoir levels observed over the past 30 years. The data are obtained from the Bureau of Reclamation. Some of the reservoir percentiles don't line up at the new year due to differences in reservoir levels at the beginning of 1985 and the end of Dead storage has been subtracted. Note: Lake Granby data are obtained from the Colorado Division of Water Resources, and only goes back to the year Evaporative Demand 6/12

 project, which assimilates observations of temperature, wind speed, radiation, and vapor")
7 The above images are available courtesy of NOAA s Evaporative Demand Drought Index (EDDI). Drought classification listed is a function of the depth of reference evapotranspiration accumulated over a given period of record with respect to a climatology of The drought categories displayed are in line with the US Drought Monitor's Percentile Ranking Scheme. Data used to generate these maps come from the North American Land Data Assimilation System Phase 2 (NLDAS 2) project, which assimilates observations of temperature, wind speed, radiation, and vapor pressure deficit. The date indicates the last day of the period of record, and the week number indicates the window size for the period of record. Temperature All images show temperature departures from average over different time periods (last 7 days on top left; month to date on top right; last full month on bottom). Temperature departure maps provided by HPRCC ACIS. 7/12


8 Outlook The top two images show Climate Prediction Center's Precipitation and Temperature outlooks for 8 14 days. The middle image shows the Weather Prediction Center's Quantitative Precipitation Forecast accumulation for seven days. The bottom left image shows the 3 month 8/12


9 precipitation outlook from Climate Prediction Center, and the bottom right image shows the Climate Prediction Center's most recent release of the U.S. Seasonal Drought Outlook. > Summary and Recommendations 9/12

10 Above is the most recent release of the U.S. Drought Monitor map for the UCRB region. Below shows the proposed changes for this week, with supporting text. 10/12

11 Summary: December 6, 2016 The persistent pattern of high pressure and very anomalously warm temperatures across the Upper Colorado River Basin and eastern Colorado finally broke the week before Thanksgiving. Since then, the area has been dominated by cool, northwesterly flow with fits of arctic air drooping down from the north, a pattern quite characteristic of La Nina. The large shift in weather has led to improvements across much of the northern and central portions of the Upper Colorado River Basin. Cool northwesterlies do not do these same favors for the San Juans, Sangre de Cristos, and south and eastern plains of Colorado. Cooler temperatures retard drought development, for these areas, but dry, windy conditions now prevail. The snowpack season was delayed by warm, subtropical high pressure. Since the switch in prevailing flow three weeks into November basin snowpack numbers have begun to recover. Snowpack is forecast to continue to improve 11/12
12 for the next seven days basin wide, and from the Colorado Mainstem north through the next two weeks. Streamflow is mostly in the normal range for the basin at this time of year save for some gages along the San Juan, and in the head waters of the Colorado Mainstem. As expected, many high elevation stream gages have now iced up. Large Reservoirs such as Flaming Gorge, Navajo, Lake Dillion, Lake Granby, and Blue Mesa are showing near normal or above normal storage for this time of year. Lake Powell is perenially below normal. As suggested previously, neither the warm, dry, calm conditions of yore, nor cool, windy, northwesterly flow of late are particularly conducive to drought relief in eastern Colorado. Snowpack for the season to date in the South Platte is 49% of avearge, and snowpack for the season to date in the Arkansas Basin is 56% of average. Soil moisture is well below average for eastern Colorado following a hot, dry fall. Given local vegetation has gone dormant, temperatures have cooled, and long term water supplies from streams and reservoirs are healthy large scale degradations beyond D1 are unlikely in the coming months. This being said, between soil moisture and snowpack now well below average, there is a short term water supply hole that the area will hope to crawl out of before the growing season of 2017 reaches full tilt. Recommendations UCRB: Status quo is recommended. Snowpack for the season to date is still generally between 60 and 80 percent of normal, very much a lingering concern. Since both current conditions and the weather outlook are good news we can hold off on advance of D1 west of the Continental Divide. Eastern Colorado: It is recommended that D1 be expanded in northeast Colorado into northern Washington County, northeast Yuma County, Phillips County, and eastern Logan County. Winter Wheat germination has been very spotty in these areas. Dr. Heim made a play for this degradation a few weeks back, and we resisted; it's time for us to fall in line. It is recommended that D1 be added to northern Prowers County. This area was wetter during the summer, and has thus held onto D0, but the dry fall is now making its mark on local vegetation. It is recommended that a small patch of D2 be added in Kiowa County east of Eads. We have evidence via CoCoRaHS and on the ground impact reports that major precipitation has been lower in this area than surrounding areas since the beginning of June. Grass in this area is in very poor shape. 12/12
NIDIS Intermountain West Drought Early Warning System November 14, 2017
 NIDIS Intermountain West Drought Early Warning System November 14, 2017 Precipitation The images above use daily precipitation statistics from NWS COOP, CoCoRaHS, and CoAgMet stations. From top to bottom,
NIDIS Intermountain West Regional Drought Early Warning System February 7, 2017
 NIDIS Drought and Water Assessment NIDIS Intermountain West Regional Drought Early Warning System February 7, 2017 Precipitation The images above use daily precipitation statistics from NWS COOP, CoCoRaHS,
Precipitation. Standardized Precipitation Index. NIDIS Intermountain West Regional Drought Early Warning System January 3, 2017
 1/3/2017 NIDIS Drought and Water Assessment NIDIS Intermountain West Regional Drought Early Warning System January 3, 2017 Precipitation The images above use daily precipitation statistics from NWS COOP,
NIDIS Intermountain West Drought Early Warning System April 16, 2019
 NIDIS Intermountain West Drought Early Warning System April 16, 2019 Precipitation The images above use daily precipitation statistics from NWS COOP, CoCoRaHS, and CoAgMet stations. From top to bottom,
NIDIS Intermountain West Drought Early Warning System August 8, 2017
 NIDIS Drought and Water Assessment 8/8/17, 4:43 PM NIDIS Intermountain West Drought Early Warning System August 8, 2017 Precipitation The images above use daily precipitation statistics from NWS COOP,
NIDIS Intermountain West Drought Early Warning System December 11, 2018
 NIDIS Drought and Water Assessment NIDIS Intermountain West Drought Early Warning System December 11, 2018 Precipitation The images above use daily precipitation statistics from NWS COOP, CoCoRaHS, and
NIDIS Intermountain West Drought Early Warning System November 21, 2017
 NIDIS Drought and Water Assessment NIDIS Intermountain West Drought Early Warning System November 21, 2017 Precipitation The images above use daily precipitation statistics from NWS COOP, CoCoRaHS, and
NIDIS Intermountain West Drought Early Warning System October 17, 2017
 NIDIS Drought and Water Assessment NIDIS Intermountain West Drought Early Warning System October 17, 2017 Precipitation The images above use daily precipitation statistics from NWS COOP, CoCoRaHS, and
NIDIS Intermountain West Drought Early Warning System September 4, 2018
 NIDIS Drought and Water Assessment NIDIS Intermountain West Drought Early Warning System September 4, 2018 Precipitation The images above use daily precipitation statistics from NWS COOP, CoCoRaHS, and
NIDIS Intermountain West Drought Early Warning System December 18, 2018
 NIDIS Intermountain West Drought Early Warning System December 18, 2018 Precipitation The images above use daily precipitation statistics from NWS COOP, CoCoRaHS, and CoAgMet stations. From top to bottom,
NIDIS Intermountain West Drought Early Warning System January 22, 2019
 NIDIS Drought and Water Assessment NIDIS Intermountain West Drought Early Warning System January 22, 2019 Precipitation The images above use daily precipitation statistics from NWS COOP, CoCoRaHS, and
NIDIS Intermountain West Drought Early Warning System May 23, 2017
 NIDIS Drought and Water Assessment NIDIS Intermountain West Drought Early Warning System May 23, 2017 Precipitation The images above use daily precipitation statistics from NWS COOP, CoCoRaHS, and CoAgMet
NIDIS Intermountain West Drought Early Warning System January 15, 2019
 NIDIS Drought and Water Assessment NIDIS Intermountain West Drought Early Warning System January 15, 2019 Precipitation The images above use daily precipitation statistics from NWS COOP, CoCoRaHS, and
NIDIS Intermountain West Drought Early Warning System February 6, 2018
 NIDIS Intermountain West Drought Early Warning System February 6, 2018 Precipitation The images above use daily precipitation statistics from NWS COOP, CoCoRaHS, and CoAgMet stations. From top to bottom,
NIDIS Intermountain West Drought Early Warning System December 30, 2018
 1/2/2019 NIDIS Drought and Water Assessment NIDIS Intermountain West Drought Early Warning System December 30, 2018 Precipitation The images above use daily precipitation statistics from NWS COOP, CoCoRaHS,
NIDIS Intermountain West Drought Early Warning System April 18, 2017
 1 of 11 4/18/2017 3:42 PM Precipitation NIDIS Intermountain West Drought Early Warning System April 18, 2017 The images above use daily precipitation statistics from NWS COOP, CoCoRaHS, and CoAgMet stations.
NIDIS Intermountain West Drought Early Warning System October 30, 2018
 10/30/2018 NIDIS Drought and Water Assessment NIDIS Intermountain West Drought Early Warning System October 30, 2018 Precipitation The images above use daily precipitation statistics from NWS COOP, CoCoRaHS,
NIDIS Intermountain West Drought Early Warning System November 13, 2018
 NIDIS Intermountain West Drought Early Warning System November 13, 2018 Precipitation The images above use daily precipitation statistics from NWS COOP, CoCoRaHS, and CoAgMet stations. From top to bottom,
NIDIS Intermountain West Drought Early Warning System July 18, 2017
 NIDIS Drought and Water Assessment NIDIS Intermountain West Drought Early Warning System July 18, 2017 Precipitation The images above use daily precipitation statistics from NWS COOP, CoCoRaHS, and CoAgMet
NIDIS Intermountain West Drought Early Warning System February 12, 2019
 NIDIS Intermountain West Drought Early Warning System February 12, 2019 Precipitation The images above use daily precipitation statistics from NWS COOP, CoCoRaHS, and CoAgMet stations. From top to bottom,
NIDIS Intermountain West Drought Early Warning System February 19, 2019
 NIDIS Intermountain West Drought Early Warning System February 19, 2019 Precipitation The images above use daily precipitation statistics from NWS COOP, CoCoRaHS, and CoAgMet stations. From top to bottom,
NIDIS Intermountain West Drought Early Warning System January 16, 2018
 NIDIS Drought and Water Assessment NIDIS Intermountain West Drought Early Warning System January 16, 2018 Precipitation The images above use daily precipitation statistics from NWS COOP, CoCoRaHS, and
NIDIS Intermountain West Drought Early Warning System December 4, 2018
 12/4/2018 NIDIS Drought and Water Assessment NIDIS Intermountain West Drought Early Warning System December 4, 2018 Precipitation The images above use daily precipitation statistics from NWS COOP, CoCoRaHS,
Precipitation. Standardized Precipitation Index. NIDIS Intermountain West Drought Early Warning System September 5, 2017
 9/6/2017 NIDIS Drought and Water Assessment NIDIS Intermountain West Drought Early Warning System September 5, 2017 Precipitation The images above use daily precipitation statistics from NWS COOP, CoCoRaHS,
NIDIS Intermountain West Drought Early Warning System May 1, 2018
 NIDIS Intermountain West Drought Early Warning System May 1, 2018 Precipitation The images above use daily precipitation statistics from NWS COOP, CoCoRaHS, and CoAgMet stations. From top to bottom, and
NIDIS Intermountain West Drought Early Warning System March 26, 2019
 NIDIS Intermountain West Drought Early Warning System March 26, 2019 The images above use daily precipitation statistics from NWS COOP, CoCoRaHS, and CoAgMet stations. From top to bottom, and left to right:
NIDIS Drought and Water Assessment
 NIDIS Drought and Water Assessment PRECIPITATION The images above use daily precipitation statistics from NWS COOP, CoCoRaHS, and CoAgMet stations. From top to bottom, and left to right: most recent 7-days
NIDIS Intermountain West Drought Early Warning System April 24, 2018
 NIDIS Intermountain West Drought Early Warning System April 24, 2018 Precipitation The images above use daily precipitation statistics from NWS COOP, CoCoRaHS, and CoAgMet stations. From top to bottom,
PRECIPITATION. Last Week Precipitation:
 12/3/2014 NIDIS Drought and Water Assessment PRECIPITATION The images above use daily precipitation statistics from NWS COOP, CoCoRaHS, and CoAgMet stations. From top to bottom, and left to right: most
NIDIS Drought and Water Assessment
 7/23/13 1:57 PM PRECIPITATION The images above use daily precipitation statistics from NWS COOP, CoCoRaHS, and CoAgMet stations. From top to bottom, and left to right: most recent 7-days of accumulated
PRECIPITATION. Last Week Precipitation:
 2/24/2015 NIDIS Drought and Water Assessment PRECIPITATION The images above use daily precipitation statistics from NWS COOP, CoCoRaHS, and CoAgMet stations. From top to bottom, and left to right: most
PRECIPITATION. Last Week Precipitation:
 PRECIPITATION The images above use daily precipitation statistics from NWS COOP, CoCoRaHS, and CoAgMet stations. From top to bottom, and left to right: most recent 7-days of accumulated precipitation in
PRECIPITATION. Last Week Precipitation:
 3/30/2016 NIDIS Drought and Water Assessment PRECIPITATION The images above use daily precipitation statistics from NWS COOP, CoCoRaHS, and CoAgMet stations. From top to bottom, and left to right: most
NIDIS Drought and Water Assessment
 NIDIS Drought and Water Assessment PRECIPITATION The images above use daily precipitation statistics from NWS COOP, CoCoRaHS, and CoAgMet stations. From top to bottom, and left to right: most recent 7-days
PRECIPITATION. Last Week Precipitation:
 12/30/2014 NIDIS Drought and Water Assessment PRECIPITATION The images above use daily precipitation statistics from NWS COOP, CoCoRaHS, and CoAgMet stations. From top to bottom, and left to right: most
PRECIPITATION. Last Week Precipitation:
 PRECIPITATION The images above use daily precipitation statistics from NWS COOP, CoCoRaHS, and CoAgMet stations. From top to bottom, and left to right: most recent 7-days of accumulated precipitation in
PRECIPITATION. Last Week Precipitation:
 7/23/2014 NIDIS Drought and Water Assessment PRECIPITATION The images above use daily precipitation statistics from NWS COOP, CoCoRaHS, and CoAgMet stations. From top to bottom, and left to right: most
Webinar and Weekly Summary February 15th, 2011
 Webinar and Weekly Summary February 15th, 2011 -Assessment of current water conditions - Precipitation Forecast - Recommendations for Drought Monitor Upper Colorado Normal Precipitation Upper Colorado
-Assessment of current water conditions. - Precipitation Forecast. - Recommendations for Drought Monitor
 May 31 st, 2011 -Assessment of current water conditions - Precipitation Forecast - Recommendations for Drought Monitor Upper Colorado River Basin Snow Snowpack % of average to date: 347% Percent
PRECIPITATION. Last Week Precipitation:
 12/1/2015 NIDIS Drought and Water Assessment PRECIPITATION The images above use daily precipitation statistics from NWS COOP, CoCoRaHS, and CoAgMet stations. From top to bottom, and left to right: most
-Assessment of current water conditions. - Precipitation Forecast. - Recommendations for Drought Monitor
 2 June 26 th, 2012 -Assessment of current water conditions - Precipitation Forecast - Recommendations for Drought Monitor CMPDSI Value Percentile Rank Characteristic -1.0 - -1.9 21-30 Abnormally
 October 16 th, 2012 2010-12 La Niña event reached its biggest peak since the mid-70s in late 2010, followed by a brief excursion to ENSOneutral conditions during mid-2011; it reached a second peak last
NIDIS Weekly Climate, Water and Drought Assessment Summary. Upper Colorado River Basin June 21, 2011
 NIDIS Weekly Climate, Water and Drought Assessment Summary Upper Colorado River Basin June 21, 2011 PrecipitaEon and Snowpack Fig. 1: June month to date precipitaeon in inches. Fig. 2: 24 hour accumulated
PRECIPITATION. Last Week Precipitation:
 5/19/2015 NIDIS Drought and Water Assessment PRECIPITATION The images above use daily precipitation statistics from NWS COOP, CoCoRaHS, and CoAgMet stations. From top to bottom, and left to right: most
PRECIPITATION. Last Week Precipitation:
 7/14/2015 NIDIS Drought and Water Assessment PRECIPITATION The images above use daily precipitation statistics from NWS COOP, CoCoRaHS, and CoAgMet stations. From top to bottom, and left to right: most
PRECIPITATION. Last Week Precipitation:
 9/9/2015 NIDIS Drought and Water Assessment PRECIPITATION The images above use daily precipitation statistics from NWS COOP, CoCoRaHS, and CoAgMet stations. From top to bottom, and left to right: most
NIDIS Weekly Climate, Water and Drought Assessment Summary. Upper Colorado River Basin June 28, 2011
 NIDIS Weekly Climate, Water and Drought Assessment Summary Upper Colorado River Basin June 28, 2011 PrecipitaFon and Snowpack Fig. 1: June month to date precipitafon in inches. Fig. 2: June 19 25 precipitafon
-Assessment of current water conditions. - Precipitation Forecast. - Recommendations for Drought Monitor
 2 May 1 st, 2012 -Assessment of current water conditions - Precipitation Forecast - Recommendations for Drought Monitor AHPS Water Year Precipitation as Percentage of Normal 7-day average
-Assessment of current water conditions. - Precipitation Forecast. - Recommendations for Drought Monitor
 2 June 12, 2012 -Assessment of current water conditions - Precipitation Forecast - Recommendations for Drought Monitor 7-day average discharge compared to historical discharge for the day
-Assessment of current water conditions. - Precipitation Forecast. - Recommendations for Drought Monitor
 2 May 8 th, 2012 -Assessment of current water conditions - Precipitation Forecast - Recommendations for Drought Monitor AHPS Analysis 5/7/12 7-day average discharge compared to historical
PRECIPITATION. Last Week Precipitation:
 1/28/2015 NIDIS Drought and Water Assessment PRECIPITATION The images above use daily precipitation statistics from NWS COOP, CoCoRaHS, and CoAgMet stations. From top to bottom, and left to right: most
NIDIS Weekly Climate, Water and Drought Assessment Summary. Upper Colorado River Basin
 NIDIS Weekly Climate, Water and Drought Assessment Summary Upper Colorado River Basin August 3, 2010 Precipitation and Snowpack Fig. 1: July precipitation in inches Fig. 2: July precip as percent of average
NIDIS Weekly Climate, Water and Drought Assessment Summary. Upper Colorado River Basin May 31, 2011
 NIDIS Weekly Climate, Water and Drought Assessment Summary Upper Colorado River Basin May 31, 2011 PrecipitaFon and Snowpack Fig. 1: May month to date precipitafon in inches. Fig. 2: May 22 28 precipitafon
PRECIPITATION. Last Week Precipitation:
 6/23/2015 NIDIS Drought and Water Assessment PRECIPITATION The images above use daily precipitation statistics from NWS COOP, CoCoRaHS, and CoAgMet stations. From top to bottom, and left to right: most
NIDIS Weekly Climate, Water and Drought Assessment Summary. Upper Colorado River Basin September 27, 2011
 NIDIS Weekly Climate, Water and Drought Assessment Summary Upper Colorado River Basin September 27, 2011 PrecipitaFon and Snowpack Fig. 1: Water year to date precipitafon as a percent of average. Fig.
NIDIS Weekly Climate, Water and Drought Assessment Summary. Upper Colorado River Basin September 20, 2011
 NIDIS Weekly Climate, Water and Drought Assessment Summary Upper Colorado River Basin September 20, 2011 PrecipitaEon and Snowpack Fig. 1: September month to date precipitaeon in inches. Fig. 2: September
PRECIPITATION. Last Week Precipitation:
 4/28/2015 NIDIS Drought and Water Assessment PRECIPITATION The images above use daily precipitation statistics from NWS COOP, CoCoRaHS, and CoAgMet stations. From top to bottom, and left to right: most
-Assessment of current water conditions. - Precipitation Forecast. - Recommendations for Drought Monitor
 April 27, 2010 -Assessment of current water conditions - Precipitation Forecast - Recommendations for Drought Monitor 7 Day Precipitation 19-25 April 2010 Month-to-Date Precipitation 1-25 April 2010
PRECIPITATION. Last Week Precipitation:
 10/21/2015 NIDIS Drought and Water Assessment PRECIPITATION The images above use daily precipitation statistics from NWS COOP, CoCoRaHS, and CoAgMet stations. From top to bottom, and left to right: most
NIDIS Weekly Climate, Water and Drought Assessment Summary. Upper Colorado River Basin January 3, 2012
 NIDIS Weekly Climate, Water and Drought Assessment Summary Upper Colorado River Basin January 3, 2012 PrecipitaFon and Snowpack Fig. 1: December precipitafon as a percent of average. Fig. 2: December 25
NIDIS Weekly Climate, Water and Drought Assessment Summary. Upper Colorado River Basin June 26, 2012
 NIDIS Weekly Climate, Water and Drought Assessment Summary Upper Colorado River Basin June 26, 2012 Fig. 1: June 17 23 precipitafon in inches. Fig. 2: SNOTEL WYTD precipitafon percenfles (50% is median,
NIDIS Weekly Climate, Water and Drought Assessment Summary. Upper Colorado River Basin November 22, 2011
 NIDIS Weekly Climate, Water and Drought Assessment Summary Upper Colorado River Basin November 22, 2011 PrecipitaEon and Snowpack Fig. 1: November month to date precipitaeon in inches. Fig. 2: November
NIDIS Weekly Climate, Water and Drought Assessment Summary. Upper Colorado River Basin February 12, 2013
 NIDIS Weekly Climate, Water and Drought Assessment Summary Upper Colorado River Basin February 12, 2013 Fig. 1: January precipitagon as a percent of average. Fig. 2: February 1 9 precipitagon in inches.
NIDIS Weekly Climate, Water and Drought Assessment Summary. Upper Colorado River Basin May 29, 2012
 NIDIS Weekly Climate, Water and Drought Assessment Summary Upper Colorado River Basin May 29, 2012 PrecipitaFon and Snowpack Fig. 1: May 1 19 precipitafon in inches. Fig. 2: May 20 27 precipitafon in inches.
NIDIS Weekly Climate, Water and Drought Assessment Summary. Upper Colorado River Basin July 31, 2012
 NIDIS Weekly Climate, Water and Drought Assessment Summary Upper Colorado River Basin July 31, 2012 Fig. 1: July month-to-date precipitation in inches. Fig. 2: SNOTEL WYTD precipitation percentiles (50%
NIDIS Weekly Climate, Water and Drought Assessment Summary Upper Colorado River Basin Pilot Project 13 July 2010
 NIDIS Weekly Climate, Water and Drought Assessment Summary Upper Colorado River Basin Pilot Project 13 July 2010 Precipitation and Snowpack Over the past week, precipitation in the Upper Colorado River
PRECIPITATION. Last Week Precipitation:
 8/11/2015 NIDIS Drought and Water Assessment PRECIPITATION The images above use daily precipitation statistics from NWS COOP, CoCoRaHS, and CoAgMet stations. From top to bottom, and left to right: most
PRECIPITATION. Last Week Precipitation:
 9/29/2015 NIDIS Drought and Water Assessment PRECIPITATION The images above use daily precipitation statistics from NWS COOP, CoCoRaHS, and CoAgMet stations. From top to bottom, and left to right: most
-Assessment of current water conditions. - Precipitation Forecast. - Recommendations for Drought Monitor
 June 1, 2010 -Assessment of current water conditions - Precipitation Forecast - Recommendations for Drought Monitor Snotel WYTD Precipitation as Percentage of Average Upper Colorado Headwaters 88% of
NIDIS Weekly Climate, Water and Drought Assessment Summary. Upper Colorado River Basin February 28, 2012
 NIDIS Weekly Climate, Water and Drought Assessment Summary Upper Colorado River Basin February 28, 2012 PrecipitaGon and Snowpack Fig. 1: February month- to- date precipitagon in inches. Fig. 2: February
Oregon Water Conditions Report April 17, 2017
 Oregon Water Conditions Report April 17, 2017 Mountain snowpack continues to maintain significant levels for mid-april. By late March, statewide snowpack had declined to 118 percent of normal after starting
Oregon Water Conditions Report May 1, 2017
 Oregon Water Conditions Report May 1, 2017 Mountain snowpack in the higher elevations has continued to increase over the last two weeks. Statewide, most low and mid elevation snow has melted so the basin
DK DM M EMORANDUM D ECEMBER 28, 2018 SUBJECT:
 TO: CC: FROM: SUBJECT: BOARD OF DIRECTORS M EMORANDUM D ECEMBER 28, 2018 ANDY MUELLER, GENERAL MANAGER DAVE DK KANZER, P.E. & DON MEYER, P.E. DK DM COLORADO RIVER BASIN WATER SUPPLY CONDITIONS UPDATE AND
NIDIS Weekly Climate, Water and Drought Assessment Summary. Upper Colorado River Basin July 26, 2011
 NIDIS Weekly Climate, Water and Drought Assessment Summary Upper Colorado River Basin July 26, 2011 PrecipitaFon and Snowpack Fig. 1: July month to date precipitafon in inches. Fig. 2: July 17 23 precipitafon
NIDIS Weekly Climate, Water and Drought Assessment Summary. Upper Colorado River Basin July 12, 2011
 NIDIS Weekly Climate, Water and Drought Assessment Summary Upper Colorado River Basin July 12, 2011 PrecipitaEon and Snowpack Fig. 1: October June precipitaeon as a percent of average. Fig. 2: July month
-Assessment of current water conditions. - Precipitation Forecast. - Recommendations for Drought Monitor
 April 20 th, 2010 -Assessment of current water conditions - Precipitation Forecast - Recommendations for Drought Monitor 7 Day Precipitation 12-18 April 2010 Month-to-Date Precipitation 1-28 March 2010
Upper Missouri River Basin December 2017 Calendar Year Runoff Forecast December 5, 2017
 Upper Missouri River Basin December 2017 Calendar Year Runoff Forecast December 5, 2017 Calendar Year Runoff Forecast Explanation and Purpose of Forecast U.S. Army Corps of Engineers, Northwestern Division
A Review of the 2007 Water Year in Colorado
 A Review of the 2007 Water Year in Colorado Nolan Doesken Colorado Climate Center, CSU Mike Gillespie Snow Survey Division, USDA, NRCS Presented at the 28 th Annual AGU Hydrology Days, March 26, 2008,
Illinois Drought Update, December 1, 2005 DROUGHT RESPONSE TASK FORCE Illinois State Water Survey, Department of Natural Resources
 Illinois Drought Update, December 1, 2005 DROUGHT RESPONSE TASK FORCE Illinois State Water Survey, Department of Natural Resources For more drought information please go to http://www.sws.uiuc.edu/. SUMMARY.
Wind River Indian Reservation and Surrounding Area Climate and Drought Summary
 Northern Arapaho Tribe Wind River Indian Reservation and Surrounding Area Climate and Drought Summary Summer Events & Fall Outlook 2015 Summer Was Near, Precipitation Was Highly Variable Across The Region
Wind River Indian Reservation and Surrounding Area Climate and Drought Summary
 Northern Arapaho Tribe Wind River Indian Reservation and Surrounding Area Climate and Drought Summary Winter Events & Spring Outlook 2015-2016 Winter Was Warm And Dry Winter was warm and dry for the Wind
Weather and Climate Summary and Forecast Summer 2016
 Weather and Climate Summary and Forecast Summer 2016 Gregory V. Jones Southern Oregon University June 6, 2016 May 2016 continued the warm trend for portions of the west, while providing some relief for
January 2011 Calendar Year Runoff Forecast
 January 2011 Calendar Year Runoff Forecast 2010 Runoff Year Calendar Year 2010 was the third highest year of runoff in the Missouri River Basin above Sioux City with 38.8 MAF, behind 1978 and 1997 which
Colorado s 2003 Moisture Outlook
 Colorado s 2003 Moisture Outlook Nolan Doesken and Roger Pielke, Sr. Colorado Climate Center Prepared by Tara Green and Odie Bliss http://climate.atmos.colostate.edu How we got into this drought! Fort
2003 Moisture Outlook
 2003 Moisture Outlook Nolan Doesken and Roger Pielke, Sr. Colorado Climate Center Prepared by Tara Green and Odie Bliss http://climate.atmos.colostate.edu Through 1999 Through 1999 Fort Collins Total Water
Monthly Long Range Weather Commentary Issued: February 15, 2015 Steven A. Root, CCM, President/CEO
 Monthly Long Range Weather Commentary Issued: February 15, 2015 Steven A. Root, CCM, President/CEO sroot@weatherbank.com JANUARY 2015 Climate Highlights The Month in Review During January, the average
Weather and Climate Summary and Forecast March 2018 Report
 Weather and Climate Summary and Forecast March 2018 Report Gregory V. Jones Linfield College March 7, 2018 Summary: The ridge pattern that brought drier and warmer conditions from December through most
Wind River Indian Reservation and Surrounding Area Climate and Drought Summary
 Northern Arapaho Tribe Wind River Indian Reservation and Surrounding Area Climate and Drought Summary Spring Events & Summer Outlook 2015 Spring Was Warm And Very Wet Across The Region The spring season
January 25, Summary
 January 25, 2013 Summary Precipitation since the December 17, 2012, Drought Update has been slightly below average in parts of central and northern Illinois and above average in southern Illinois. Soil
Drought Update May 11, 2018
 Drought Update May 11, 2018 Current status After a record cold April, May has started with much warmer than normal temperatures. The statewide average temperature for the week ending on May 8th was 65.7
Weather and Climate Summary and Forecast January 2019 Report
 Weather and Climate Summary and Forecast January 2019 Report Gregory V. Jones Linfield College January 4, 2019 Summary: December was mild and dry over much of the west, while the east was much warmer than
National Wildland Significant Fire Potential Outlook
 National Wildland Significant Fire Potential Outlook National Interagency Fire Center Predictive Services Issued: April 1, 2008 Next Issue: May 1, 2008 Wildland Fire Outlook April 2008 through July 2008
Wind River Indian Reservation and Surrounding Area Climate and Drought Summary
 Northern Arapaho Tribe Wind River Indian Reservation and Surrounding Area Climate and Drought Summary Spring Events & Summer Outlook 2016 Wet Spring Leads To Flooding Spring was very wet across most of
The Pennsylvania Observer
 The Pennsylvania Observer October 1, 2015 September 2015 - Pennsylvania Weather Recap By: Quinn Lease The month of September will be remembered for its above normal temperatures and dry conditions that
Midwest/Great Plains Climate-Drought Outlook September 20, 2018
 Midwest/Great Plains Climate-Drought Outlook September 20, 2018 Brian Fuchs National Drought Mitigation Center University of Nebraska-Lincoln School of Natural Resources September 20, 2018 General Information
Central Region Climate Outlook May 15, 2014
 Central Region Climate Outlook May 15, 2014 Dr. Jim Angel State Climatologist IL State Water Survey University of Illinois jimangel@illinois.edu 217-333-0729 Chicago-area flooding General Information Providing
Weather and Climate Summary and Forecast November 2017 Report
 Weather and Climate Summary and Forecast November 2017 Report Gregory V. Jones Linfield College November 7, 2017 Summary: October was relatively cool and wet north, while warm and very dry south. Dry conditions
Highlights of the 2006 Water Year in Colorado
 Highlights of the 2006 Water Year in Colorado Nolan Doesken, State Climatologist Atmospheric Science Department Colorado State University http://ccc.atmos.colostate.edu Presented to 61 st Annual Meeting
Flood Risk Assessment
 Flood Risk Assessment February 14, 2008 Larry Schick Army Corps of Engineers Seattle District Meteorologist General Assessment As promised, La Nina caused an active winter with above to much above normal
Funding provided by NOAA Sectoral Applications Research Project MONITORING DROUGHT. Basic Climatology Colorado Climate Center
 Funding provided by NOAA Sectoral Applications Research Project MONITORING DROUGHT Basic Climatology Colorado Climate Center DEFINING DROUGHT First off, just what is drought? Define a tornado Define a