CLIMATE CHANGE IMPACTS ON DISTRIBUTION AND MELT OF SNOW IN HIGH ALTITUDES AND LATITUDES
|
|
|
- Nicholas Williamson
- 6 years ago
- Views:
Transcription
1 CLIMATE CHANGE IMPACTS ON DISTRIBUTION AND MELT OF SNOW IN HIGH ALTITUDES AND LATITUDES JOSEF KRECEK Department of Hydrology Czech Technical University in Prague

2 CRYOSPHERE Ice-caps Sea ice River and lake ice Land ice Glaciers Permafrost Snow cover During the winter of Northern Hemisphere, over 50 % of the world s land surface and 30 % of its ocean covered by snow and ice.
3 FEEDING RIVER SYSTEMS Pardé (Shaw, 1988): Hydrological regimes: - Temperature-dependent Arve R. Columbia R. Volga R. - Precipitation-dependent
4 HIGH SOCIO-ECONOMIC RISK OF CHANGES More than one-sixth of the world s population live in glacieror snowmelt-fed river basins. That population might be affected particularly by: A seasonal shift in the streamflow timing. An increase in the ratio of winter to annual flows. Increased flood frequency. Reduction in low flows caused by decreased glacier extent or snow water storage.

5 UNEP (2007): GLOBAL OUTLOOK FOR ICE AND SNOW 40 % of the world s population could be affected by loss of snow and glaciers in Asia. Increased melting ice and snow tends to rising hazard of avalanches, floods, unstable glacial lakes. Thawning permafrost expansion of water bodies, thermokast lakes with releasing methan. 4 th June 2007 World Envi. Day Decreasing snow and ice cover more sun s heat absorbed by the land and oceans.
. (Mean temperature of the warmest month is not above 10 o C).")
6 KÖPPEN CLIMATE CLASSIFICATION Polar climates (E): Tundra (ET) and Ice-cap climate (EF). (Mean temperature of the warmest month is not above 10 o C).
7 DISTRIBUTION OF LONG-TERM ANNUAL PRECIPITATION Moist mid-latitude climates with cold winter (D), Moist midlatidute climates with mild winter (C). Generally, all the land above 40 o N is exposed to a significant seasonal snow cover.
 Falling, contact with warmer and melting Larger")
8 SNOW GENESIS IN THE ATMOSPERE Water condenses into a droplet. Growing droplets. Cold air freezes water into an ice crystal (unique shape) Falling, contact with warmer and melting Larger flakes. Ground deposition.

9 SNOW ACCUMULATION ON THE GROUND Meteorological factors: Precipitable water, air temperature, wind, lapse rate, stability of the air mass. Topography: Elevation, slope, aspect, exposure, vegetation.
10 SNOW-PACK METAMORFISM Compaction (melt cycles, collapsing layers). Destruction (rain events, input of solar energy, pollution). Reshaping by wind or additional snow events. Snow is a granular porous medium consisting of ice and pore spaces. When the snow is cold (its temperature is below the melting point of ice, 0 o C), the pore spaces contain only air (including water vapor). At the melting point, the pore spaces can contain liquid water as well as air, and snow becomes a three-phase system.
 Water equivalent (roughly 300 mm of fresh snow equal to 25 mm of")
11 BASIC SNOW-PACK CHARACTERISTICS Depth Volume (Total volume of ice, water and air in the snow-pack) Density (Fresh snow: g/l, after compaction cca 300 g/l) Water equivalent (roughly 300 mm of fresh snow equal to 25 mm of rain)
12 PROBLEMS TO EVALUATE THE SNOW-PACK U.S. National Weather Service (1975): Error of standard-gauge measurement (%) Wind speed (m/s) Error of gauge measurement (%) Rain Snow Snow/wind sheet Burroughs (1991): Anormalously high radar signal from melting snow-flakes error of %

13 LIMITED OBSERVATION STANDARD
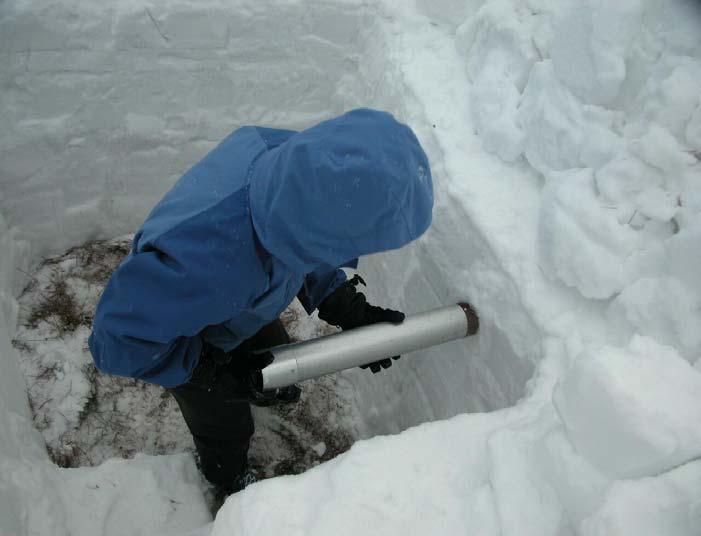
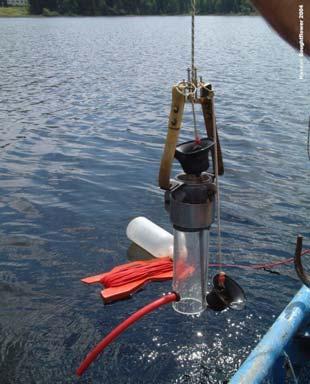
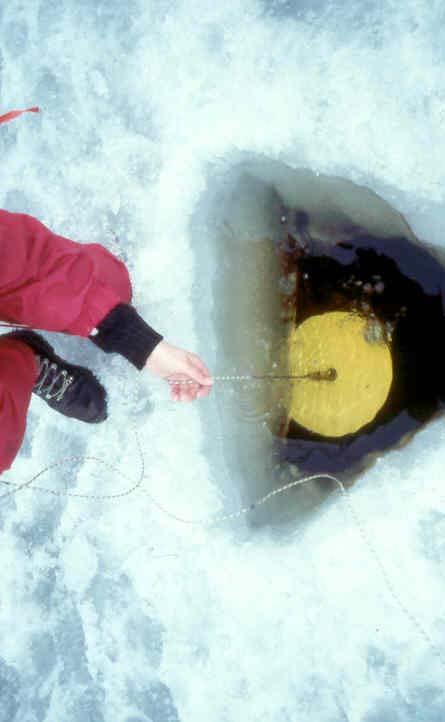
14 GROUND SNOW-SURVEY Snow depth and water equivalent in additional snow-lines. Application of Universal Snow Gauge (Cox, 1971). Snow pillows. Acoustic gauges, radioactive gauges. SATELLITE MAPPING Since the late 1960s, visible and infrared mearurements. Aerial extend but do not indicate the depth. Generally, 200 times cheaper than aerial surveys. Run-off prediction improved by 10 %. (Burroughs, 1991)

15 Schematic of the snow-melt process (Price et al, 1979)
16 SNOW - MELT RUNOFF Degree-day factor, a [mm deg -1 day -1 ]: R = a T (R snowmelt runoff, T mean daily air temperature). Martinec (1986): a = 1.1 ρ s / ρ w ρ s density of snow, ρ w density of water Male and Grey (Dingman, 1994): a = 4 (1 α) exp(-4f) S α albedo ( ), F fraction of forest cover, S slope factor
17 SNOW - MELT RUNOFF More sophisticated snowmelt models (lumped or distributed formulations) BROOK2, BROOK 90, SRM, SSAR, PRMS etc.

18 SNOW-PACK CHEMISTRY Contact with air pollutants. Shape and area of snow-flakes. Dry atmospheric deposition. Additional wet deposition. Snowmelt processes The Jizerka basin (Jizera Mts, 2004)

19 ROLE OF THE SNOW-PACK IN A GLACIER SYSTEM Annual mass balance relationship, Mayo, Meier & Tangborn (1972)
20 GLACIER MASS BALANCE Sugden & John (1984)
21 HISTORICAL CONSEQUENCES The climate is changing all the time - natural changes as a result of global climatic cycle (Milankovich theory) Worldwide Holocene glacier fluctuations Denton & Karlen (1973)

 During the 20th")
22 IPCC ( 2001): Changes in air temperatures near the ground in comparison with the climate normal ( ) During the 20th century: o C
23 IPCC (2001): Predicted air temperature for different scenarios of CO 2 emissions, In the year 1750, CO2: 280 ppm
24 Increasing ground instability in permafrost regions. IPCC (2007): There is high confidence that recent regional changes in temperature have had discernible impacts on many physical and biological systems. Arctic sea-ice extent had declined by about 10 to 15% since the 1950s. Mountain glaciers were receding on all continents. Extent of snow cover in the Northern Hemisphere had decreased by about 10% since the late 1960s and 1970s. Snowmelt and runoff had occurred increasingly earlier in Europe and western North America since the late 1940s.
25 REDUCING SEA ICE EXTENT

26 AREAL EXTENT OF CHACALTAYA GLACIER (Bolivia), Photo: Francou and Vincent (2006), Jordan (1991).
27 EXPECTED FUTURE IMPACTS OF CLIMATE CHANGE Increasing air temperatures. Rising wind, evapotranspiration, clouds. Changes in precipitation, higher rainfall intensities. More frequent and higher weather extremes. Reducing snow-pack, polar ice-cap (both extend and depth) and glaciers. Changes in stream-flow regimes; increasing water temperature of lakes and rivers, and change in chemistry.
28 EXPECTED IMPACTS ON RESOURCE MANAGEMENT Settlements in mountain regions - risk of floods caused by melting snow and ice. However, documented trends in floods show no evidence for a global widespread change. Increased water availability in high latitudes. Decreasing snow-pack, water availability and increasing drought in mid-latitudes. In Central and Eastern Europe, summer precipitation is projected to decrease, causing higherwater stress. Spruce forests endangered. Approximately 20-30% of plant and animal species assessed so far are likely to be at increased risk of extinction if increases in global average temperature exceed C.

29 Impact on tourism and winter sports in mid-altitude, and WHITE CHRISTMAS

30 EXTREME EVENTS: Critical Meteorological Situations in Central Europe Trajectories of atmospheric depressions: Vb, Vc, Vd. In the last years: Vb frequency increasing. High temperatures of the air supporting rain-storm genesis.
31 ADDITIONAL STRESS IN MOUNTAIN CATCHMENTS Spruce plantations of a low ecological stability. Air pollution and acid atmospheric deposition. Acidification of both terrestrial and aquatic ecosystems, dieback of spruce plantations, an extensive clear-cut, soil loss. Decreasing timber-line. Lack of environmental forestry practices
 Jizera Mts.")
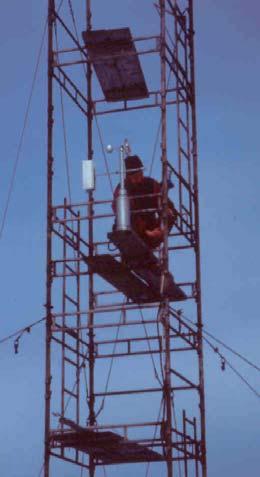
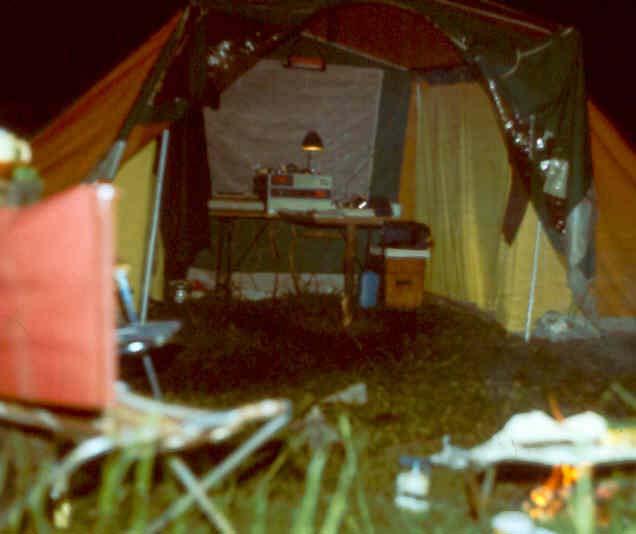
32 EFEECTS OF FOREST PRACTICES ON SNOW ACCUMULATION, MELT AND RUNOFF Czech Technical University and Muhos Research Station (Finish Forest Research Institute) Jizera Mts. Paljakka Forests


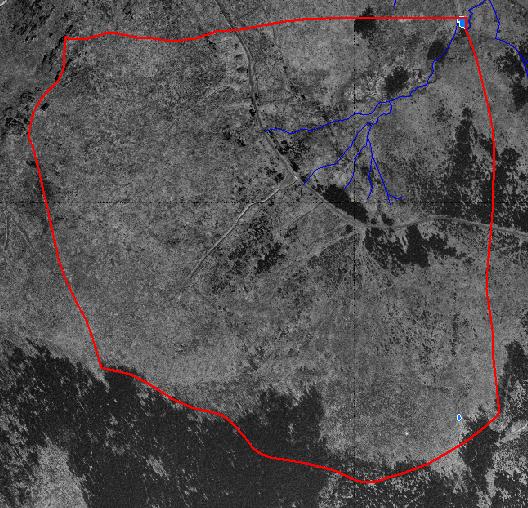
33 JIZERKA EXPERIMENTAL CATCHMENT 1981: mature spruce stands 1991: after clear-cut 1991: after clear-cut 2000: reforestation
34
35 depth (m) SNOW-MELT IMPACT: EPISODIC ACIDIFICATION IN STREAMWATERS RESERVOIRS ph 4 0 4,5 5 5, November 1996 May 1997 Inflow ph=5.1 Lake ph= Aluminium (ug/l) Inflow ph=6.0 Lake ph=6.0 Level of toxicity March May July August November 0 Toxic Al Nontoxic Al
36 REGENERATION OF RESERVOIRS 7 6 Reservoirs Limit Limit ph 5 ph Year Month

37 Paradoxically, forest clear-cut drop in the total load of acidity into the waters
![SNOW WATER EQUIVALENT AT PALJAKKA 350 water content of snow [mm] 300 250 200 150 100 50 0-0,5 4,6-0,7 0,2 3,2-2,7-2,9 3,7 5,7 1,2-2,4 3,6 2,6 31.3. 5.4. 7.4. 13.4. 15.4. 18.](/docs-images/78/78165497/images/38-0.jpg "4. 20.4. 25.4. 27.4. 29.4. 2.5. 4.5. 6.5. daily mean temperatute [ C] date water equivalent in the forest area [%] water equivalent in the open area [%]")
38 SNOW WATER EQUIVALENT AT PALJAKKA 350 water content of snow [mm] ,5 4,6-0,7 0,2 3,2-2,7-2,9 3,7 5,7 1,2-2,4 3,6 2, daily mean temperatute [ C] date water equivalent in the forest area [%] water equivalent in the open area [%]
39 ADAPTATION TO THE CLIMATE CHANGE IN A MOUNTAIN CATCHMENT Reducing additional stress (air pollution and acid atmospheric deposition etc.) Watershed-outlet as a measure of sustainability. Forestry strategy to support mixed forests near the native composition, environmental practices, from the sustainable production of timber to a sustainable watershed management Respecting ecological carrying capacity. Compromise between Scientism and Deep ecology.

40 Thank you for your attention
Observed changes in climate and their effects
 1 1.1 Observations of climate change Since the TAR, progress in understanding how climate is changing in space and time has been gained through improvements and extensions of numerous datasets and data
What is the IPCC? Intergovernmental Panel on Climate Change
 IPCC WG1 FAQ What is the IPCC? Intergovernmental Panel on Climate Change The IPCC is a scientific intergovernmental body set up by the World Meteorological Organization (WMO) and by the United Nations
 Permafrost http://www.cbc.ca/news/canada/story/2011/11/16/north-bigfix-permafrost.html 1. What is permafrost? Permafrost is a thick layer of permanently frozen ground. 2. Large parts of northeastern Russia
Energy Systems, Structures and Processes Essential Standard: Analyze patterns of global climate change over time Learning Objective: Differentiate
 Energy Systems, Structures and Processes Essential Standard: Analyze patterns of global climate change over time Learning Objective: Differentiate between weather and climate Global Climate Focus Question
Weather and Climate Change
 Weather and Climate Change What if the environmental lapse rate falls between the moist and dry adiabatic lapse rates? The atmosphere is unstable for saturated air parcels but stable for unsaturated air
The recent retreat of glaciers in the world
 The recent retreat of glaciers in the world Consequences for the global environment Dr Bernard Francou Director of Research Emeritus Grenoble-Alpes University - France Glaciers are part of the cryosphere
Prentice Hall EARTH SCIENCE
 Prentice Hall EARTH SCIENCE Tarbuck Lutgens Chapter 21 Climate 21.1 Factors That Affect Climate Factors That Affect Climate Latitude As latitude increases, the intensity of solar energy decreases. The
Chapter outline. Reference 12/13/2016
 Chapter 2. observation CC EST 5103 Climate Change Science Rezaul Karim Environmental Science & Technology Jessore University of science & Technology Chapter outline Temperature in the instrumental record
Climate Change in Colorado: Recent Trends, Future Projections and Impacts An Update to the Executive Summary of the 2014 Report
 Climate Change in Colorado: Recent Trends, Future Projections and Impacts An Update to the Executive Summary of the 2014 Report Jeff Lukas, Western Water Assessment, University of Colorado Boulder - Lukas@colorado.edu
Global Ocean Heat Content (0-700m) Other signs of (global) warming. Global Sea Level Rise. Change in upper ocean temperature ( )
 Other signs of (global) warming. Global Sea Level Rise. Change in upper ocean temperature ( )") Global Ocean Heat Content (0-700m) Change in upper ocean temperature (1955-2003) 0.25C 0.50C Solid lines are three independent estimates (95% confidence interval in grey) IPCC 2007 Fig TS.16 Trends in
Global Ocean Heat Content (0-700m) Change in upper ocean temperature (1955-2003) 0.25C 0.50C Solid lines are three independent estimates (95% confidence interval in grey) IPCC 2007 Fig TS.16 Trends in
The Importance of Snowmelt Runoff Modeling for Sustainable Development and Disaster Prevention
 The Importance of Snowmelt Runoff Modeling for Sustainable Development and Disaster Prevention Muzafar Malikov Space Research Centre Academy of Sciences Republic of Uzbekistan Water H 2 O Gas - Water Vapor
Climate Change 2007: The Physical Science Basis
 Climate Change 2007: The Physical Science Basis Working Group I Contribution to the IPCC Fourth Assessment Report Presented by R.K. Pachauri, IPCC Chair and Bubu Jallow, WG 1 Vice Chair Nairobi, 6 February
Global Climate Change and the Implications for Oklahoma. Gary McManus Associate State Climatologist Oklahoma Climatological Survey
 Global Climate Change and the Implications for Oklahoma Gary McManus Associate State Climatologist Oklahoma Climatological Survey OCS LEGISLATIVE MANDATES Conduct and report on studies of climate and weather
ATOC OUR CHANGING ENVIRONMENT Class 19 (Chp 6) Objectives of Today s Class: The Cryosphere [1] Components, time scales; [2] Seasonal snow
![ATOC OUR CHANGING ENVIRONMENT Class 19 (Chp 6) Objectives of Today s Class: The Cryosphere [1] Components, time scales; [2] Seasonal snow](/thumbs/95/126309683.jpg "ATOC OUR CHANGING ENVIRONMENT Class 19 (Chp 6) Objectives of Today s Class: The Cryosphere [1] Components, time scales; [2] Seasonal snow") ATOC 1060-002 OUR CHANGING ENVIRONMENT Class 19 (Chp 6) Objectives of Today s Class: The Cryosphere [1] Components, time scales; [2] Seasonal snow cover, permafrost, river and lake ice, ; [3]Glaciers and
ATOC 1060-002 OUR CHANGING ENVIRONMENT Class 19 (Chp 6) Objectives of Today s Class: The Cryosphere [1] Components, time scales; [2] Seasonal snow cover, permafrost, river and lake ice, ; [3]Glaciers and
1 What Is Climate? TAKE A LOOK 2. Explain Why do areas near the equator tend to have high temperatures?
 CHAPTER 17 1 What Is Climate? SECTION Climate BEFORE YOU READ After you read this section, you should be able to answer these questions: What is climate? What factors affect climate? How do climates differ
Environmental Science Chapter 13 Atmosphere and Climate Change Review
 Environmental Science Chapter 13 Atmosphere and Climate Change Review Multiple Choice Identify the choice that best completes the statement or answers the question. 1. Climate in a region is a. the long-term,
Lithosphere: (Rocky Sphere) Solid, rocky, outer layer of the Earth. Includes the crust and part of the upper mantle. Lithosphere
 Solid, rocky, outer layer of the Earth. Includes the crust and part of the upper mantle. Lithosphere") Lithosphere: (Rocky Sphere) Solid, rocky, outer layer of the Earth. Includes the crust and part of the upper mantle. Lithosphere Permafrost Permafrost Ground that is at a temperature of 0 or below for
Lithosphere: (Rocky Sphere) Solid, rocky, outer layer of the Earth. Includes the crust and part of the upper mantle. Lithosphere Permafrost Permafrost Ground that is at a temperature of 0 or below for
Ellen L. Mecray NOAA Regional Climate Services Director, Eastern Region Taunton, MA
 Ellen L. Mecray NOAA Regional Climate Services Director, Eastern Region Taunton, MA Regions of the US National Climate Assessment What we Observe: Climate changes and impacts Increasing temperature Increasingly
Global Climate Change and the Implications for Oklahoma. Gary McManus Associate State Climatologist Oklahoma Climatological Survey
 Global Climate Change and the Implications for Oklahoma Gary McManus Associate State Climatologist Oklahoma Climatological Survey Our previous stance on global warming Why the anxiety? Extreme Viewpoints!
1 What Is Climate? TAKE A LOOK 2. Explain Why do areas near the equator tend to have high temperatures?
 CHAPTER 17 1 What Is Climate? SECTION Climate BEFORE YOU READ After you read this section, you should be able to answer these questions: What is climate? What factors affect climate? How do climates differ
All objects emit radiation. Radiation Energy that travels in the form of waves Waves release energy when absorbed by an object. Earth s energy budget
 Radiation Energy that travels in the form of waves Waves release energy when absorbed by an object Example: Sunlight warms your face without necessarily heating the air Shorter waves carry more energy
Our climate system is based on the location of hot and cold air mass regions and the atmospheric circulation created by trade winds and westerlies.
 CLIMATE REGIONS Have you ever wondered why one area of the world is a desert, another a grassland, and another a rainforest? Or have you wondered why are there different types of forests and deserts with
Prentice Hall EARTH SCIENCE
 Prentice Hall EARTH SCIENCE Tarbuck Lutgens Chapter 21 Climate 21.1 Factors That Affect Climate Factors That Affect Climate Latitude As latitude increases, the intensity of solar energy decreases. The
Tropical Moist Rainforest
 Tropical or Lowlatitude Climates: Controlled by equatorial tropical air masses Tropical Moist Rainforest Rainfall is heavy in all months - more than 250 cm. (100 in.). Common temperatures of 27 C (80 F)
Brita Horlings
 Knut Christianson Brita Horlings brita2@uw.edu https://courses.washington.edu/ess431/ Natural Occurrences of Ice: Distribution and environmental factors of seasonal snow, sea ice, glaciers and permafrost
Extremes of Weather and the Latest Climate Change Science. Prof. Richard Allan, Department of Meteorology University of Reading
 Extremes of Weather and the Latest Climate Change Science Prof. Richard Allan, Department of Meteorology University of Reading Extreme weather climate change Recent extreme weather focusses debate on climate
Global warming and Extremes of Weather. Prof. Richard Allan, Department of Meteorology University of Reading
 Global warming and Extremes of Weather Prof. Richard Allan, Department of Meteorology University of Reading Extreme weather climate change Recent extreme weather focusses debate on climate change Can we
Activity 2.2: Recognizing Change (Observation vs. Inference)
") Activity 2.2: Recognizing Change (Observation vs. Inference) Teacher Notes: Evidence for Climate Change PowerPoint Slide 1 Slide 2 Introduction Image 1 (Namib Desert, Namibia) The sun is on the horizon
Activity 2.2: Recognizing Change (Observation vs. Inference) Teacher Notes: Evidence for Climate Change PowerPoint Slide 1 Slide 2 Introduction Image 1 (Namib Desert, Namibia) The sun is on the horizon
1. Base your answer to the following question on the weather map below, which shows a weather system that is affecting part of the United States.
 1. Base your answer to the following question on the weather map below, which shows a weather system that is affecting part of the United States. Which sequence of events forms the clouds associated with
What is Climate? Understanding and predicting climatic changes are the basic goals of climatology.
 What is Climate? Understanding and predicting climatic changes are the basic goals of climatology. Climatology is the study of Earth s climate and the factors that affect past, present, and future climatic
Chapter 2 Planet Earth
 Chapter 2 Planet Earth Section Notes Earth and the Sun s Energy Water on Earth The Land Close-up The Water Cycle World Almanac Major Eruptions in the Ring of Fire Quick Facts Chapter 2 Visual Summary Video
Chapter Introduction. Earth. Change. Chapter Wrap-Up
 Chapter Introduction Lesson 1 Lesson 2 Lesson 3 Climates of Earth Chapter Wrap-Up Climate Cycles Recent Climate Change What is climate and how does it impact life on Earth? What do you think? Before you
CLIMATE. UNIT TWO March 2019
 CLIMATE UNIT TWO March 2019 OUTCOME 9.2.1Demonstrate an understanding of the basic features of Canada s landscape and climate. identify and locate major climatic regions of Canada explain the characteristics
Keys to Climate Climate Classification Low Latitude Climates Midlatitude Climates High Latitude Climates Highland Climates Our Changing Climate
 Climate Global Climates Keys to Climate Climate Classification Low Latitude Climates Midlatitude Climates High Latitude Climates Highland Climates Our Changing Climate Keys to Climate Climate the average
Direction and range of change expected in the future
 Direction and range of Air Temperature Over the past 30 years, air Across the greater PNW and temperature has been Columbia Basin, an ensemble increasing an average of forecast from ten of the best 0.13
Climate Chapter 19. Earth Science, 10e. Stan Hatfield and Ken Pinzke Southwestern Illinois College
 Climate Chapter 19 Earth Science, 10e Stan Hatfield and Ken Pinzke Southwestern Illinois College The climate system A. Climate is an aggregate of weather B. Involves the exchanges of energy and moisture
The Global Scope of Climate. The Global Scope of Climate. Keys to Climate. Chapter 8
 The Global Scope of Climate Chapter 8 The Global Scope of Climate In its most general sense, climate is the average weather of a region, but except where conditions change very little during the course
What are the consequences of melting pack ice?
 The Hydrosphere s Cryosphere: A-Pack Ice: (Sea Ice) They are large sheets of ice found in the oceans around Antarctica and in the Arctic Ocean. Smaller ones are called ice floes. Example 1: What are the
Oregon Water Conditions Report April 17, 2017
 Oregon Water Conditions Report April 17, 2017 Mountain snowpack continues to maintain significant levels for mid-april. By late March, statewide snowpack had declined to 118 percent of normal after starting
3. The map below shows an eastern portion of North America. Points A and B represent locations on the eastern shoreline.
 1. Most tornadoes in the Northern Hemisphere are best described as violently rotating columns of air surrounded by A) clockwise surface winds moving toward the columns B) clockwise surface winds moving
1 What Is Climate? TAKE A LOOK 2. Explain Why do areas near the equator tend to have high temperatures?
 CHAPTER 3 1 What Is Climate? SECTION Climate BEFORE YOU READ After you read this section, you should be able to answer these questions: What is climate? What factors affect climate? How do climates differ
Climate.tgt, Version: 1 1
 Name: Key Concepts Choose the letter of the best answer. (5 points each) 1. 2. 3. 4. 5. 6. 7. 8. 9. 10. Date: A city located in the middle of North America experiences extreme temperature changes during
THE EARTH S CLIMATE SYSTEM
 THE EARTH S CLIMATE SYSTEM Earth s Climate System is driven by interactions between the parts of our biosphere So.what is the Biosphere? a relatively thin layer of Earth that has conditions suitable for
SNOW AND GLACIER HYDROLOGY
 SNOW AND GLACIER HYDROLOGY by PRATAP SINGH National Institute of Hydrology, Roorkee, India and VIJAY P. SINGH Department of Civil and Environmental Engineering, Louisiana State University, Baton Rouge,
Terrestrial Climate Change Variables
 Terrestrial Climate Change Variables Content Terrestrial Climate Change Variables Surface Air Temperature Land Surface Temperature Sea Level Ice Level Aerosol Particles (acid rain) Terrestrial Climate
Climate also has a large influence on how local ecosystems have evolved and how we interact with them.
 The Mississippi River in a Changing Climate By Paul Lehman, P.Eng., General Manager Mississippi Valley Conservation (This article originally appeared in the Mississippi Lakes Association s 212 Mississippi
The elevations on the interior plateau generally vary between 300 and 650 meters with
 11 2. HYDROLOGICAL SETTING 2.1 Physical Features and Relief Labrador is bounded in the east by the Labrador Sea (Atlantic Ocean), in the west by the watershed divide, and in the south, for the most part,
The known requirements for Arctic climate services
 The known requirements for Arctic climate services based on findings described in STT White paper 8/2015 Johanna Ekman / EC PHORS STT Regional drivers The Arctic region is home to almost four million people
Thermal / Solar. When air is warmed it... Rises. Solar Energy. Evaporation. Condensation Forms Clouds
 Thermal / Solar Light from the Sun is transformed into what type of energy when it hits Earth's surface? Rises When air is warmed it... Solar Energy Water moves through the water cycle using what type
Climate and the Atmosphere
 Climate and Biomes Climate Objectives: Understand how weather is affected by: 1. Variations in the amount of incoming solar radiation 2. The earth s annual path around the sun 3. The earth s daily rotation
Oregon Water Conditions Report May 1, 2017
 Oregon Water Conditions Report May 1, 2017 Mountain snowpack in the higher elevations has continued to increase over the last two weeks. Statewide, most low and mid elevation snow has melted so the basin
MET 3102-U01 PHYSICAL CLIMATOLOGY (ID 17901) Lecture 14
 Lecture 14") MET 3102-U01 PHYSICAL CLIMATOLOGY (ID 17901) Lecture 14 The hydrologic cycle evaporation vapor transport precipitation precipitation evaporation runoff Evaporation, precipitation, etc. in cm Vapor transported
MET 3102-U01 PHYSICAL CLIMATOLOGY (ID 17901) Lecture 14 The hydrologic cycle evaporation vapor transport precipitation precipitation evaporation runoff Evaporation, precipitation, etc. in cm Vapor transported
CHAPTER 6 Air-Sea Interaction Pearson Education, Inc.
 CHAPTER 6 Air-Sea Interaction Chapter Overview The atmosphere and the ocean are one independent system. Earth has seasons because of the tilt on its axis. There are three major wind belts in each hemisphere.
Factors That Affect Climate
 Factors That Affect Climate Factors That Affect Climate Latitude As latitude (horizontal lines) increases, the intensity of solar energy decreases. The tropical zone is between the tropic of Cancer and
Hydrologic Overview & Quantities
 Hydrologic Overview & Quantities It is important to understand the big picture when attempting to forecast. This includes the interactive components and hydrologic quantities. Hydrologic Cycle The complexity
Chapter 2 Geography Study Guide
 Chapter 2 Geography Study Guide Multiple Choice Identify the letter of the choice that best completes the statement or answers the question. 1. What is the largest and deepest ocean? a. the Indian Ocean
Land Surface: Snow Emanuel Dutra
 Land Surface: Snow Emanuel Dutra emanuel.dutra@ecmwf.int Slide 1 Parameterizations training course 2015, Land-surface: Snow ECMWF Outline Snow in the climate system, an overview: Observations; Modeling;
Atmosphere Weather and Climate
 Atmosphere Weather and Climate Weather and Climate Weather Atmospheric conditions at a particular time and place Climate Long-term average of weather conditions Often over decades or centuries Coastal
Basic Hydrologic Science Course Understanding the Hydrologic Cycle Section Six: Snowpack and Snowmelt Produced by The COMET Program
 Basic Hydrologic Science Course Understanding the Hydrologic Cycle Section Six: Snowpack and Snowmelt Produced by The COMET Program Snow and ice are critical parts of the hydrologic cycle, especially at
Lecture 28: Observed Climate Variability and Change
 Lecture 28: Observed Climate Variability and Change 1. Introduction This chapter focuses on 6 questions - Has the climate warmed? Has the climate become wetter? Are the atmosphere/ocean circulations changing?
Terrestrial Snow Cover: Properties, Trends, and Feedbacks. Chris Derksen Climate Research Division, ECCC
 Terrestrial Snow Cover: Properties, Trends, and Feedbacks Chris Derksen Climate Research Division, ECCC Outline Three Snow Lectures: 1. Why you should care about snow: Snow and the cryosphere Classes of
Section 1: The Water Cycle. Q1. How many times has the water on Earth been through a complete turn of the water cycle?
 Water EARTH SCIENCE WEATHER WATER Section 1: The Water Cycle What is the water cycle? The water cycle means that any droplet of water will circulate in a nonstop cycle between the ocean, the atmosphere
3 Temperate and Polar Zones
 CHAPTER 3 3 Temperate and Polar Zones SECTION Climate BEFORE YOU READ After you read this section, you should be able to answer these questions: What biomes are found in the temperate zone? What biomes
Future Climate Change
 Future Climate Change How do you know whether to trust a prediction about the future? All predictions are based on global circulation models (GCMs, AOGCMs) - model accuracy is verified by its ability to
A SURVEY OF HYDROCLIMATE, FLOODING, AND RUNOFF IN THE RED RIVER BASIN PRIOR TO 1870
 A SURVEY OF HYDROCLIMATE, FLOODING, AND RUNOFF IN THE RED RIVER BASIN PRIOR TO 1870 W. F. RANNIE (UNIVERSITY OF WINNIPEG) Prepared for the Geological Survey of Canada September, 1998 TABLE OF CONTENTS
Climate Classification
 Chapter 15: World Climates The Atmosphere: An Introduction to Meteorology, 12 th Lutgens Tarbuck Lectures by: Heather Gallacher, Cleveland State University Climate Classification Köppen classification:
THE CANADIAN CENTRE FOR CLIMATE MODELLING AND ANALYSIS
 THE CANADIAN CENTRE FOR CLIMATE MODELLING AND ANALYSIS As Canada s climate changes, and weather patterns shift, Canadian climate models provide guidance in an uncertain future. CANADA S CLIMATE IS CHANGING
Extreme Weather and Climate Change: the big picture Alan K. Betts Atmospheric Research Pittsford, VT NESC, Saratoga, NY
 Extreme Weather and Climate Change: the big picture Alan K. Betts Atmospheric Research Pittsford, VT http://alanbetts.com NESC, Saratoga, NY March 10, 2018 Increases in Extreme Weather Last decade: lack
Chapter 3 Packet. and causes seasons Earth tilted at 23.5 / 365 1/4 days = one year or revolution
 Name Chapter 3 Packet Sequence Section 1 Seasons and Weather : and causes seasons Earth tilted at 23.5 / 365 1/4 days = one year or revolution solstice - begins summer in N. hemisphere, longest day winter
Social Studies. Chapter 2 Canada s Physical Landscape
 Social Studies Chapter 2 Canada s Physical Landscape Introduction Canada s geography its landforms and climate - has a great impact on Canadians sense of identity. Planet Earth The earth is divided into
Storm and Runoff Calculation Standard Review Snowmelt and Climate Change
 Storm and Runoff Calculation Standard Review Snowmelt and Climate Change Presented by Don Moss, M.Eng., P.Eng. and Jim Hartman, P.Eng. Greenland International Consulting Ltd. Map from Google Maps TOBM
2. Fargo, North Dakota receives more snow than Charleston, South Carolina.
 2015 National Tournament Division B Meteorology Section 1: Weather versus Climate Chose the answer that best answers the question 1. The sky is partly cloudy this morning in Lincoln, Nebraska. 2. Fargo,
School Name Team # International Academy East Meteorology Test Graphs, Pictures, and Diagrams Diagram #1
 School Name Team # International Academy East Meteorology Test Graphs, Pictures, and Diagrams Diagram #1 Use the map above, and the locations marked A-F, to answer the following questions. 1. The center
Day 1 of Global Warming. Copyright 2008 Pearson Education, Inc., publishing as Pearson Benjamin Cummings
 Day 1 of Global Warming Copyright 2008 Pearson Education, Inc., publishing as Pearson Benjamin Cummings The Atmosphere Atmosphere = the thin layer (1/100 th of Earth s diameter) of gases that surrounds
CLIMATE. SECTION 14.1 Defining Climate
 Date Period Name CLIMATE SECTION.1 Defining Climate In your textbook, read about climate and different types of climate data. Put a check ( ) next to the types of data that describe climate. 1. annual
CH. 3: Climate and Vegetation
 CH. 3: Climate and Vegetation GROUP WORK RUBRIC Score of 50 (5): Superior - 100% A 5 is superior work, and has completed all requirements of the assignments, it is in order and its presentation is almost
Chapter 2: Physical Geography
 Chapter 2: Physical Geography Pg. 39-68 Learning Goals for Chp2: q q q q q Explain how the Earth moves in space and why seasons change. Outline the factors that influence climate and recognize different
Climates of Earth. Lesson Outline LESSON 1. A. What is climate? 1. is the long-term average weather conditions that occur in a particular region.
 Lesson Outline LESSON 1 A. What is climate? 1. is the long-term average weather conditions that occur in a particular region. 2. Climate depends on how average weather conditions throughout the year. B.
Lecture Outlines PowerPoint. Chapter 20 Earth Science 11e Tarbuck/Lutgens
 Lecture Outlines PowerPoint Chapter 20 Earth Science 11e Tarbuck/Lutgens 2006 Pearson Prentice Hall This work is protected by United States copyright laws and is provided solely for the use of instructors
CLIMATE READY BOSTON. Climate Projections Consensus ADAPTED FROM THE BOSTON RESEARCH ADVISORY GROUP REPORT MAY 2016
 CLIMATE READY BOSTON Sasaki Steering Committee Meeting, March 28 nd, 2016 Climate Projections Consensus ADAPTED FROM THE BOSTON RESEARCH ADVISORY GROUP REPORT MAY 2016 WHAT S IN STORE FOR BOSTON S CLIMATE?
RELATIVE IMPORTANCE OF GLACIER CONTRIBUTIONS TO STREAMFLOW IN A CHANGING CLIMATE
 Proceedings of the Second IASTED International Conference WATER RESOURCE MANAGEMENT August 20-22, 2007, Honolulu, Hawaii, USA ISGN Hardcopy: 978-0-88986-679-9 CD: 978-0-88-986-680-5 RELATIVE IMPORTANCE
Climate Change in the Northeast
 Climate Change in the Northeast Dr. Alan K. Betts Atmospheric Research, Pittsford, VT 05763 akbetts@aol.com http://alanbetts.com NNECAPA Stowe, VT September 11, 2014 Outline Science of climate change Global
Our Planet Earth. I nteractions of Earth Systems
 CHAPTER 3 LESSON 2 Our Planet Earth I nteractions of Earth Systems Key Concepts How does the water cycle show interactions of Earth systems? How does weather show interactions of Earth systems? How does
Observed State of the Global Climate
 WMO Observed State of the Global Climate Jerry Lengoasa WMO June 2013 WMO Observations of Changes of the physical state of the climate ESSENTIAL CLIMATE VARIABLES OCEANIC ATMOSPHERIC TERRESTRIAL Surface
Name Date Class. well as the inland, found near the Tropics. 4. In the, or the regions near the Equator, you may find a lush
 WATER, CLIMATE, AND VEGETATION Vocabulary Activity DIRECTIONS: Fill in the Blanks Select a term from below to complete each of the following sentences. CHAPTER 1. The constant movement of water, a process
Chapter 15: Weather and Climate
 Chapter 15: Weather and Climate Multiple Choice Identify the choice that best completes the statement or answers the question. 1. The short-term state of the atmosphere is called a. climate. c. water cycle.
WHAT CAN MAPS TELL US ABOUT THE GEOGRAPHY OF ANCIENT GREECE? MAP TYPE 1: CLIMATE MAPS
 WHAT CAN MAPS TELL US ABOUT THE GEOGRAPHY OF ANCIENT GREECE? MAP TYPE 1: CLIMATE MAPS MAP TYPE 2: PHYSICAL AND/OR TOPOGRAPHICAL MAPS MAP TYPE 3: POLITICAL MAPS TYPE 4: RESOURCE & TRADE MAPS Descriptions
Chapter 3 Section 3 World Climate Regions In-Depth Resources: Unit 1
 Guided Reading A. Determining Cause and Effect Use the organizer below to show the two most important causes of climate. 1. 2. Climate B. Making Comparisons Use the chart below to compare the different
Land Surface Sea Ice Land Ice. (from Our Changing Planet)
") Lecture 5: Land Surface and Cryosphere (Outline) Land Surface Sea Ice Land Ice (from Our Changing Planet) Earth s s Climate System Solar forcing Atmosphere Ocean Land Solid Earth Energy, Water, and Biochemistry
Lecture 5: Land Surface and Cryosphere (Outline) Land Surface Sea Ice Land Ice (from Our Changing Planet) Earth s s Climate System Solar forcing Atmosphere Ocean Land Solid Earth Energy, Water, and Biochemistry
Earth s Climate System. Surface Albedo. Climate Roles of Land Surface. Lecture 5: Land Surface and Cryosphere (Outline) Land Surface Sea Ice Land Ice
 Land Surface Sea Ice Land Ice") Lecture 5: Land Surface and Cryosphere (Outline) Earth s Climate System Solar forcing Land Surface Sea Ice Land Ice Atmosphere Ocean Land Solid Earth Energy, Water, and Biochemistry Cycles (from Our Changing
Lecture 5: Land Surface and Cryosphere (Outline) Earth s Climate System Solar forcing Land Surface Sea Ice Land Ice Atmosphere Ocean Land Solid Earth Energy, Water, and Biochemistry Cycles (from Our Changing
Drought Monitoring with Hydrological Modelling
 st Joint EARS/JRC International Drought Workshop, Ljubljana,.-5. September 009 Drought Monitoring with Hydrological Modelling Stefan Niemeyer IES - Institute for Environment and Sustainability Ispra -
Meteorology. Chapter 15 Worksheet 1
 Chapter 15 Worksheet 1 Meteorology Name: Circle the letter that corresponds to the correct answer 1) The Tropic of Cancer and the Arctic Circle are examples of locations determined by: a) measuring systems.
hydrosphere notes nwebsite.notebook November 30, 2015 The Hydrosphere
 hydrosphere notes nwebsite.notebook The Hydrosphere 1 Earth's outer layer of water found as liquid gas or solid. Stats: 71% of earth is water 97.5% of this water is in the oceans 2.5% left is rivers, lakes,
The Atmosphere Made up of mainly two gases: Nitrogen 78% Oxygen 21% Trace Gases 1%
 The Atmosphere 18.1 The Atmosphere Made up of mainly two gases: Nitrogen 78% Oxygen 21% Trace Gases 1% Layers of the Atmosphere made made up of 5 layers: Troposphere Stratosphere Mesosphere Ionosphere
2018 Science Olympiad: Badger Invitational Meteorology Exam. Team Name: Team Motto:
 2018 Science Olympiad: Badger Invitational Meteorology Exam Team Name: Team Motto: This exam has 50 questions of various formats, plus 3 tie-breakers. Good luck! 1. On a globally-averaged basis, which
World Geography Chapter 3
 World Geography Chapter 3 Section 1 A. Introduction a. Weather b. Climate c. Both weather and climate are influenced by i. direct sunlight. ii. iii. iv. the features of the earth s surface. B. The Greenhouse
Multiple Choice Identify the choice that best completes the statement or answers the question.
 CH.15 practice TEST Multiple Choice Identify the choice that best completes the statement or answers the question. 1) The short-term state of the atmosphere is called a) climate. c) water cycle. b) weather.
Weather Atmospheric condition in one place during a limited period of time Climate Weather patterns that an area typically experiences over a long
 Weather Atmospheric condition in one place during a limited period of time Climate Weather patterns that an area typically experiences over a long period of time Many factors influence weather & climate
Figure 1. Carbon dioxide time series in the North Pacific Ocean (
 Evidence #1: Since 1950, Earth s atmosphere and oceans have changed. The amount of carbon released to the atmosphere has risen. Dissolved carbon in the ocean has also risen. More carbon has increased ocean
GLOBAL WARMING AND THE GREENHOUSE EFFECT
 GLOBAL WARMING AND THE GREENHOUSE EFFECT Our planet temperature is warming significantly due to human activities? OR Last few years warming is part of a natural global cycle? 1998 : The warmest year on