Quick-Guide to SATAID
|
|
|
- Ralf Sullivan
- 6 years ago
- Views:
Transcription


1 Quick-Guide to SATAID Japan Meteorological Agency Updated as of 2017/07/24


2 What is SATAID? SATAID (SATellite Animation and Interactive Diagnosis) is a sophisticated display program that enables visualization of meteorological information in multiple spatial and temporal dimensions. This helps forecasters to continually analyze and monitor weather parameters and phenomena for improved meteorological services. Display customization Data overlay With NWP data Animation Multiple functions With observation data Japan Meteorological Agency 2


3 Contents 1. Installing SATAID 5. Customizing Display Installing SATAID Downloading data Using WIS Downloader Adjusting Gradation and Enhancing Color 2. Controlling and Displaying Satellite Images Selecting Satellite Images Controlling Animations Zooming In/Out Displaying RGB images Displaying Coast/Grid Lines 3. Displaying NWP Data 6. Data Evaluation Brightness Evaluation Movement (Vector) Evaluation Time-series Evaluation Cross-sectional Evaluation Isolines (Contours) Histograms Displaying NWP Data Changing Elements Changing Colors/Line Types/Hatch patterns Displaying SST Data 4. Displaying Observation Data 7. Other Functions Changing Window Size Creating Drawings Outputting images Saving New Settings Displaying SYNOP/SHIP/TEMP Data Displaying ASCAT Data Japan Meteorological Agency 3
4 1. Installing SATAID and Downloading Data

. http://www.")


5 Installing SATAID 1. Download SATAID_data_download_tool.zip from the SATAID Service website (ID/Password required) Decompress the zip file and copy/move the folder to the desired location. Don't put on the desktop Decompress Decompress Copy/Move Zip file Zip file without extension Main folder after decompression Folder for SATAID Japan Meteorological Agency 5
6 Downloading Data Using WIS Downloader Download and install SATAID If you already have the WIS.ini file, it can be made readable by putting it in the wis2 folder before STEP 1 below. *The file should be backed up, as it will be overwritten when a new initial file is made using MakaIniFile.hta. STEP 1: Make the WIS.ini file using MakeIniFile.hta. STEP 2: Download the data and activate the SATAID application using Sataid_Loop_V2.hta. Start SATAID. (Automatic activation) Japan Meteorological Agency 6

 Other Settings Time difference from UTC Time of file deletion WIS ID, Password Proxy Japan")
7 Downloading Data Using WIS Downloader 1. Make an initial file for WIS Downloader. * If you already have the WIS.ini file, it can be made readable by clicking Read button. MakeIniFile.hta file (1) Image Area Settings Select Himawari image area Select cutout area using Lat/Lon (1) (2) (2) Other Settings Time difference from UTC Time of file deletion WIS ID, Password Proxy Japan Meteorological Agency 7
 (2) (2) Set up details.")
8 Downloading Data Using WIS Downloader 2. Download data from the WIS server. * Close SATAID (GMSLPD) before using the SATAID Automatic Downloader. (1) Select Data. Himawari-8 bands NWP data Other observation data (1) (2) (2) Set up details. Animation duration Interval between animation frames* OS type (32/64bit) Auto-update function * Depending on PC memory capacity, a short animation may need to be specified if 10-min intervals are selected. After the data download, SATAID will start automatically. Japan Meteorological Agency 8
9 2. Controlling and Displaying Satellite Images 9
10 Selecting Satellite Images Band Wavelength [µm] Himawari Cloud* Himawari Cast* WIS* Select data V (1 km) V2 Visible 0.51 (1 km) VS 0.64 (0.5 km) (1 km) (4 km) N (1 km) (4 km) N2 Near Infrared 1.6 (2 km) (4 km) N3 2.3 (2 km) (4 km) I4 3.9 (2 km) (2 or 4 km) (4 km) WV 6.2 (2 km) (4 km) (4 km) W2 7.0 (2 km) (4 km) W3 7.3 (2 km) (4 km) MI 8.6 (2 km) (4 km) Infrared O3 9.6 (2 km) (4 km) IR 10.4 (2 km) (4 km) (4 km) L (2 km) (4 km) I (2 km) (4 km) (4 km) CO 13.3 (2 km) (4 km) *(): spatial resolution Japan Meteorological Agency 10
11 Selecting Satellite Images Differential Images S1: Differential images 1 (IR I2) S2: Differential images 2 (I4 IR) S3: Differential images 3 (IR-WV) etc Select data Enhanced Images EIRc: Colored enhanced infrared images EIRm: Monochrome enhanced infrared images Japan Meteorological Agency 11
. Start/Stop Animation. or Space Control Panel Display previous image. Display next image.")

12 Controlling animation Drag and to change animation duration of animation duration (first/last image). Start/Stop Animation. or Space Control Panel Display previous image. Display next image. or or Play in reverse sequence. Play in normal sequence. or or Adjust animation speed. Tips or + or Ctrl : Specify current image as the first/last image of animation. Japan Meteorological Agency 12
![Zooming In/Out Click here. Method 1 - Display enlarged area. Click [Zoom] button and drag area. - Return to whole image. Click [Normal] button.](/docs-images/75/71732653/images/13-1.jpg "Method 2 - Zoom in: Ctrl + Shift + Left-Click - Zoom out: Ctrl + Shift + Right-Click Tip Areas can be digitally designated with longitude/latitude information.")
13 Zooming In/Out Click here. Method 1 - Display enlarged area. Click [Zoom] button and drag area. - Return to whole image. Click [Normal] button. Method 2 - Zoom in: Ctrl + Shift + Left-Click - Zoom out: Ctrl + Shift + Right-Click Tip Areas can be digitally designated with longitude/latitude information. Ctrl + Shift + [Zoom] Japan Meteorological Agency 13

14 Displaying RGB Images 1. Select Option. 2. Click RGB list. 3. Select RGB image. 4. Click Apply to display. Japan Meteorological Agency 14

15 Displaying color legends Activate this checkbox. Japan Meteorological Agency 15
![Displaying Coast/Grid Lines Checkbox activation with [Ctrl] pressed: larger font for latitude/longitude figures Checkbox activation](/docs-images/75/71732653/images/16-1.jpg "with [Shift] pressed: with background color for latitude/longitude figures Checkbox activation with [Ctrl] + [Shift] pressed: larger")

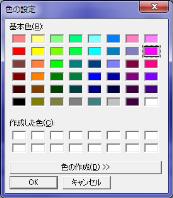
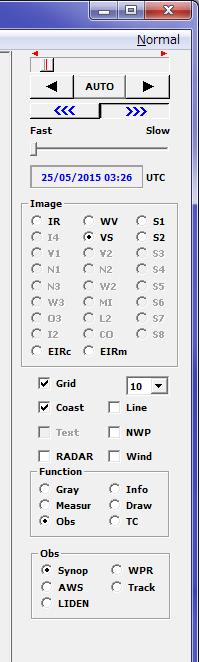
16 Displaying Coast/Grid Lines Checkbox activation with [Ctrl] pressed: larger font for latitude/longitude figures Checkbox activation with [Shift] pressed: with background color for latitude/longitude figures Checkbox activation with [Ctrl] + [Shift] pressed: larger font with background color Select latitude/longitude intervals. [Map element] can be selected from the [Option] menu to add rivers/lakes/borders, etc. Here The colors of these lines can be changed using [Line color] in the [Option] menu. Japan Meteorological Agency 16


17 Changing Line Style The line style can be set here. The line width can be set here. Click Map element with Shift pressed. Multi can be checked to enable line color change. Latitude and longitude character size can be changed here. Latitude/longitude background can be toggled on and off here. Japan Meteorological Agency 17
18 3.Displaying NWP Data 18
19 Displaying NWP data 4. Click Exec to display Available NWP data 2. Select NWP model Shrink/extend window 3. Select the desired elements 1. Check NWP to display a pop-up window Japan Meteorological Agency 19

20 Changing Elements 1. Click the upper-left corner of the window to display a pop-up window. 2. Elements can be changed on the panel. Tips When [Data file] is clicked, a CSV file of selected NWP elements is output. When [Last init.] is NOT selected, the previous initial NWP data is displayed. When [Interpolation] is selected, forecast fields between forecast times can be interpolated and displayed (i.e. if [Interpolation] is NOT selected, NWP data are shown only every six hours). Japan Meteorological Agency 20


21 Changing Colors/Line Types/Hatch Patterns Initial time Colors can be changed here. Intervals between contours (isolines) can be selected here. Japan Meteorological Agency 21


22 Displaying Forecast Values The space between the red arrows becomes shorter. Drag the red arrow to the right to select the forecast time. Open NWP menu. Before After Satellite images are not shown while forecast time data are being displayed. Japan Meteorological Agency 22


23 Displaying SST data Activate this checkbox. Activate this checkbox. Japan Meteorological Agency 23
24 4. Displaying Observation Data


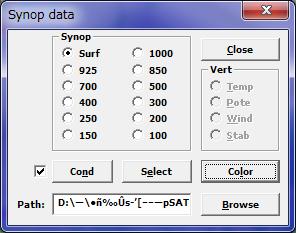
25 Displaying SYNOP/SHIP/TEMP Data Select Surf. SYNOP/SHIP Click a site on the display to open a pop-up window for that site. Select a figure between 1,000 and 100. TEMP Click a site on the display to open a pop-up window for that site. 1 2 Japan Meteorological Agency 25
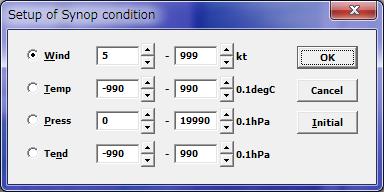
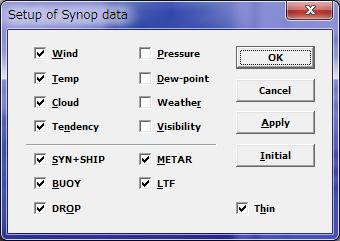
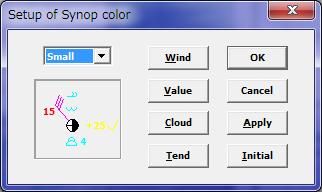
26 Displaying SYNOP/SHIP/TEMP Data Set data display thresholds. Select elements to be displayed Set symbol color. Japan Meteorological Agency 26
27 Displaying ASCAT Data Check Japan Meteorological Agency 27
28 5. Customizing Display


29 Adjusting Gradation and Enhancing Color Adjust brightness. 2. Change contrast. 3. Reset grayscale. Select a radio button to change the grayscale setting. Click Gray Gradation display box - To select a range to be emphasized: Click on two arbitrary points - To clear the range to be emphasized: Right-click on the first point and left-click on the second. Japan Meteorological Agency 29

30 Brightness Adjusting Gradation Contrast Click on the display to adjust gradation. Japan Meteorological Agency 30
31 6. Data Evaluation

32 Brightness Evaluation Click on the image 1. Check Measur 2. Check Brit When NWP data are displayed, estimated altitudes will be shown. Japan Meteorological Agency 32
 Vert.")


33 Brightness Evaluation Vert.1 (Air temp.) Vert.2 (Potential temp.) Vert.3 (wind) Click the upper-left of the window Wind, temperature and dew-point temperature Vert.4 (Stability) Wind, potential temperature, equivalent potential temperature and saturated equivalent potential temperature Vert.5 (Trajectory) Wind hodograph or scorer number SSI, KI, CAPE and CIN Trajectories with positions, altitudes, potential temperature and equivalent potential temperature changed over time. Japan Meteorological Agency 33


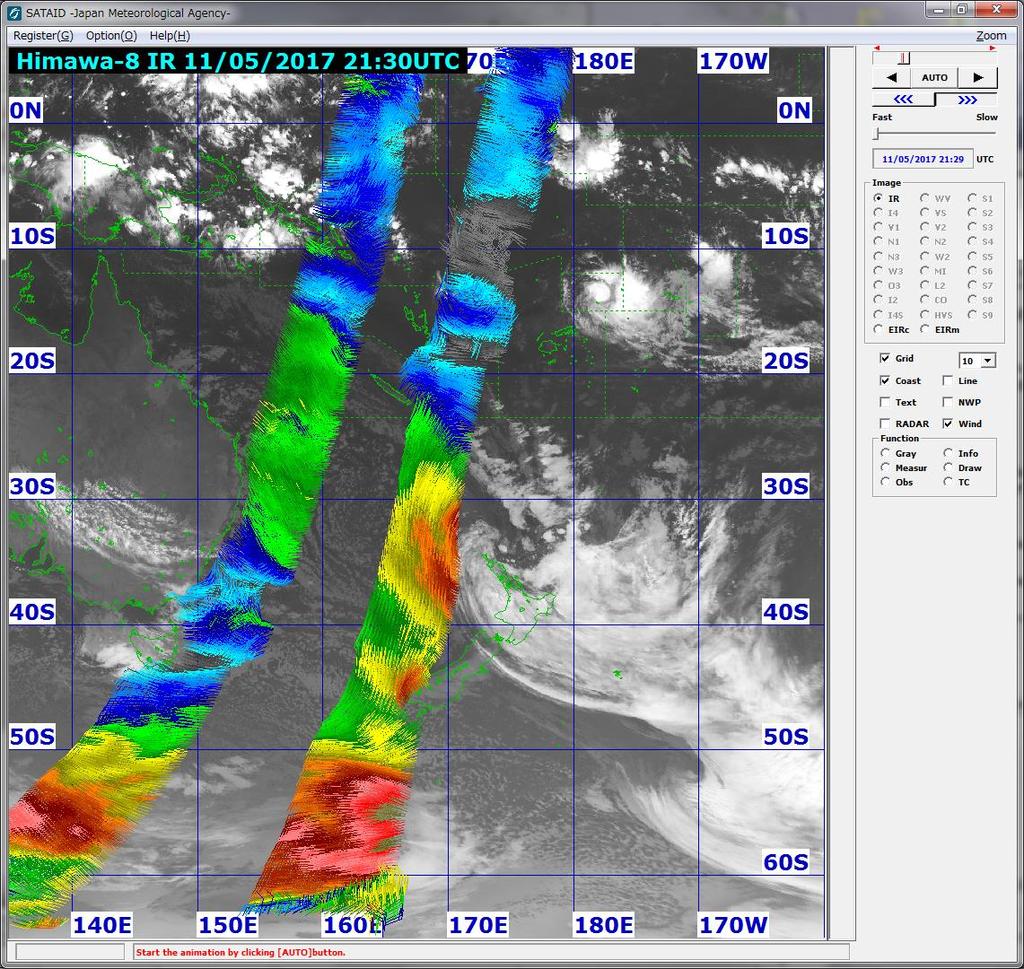
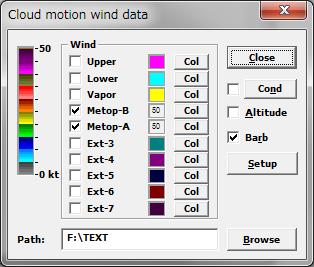
34 Movement (Vector) Evaluation Select the first point in the first image. Change the time as desired. Select the second point in the next image. 1. Check Measur Movement vector is automatically calculated. 2. Check Move Movement speed is also calculated. Japan Meteorological Agency 34


35 Time-series Evaluation Click on the image. 1. Check Measur 2. Check Time When NWP data are displayed, a timeseries graph of NWP data for the selected point will be shown. Japan Meteorological Agency 35


36 Time-series Evaluation Click upper-left of window Sync view: Data in the graph are updated in synchronization with animation. Fixed scale: Upper- and lower-limit values on the scale are fixed, and can be changed in Scale setup. If this is left unchecked, actual maximum and minimum brightness values are shown. Adjust size: Graph sizes change in proportion to the window size. NwpTbb: If this is left unchecked, no brightness temperature graph is shown on the screen. Only NWP data are shown. Japan Meteorological Agency 36


37 Cross-sectional Evaluation Drag to define a cross section. 1. Check Measur 2. Check Cross When NWP data are displayed, a crosssectional graph of NWP data for the selected point will be shown. Japan Meteorological Agency 37
38 Isolines (Contours) Drag to specify a rectangular area 1. Check Measur 2. Check Contour Japan Meteorological Agency 38


 Select hatch")
39 Isolines (Contours) Set up counter. Click the upperleft of the window. Select upper/lower value and interval. Select line type. No (No hatch pattern shown) Is Extra contour checked? Select color. Select color. Yes (Hatch pattern shown) Select line type. Select hatch pattern. Select upper/lower value and interval. Japan Meteorological Agency 39

40 Histograms Double-click the last point. 1. Check Measur Click points on the display to specify a polygonal area. 2. Check Hist Japan Meteorological Agency 40


.")

41 Histograms Mode1 Mode2 Click the upper-left of the window. Statistical values and a histogram are shown. Mode3 Brightness degrees (temp. for IR and reflectivity for VIS channel) are shown as numerical values. Mode4 Frequency distribution of brightness degrees is shown (the interval can be changed on the histogram setup menu). A scatter diagram of brightness temp. or reflectivity together with regression lines is shown for two different image types at the same time. Japan Meteorological Agency 41
42 7. Other Functions


43 Changing Window Size The screen size window can be opened to change the size of the SATAID window by clicking on [Screen size] in the [Option] menu. Window size can be specified using the width and height boxes (unit: pixels). Window size is automatically adjusted to fit the display. Japan Meteorological Agency 43
44 Creating Drawings Select line width. Select Thin, Standard or Thick. Spline drawing Select the line width and check the [Curve] checkbox. Click on two or more points in the displayed image and double click on the end point. 1. Check Draw Tip Partial erasure Select the [Erase] checkbox. Click a line or a character string, etc. in the current image to erase it. The item will be displayed in reverse color, and will be erased if clicked again. * If neither [Curve] nor [Erase] is selected, freehand drawing is enabled. Japan Meteorological Agency 44


45 Deleting Drawn Figures Right-click on the figure. Left-click on the Question mark. Japan Meteorological Agency 45
![Creating Drawings 1 2 1. Delete all drawings. ([Clear] button) 2. Cancel the previous drawing operation. ([Undo] button) 1. Check Draw 2. Click Extra 4 5 6 A: Change color and hatch pattern.](/docs-images/75/71732653/images/46-0.jpg "B: Change symbol size. 3 A B 3. Draw lines and arrows (fronts, troughs, or ridges), which can be created as with spline drawings.")
![*Click the [Sn-front] button with [Ctrl] pressed to draw a stationary front in red and blue. 4. Draw polygons, closed curves, or cloud rims, which can be created as with spline drawings.](/docs-images/75/71732653/images/46-1.jpg "In these figures, colors and hatched patterns can be changed. 5. Draw ellipses, circles, or flex oval. Colors can be changed and hatched patterns can be used for filling. 6.")
46 Creating Drawings Delete all drawings. ([Clear] button) 2. Cancel the previous drawing operation. ([Undo] button) 1. Check Draw 2. Click Extra A: Change color and hatch pattern. B: Change symbol size. 3 A B 3. Draw lines and arrows (fronts, troughs, or ridges), which can be created as with spline drawings. *Click the [Sn-front] button with [Ctrl] pressed to draw a stationary front in red and blue. 4. Draw polygons, closed curves, or cloud rims, which can be created as with spline drawings. In these figures, colors and hatched patterns can be changed. 5. Draw ellipses, circles, or flex oval. Colors can be changed and hatched patterns can be used for filling. 6. Paste cloud form symbols or vortex center symbols. (Drag a symbol to the desired point. The symbol size can be changed and the symbol can be reversed from left to right by dropping it with [Ctrl] pressed.) 7. Paste character strings. (Drag [Char] to the desired point. The character size can be changed.) 8. Paste wind barbs (Drag [Char] to the desired point after inputting WIND ddd (direction in 360 deg.) and fff (velocity). The wind barb size can be changed.) Japan Meteorological Agency 46
47 Creating Drawings High-level cloud (Ci) 2 Middle-level cloud (Cm) 3 Cumulus (Cu) 4 Cumulus Congestus (Cg) 5 Cumulonimbus (Cb) 6 Stratus 7 Stratus or Fog 8 Low-level vortex 9 Upper-level vortex 10 Center of typhoon with eye 11 Center of typhoon without eye Waved cloud (Mountain wave) 13 Low-level vortex (Meso β-scale ) 14 (Cross mark) 15 Light turbulence 16 Moderate turbulence 17 Severe turbulence 18 (Tilde mark) 19 Light icing 20 Moderate icing 21 Severe icing Japan Meteorological Agency 47

48 Outputting Images Print image: Output the current image to a printer Print screen: Output the entire screen to a printer Page setup: Set the margins of the printing paper Output bitmap*: Output the current image as a bitmap file Output serial bitmaps*: Output images as bitmap files Output animation: Output images as a Gif or Avi animation (*BMP, JPG, PNG, TIF and other formats can be used.) Copy the current image to the clipboard Japan Meteorological Agency 48
![Saving New Settings 1. Select Option Check [Save on exit(o)] to save the current settings to the initial value file in the program directory before exiting the program.](/docs-images/75/71732653/images/49-0.jpg "The settings will be applied by default at the next startup.")
49 Saving New Settings 1. Select Option Check [Save on exit(o)] to save the current settings to the initial value file in the program directory before exiting the program. The settings will be applied by default at the next startup. Settings saved include: Animation speed Show/hide status of latitude/longitude lines Latitude/longitude line display intervals Show/hide status of coastlines Show/hide status of drawings Screen size Line colors Grayscale status set separately for image types 2. Check Save on exit Japan Meteorological Agency 49
SATAID Operation Manual Contents
 SATAID Operation Manual Contents 1. Introduction... 1 2. Overview... 2 3. Environment... 3 3.1 System requirements... 3 3.2 Files required for program execution... 3 3.3 Installing and uninstalling...
Hyper Borey User Guide
 METEO-GRAPHICS SYSTEMS IN C. Hyper Borey version 1.0 Meteo-Graphics Systems Inc. 5790 Rembrandt Avenue, suite 405. Montreal, Canada, H4B 2V2 T 514.262.5487 E info@meteograph.ca W www.meteograph.ca Table
How to display RGB imagery by SATAID
 How to display RGB imagery by SATAID Akihiro SHIMIZU Meteorological Satellite Center (MSC), Japan Meteorological Agency (JMA) Ver. 2015110500 RGB imagery on SATAID SATAID software has a function of overlapping
1. Open IDV. There is a desktop link, choose version 3.0u1 or 3.0u2. It can take a few minutes to open.
 Page 1 Objectives: Become familiar with using a software package (IDV) to view satellite images Understand the differences between Visible, IR, and Microwave Imagery Observe the influence of dry air and
Manual Seatrack Web Brofjorden
 December 2011 Manual Seatrack Web Brofjorden A user-friendly system for forecasts and backtracking of drift and spreading of oil, chemicals and substances in water 1. Introduction and Background... 3 1.1
MSGVIEW: AN OPERATIONAL AND TRAINING TOOL TO PROCESS, ANALYZE AND VISUALIZATION OF MSG SEVIRI DATA
 MSGVIEW: AN OPERATIONAL AND TRAINING TOOL TO PROCESS, ANALYZE AND VISUALIZATION OF MSG SEVIRI DATA Aydın Gürol Ertürk Turkish State Meteorological Service, Remote Sensing Division, CC 401, Kalaba Ankara,
TECDIS and TELchart ECS Weather Overlay Guide
 1 of 24 TECDIS and TELchart ECS provides a very advanced weather overlay feature, using top quality commercial maritime weather forecast data available as a subscription service from Jeppesen Marine. The
McIDAS-V Tutorial Displaying Point Observations from ADDE Datasets updated July 2016 (software version 1.6)
") McIDAS-V Tutorial Displaying Point Observations from ADDE Datasets updated July 2016 (software version 1.6) McIDAS-V is a free, open source, visualization and data analysis software package that is the
McIDAS-V Tutorial Displaying Point Observations from ADDE Datasets updated July 2016 (software version 1.6) McIDAS-V is a free, open source, visualization and data analysis software package that is the
DATA BROWSING AND ANALYSIS TOOL FOR MTSAT/LRIT. Ryoji Kumabe
 DATA BROWSING AND ANALYSIS TOOL FOR MTSAT/LRIT Ryoji Kumabe Meteorological Satellite Center / Japan Meteorological Agency 3-235 Nakakiyoto Kiyose Tokyo, Japan ABSTRACT The Multi-functional Transport Satellite
ISIS/Draw "Quick Start"
 ISIS/Draw "Quick Start" Click to print, or click Drawing Molecules * Basic Strategy 5.1 * Drawing Structures with Template tools and template pages 5.2 * Drawing bonds and chains 5.3 * Drawing atoms 5.4
 www.goldensoftware.com Why Create a Thematic Map? A thematic map visually represents the geographic distribution of data. MapViewer will help you to: understand demographics define sales or insurance territories
Tutorial. Getting started. Sample to Insight. March 31, 2016
 Getting started March 31, 2016 Sample to Insight CLC bio, a QIAGEN Company Silkeborgvej 2 Prismet 8000 Aarhus C Denmark Telephone: +45 70 22 32 44 www.clcbio.com support-clcbio@qiagen.com Getting started
ECNU WORKSHOP LAB ONE 2011/05/25)
") ECNU WORKSHOP LAB ONE (Liam.Gumley@ssec.wisc.edu 2011/05/25) The objective of this laboratory exercise is to become familiar with the characteristics of MODIS Level 1B 1000 meter resolution data. After
ECNU WORKSHOP LAB ONE (Liam.Gumley@ssec.wisc.edu 2011/05/25) The objective of this laboratory exercise is to become familiar with the characteristics of MODIS Level 1B 1000 meter resolution data. After
NMR Predictor. Introduction
 NMR Predictor This manual gives a walk-through on how to use the NMR Predictor: Introduction NMR Predictor QuickHelp NMR Predictor Overview Chemical features GUI features Usage Menu system File menu Edit
OCEAN/ESS 410 Lab 4. Earthquake location
 Lab 4. Earthquake location To complete this exercise you will need to (a) Complete the table on page 2. (b) Identify phases on the seismograms on pages 3-6 as requested on page 11. (c) Locate the earthquake
Himawari 8/9 data distribution/dissemination plan
 Himawari 8/9 data distribution/dissemination plan Japan Meteorological Agency (JMA) Hidehiko MURATA Himawari is the name of this flower in Japanese ET SUP 8, WMO HQ, Geneva, 14 17 April 2014 1 Outline
Studying Topography, Orographic Rainfall, and Ecosystems (STORE)
") Introduction Studying Topography, Orographic Rainfall, and Ecosystems (STORE) Lesson: Using ArcGIS Explorer to Analyze the Connection between Topography, Tectonics, and Rainfall GIS-intensive Lesson This
Introduction Studying Topography, Orographic Rainfall, and Ecosystems (STORE) Lesson: Using ArcGIS Explorer to Analyze the Connection between Topography, Tectonics, and Rainfall GIS-intensive Lesson This
Assignment #0 Using Stellarium
 Name: Class: Date: Assignment #0 Using Stellarium The purpose of this exercise is to familiarize yourself with the Stellarium program and its many capabilities and features. Stellarium is a visually beautiful
Remote Sensing Seminar 8 June 2007 Benevento, Italy. Lab 5 SEVIRI and MODIS Clouds and Fires
 Remote Sensing Seminar 8 June 2007 Benevento, Italy Lab 5 SEVIRI and MODIS Clouds and Fires Table: SEVIRI Channel Number, Wavelength (µm), and Primary Application Reflective Bands 1,2 0.635, 0.81 land/cld
Map My Property User Guide
 Map My Property User Guide Map My Property Table of Contents About Map My Property... 2 Accessing Map My Property... 2 Links... 3 Navigating the Map... 3 Navigating to a Specific Location... 3 Zooming
Benefits of the new-generation Himawari-8 geostationary satellite for the Asia-Pacific region. Toshihiko HASHIDA Japan Meteorological Agency (JMA)
") Benefits of the new-generation Himawari-8 geostationary satellite for the Asia-Pacific region Toshihiko HASHIDA Japan Meteorological Agency (JMA) Side Event Ensuring User Readiness to New-Generation Meteorological
Benefits of the new-generation Himawari-8 geostationary satellite for the Asia-Pacific region Toshihiko HASHIDA Japan Meteorological Agency (JMA) Side Event Ensuring User Readiness to New-Generation Meteorological
Best Pair II User Guide (V1.2)
") Best Pair II User Guide (V1.2) Paul Rodman (paul@ilanga.com) and Jim Burrows (burrjaw@earthlink.net) Introduction Best Pair II is a port of Jim Burrows' BestPair DOS program for Macintosh and Windows computers.
Best Pair II User Guide (V1.2) Paul Rodman (paul@ilanga.com) and Jim Burrows (burrjaw@earthlink.net) Introduction Best Pair II is a port of Jim Burrows' BestPair DOS program for Macintosh and Windows computers.
MOHO PRO 12 Step-by-step demonstration script
 MOHO PRO 12 Step-by-step demonstration script Short version MOHO AND THE NEW SURFACE Components used in the demo Moho Pro 12 The animation software used in the demo. Device The Surface computer/screen.
3D Molecule Viewer of MOGADOC (JavaScript)
") 3D Molecule Viewer of MOGADOC (JavaScript) Movement of the Molecule Rotation of the molecule: Use left mouse button to drag. Translation of the molecule: Use right mouse button to drag. Resize the molecule:
3D Molecule Viewer of MOGADOC (JavaScript) Movement of the Molecule Rotation of the molecule: Use left mouse button to drag. Translation of the molecule: Use right mouse button to drag. Resize the molecule:
Create Satellite Image, Draw Maps
 Create Satellite Image, Draw Maps 1. The goal Using Google Earth, we want to create and import a background file into our Adviser program. From there, we will be creating paddock boundaries. The accuracy
Quick Start Guide New Mountain Visit our Website to Register Your Copy (weatherview32.com)
") Quick Start Guide New Mountain Visit our Website to Register Your Copy (weatherview32.com) Page 1 For the best results follow all of the instructions on the following pages to quickly access real-time
Quick Start Guide New Mountain Visit our Website to Register Your Copy (weatherview32.com) Page 1 For the best results follow all of the instructions on the following pages to quickly access real-time
M E R C E R W I N WA L K T H R O U G H
 H E A L T H W E A L T H C A R E E R WA L K T H R O U G H C L I E N T S O L U T I O N S T E A M T A B L E O F C O N T E N T 1. Login to the Tool 2 2. Published reports... 7 3. Select Results Criteria...
Astronomy 101 Lab: Stellarium Tutorial
 Name: Astronomy 101 Lab: Stellarium Tutorial Please install the Stellarium software on your computer using the instructions in the procedure. If you own a laptop, please bring it to class. You will submit
Catchment Delineation Workflow
 Catchment Delineation Workflow Slide 1 Given is a GPS point (Lat./Long.) for an outlet location. The outlet could be a proposed Dam site, a storm water drainage culvert on a rural highway, or any other
Preparation for Himawari 8
 Preparation for Himawari 8 Japan Meteorological Agency Meteorological Satellite Center Hidehiko MURATA ET SUP 8, WMO HQ, Geneva, 14 17 April 2014 1/18 Introduction Background The Japan Meteorological Agency
The Realist Map contains several views that let you see different aspects about the properties you ve selected on the Map:
 Realist Map Views The Realist Map contains several views that let you see different aspects about the properties you ve selected on the Map: Road: The Road view is a standard Map view showing the roads
Ash RGB Detection of Volcanic Ash
 Copyright, JMA RGB Detection of Volcanic Meteorological Satellite Center, JMA Ver. 20150424 Volcanic Detection by Infrared and Difference Image, and Basis Himawari-8 B15-B13 2015-02-16 06:35 UTC Himawari-8
MERGING (MERGE / MOSAIC) GEOSPATIAL DATA
 GEOSPATIAL DATA") This help guide describes how to merge two or more feature classes (vector) or rasters into one single feature class or raster dataset. The Merge Tool The Merge Tool combines input features from input
This help guide describes how to merge two or more feature classes (vector) or rasters into one single feature class or raster dataset. The Merge Tool The Merge Tool combines input features from input
Learning ArcGIS: Introduction to ArcCatalog 10.1
 Learning ArcGIS: Introduction to ArcCatalog 10.1 Estimated Time: 1 Hour Information systems help us to manage what we know by making it easier to organize, access, manipulate, and apply knowledge to the
: : User Manual: : - 10 December
 : : User Manual: : - 0 December 06 - : : User Manual: : Table of Contents. Map Control. How to move a map. How to zoom in and out a map 4. How to inquire Ocean Currents. How to inquire predicted current
Contour Line Overlays in Google Earth
 Overview: Students download a section of a topographic map of their community from the ATEP website. This file will overlay the Google Earth satellite imagery. Students use the path tool to trace a contour
SuperCELL Data Programmer and ACTiSys IR Programmer User s Guide
 SuperCELL Data Programmer and ACTiSys IR Programmer User s Guide This page is intentionally left blank. SuperCELL Data Programmer and ACTiSys IR Programmer User s Guide The ACTiSys IR Programmer and SuperCELL
EXPERIMENT 7: ANGULAR KINEMATICS AND TORQUE (V_3)
") TA name Lab section Date TA Initials (on completion) Name UW Student ID # Lab Partner(s) EXPERIMENT 7: ANGULAR KINEMATICS AND TORQUE (V_3) 121 Textbook Reference: Knight, Chapter 13.1-3, 6. SYNOPSIS In
TA name Lab section Date TA Initials (on completion) Name UW Student ID # Lab Partner(s) EXPERIMENT 7: ANGULAR KINEMATICS AND TORQUE (V_3) 121 Textbook Reference: Knight, Chapter 13.1-3, 6. SYNOPSIS In
v Prerequisite Tutorials GSSHA WMS Basics Watershed Delineation using DEMs and 2D Grid Generation Time minutes
 v. 10.1 WMS 10.1 Tutorial GSSHA WMS Basics Creating Feature Objects and Mapping Attributes to the 2D Grid Populate hydrologic parameters in a GSSHA model using land use and soil data Objectives This tutorial
Bloomsburg University Weather Viewer Quick Start Guide. Software Version 1.2 Date 4/7/2014
 Bloomsburg University Weather Viewer Quick Start Guide Software Version 1.2 Date 4/7/2014 Program Background / Objectives: The Bloomsburg Weather Viewer is a weather visualization program that is designed
Overlaying GRIB data over NOAA APT weather satellite images using OpenCPN
 Overlaying GRIB data over NOAA APT weather satellite images using OpenCPN I receive NOAA weather satellite images which are quite useful when used alone but with GRIB wind and rain data overlaid they can
PanosFX CALENDAR User guide. PanosFX CALENDAR. For Adobe Photoshop CC, CS6, CS5, CS4, CS3. PSD templates & language switcher actions.
 PanosFX CALENDAR For Adobe Photoshop CC, CS6, CS5, CS4, CS3 PSD templates & language switcher actions User Guide CONTENTS 1. THE BASICS... 1 1.1. Description... 1 1.2. How the files are organized... 2
The CSC Interface to Sky in Google Earth
 The CSC Interface to Sky in Google Earth CSC Threads The CSC Interface to Sky in Google Earth 1 Table of Contents The CSC Interface to Sky in Google Earth - CSC Introduction How to access CSC data with
Application System for TC Analysis and its Usage. JeongHyun Park May. 13, 2009 National Typhoon Center/KMA
 Application System for TC Analysis and its Usage JeongHyun Park May. 3, 009 National Typhoon Center/KMA Outline KMA s Application System for TC Analysis The Operational Process to issue TC information
Inter-comparison MTSAT-2 & Himawari-8
 Inter-comparison MTSAT-2 & Himawari-8 WMO Volcanic Ash Advisory Centre Best Practice Workshop 2017 Tokyo Volcanic Ash Advisory Centre Japan Meteorological Agency Outline Introduction Method Case study
Forecast.io Driver. Installation and Usage Guide. Revision: 1.0 Date: Tuesday, May 20, 2014 Authors: Alan Chow
 Forecast.io Driver Installation and Usage Guide Revision: 1.0 Date: Tuesday, May 20, 2014 Authors: Alan Chow Contents Overview... 2 Features... 3 Usage Scenarios... 4 Change Log... 4 Disclaimer... 4 Driver
Introduction to the College of DuPage NEXLAB Website
 Introduction to the College of DuPage NEXLAB Website The purpose of this lab is to familiarize yourself with our website so that you will have an easier time following along in class and will be able to
Designing a Quilt with GIMP 2011
 Planning your quilt and want to see what it will look like in the fabric you just got from your LQS? You don t need to purchase a super expensive program. Try this and the best part it s FREE!!! *** Please
Your Source for Global Aviation Forecasts
 Your Source for Global Aviation Forecasts (831) 238-5054 100 Sky Park Drive Monterey, CA 93940 Weather4Cast.com Live Weather Data Feeds Weather4Cast.com provides Live Aviation Weather Data Feeds formatted
AOMSUC-6 Training Event
 Effective use of high temporal and spatial resolution Himawari-8 data AOMSUC-6 Training Event Bodo Zeschke Australian Bureau of Meteorology Training Centre Australian VLab Centre of Excellence Content
WindNinja Tutorial 3: Point Initialization
 WindNinja Tutorial 3: Point Initialization 6/27/2018 Introduction Welcome to WindNinja Tutorial 3: Point Initialization. This tutorial will step you through the process of downloading weather station data
To display grib files as an overlay on your normal charts you have to first activate the grib icon
 2019/03/09 20:43 1/22 OpenCPN has a grib weather file viewer plugin, aimed at being useful while under way. The grib plugin is an Internal Plugin, always distributed with OpenCPN, no separate download is
Day Microphysics RGB Nephanalysis in daytime. Meteorological Satellite Center, JMA
 Day Microphysics RGB Nephanalysis in daytime Meteorological Satellite Center, JMA What s Day Microphysics RGB? R : B04 (N1 0.86) Range : 0~100 [%] Gamma : 1.0 G : B07(I4 3.9) (Solar component) Range :
Advanced Test Equipment Rentals ATEC (2832) Agilent 86130A BitAlyzer Error Analysis Getting Started
 Agilent 86130A BitAlyzer Error Analysis Getting Started") Established 1981 Advanced Test Equipment Rentals www.atecorp.com 800-404-ATEC (2832) Agilent 86130A BitAlyzer Error Analysis Getting Started Copyright Agilent Technologies 2001 All Rights Reserved. Reproduction,
Established 1981 Advanced Test Equipment Rentals www.atecorp.com 800-404-ATEC (2832) Agilent 86130A BitAlyzer Error Analysis Getting Started Copyright Agilent Technologies 2001 All Rights Reserved. Reproduction,
SeeSAR 7.1 Beginners Guide. June 2017
 SeeSAR 7.1 Beginners Guide June 2017 Part 1: Basics 1 Type a pdb code and press return or Load your own protein or already existing project, or Just load molecules To begin, let s type 2zff and download
Electric Fields and Equipotentials
 OBJECTIVE Electric Fields and Equipotentials To study and describe the two-dimensional electric field. To map the location of the equipotential surfaces around charged electrodes. To study the relationship
Avida-ED Quick Start User Manual
 Avida-ED Quick Start User Manual I. General Avida-ED Workspace Viewer chooser Lab Bench Freezer (A) Viewer chooser buttons Switch between lab bench views (B) Lab bench Three lab bench options: 1. Population
COMPLETE FEATURE COMPARISON LIST
 COMPLETE FEATURE COMPARISON LIST General Moho Debut Moho Pro Advanced Bone Rigging Ultimate Bone Rigging Smart Bones Read Only Frame-By-Frame Animation Read Only Bezier Handles optimized for animation
Performing Map Cartography. using Esri Production Mapping
 AGENDA Performing Map Cartography Presentation Title using Esri Production Mapping Name of Speaker Company Name Kannan Jayaraman Agenda Introduction What s New in ArcGIS 10.1 ESRI Production Mapping Mapping
Child Opportunity Index Mapping
 Child Opportunity Index Mapping A partnership project of How to Use and Interpret the Child Opportunity Index Maps How to Use the Child Opportunity Index Maps Getting Started: How to Find and Open a Child
Synteny Portal Documentation
 Synteny Portal Documentation Synteny Portal is a web application portal for visualizing, browsing, searching and building synteny blocks. Synteny Portal provides four main web applications: SynCircos,
HSC Chemistry 7.0 User's Guide
 HSC Chemistry 7.0 47-1 HSC Chemistry 7.0 User's Guide Sim Flowsheet Module Experimental Mode Pertti Lamberg Outotec Research Oy Information Service P.O. Box 69 FIN - 28101 PORI, FINLAND Fax: +358-20 -
ESCI 121 Physical Geology
 Observing Streams & Rivers in Google Earth Dr. Jennifer L. Piatek Dept. of Physics and Earth Sciences Central Connecticut State University 506 Copernicus Hall 1615 Stanley Street New Britain, CT 06050
How to Make or Plot a Graph or Chart in Excel
 This is a complete video tutorial on How to Make or Plot a Graph or Chart in Excel. To make complex chart like Gantt Chart, you have know the basic principles of making a chart. Though I have used Excel
ROAD WEATHER INFORMATION SYSTEM DEVICE TESTING LEVEL C
 Page 1 of 11 Date: Jan. 05, 2009 This procedure outlines Level C device test to be performed on Road Weather Information System. Level C device testing demonstrates that each device is fully operational
Exercises for Windows
 Exercises for Windows CAChe User Interface for Windows Select tool Application window Document window (workspace) Style bar Tool palette Select entire molecule Select Similar Group Select Atom tool Rotate
Skin Damage Visualizer TiVi60 User Manual
 Skin Damage Visualizer TiVi60 User Manual PIONEERS IN TISSUE VIABILITY IMAGING User Manual 3.2 Version 3.2 October 2013 Dear Valued Customer! TiVi60 Skin Damage Visualizer Welcome to the WheelsBridge Skin
Lesser Sunda - Banda Seascape Atlas
 Lesser Sunda - Banda Seascape Atlas Report prepared for the development of online interactive map for Lesser Sunda Banda Seascape by WorldFish December 2014 http://sbsatlas.reefbase.org Page 1 of 8 Table
Task 1: Start ArcMap and add the county boundary data from your downloaded dataset to the data frame.
 Exercise 6 Coordinate Systems and Map Projections The following steps describe the general process that you will follow to complete the exercise. Specific steps will be provided later in the step-by-step
Weather App v3. Tuesday 5th April 2011
 Weather App v3 Tuesday 5th April 2011 A video demo animation of the app working can be found here: http://urbanspaceman.net/tivo/weatherref.htm Video demo:http://urbanspaceman.net/tivo/weatherref.htm Fig.1
Java TopTask. Version February Introduction 2. 2 Web Start and Configuration 3
 Java TopTask Version 2.60 February 2016 Chapter Page 1 Introduction 2 2 Web Start and Configuration 3 2.1 Java Web Start...3 2.2 Maiden launch...3 2.3 Standard configuration...4 2.4 Opening a forecast...4
Name Date Class. Figure 1. The Google Earth Pro drop-down menu.
 GIS Student Walk-Through Worksheet Procedure 1. Import historical tornado and hurricane data into Google Earth Pro by following these steps: A. In the Google Earth Pro drop-down menu > click File > Import
Lesson Plan 2 - Middle and High School Land Use and Land Cover Introduction. Understanding Land Use and Land Cover using Google Earth
 Understanding Land Use and Land Cover using Google Earth Image an image is a representation of reality. It can be a sketch, a painting, a photograph, or some other graphic representation such as satellite
(THIS IS AN OPTIONAL BUT WORTHWHILE EXERCISE)
") PART 2: Analysis in ArcGIS (THIS IS AN OPTIONAL BUT WORTHWHILE EXERCISE) Step 1: Start ArcCatalog and open a geodatabase If you have a shortcut icon for ArcCatalog on your desktop, double-click it to start
PART 2: Analysis in ArcGIS (THIS IS AN OPTIONAL BUT WORTHWHILE EXERCISE) Step 1: Start ArcCatalog and open a geodatabase If you have a shortcut icon for ArcCatalog on your desktop, double-click it to start
How to Create Stream Networks using DEM and TauDEM
 How to Create Stream Networks using DEM and TauDEM Take note: These procedures do not describe all steps. Knowledge of ArcGIS, DEMs, and TauDEM is required. TauDEM software ( http://hydrology.neng.usu.edu/taudem/
Introduction. Name: Basic Features of Sunspots. The Solar Rotational Period. Sunspot Numbers
 PHYS-1050 Tracking Sunspots Spring 2013 Name: 1 Introduction Sunspots are regions on the solar surface that appear dark because they are cooler than the surrounding photosphere, typically by about 1500
ST-Links. SpatialKit. Version 3.0.x. For ArcMap. ArcMap Extension for Directly Connecting to Spatial Databases. ST-Links Corporation.
 ST-Links SpatialKit For ArcMap Version 3.0.x ArcMap Extension for Directly Connecting to Spatial Databases ST-Links Corporation www.st-links.com 2012 Contents Introduction... 3 Installation... 3 Database
In order to save time, the following data files have already been preloaded to the computer (most likely under c:\odmc2012\data\)
") ODMC2012 QGIS Ex1 Schools and Public Transport In this exercise, users will learn how to a) map the location of secondary schools in and around the Southampton area; b) overlay the school location map
ODMC2012 QGIS Ex1 Schools and Public Transport In this exercise, users will learn how to a) map the location of secondary schools in and around the Southampton area; b) overlay the school location map
WORKING WITH DMTI DIGITAL ELEVATION MODELS (DEM)
") WORKING WITH DMTI DIGITAL ELEVATION MODELS (DEM) Contents (Ctrl-Click to jump to a specific page) Manipulating the DEM Step 1: Finding the DEM Tiles You Need... 2 Step 2: Importing the DEM Tiles into ArcMap...
WORKING WITH DMTI DIGITAL ELEVATION MODELS (DEM) Contents (Ctrl-Click to jump to a specific page) Manipulating the DEM Step 1: Finding the DEM Tiles You Need... 2 Step 2: Importing the DEM Tiles into ArcMap...
Moving into the information age: From records to Google Earth
 Moving into the information age: From records to Google Earth David R. R. Smith Psychology, School of Life Sciences, University of Hull e-mail: davidsmith.butterflies@gmail.com Introduction Many of us
Satellite-based Convection Nowcasting and Aviation Turbulence Applications
 Satellite-based Convection Nowcasting and Aviation Turbulence Applications Kristopher Bedka Cooperative Institute for Meteorological Satellite Studies (CIMSS), University of Wisconsin-Madison In collaboration
2.4. Model Outputs Result Chart Growth Weather Water Yield trend Results Single year Results Individual run Across-run summary
 2.4. Model Outputs Once a simulation run has completed, a beep will sound and the Result page will show subsequently. Other output pages, including Chart, Growth, Weather, Water, and Yield trend, can be
v WMS Tutorials GIS Module Importing, displaying, and converting shapefiles Required Components Time minutes
 v. 11.0 WMS 11.0 Tutorial Importing, displaying, and converting shapefiles Objectives This tutorial demonstrates how to import GIS data, visualize it, and convert it into WMS coverage data that could be
User Manuel. EurotaxForecast. Version Latest changes ( )
") User Manuel EurotaxForecast Version 1.23.0771- Latest changes (19.07.2003) Contents Preface 5 Welcome to Eurotax Forecast...5 Using this manual 6 How to use this manual?...6 Program overview 7 General
User Manuel EurotaxForecast Version 1.23.0771- Latest changes (19.07.2003) Contents Preface 5 Welcome to Eurotax Forecast...5 Using this manual 6 How to use this manual?...6 Program overview 7 General
StreamerRT User Guide Version 5.1
 StreamerRT User Guide Version 5.1 Earth Networks WeatherBug Corporate Headquarters 12410 Milestone Center Drive, Suite 300 Germantown, MD 20876 Phone: 800.544.4429 Website: www.earthnetworks.com Technical
II. Performance Task Using the data set, you will be looking at images from four different years and studying the terminus of the glacier.
 Page 1 of 9 I. The Relevant Issue The United States Geological Survey (USGS) has identified the Bering Glacier, located in southeast Alaska, for long term ecological monitoring as an indicator of climate
Quick Reference Manual. Ver. 1.3
 Quick Reference Manual Ver. 1.3 1 EXASITE Voyage EXSITE Voyage is a web-based communication tool designed to support the following users; Ship operators who utilize Optimum Ship Routing (OSR) service in
1. Double-click the ArcMap icon on your computer s desktop. 2. When the ArcMap start-up dialog box appears, click An existing map and click OK.
 Module 2, Lesson 1 The earth moves In this activity, you will observe worldwide patterns of seismic activity (earthquakes) and volcanic activity (volcanoes). You will analyze the relationships of those
Application Note. U. Heat of Formation of Ethyl Alcohol and Dimethyl Ether. Introduction
 Application Note U. Introduction The molecular builder (Molecular Builder) is part of the MEDEA standard suite of building tools. This tutorial provides an overview of the Molecular Builder s basic functionality.
Lightcloud Application
 Controlling Your Lightcloud System Lightcloud Application Lightcloud Application Navigating the Application Devices Device Settings Organize Control Energy Scenes Schedules Demand Response Power Up State
PART 1: Workspace Layout
 PART 1: Workspace Layout 1 - Program Header Tools to manage program setup, update forecast data, print, create a Storm Summary PDF document, and capture animated (GIF) graphics. The header also includes
Theory, Concepts and Terminology
 GIS Workshop: Theory, Concepts and Terminology 1 Theory, Concepts and Terminology Suggestion: Have Maptitude with a map open on computer so that we can refer to it for specific menu and interface items.
2. SeisVolE basic navigation and data
 2. SeisVolE basic navigation Page 1 of 6 2. SeisVolE basic navigation and data File Control Earthquakes Eruptions Map Options Help Exit Lawrence W. Braile, Professor Department of Earth and Atmospheric
WMS 10.1 Tutorial GSSHA Applications Precipitation Methods in GSSHA Learn how to use different precipitation sources in GSSHA models
 v. 10.1 WMS 10.1 Tutorial GSSHA Applications Precipitation Methods in GSSHA Learn how to use different precipitation sources in GSSHA models Objectives Learn how to use several precipitation sources and
MOHID Land Basics Walkthrough Walkthrough for MOHID Land Basic Samples using MOHID Studio
 ACTION MODULERS MOHID Land Basics Walkthrough Walkthrough for MOHID Land Basic Samples using MOHID Studio Frank Braunschweig Luis Fernandes Filipe Lourenço October 2011 This document is the MOHID Land
WindNinja Tutorial 3: Point Initialization
 WindNinja Tutorial 3: Point Initialization 07/20/2017 Introduction Welcome to. This tutorial will step you through the process of running a WindNinja simulation that is initialized by location specific
Sample Alignment (2D detector) Part
 Part") Sample Alignment (2D detector) Part Contents Contents 1 How to set Part conditions...1 1.1 Setting conditions... 1 1.2 Customizing scan conditions and slit conditions... 6 2 Sample alignment sequence...13
Sample Alignment (2D detector) Part Contents Contents 1 How to set Part conditions...1 1.1 Setting conditions... 1 1.2 Customizing scan conditions and slit conditions... 6 2 Sample alignment sequence...13
WEATHER AND CLIMATE COMPLETING THE WEATHER OBSERVATION PROJECT CAMERON DOUGLAS CRAIG
 WEATHER AND CLIMATE COMPLETING THE WEATHER OBSERVATION PROJECT CAMERON DOUGLAS CRAIG Introduction The Weather Observation Project is an important component of this course that gets you to look at real
CTTH Cloud Top Temperature and Height
 CTTH Cloud Top Temperature and Height 15 th June 2004 Madrid Hervé Le Gléau and Marcel Derrien Météo-France / CMS lannion 1 Plan of CTTH presentation Algorithms short description Some examples Planned
Uta Bilow, Carsten Bittrich, Constanze Hasterok, Konrad Jende, Michael Kobel, Christian Rudolph, Felix Socher, Julia Woithe
 ATLAS W path Instructions for tutors Version from 2 February 2018 Uta Bilow, Carsten Bittrich, Constanze Hasterok, Konrad Jende, Michael Kobel, Christian Rudolph, Felix Socher, Julia Woithe Technische