How to display RGB imagery by SATAID
|
|
|
- Eugene McDowell
- 5 years ago
- Views:
Transcription
1 How to display RGB imagery by SATAID Akihiro SHIMIZU Meteorological Satellite Center (MSC), Japan Meteorological Agency (JMA) Ver

2 RGB imagery on SATAID SATAID software has a function of overlapping colored satellite images. The function including RGB imagery has enhanced in latest version. Note that difference images for composite and appropriate configuration settings are required to display RGB imagery on SATAID.


3 Initial Configuration 1 Make sure of the check mark at Save value of option. 2 Hold down Ctrl key and select Register setup.


4 Initial Configuration Make sure of the check mark at Diff. If no check mark, the difference images don t create by SATAID. Settings of difference images(s1 ~ S8) Settings of upper and lower ranges (kelvin or albedo) Settings of loading images Settings of upper and lower ranges Images of respective bands are identified by two-character short-name.(ir, N1, W2 etc.) After doing above settings, close SATAID once.
5 Reference: Abbreviations on Short name SATAID( for Himawari-8) Long name Band number Wave length Band01 V1 VIS1 B μm First visible Band02 V2 VIS2 B μm Second visible Band03 VS VIS3 B μm Third and traditional visible Band04 N1 NIR1 B μm First near infrared Band05 N2 NIR2 B μm Second near infrared Band06 N3 NIR3 B μm Third near infrared Band07 I4 SWIR B μm Short wave IR Band08 WV WV1 B μm First and traditional water vapor Band09 W2 WV2 B μm Second water vapor Band10 W3 WV3 B μm Third water vapor Band11 MI MWIR B μm Medium wave IR Band12 O3 O3 B μm Ozone Band13 IR LWIR1 B μm First long wave IR or traditional IR Band14 L2 LWIR2 B μm Second long wave IR Band15 I2 LWIR3 B μm Third long wave IR or traditional second IR Band16 CO CO2 B μm CO2


6 Throw the data into SATAID! Throw all data!
7 How to display RGB (Airmass) Airmass RGB recipe by EUMETSAT R : WV(6.2) W3(7.3) ~ 0.0 [K] Gamma = 1.0 G : O3(9.6) IR(10.8 ) ~ 5.0 [K] Gamma= 1.0 B : WV(6.2) 243 ~ 208 [K] Gamma = 1.0 Let s try to make Airmass RGB on SATAID!
8 How to display RGB (Airmass) Set up the difference images by Register setup. (In this example, S4 and S6 are assigned to WV-W3 and O3-IR respectively.) S4 : WV-W3 (B08 B10) Upper : 0.0 Lower : S6 : O3-IR (B12 B13) Upper : 5.0 Lower : -40.0
 High: 243.00K (-30.15 ) 2 Select Gray 3 Hold down Ctrl key and press Initial.")
9 How to display RGB (Airmass) 1 Select WV(Band08) 4 Set up as below then press OK. Low: K ( ) High: K ( ) 2 Select Gray 3 Hold down Ctrl key and press Initial.

10 How to display RGB (Airmass) 1 Select S4 4 Set up as below then press OK. Low: K High: 0.00K 2 Select Gray and check Revs 3 Hold down Ctrl key and press Initial.

11 How to display RGB (Airmass) 1 Select S6 4 Set up as below then press OK. Low: K High: 5.00K 2 Select Gray and check Revs 3 Hold down Ctrl key and press Initial.

12 How to display RGBs 4 Set image names for compositing and gamma values, then press OK. 1 Select Gray. 2 Press Color. 3 Hold down Ctrl key and select Mix.

13 How to display RGB (Airmass) Overlap images S4 as red, S6 as green and WV as blue All gamma values: 1.0
14 How to display RGB (Airmass) Airmass image by SATAID! Are you OK?
15 Reference: Interpretation of Colors for Airmass Thick, high-level clouds Thick, mid-level clouds Thick, low-level clouds (low latitude) Thick, low-level clouds (high latitude) JET Cold Airmass Warm Airmass (High humidity at upper tropopause) Warm Airmass (low humidity at upper tropopause) Note: Based on SEVIRI/EUMETSAT interpretation
 Warm")
16 Example of interpretation For details, MSC/JMA VLab support site: Himawari RGB Training Library Cold Airmass Jet Thick, low-level clouds Thick, high-level clouds Warm Airmass Thick, high-level clouds JET Thick, mid-level clouds Cold Airmass Thick, low-level clouds (low latitude) Warm Airmass (High humidity at upper tropopause) Thick, low-level clouds (high latitude) Warm Airmass (low humidity at upper tropopause)
17 How to display RGB (Dust) Dust RGB recipe by EUMETSAT R : I2(12.0) IR(10.8) -4.0 ~ 2.0 [K] Gamma = 1.0 G : IR(10.8) MI(8.6) 0.0 ~ 15.0 [K] Gamma= 2.5 B : IR(10.8) 261 ~ 289 [K] Gamma = 1.0 Let s try to make Dust RGB on SATAID!
18 How to display RGB (Dust) Set up the difference images by Register setup. (In this example, S1 and S5 are assigned to IR-I2 and IR-MI respectively.) S1 : IR-I2(B15 B13) Upper : 2.0 Lower : -4.0 S5 : IR-MI (B13 B11) Upper : 15.0 Lower : 0.0
 High: 289.00K (15.")
19 How to display RGB (Dust) 1 Select IR (Band13) L2 (Band14) is also OK 2 Select Gray and check Revs 4Set up as below then press OK. Low: K ( ) High: K (15.85 ) 3 Hold down Ctrl key and press Initial.

20 How to display RGB (Dust) 1 Select S1 2 Select Gray 4Set up as below then press OK. Low: -2.00K High: 4.00K 3 Hold down Ctrl key and press Initial.

21 How to display RGB (Dust) 1 Select S5 2 Select Gray and check Revs 4Set up as below then press OK. Low: 0.00K High: 15.00K 3 Hold down Ctrl key and select Initial.

22 How to display RGB (Dust) Overlap images S1 as red, S5 as green and IR as blue Gamma values for red and blue: 1.0, green:2.5


23 Display example : Airmass + NWP


24 Display example : Natural colors + SYNOP


25 Display example : Day convective storms + drawing


26 Reference: How to create animated GIF by SATAID Sample gif anime >> Select Option Bitmap Output animated GIF, then save the gif format file. Note that the video quality is not high.
27 Thank you!
28 RGB color interpretations Night Microphysics Natural Colors Cold, thick, high-level cloud Very cold (< -50 C), thick, high-level cloud Thin Cirrus cloud High-level ice clouds Thick, mid-level cloud Thin, mid-level cloud Low-level cloud (high latitudes) Low-level cloud (low latitudes) Low-level water clouds Ocean Land Ocean Vegetation Desert Snow Day Microphysics #1 Day Microphysics #2 Deep precipitating cloud (precip. not necessarily reaching the ground) - Bright, thick - Large ice particles - Cold cloud Deep precipitating cloud (Cb cloud with strong updrafts and severe weather)* - Bright, thick - Small ice particles - Cold cloud Thin Cirrus cloud (Large ice particles) Thin Cirrus cloud (Small ice particles) Supercooled, thick water cloud - Bright, thick - Large droplets Supercooled, thick water cloud - Bright, thick - Small droplets Supercooled thin water cloud - Large droplets Supercooled, thin water cloud - Small droplets *or thick, high-level lee cloudiness with small ice particles Thick water cloud (warm rain cloud) - Bright, thick - Large droplets Thick water cloud (no precipitation) - Bright, thick - Small droplets Thin water cloud - Large droplets Thin water cloud - Small droplets Ocean Vegetation Fires(Hot Spot)/Desert Snow Ocean Vegetation Fires(Hot Spot)/Desert Snow Day Snow-Fog Day Convective Storms (Day Convection) Deep precipitating cloud (precip. not necessarily reaching the ground) - Bright, thick - Large ice particles Deep precipitating cloud* - Bright, thick - Small ice particles *or thick, high-level lee cloudiness with small ice particles Deep precipitating cloud (precip. not necessarily reaching the ground) - High level Cloud - Large ice particles Deep precipitating cloud (Cb cloud with strong updrafts and severe weather)* - High level Cloud - Small ice particles Thin Cirrus cloud - Large ice particles Thin Cirrus cloud - Small ice particles *or thick, high-level lee cloudiness with small ice particles Thick water cloud - Large droplets Thick water cloud - Small droplets Ocean Vegetation Desert Snow Ocean Land Dust Airmass Cold, thick, high-level clouds Thin Cirrus clouds Contrails Thick, high-level clouds Thick, mid-level clouds Thick, mid-level cloud Thin, mid-level cloud Low-level cloud (cold atmosphere, High latitude) Low-level cloud (warm atmosphere, Low latitude) Dust/Yellow sand Thick, low-level clouds (low latitude) Thick, low-level clouds (high latitude) Ocean Warm Desert Cold Desert Warm Land Cold Land JET Cold Airmass Warm Airmass (High humidity at upper tropopause) Warm Airmass (low humidity at upper tropopause)
29 RGB recipes (EUMETSAT recipes) Night Microphysics Natural Colors R : IR12.0 IR10.8 (default S1 on SATAID) Range : -4~2 [K] Gamma : 1.0 G : IR10.8 IR3.9 (default S2 on SATAID) Range : 0~10[K] Gamma : 1.0 B : IR10.8 (reverse on SATAID) Range : 243~293[K] Gamma : 1.0 R : NIR1.6 Range : 0~100 [%] Gamma : 1.0 G : VIS0.8 Range : 0~100 [%] Gamma : 1.0 B : VIS0.6 Range : 0~100 [%] Gamma : 1.0 Day Microphysics R : VIS0.8 Range : 0~100 [%] Gamma : 1.0 G : IR3.9 Solar reflectance component (reverse on SATAID) Range : 0~60[%] Gamma : 2.5 (summer) Range : 0~25[%] Gamma : 1.5 (winter) B : IR10.8 (reverse on SATAID) Range : 203~323[K] Gamma : 1.0 Day Snow-Fog Day Convective Storms (Day Convection) R : VIS0.8 Range : 0~100 [%] Gamma : 1.7 G : NIR1.6 Range : 0~70 [%] Gamma : 1.7 B : IR3.9 Solar reflectance component (reverse on SATAID) Range : 0~30 [%] Gamma : 1.7 R : WV6.2-WV7.3 Range : -35~5 [K] Gamma : 1.0 G : IR3.9-IR10.8 (reverse on SATAID) Range : -5~60 [K] Gamma : 0.5 B : NIR1.6-VIS0.6 (reverse on SATAID) Range : -75~25 [%] Gamma : 1.0 Dust Airmass R : IR12.0-IR10.8 (default S1 on SATAID) Range : -4~2 [K] Gamma : 1.0 G : IR10.8-IR8.7 (reverse on SATAID) Range : 0~15 [K] Gamma : 2.5 B : IR10.8 (reverse on SATAID) Range : 261~289 [K] Gamma : 1.0 R : WV6.2-WV7.3 (reverse on SATAID) Range : -25~0 [K] Gamma : 1.0 G : IR9.7-IR10.8 (reverse on SATAID) Range : -40~5 [K] Gamma : 1.0 B : WV6.2 Range : 243~208 [K] Gamma : 1.0
30 List of multi-spectral bands Channel Himawari-8/ -9 MTSAT-1R/-2 MSG Physical Properties μm/b01/v μm/b02/v μm/b03/vs 0.68 μm µm vegetation, aerosol B vegetation, aerosol G low cloud, fog R μm/b04/n µm vegetation, aerosol μm/b05/n µm cloud phase μm/b06/n3 particle size μm/b07/i4 3.7 μm 3.92 µm low cloud, fog, forest fire μm/b08/wv 6.8 μm 6.25 µm mid- and upper level moisture μm/b09/w1 mid- level moisture μm/b10/w µm mid- and upper level moisture μm/b11/mi 8.70 µm cloud phase, SO μm/b12/o µm ozone content μm/b13/ir 10.8 μm 10.8 µm μm/b14/l μm/b15/i μm 12.0 µm cloud imagery, information of cloud top cloud imagery, sea surface temperature cloud imagery, sea surface temperature μm/b16/co 13.4 µm cloud top height Visible Near Infrared Infrared Note: List of Himawari-8/ -9 indicates central wavelengths/ band number/ short name on SATAID
31 Guidance for trainee regarding RGB practical training Meteorological Satellite Center (MSC) Japan Meteorological Agency Author: Akihiro SHIMIZU Analysis Division, Data Processing Department Meteorological Satellite Center (MSC)/JMA Ver.1.00


32 Procedure of booting up of automatic SATAID loop Double click *.vbs or *.bat!


33 SATAID loop of case study will be started!
34 Case Study #1 Convective cloud around Southeast of Japan Meteorological Satellite Center (MSC) Japan Meteorological Agency Author: Akihiro SHIMIZU Analysis Division, Data Processing Department Meteorological Satellite Center (MSC)/JMA Ver.1.01


35 Case Study #1 Convective cloud around Southeast of Japan
36 Day Convective Storm RGB" around Southeast of Japan, 27th November2015
37 Day Convective Storms (Day Convection) R : WV6.2-WV7.3 Range : -35~5 [K] Gamma : 1.0 G : IR3.9-IR10.8 Range : -5~60 [K] Gamma : 0.5 B : NIR1.6-VIS0.6 Range : -75~25 [%] Gamma : 1.0 Applications distinction of convective clouds with severe phenomenon such as gust and tornado etc.
38 Fig1. Weather Chart #1 5

39 Fig2. Weather Chart #2 6

40 #1 Please point at the Cbs by drawing "Cb" mark on SATAID.
41 Fig1. Hint Interpretation of Colors for Day Convective Storms Deep precipitating cloud (precip. not necessarily reaching the ground) - High level Cloud - Large ice particles Deep precipitating cloud (Cb cloud with strong updrafts and severe weather)* - High level Cloud - Small ice particles Thin Cirrus cloud - Large ice particles Thin Cirrus cloud - Small ice particles *or thick, high-level lee cloudiness with small ice particles Ocean Land 8
42 #1 Answer


43 #2 Please compare with the result and other black and white "traditional" images such as IR and VS.
44 #3 Please overlap radar data on the images.
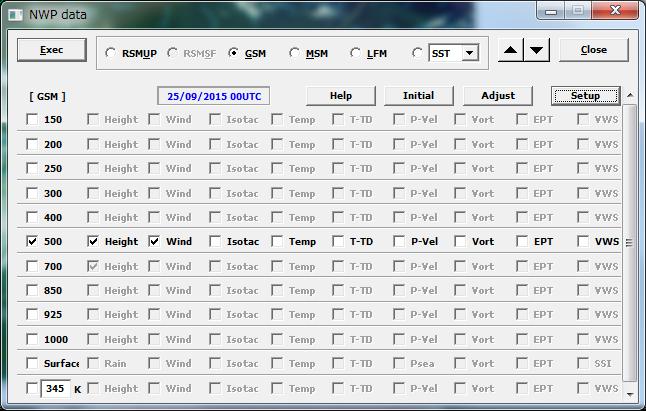
45 #4 Please check "NWP" button and select "GSM", press " black inverted triangle", and check "850" and "wind".


46 #5 Please select "IR" image and select "Measur" of "Function", and select "Brit" of "Measure". And please click any point on the image.
47 #6 Please indicate them by drawing on SATAID.

48 #6 Answer
49 Case Study #2 Fog around Borneo Island Meteorological Satellite Center (MSC) Japan Meteorological Agency Author: Akihiro SHIMIZU Analysis Division, Data Processing Department Meteorological Satellite Center (MSC)/JMA Ver.1.01
50 Case Study #2 Fog around Borneo Island
51 Night Microphysics RGB" around Borneo Island, 11th September2015
52 Fig1. Night Microphysics (for night-time cloud analysis) R : IR12.0 IR10.8 Range : -4~2 [K] Gamma : 1.0 G : IR10.8 IR3.9 Range : 0~10[K] Gamma : 1.0 B : IR10.8 Range : 243~293[K] Gamma : 1.0 Applications night-time cloud analysis Fog/low cloud distinction for night-time

53 Night Microphysics RGB with Synop
54 #1 Please specify WBGS/Sibu Airport and answer its visibility. #2 What color area does correspond to fog or low cloud area?


55 Answers #1 and #2
56 Fig1. Interpretation of Colors for Night Microphysics Cold, thick, high-level cloud Very cold (< -50 C), thick, high-level cloud Thin Cirrus cloud Thick, mid-level cloud Thin, mid-level cloud Low-level cloud (high latitudes) Low-level cloud (low latitudes) Ocean Land


57 #3 Please check "NWP", select "GSM" and press "setup".
 Japan")

58 Case Study #3 Volcanic ash of Mt. Raung Meteorological Satellite Center (MSC) Japan Meteorological Agency Author: Akihiro SHIMIZU Analysis Division, Data Processing Department Meteorological Satellite Center (MSC)/JMA Ver.1.01
59 Case Study #3 Volcanic ash of Mt. Raung
60 Volcanic ash of Mt. Raung by Dust RGB", 13th July 2015
61 Fig. Dust R : IR12.0-IR10.8 Range : -4~2 [K] Gamma : 1.0 G : IR10.8-IR8.7 Range : 0~15 [K] Gamma : 2.5 B : IR10.8 Range : 261~289 [K] Gamma : 1.0 Applications Dust/ Yellow sand Volcanic ash Cloud analysis
62 Fig. Interpretation of Colors for Dust Cold, thick, high-level clouds Thin Cirrus clouds Contrails Thick, mid-level cloud Thin, mid-level cloud Low-level cloud (cold atmosphere, High latitude) Low-level cloud (warm atmosphere, Low latitude) Dust/Yellow sand Ocean Warm Desert Cold Desert Warm Land Cold Land


63 Answers: #1 Please indicate volcanic ash by using Dust RGB image. #3 Please select "S2" Image (B07 - B13), and find hot spot corresponded to a crater of the volcano.


64 #2 Please compare with the result and other black and white "traditional" images such as IR and VS.
65 #4 Please uncheck "Mark", check "NWP" button and select "GSM". Then RGB image overlapping arrow feathers of NWP(GPV) data can be displayed. Blue arrows correspond to wind of upper layer (500 hpa), and red arrows correspond to wind of lower layer (850 hpa).


66 #5 Please compare with Ash RGB and True color RGB images. Ash RGB True Color RGB
67 Ash R : IR12.3-IR10.4 Range : -4~2 [K] Gamma : 1.0 G : IR10.8-IR8.7 Range : -4~5 [K] Gamma : 1.0 B : IR10.8 Range : 243~208 [K] Gamma : 1.0 Applications Dust/ Yellow sand Volcanic ash Cloud analysis
68 True Color RGB R : VIS0.64 (B03) Range : 0~100 [%] Gamma : 1.0 G : VIS0.51 (B02) Range : 0~100 [%] Gamma : 1.0 B : VIS0.46 (B01) Range : 0~100 [%] Gamma : 1.0 Applications Nephanalysis Dust Smoke(forest fire)
Day Microphysics RGB Nephanalysis in daytime. Meteorological Satellite Center, JMA
 Day Microphysics RGB Nephanalysis in daytime Meteorological Satellite Center, JMA What s Day Microphysics RGB? R : B04 (N1 0.86) Range : 0~100 [%] Gamma : 1.0 G : B07(I4 3.9) (Solar component) Range :
Day Snow-Fog RGB Detection of low-level clouds and snow/ice covered area
 JMA Day Snow-Fog RGB Detection of low-level clouds and snow/ice covered area Meteorological Satellite Center, JMA What s Day Snow-Fog RGB? R : B04 (N1 0.86) Range : 0~100 [%] Gamma : 1.7 G : B05 (N2 1.6)
Ash RGB Detection of Volcanic Ash
 Copyright, JMA RGB Detection of Volcanic Meteorological Satellite Center, JMA Ver. 20150424 Volcanic Detection by Infrared and Difference Image, and Basis Himawari-8 B15-B13 2015-02-16 06:35 UTC Himawari-8
Introduction of JMA VLab Support Site on RGB Composite Imagery and tentative RGBs
 The Sixth Asia/Oceania Meteorological Satellite Users' Conference 9 13 November 2015, Tokyo/Japan J M A Introduction of JMA VLab Support Site on RGB Composite Imagery and tentative RGBs Akihiro SHIMIZU
Himawari-8 True Color RGB
 Himawari-8 True Color RGB Meteorological Satellite Center, JMA Ver. 20150519 What s True Color RGB? R : B03(VS 0.64) G : B02(V2 0.51) 2015-03-17 00UTC B : B01(V1 0.46) Components of True Color RGB Channel
Applications of multi-spectral satellite data
 Applications of multi-spectral satellite data Jochen Kerkmann EUMETSAT, Satellite Meteorologist, Training Officer Adjusted by E de Coning South African Weather Service Content 1. Why should we use RGBs?
RGB Products: an easy and practical way to display multispectral satellite data (in combination with derived products)
") RGB Products: an easy and practical way to display multispectral satellite data (in combination with derived products) Dr. Jochen Kerkmann Training Officer EUMETSAT Multi-channel GEO satellites today Him-08
RGB Products: an easy and practical way to display multispectral satellite data (in combination with derived products) Dr. Jochen Kerkmann Training Officer EUMETSAT Multi-channel GEO satellites today Him-08
Applications of the SEVIRI window channels in the infrared.
 Applications of the SEVIRI window channels in the infrared jose.prieto@eumetsat.int SEVIRI CHANNELS Properties Channel Cloud Gases Application HRV 0.7 Absorption Scattering
Monitoring Sand and Dust Storms from Space
 Monitoring Sand and Dust Storms from Space for Expert Consultation on Disaster Information and Knowledge, Session 2 ICC 21 for ESCAP s RESAP and CDRR 5 9 12 October, 2017 Toshiyuki KURINO WMO Space Programme
Detection and Monitoring Convective Storms by. Using MSG SEVIRI Image. Aydın Gürol ERTÜRK. Contents
 Detection and Monitoring Convective Storms by 1 Using MSG SEVIRI Image Contents MSGView Software Cold U/V and Ring Shape Storm Tops Case Study, 2nd April 2011 Antalya, Türkiye Conclusion Aydın Gürol ERTÜRK
Overview of Himawari-8/9
 Overview of Himawari-8/9 Toshiyuki SAKURAI Meteorological Satellite Center (MSC) Japan Meteorological Agency (JMA) EUMeTrain Event Week on MTG-I Satellite 2016 Session2 - Himawari-8 and Data Applications
RGB Experts and Developers Workshop - Introduction Tokyo, Japan 7-9 Nov 2017
 RGB Experts and Developers Workshop - Introduction Tokyo, Japan 7-9 Nov 2017 Workshop Objectives Review of existing RGB standards Reconfirm and extend existing standards (new multi-spectral imagers) Stimulate
4.1 New Generation Satellite Data and Nowcasting Products: Himawari
 4.1 New Generation Satellite Data and Nowcasting Products: Himawari SCOPE-Nowcasting-EP 18-20 September 2017 Koji Yamashita kobo.yamashita@met.kishou.go.jp Meteorological Satellite Center (MSC) Japan Meteorological
MSGVIEW: AN OPERATIONAL AND TRAINING TOOL TO PROCESS, ANALYZE AND VISUALIZATION OF MSG SEVIRI DATA
 MSGVIEW: AN OPERATIONAL AND TRAINING TOOL TO PROCESS, ANALYZE AND VISUALIZATION OF MSG SEVIRI DATA Aydın Gürol Ertürk Turkish State Meteorological Service, Remote Sensing Division, CC 401, Kalaba Ankara,
" The usefulness of RGB products: the perspective of the Australian Bureau of Meteorology "
 " The usefulness of RGB products: the perspective of the Australian Bureau of Meteorology " Presenter: Bodo Zeschke. Bureau of Meteorology Training Centre, Australian VLab Centre of Excellence Point of
Preparation for Himawari 8
 Preparation for Himawari 8 Japan Meteorological Agency Meteorological Satellite Center Hidehiko MURATA ET SUP 8, WMO HQ, Geneva, 14 17 April 2014 1/18 Introduction Background The Japan Meteorological Agency
Fog detection product
 Fog detection product derived from RGB recipes Takumi Maruyama, Haruma Ishida and Koetsu Chubachi Meteorological Satellite Center / Japan Meteorological Agency Meteorological Research Institute / Japan
New capabilities with high resolution cloud micro-structure facilitated by MTG 2.3 um channel
 Slide 19 November 2016, V1.0 New capabilities with high resolution cloud micro-structure facilitated by MTG 2.3 um channel Author: Daniel Rosenfeld The Hebrew University of Jerusalem (HUJ) daniel.rosenfeld@huji.ac.il
ECNU WORKSHOP LAB ONE 2011/05/25)
") ECNU WORKSHOP LAB ONE (Liam.Gumley@ssec.wisc.edu 2011/05/25) The objective of this laboratory exercise is to become familiar with the characteristics of MODIS Level 1B 1000 meter resolution data. After
ECNU WORKSHOP LAB ONE (Liam.Gumley@ssec.wisc.edu 2011/05/25) The objective of this laboratory exercise is to become familiar with the characteristics of MODIS Level 1B 1000 meter resolution data. After
Lecture 19: Operational Remote Sensing in Visible, IR, and Microwave Channels
 MET 4994 Remote Sensing: Radar and Satellite Meteorology MET 5994 Remote Sensing in Meteorology Lecture 19: Operational Remote Sensing in Visible, IR, and Microwave Channels Before you use data from any
NOWCASTING PRODUCTS BASED ON MTSAT-1R RAPID SCAN OBSERVATION. In response to CGMS Action 38.33
 CGMS-39, JMA-WP-08 Prepared by JMA Agenda Item: G.II/8 Discussed in WG II NOWCASTING PRODUCTS BASED ON MTSAT-1R RAPID SCAN OBSERVATION In response to CGMS Action 38.33 This document reports on JMA s MTSAT-1R
Khalid Y. Muwembe UGANDA NATIONAL METEOROLOGICAL AUTHORITY (UNMA)
") Forecasting Severe Weather over Lake Victoria region in Uganda Khalid Y. Muwembe UGANDA NATIONAL METEOROLOGICAL AUTHORITY (UNMA) Outline Background Set-up of forecasting/alert service Diurnal circulation
Forecasting Severe Weather over Lake Victoria region in Uganda Khalid Y. Muwembe UGANDA NATIONAL METEOROLOGICAL AUTHORITY (UNMA) Outline Background Set-up of forecasting/alert service Diurnal circulation
Moisture, Clouds, and Precipitation: Clouds and Precipitation. Dr. Michael J Passow
 Moisture, Clouds, and Precipitation: Clouds and Precipitation Dr. Michael J Passow What Processes Lift Air? Clouds require three things: water vapor, a condensation nucleus, and cooling Cooling usually
Benefits of the new-generation Himawari-8 geostationary satellite for the Asia-Pacific region. Toshihiko HASHIDA Japan Meteorological Agency (JMA)
") Benefits of the new-generation Himawari-8 geostationary satellite for the Asia-Pacific region Toshihiko HASHIDA Japan Meteorological Agency (JMA) Side Event Ensuring User Readiness to New-Generation Meteorological
Benefits of the new-generation Himawari-8 geostationary satellite for the Asia-Pacific region Toshihiko HASHIDA Japan Meteorological Agency (JMA) Side Event Ensuring User Readiness to New-Generation Meteorological
Remote Sensing Seminar 8 June 2007 Benevento, Italy. Lab 5 SEVIRI and MODIS Clouds and Fires
 Remote Sensing Seminar 8 June 2007 Benevento, Italy Lab 5 SEVIRI and MODIS Clouds and Fires Table: SEVIRI Channel Number, Wavelength (µm), and Primary Application Reflective Bands 1,2 0.635, 0.81 land/cld
Meteorological Satellite Image Interpretations, Part III. Acknowledgement: Dr. S. Kidder at Colorado State Univ.
 Meteorological Satellite Image Interpretations, Part III Acknowledgement: Dr. S. Kidder at Colorado State Univ. Dates EAS417 Topics Jan 30 Introduction & Matlab tutorial Feb 1 Satellite orbits & navigation
1. Open IDV. There is a desktop link, choose version 3.0u1 or 3.0u2. It can take a few minutes to open.
 Page 1 Objectives: Become familiar with using a software package (IDV) to view satellite images Understand the differences between Visible, IR, and Microwave Imagery Observe the influence of dry air and
RGB in Broadcast Meteorology
 RGB in Broadcast Meteorology AHI Imagery for Weather Commentary on Clouds Yuki Takano Atmosphere and Ocean Research Institute The University of Tokyo collaborated with Shotaro Watanabe (Weather Map Co.
RGB Experts and Developers Workshop 2017 Tokyo, Japan
 "Application of the Sandwich Product and variations to this as used by Australian Forecasters and as presented during training at the Australian VLab Centre of Excellence". RGB Experts and Developers Workshop
Himawari-8 RGB product use and development amongst Australian / RAV / RAII stakeholders: the Australian VLab Centre of Excellence perspective
 Himawari-8 RGB product use and development amongst Australian / RAV / RAII stakeholders: the Australian VLab Centre of Excellence perspective EUMeTrain Event Week on MTG-I satellite 7-11 November 2016
Inter-comparison MTSAT-2 & Himawari-8
 Inter-comparison MTSAT-2 & Himawari-8 WMO Volcanic Ash Advisory Centre Best Practice Workshop 2017 Tokyo Volcanic Ash Advisory Centre Japan Meteorological Agency Outline Introduction Method Case study
Jun Park National Meteorological Satellite Center Korea Meteorological Administration
 KMA Implementation Plan for Satellite Climate products Jun Park National Meteorological Satellite Center Korea Meteorological Administration jun.park@kma.go.kr Outline 1. Introduction : Current & Future
WORLD S CHOICE FOR GEO IMAGING. Advanced Baseline Imager (ABI)
") WORLD S CHOICE FOR GEO IMAGING Advanced Baseline Imager (ABI) MARKET-LEADING EXPERTISE DELIVERS BEST-IN-CLASS WEATHER IMAGING In cases of extreme weather such as hurricanes, typhoons, blizzards and tornadoes,
WORLD S CHOICE FOR GEO IMAGING Advanced Baseline Imager (ABI) MARKET-LEADING EXPERTISE DELIVERS BEST-IN-CLASS WEATHER IMAGING In cases of extreme weather such as hurricanes, typhoons, blizzards and tornadoes,
Advanced Geostationary Observations for the OzEWEX Community. Leon Majewski Bureau of Meteorology
 Advanced Geostationary Observations for the OzEWEX Community Leon Majewski Bureau of Meteorology Overview Geostationary satellite missions & sensors Meteorological applications Access for OzEWEX researchers
AOSC201: Weather and Climate Lab
 AOSC201: Weather and Climate Lab Week 8: Forecasting - Analysis Section 107/108 Instructor: Agniv Sengupta q Lab #7 of Lab Manual (pages 41-49) q 50 points in total q INDIVIDUAL Work for the entire lab
HARMONISING SEVIRI RGB COMPOSITES FOR OPERATIONAL FORECASTING
 HARMONISING SEVIRI RGB COMPOSITES FOR OPERATIONAL FORECASTING HansPeter Roesli (1), Jochen Kerkmann (1), Daniel Rosenfeld (2) (1) EUMETSAT, Darmstadt DE, (2) The Hebrew University of Jerusalem, Jerusalem
Clouds on Mars Cloud Classification
 Lecture Ch. 8 Cloud Classification Descriptive approach to clouds Drop Growth and Precipitation Processes Microphysical characterization of clouds Complex (i.e. Real) Clouds Examples Curry and Webster,
JMA s atmospheric motion vectors
 Prepared by JMA Agenda Item: WG II/6 Discussed in WG II JMA s atmospheric motion vectors This paper reports on the recent status of JMA's Atmospheric Motion Vectors (AMVs) from MTSAT-2 and MTSAT-1R, and
JMA s ATMOSPHERIC MOTION VECTORS In response to Action 40.22
 5 July 2013 Prepared by JMA Agenda Item: II/6 Discussed in WG II JMA s ATMOSPHERIC MOTION VECTORS In response to Action 40.22 This paper reports on the recent status of JMA's AMVs from MTSAT-2 and MTSAT-1R,
Himawari 8/9 data distribution/dissemination plan
 Himawari 8/9 data distribution/dissemination plan Japan Meteorological Agency (JMA) Hidehiko MURATA Himawari is the name of this flower in Japanese ET SUP 8, WMO HQ, Geneva, 14 17 April 2014 1 Outline
Quick-Guide to SATAID
 Quick-Guide to SATAID Japan Meteorological Agency Updated as of 2017/07/24 What is SATAID? SATAID (SATellite Animation and Interactive Diagnosis) is a sophisticated display program that enables visualization
Ice fog: T~<-10C RHi>100%
 SATELLITE AND RADIOMETER BASED NOWCASTING APPLICATIONS FOR ARCTIC REGIONS Ismail Gultepe 1, Mike Pavolonis 2, Victor Chung 3, Corey Calvert 4, James Gurka 5, Randolf Ware 6, Louis Garand 7 G. Toth Aug
The water vapour channels of SEVIRI (Meteosat). An introduction
. An introduction") The water vapour channels of SEVIRI (Meteosat). An introduction jose.prieto@eumetsat.int Cachoeira P. July 2006 Formats 1.5 1 Objectives 2 Describe the characteristics of WV channels on board of SEVIRI
The water vapour channels of SEVIRI (Meteosat). An introduction jose.prieto@eumetsat.int Cachoeira P. July 2006 Formats 1.5 1 Objectives 2 Describe the characteristics of WV channels on board of SEVIRI
Rapidly Developing Cumulus Area RDCA detection using Himawari-8 data
 AOMSUC-7@Incheon Rapidly Developing Cumulus Area RDCA detection using Himawari-8 data Hiroshi SUZUE and Yasuhiko SUMIDA Meteorological Satellite Center Japan Meteorological Agency Contents Ø Outline of
Current status and plans of JMA operational wind product
 Current status and plans of JMA operational wind product Kazuki Shimoji Japan Meteorological Agency / Meteorological Satellite Center 3-235, Nakakiyoto, Kiyose, Tokyo, Japan Abstract The Meteorological
A) usually less B) dark colored and rough D) light colored with a smooth surface A) transparency of the atmosphere D) rough, black surface
 usually less B) dark colored and rough D) light colored with a smooth surface A) transparency of the atmosphere D) rough, black surface") 1. Base your answer to the following question on the diagram below which shows two identical houses, A and B, in a city in North Carolina. One house was built on the east side of a factory, and the other
1. Base your answer to the following question on the diagram below which shows two identical houses, A and B, in a city in North Carolina. One house was built on the east side of a factory, and the other
Climate Dynamics (PCC 587): Feedbacks & Clouds
: Feedbacks & Clouds") Climate Dynamics (PCC 587): Feedbacks & Clouds DARGAN M. W. FRIERSON UNIVERSITY OF WASHINGTON, DEPARTMENT OF ATMOSPHERIC SCIENCES DAY 6: 10-14-13 Feedbacks Climate forcings change global temperatures directly
Climate Dynamics (PCC 587): Feedbacks & Clouds DARGAN M. W. FRIERSON UNIVERSITY OF WASHINGTON, DEPARTMENT OF ATMOSPHERIC SCIENCES DAY 6: 10-14-13 Feedbacks Climate forcings change global temperatures directly
Arctic Weather Every 10 Minutes: Design & Operation of ABI for PCW
 Arctic Weather Every 10 Minutes: Design and Operation of ABI for PCW Dr. Paul C. Griffith and Sue Wirth 31st Space Symposium, Technical Track, Colorado Springs, Colorado This document is not subject to
Instrumentation planned for MetOp-SG
 Instrumentation planned for MetOp-SG Bill Bell Satellite Radiance Assimilation Group Met Office Crown copyright Met Office Outline Background - the MetOp-SG programme The MetOp-SG instruments Summary Acknowledgements:
INTERPRETATION OF MSG IMAGES, PRODUCTS AND SAFNWC OUTPUTS FOR DUTY FORECASTERS
 INTERPRETATION OF MSG IMAGES, PRODUCTS AND SAFNWC OUTPUTS FOR DUTY FORECASTERS M. Putsay, M. Rajnai, M. Diószeghy, J. Kerényi, I.G. Szenyán and S. Kertész Hungarian Meteorological Service, H-1525 Budapest,
Climate Dynamics (PCC 587): Clouds and Feedbacks
: Clouds and Feedbacks") Climate Dynamics (PCC 587): Clouds and Feedbacks D A R G A N M. W. F R I E R S O N U N I V E R S I T Y O F W A S H I N G T O N, D E P A R T M E N T O F A T M O S P H E R I C S C I E N C E S D A Y 7 : 1
Climate Dynamics (PCC 587): Clouds and Feedbacks D A R G A N M. W. F R I E R S O N U N I V E R S I T Y O F W A S H I N G T O N, D E P A R T M E N T O F A T M O S P H E R I C S C I E N C E S D A Y 7 : 1
Masahiro Kazumori, Takashi Kadowaki Numerical Prediction Division Japan Meteorological Agency
 Development of an all-sky assimilation of microwave imager and sounder radiances for the Japan Meteorological Agency global numerical weather prediction system Masahiro Kazumori, Takashi Kadowaki Numerical
VALIDATION OF INSAT-3D DERIVED RAINFALL. (Submitted by Suman Goyal, IMD) Summary and Purpose of Document
 Summary and Purpose of Document") WORLD METEOROLOGICAL ORGANIZATION COMMISSION FOR BASIC SYSTEMS OPEN PROGRAMME AREA GROUP ON INTEGRATED OBSERVING SYSTEMS INTER-PROGRAMME EXPERT TEAM ON SATELLITE UTILIZATION AND PRODUCTS SECOND SESSION
WORLD METEOROLOGICAL ORGANIZATION COMMISSION FOR BASIC SYSTEMS OPEN PROGRAMME AREA GROUP ON INTEGRATED OBSERVING SYSTEMS INTER-PROGRAMME EXPERT TEAM ON SATELLITE UTILIZATION AND PRODUCTS SECOND SESSION
Meteorology Study Guide
 Name: Date: Meteorology Study Guide 1. Label the following steps in the water cycle diagram. Be sure to include arrows to show the flow of water through the cycle. - Transpiration - Precipitation -Evaporation
Satellite Meteorology. Protecting Life and Property Around the World
 Satellite Meteorology Protecting Life and Property Around the World The Value of Forecasting Severe Weather Flooding events across Europe in August 2002 cost in the region of 20 billion; 20,000 people
WATER IN THE ATMOSPHERE
 WATER IN THE ATMOSPHERE I. Humidity A. Defined as water vapor or moisture in the air (from evaporation and condensation). B. The atmosphere gains moisture from the evaporation of water from oceans, lakes,
MSG/SEVIRI CHANNEL 4 Short-Wave IR 3.9 m IR3.9 Tutorial
 MSG/SEVIRI CHANNEL 4 Short-Wave IR Channel @ 3.9 m IR3.9 Tutorial HansPeter Roesli EUMETSAT satmet.hp@ticino.com Contributions: D Rosenfeld (HUJ) J Kerkmann (EUM), M Koenig (EUM), J Prieto (EUM), HJ Lutz
McIDAS support of Suomi-NPP /JPSS and GOES-R L2
 McIDAS support of Suomi-NPP /JPSS and GOES-R L2 William Straka III 1 Tommy Jasmin 1, Bob Carp 1 1 Cooperative Institute for Meteorological Satellite Studies, Space Science and Engineering Center, University
Earth Science Chapter 16 and 17. Weather and Climate
 Earth Science Chapter 16 and 17 Weather and Climate Prediction Old way Groundhog Color of the sky Modern way satellites instruments computers Goal Weather Factors Studied by meteorologists Several factors
SAFNWC/MSG SEVIRI CLOUD PRODUCTS
 SAFNWC/MSG SEVIRI CLOUD PRODUCTS M. Derrien and H. Le Gléau Météo-France / DP / Centre de Météorologie Spatiale BP 147 22302 Lannion. France ABSTRACT Within the SAF in support to Nowcasting and Very Short
Weather and the Atmosphere. RAP Short Course
 Weather and the Atmosphere RAP Short Course Syllabus 1) Vertical structure and composition of the atmosphere, basic weather variables 2) Warming Earth and its atmosphere the diurnal and seasonal cycles
INTERPRETATION GUIDE TO MSG WATER VAPOUR CHANNELS
 INTERPRETATION GUIDE TO MSG WATER VAPOUR CHANNELS C.G. Georgiev1 and P. Santurette2 1 National Institute of Meteorology and Hydrology, Tsarigradsko chaussee 66, 1784 Sofia, Bulgaria 2 Météo-France, 42,
Aviation Hazards: Thunderstorms and Deep Convection
 Aviation Hazards: Thunderstorms and Deep Convection TREND Diagnosis of thunderstorm hazards using imagery Contents Satellite imagery Visible, infrared, water vapour Basic cloud identification Identifying
Climate & Earth System Science. Introduction to Meteorology & Climate. Chapter 05 SOME OBSERVING INSTRUMENTS. Instrument Enclosure.
 Climate & Earth System Science Introduction to Meteorology & Climate MAPH 10050 Peter Lynch Peter Lynch Meteorology & Climate Centre School of Mathematical Sciences University College Dublin Meteorology
Weather Notes. Chapter 16, 17, & 18
 Weather Notes Chapter 16, 17, & 18 Weather Weather is the condition of the Earth s atmosphere at a particular place and time Weather It is the movement of energy through the atmosphere Energy comes from
Your Source for Global Aviation Forecasts
 Your Source for Global Aviation Forecasts (831) 238-5054 100 Sky Park Drive Monterey, CA 93940 Weather4Cast.com Live Weather Data Feeds Weather4Cast.com provides Live Aviation Weather Data Feeds formatted
Status and Plans of Next Generation Japanese Geostationary Meteorological Satellites Himawari 8/9
 Status and Plans of Next Generation Japanese Geostationary Meteorological Satellites Himawari 8/9 Masahiro Hayashi 1, Kotaro Bessho 1, and Tomoo Ohno 2 1: JMA/Meteorological Satellite Center (MSC) 2: JMA/Satellite
THE FEASIBILITY OF EXTRACTING LOWLEVEL WIND BY TRACING LOW LEVEL MOISTURE OBSERVED IN IR IMAGERY OVER CLOUD FREE OCEAN AREA IN THE TROPICS
 THE FEASIBILITY OF EXTRACTING LOWLEVEL WIND BY TRACING LOW LEVEL MOISTURE OBSERVED IN IR IMAGERY OVER CLOUD FREE OCEAN AREA IN THE TROPICS Toshiro Ihoue and Tetsuo Nakazawa Meteorological Research Institute
Recent Update on MODIS C6 and VIIRS Deep Blue Aerosol Products
 Recent Update on MODIS C6 and VIIRS Deep Blue Aerosol Products N. Christina Hsu, Photo taken from Space Shuttle: Fierce dust front over Libya Corey Bettenhausen, Andrew M. Sayer, and Rick Hansell Laboratory
AOMSUC-6 Training Event
 Effective use of high temporal and spatial resolution Himawari-8 data AOMSUC-6 Training Event Bodo Zeschke Australian Bureau of Meteorology Training Centre Australian VLab Centre of Excellence Content
GEOGRAPHY EYA NOTES. Weather. atmosphere. Weather and climate
 GEOGRAPHY EYA NOTES Weather and climate Weather The condition of the atmosphere at a specific place over a relatively short period of time Climate The atmospheric conditions of a specific place over a
Remote Sensing in Meteorology: Satellites and Radar. AT 351 Lab 10 April 2, Remote Sensing
 Remote Sensing in Meteorology: Satellites and Radar AT 351 Lab 10 April 2, 2008 Remote Sensing Remote sensing is gathering information about something without being in physical contact with it typically
MSG FOR NOWCASTING - EXPERIENCES OVER SOUTHERN AFRICA
 MSG FOR NOWCASTING - EXPERIENCES OVER SOUTHERN AFRICA Estelle de Coning and Marianne König South African Weather Service, Private Bag X097, Pretoria 0001, South Africa EUMETSAT, Am Kavalleriesand 31, D-64295
2. Fargo, North Dakota receives more snow than Charleston, South Carolina.
 2015 National Tournament Division B Meteorology Section 1: Weather versus Climate Chose the answer that best answers the question 1. The sky is partly cloudy this morning in Lincoln, Nebraska. 2. Fargo,
Condensation is the process by which water vapor changes from a gas to a liquid. Clouds form by this process.
 CHAPTER 16 1 Water in the Air SECTION Understanding Weather BEFORE YOU READ After you read this section, you should be able to answer these questions: What is weather? How does water in the air affect
FUTURE PLAN AND RECENT ACTIVITIES FOR THE JAPANESE FOLLOW-ON GEOSTATIONARY METEOROLOGICAL SATELLITE HIMAWARI-8/9
 FUTURE PLAN AND RECENT ACTIVITIES FOR THE JAPANESE FOLLOW-ON GEOSTATIONARY METEOROLOGICAL SATELLITE HIMAWARI-8/9 Toshiyuki Kurino Japan Meteorological Agency, 1-3-4 Otemachi Chiyodaku, Tokyo 100-8122,
b. The boundary between two different air masses is called a.
 NAME Earth Science Weather WebQuest Part 1. Air Masses 1. Find out what an air mass is. http://okfirst.mesonet.org/train/meteorology/airmasses.html a. What is an air mass? An air mass is b. The boundary
MSG system over view
 MSG system over view 1 Introduction METEOSAT SECOND GENERATION Overview 2 MSG Missions and Services 3 The SEVIRI Instrument 4 The MSG Ground Segment 5 SAF Network 6 Conclusions METEOSAT SECOND GENERATION
METEOSAT THIRD GENERATION
 METEOSAT THIRD GENERATION FACTS AND FIGURES MONITORING WEATHER AND CLIMATE FROM SPACE A HIGHLY INNOVATIVE GEOSTATIONARY SATELLITE SYSTEM FOR EUROPE AND AFRICA The Meteosat Third Generation (MTG) system
Operational Uses of Bands on the GOES-R Advanced Baseline Imager (ABI) Presented by: Kaba Bah
 Presented by: Kaba Bah") Operational Uses of Bands on the GOES-R Advanced Baseline Imager (ABI) Presented by: Kaba Bah Topics: Introduction to GOES-R & ABI ABI individual bands Use of band differences ABI derived products Conclusions
Operational Uses of Bands on the GOES-R Advanced Baseline Imager (ABI) Presented by: Kaba Bah Topics: Introduction to GOES-R & ABI ABI individual bands Use of band differences ABI derived products Conclusions
DATA BROWSING AND ANALYSIS TOOL FOR MTSAT/LRIT. Ryoji Kumabe
 DATA BROWSING AND ANALYSIS TOOL FOR MTSAT/LRIT Ryoji Kumabe Meteorological Satellite Center / Japan Meteorological Agency 3-235 Nakakiyoto Kiyose Tokyo, Japan ABSTRACT The Multi-functional Transport Satellite
Science Chapter 13,14,15
 Science 1206 Chapter 13,14,15 1 Weather dynamics is the study of how the motion of water and air causes weather patterns. Energy from the Sun drives the motion of clouds, air, and water. Earth s tilt at
Surface Processes and the Hydrosphere Unit Heating the Earth s Atmosphere Chapter 11 (pg )
") Name: Block: Surface Processes and the Hydrosphere Unit Heating the Earth s Atmosphere Chapter 11 (pg. 352 385) 11.1: Focus on the Atmosphere: Weather and Climate What is the difference between the weather
Name: Block: Surface Processes and the Hydrosphere Unit Heating the Earth s Atmosphere Chapter 11 (pg. 352 385) 11.1: Focus on the Atmosphere: Weather and Climate What is the difference between the weather
Satellite observation of atmospheric dust
 Satellite observation of atmospheric dust Taichu Y. Tanaka Meteorological Research Institute, Japan Meteorological Agency 11 April 2017, SDS WAS: Dust observation and modeling @WMO, Geneva Dust observations
Joseph Kagenyi Principal Meteorologist (RS/GIS) IMTR-NAIROBI 13 th UFA September 2018
 IMTR-NAIROBI 13 th UFA September 2018") Joseph Kagenyi Principal Meteorologist (RS/GIS) IMTR-NAIROBI 13 th UFA 24-28 September 2018 kagenyijn@gmail.com 1. PUMA WorkStation structure 2. Data Available on PUMA Station 3. PUMA Nowcasting Applications
Joseph Kagenyi Principal Meteorologist (RS/GIS) IMTR-NAIROBI 13 th UFA 24-28 September 2018 kagenyijn@gmail.com 1. PUMA WorkStation structure 2. Data Available on PUMA Station 3. PUMA Nowcasting Applications
Condensation: Dew, Fog and Clouds AT350
 Condensation: Dew, Fog and Clouds AT350 T=30 C Water vapor pressure=12mb What is Td? What is the sat. water vapor T=30 C Water vapor pressure=12mb What is Td? What is the sat. water vapor ~12/42~29% POLAR
Chapter 12 Section 12.1 The causes of weather
 Chapter 12 Section 12.1 The causes of weather Main Idea: Air masses have different temperatures and amounts of moisture because of the uneven heating of earth's surface. What is Meteorology The study of
Preparation for FY-4A. (Submitted by Xiang Fang, CMA)
") WORLD METEOROLOGICAL ORGANIZATION COMMISSION FOR BASIC SYSTEMS OPEN PROGRAMME AREA GROUP ON INTEGRATED OBSERVING SYSTEMS EXPERT TEAM ON SATELLITE UTILIZATION AND PRODUCTS ET-SUP-8/Doc. 10.3 (2.IV.2014)
WORLD METEOROLOGICAL ORGANIZATION COMMISSION FOR BASIC SYSTEMS OPEN PROGRAMME AREA GROUP ON INTEGRATED OBSERVING SYSTEMS EXPERT TEAM ON SATELLITE UTILIZATION AND PRODUCTS ET-SUP-8/Doc. 10.3 (2.IV.2014)
NAME: Log onto YouTube and search for jocrisci channel.
 NAME: Log onto YouTube and search for jocrisci channel. REFERENCE TABLES (Videos 8.1 & 8.2 ESRT 12, 13a, 14b) 1. Use the temperature scales on page 13. (notes-air temperature conversions) a. 80 C to F
Three things necessary for weather are Heat, Air, Moisture (HAM) Weather takes place in the Troposphere (The lower part of the atmosphere).
 Weather takes place in the Troposphere (The lower part of the atmosphere).") Grade 5 SCIENCE WEATHER WATCH Name: STUDY NOTES Weather - The condition of the atmosphere with respect to heat/cold, wetness/dryness, clearness/ cloudiness for a period of time. Weather changes over time
Grade 5 SCIENCE WEATHER WATCH Name: STUDY NOTES Weather - The condition of the atmosphere with respect to heat/cold, wetness/dryness, clearness/ cloudiness for a period of time. Weather changes over time
The Atmosphere. Importance of our. 4 Layers of the Atmosphere. Introduction to atmosphere, weather, and climate. What makes up the atmosphere?
 The Atmosphere Introduction to atmosphere, weather, and climate Where is the atmosphere? Everywhere! Completely surrounds Earth February 20, 2010 What makes up the atmosphere? Argon Inert gas 1% Variable
Satellite data for African applications
 Satellite data for African applications Henk Verschuur, EUMETSAT henk.verschuur@eumetsat.int Introduction Some examples of satellite products which are useful for Africa Satellite products Tropical cyclones
Combined and parallel use of MSG composite images and SAFNWC/MSG products at the Hungarian Meteorological Service
 Combined and parallel use of MSG composite images and SAFNWC/MSG products at the Hungarian Meteorological Service Mária Putsay, Kornél Kolláth and Ildikó Szenyán Hungarian Meteorological Service H-1525
Meteorological Products Generation Using Combined Analysis of NOAA AVHRR and ATOVS Data.
 Meteorological Products Generation Using Combined Analysis of NOAA AVHRR and ATOVS Data. Izabela Dyras, Danuta Serafin-Rek, Zofia Adamczyk Institute of Meteorology and Water Management, P. Borowego 14,
Lecture 2-07: The greenhouse, global heat engine.
 Lecture 2-07: The greenhouse, global heat engine http://en.wikipedia.org/ the sun s ultraviolet (left) and infrared radiation imagers.gsfc.nasa.gov/ems/uv.html www.odysseymagazine.com/images SOLAR FLARES
Evaporation - Water evaporates (changes from a liquid to a gas) into water vapor due to heat from the Sun.
 into water vapor due to heat from the Sun.") Erin Kathryn 2016 Weather is the conditions of Earth s atmosphere at a certain time and place. For example, sunshine, rain, hurricanes, and storms are all examples of weather. Weather is different at different
Erin Kathryn 2016 Weather is the conditions of Earth s atmosphere at a certain time and place. For example, sunshine, rain, hurricanes, and storms are all examples of weather. Weather is different at different
EPS-SG Candidate Observation Missions
 EPS-SG Candidate Observation Missions 3 rd Post-EPS User Consultation Workshop Peter Schlüssel Slide: 1 EPS-SG benefits to activities of NMSs Main Payload High-Resolution Infrared Sounding Microwave Sounding
RECENT ADVANCES TO EXPERIMENTAL GMS ATMOSPHERIC MOTION VECTOR PROCESSING SYSTEM AT MSC/JMA
 RECENT ADVANCES TO EXPERIMENTAL GMS ATMOSPHERIC MOTION VECTOR PROCESSING SYSTEM AT MSC/JMA Ryoji Kumabe 1, Yoshiki Kajino 1 and Masami Tokuno 2 1 Meteorological Satellite Center, Japan Meteorological Agency
T-re Plots Generated from MSG Data in Severe Storms Forecasting Testing in Central Europe
 WDS'11 Proceedings of Contributed Papers, Part III, 88 92, 2011. ISBN 978-80-7378-186-6 MATFYZPRESS T-re Plots Generated from MSG Data in Severe Storms Forecasting Testing in Central Europe M. Pokorný
Meteorology Today. 1 Aug st Lt Libby Haynes Capt Kim Mevers
 Meteorology 1950 - Today 1 Aug 2018 1 st Lt Libby Haynes Capt Kim Mevers What is meteorology? Is it important to you? Meteorology is the science of the atmosphere embracing both weather and climate. It