Quick Reference Manual. Ver. 1.3
|
|
|
- Mae Robertson
- 6 years ago
- Views:
Transcription


1 Quick Reference Manual Ver
2 EXASITE Voyage EXSITE Voyage is a web-based communication tool designed to support the following users; Ship operators who utilize Optimum Ship Routing (OSR) service in order to achieve voyage goal such as (a) Least Fuel Consumption, (b) On-Time Arrival, (c) Earliest Arrival, (d) Least Cost, (e) Safety-First, etc. Engineers who are interested in ship / fleet performance assessment on actual voyages under good and/or all weather conditions in order to set up optimum ship hull/engine maintenance schedule and evaluate effects of maintenance operations. Chartering team who are expected to Time Charter In good performers and Time Charter out their fleet at right rates. POOL managers who want to save fuel and objectively analyze / rank their fleet for pool points. In order to assist the users, relevant information is aligned with Plan, Do, and See cycle listed below. Plan : Voyage Planning with Optimum Ship Routing service. Do : En route performance monitoring with Daily Target Management and Leg (voyage) Target Management. See : Ship-specific performance assessment based on Weathernews verified weather/currents data on actual voyages. 2
3 Contents 1. Login and logout 2. Main menu 3. Planning 4. Monitoring Target Management Ship Monitoring Fleet Display 5. Evaluation 6. Setting Appendix A : Ship Performance Assessment 3

4 1. Login and logout Access the following URL and press LOGIN button. Thence, input your user name and password in login pane. Press LOGOUT button to log out. 4
5 Pressing button allows you to display the data area in full-screen mode, as shown below. Pressing the button again restores the screen to the default display. This should be effective when displaying large size content. 5


6 INFORMATION button shows system maintenance/upgrade information. CONTACT button lists up Weathernews contact sites for your communication with us. Select your preferred one to send your inquiries and/or suggestions for your daily operations. 6
7 2. Main menu The main menu is aligned with Plan, Do, See cycle. Planning for voyage planning discussion and confirmation under Optimum Ship Routing service. Monitoring for en route performance monitoring and target management,. Evaluation for ship performance assessment and voyage review. 7
8 3. Planning Voyage Comparison shows the latest route/rpm discussion designed to assist you to achieve your specified Voyage Priority, such as Least Fuel, On-Time Arrival, Earliest Arrival, Least Cost, Safety First on each respective voyage. The menu also allows you to confirm which route/rpm option you choose or ask Weathernews to further discuss other options. Operators Plan (a) Service nomination / Business priority Do See (b) Confirm or update request (c) Confirmation or update request Weathernews Ship performance model set up Voyage Comparison (route/rpm discussion) Voyage Planning Sheet to Master Ship performance model (update) Voyage Comparison (update) Ship performance monitoring and alert Post voyage report 8


9 Voyage Comparison When OSR service is used, multiple pairs of route/rpm options are discussed and compared in the Voyage Comparison table. To confirm route and estimated ship positions on each route/rpm click on the map pane. click on << and >> buttons to animate ship expected positions. 9


10 + To confirm route and estimated ship positions on each route/rpm click on the map pane. click on << and >> buttons to animate ship expected positions. 10
 Wind + Wave graph.")


11 Expected weather conditions for the next 4 days are compared in (a) Speed + RPM graph and (b) Wind + Wave graph. click on one of Select Plan buttons (highlighted in a red circle) which meets your voyage priority. Request Confirmation pane will pop up with Yes, Confirmed button and Back to Comparison button. When Yes, Confirmed button is selected, your confirmation is sent to Weathernews, which is followed by generation of Voyage Planning Sheet to be sent to ship master on board. 11


12 The Voyage Comparison table will be saved with the term Selected at the selected option until the next voyage plan update. When no favorable options are found in the voyage comparison table, click on Request/Update Request button and input your specific requirements. 12
 you set up for each voyage. Target Management Target Management in the sub-menu pane lists up your vessels illustrating business risks with traffic lights.")
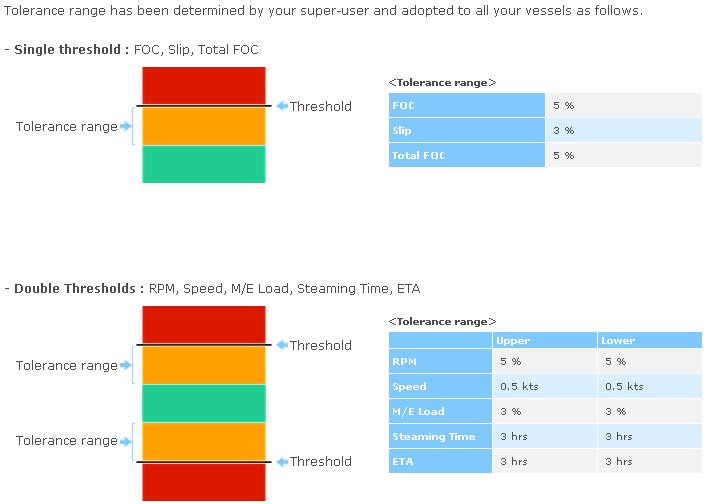
13 4. Monitoring Your fleet performance is monitored during voyage 24 x 7 in view of Daily Targets (Daily speed, Daily FO consumption, and Daily RPM) and Leg Targets (Total FO consumption, Passage Time, ETA) you set up for each voyage. Target Management Target Management in the sub-menu pane lists up your vessels illustrating business risks with traffic lights. Red lights on Daily Monitoring indicate one (or some) of ship reported values is in excess of your daily targets, and Yellow lights indicate one (or some) of them is in tolerance range Leg Monitoring applies the same mechanism comparing your targets to Weathernews estimates for the leg. Target Management menu remembers the last accessed item Daily Monitoring or Leg Monitoring - and shows it when accessed next time. 13

14 Ship Monitoring click on a ship name in the Target Management fleet list (previous page) or search your desired ship name and click on the ship name. Ship Monitoring page displays detailed information. clicking on the map pane shows enlarged route map. When zoomed in, wind conditions experienced by the vessel from departure to date as well as expected wind conditions on the remainder of the voyage will be shown along the route. Table items are highlighted in red or yellow corresponding to business risk analysis represented by traffic lights in Target Management table list (previous page). Daily ship reported values are shown in graphs with target threshold lines. Wind, Wave and Current data depicted are Weathernews verified data from departure to today, and Weathernews expected data on the remainder of the voyage. Ship reported wind and wave data are also shown on the graphs for your reference. Pressing Edit button allows you to set up and modify target values. Press the button again to apply the updated targets to Daily Target management. About Target Management shows tolerance types employed for your company. (See the next page) 14
15 15


16 Fleet Display Fleet Display in the sub-menu shows your vessels locations with weather information on the world map. Ship icon color is automatically updated corresponding to fuel consumption risk examined in Daily Targets and Leg Targets. Adjust zoom size by clicking on button. clicking on a ship icon shows a pop-up window where you can choose Route or Detail. Selecting Detail shows Ship Monitoring information of the selected vessel. (See Ship Monitoring ) 16


17 clicking on Route button shows the voyage track from departure to the current date and the remainder of the voyage to the destination. clicking oni << and >> button allows you to animate ship position with associated wave conditions on selected dates. To hide the vessel s track click on X button in the following pane. You can zoom in the map by double-clicking on the map. The zoomed map shows wind conditions from departure to the destination along the route. Note: Future track is not depicted unless Optimum Ship Routeing (OSR) or Oceanrouteing (O/R) or Performance Monitoring (PM) is employed. 17
 in ship groups.")
. Select one of analysis periods in the options.")
18 5. Evaluation Performance Evaluation Ship-specific performance is analyzed based on Weathernews verified weather/current data on actual voyages. Search a ship or pick up ship(s) in ship groups. Check your desired vessel name box(s), and press Ship Evaluation button (for single ship analysis) or Fleet Evaluation button (for multiple vessels analysis). Select one of analysis periods in the options. You will have the analysis charts and table as shown in the next page. 18
 Daily Speed vs RPM analysis chart (c) FO consumption vs Speed analysis chart Speed")

19 (a) (b) (c) Single Vessel Analysis Analysis charts included are; (a) Daily FO consumption vs RPM analysis chart (b) Daily Speed vs RPM analysis chart (c) FO consumption vs Speed analysis chart Speed and consumption analysis table at each MCR (%) and RPM is also included. Multiple Vessels Comparison Multiple vessels performance can be compared on the charts and table with your preferred analysis parameters. 19


20 + You can examine ship reports on each analysis chart by clicking on your preferred chart. The chart will be zoomed in with ship reported QRT data during the selected period. You can further zoom in the chart. Press and hold down the mouse button, then drag the pointer across the screen to define the desired area. A rectangle appears on screen to show the selected area. To zoom out, click on zoom out button. To change analysis parameters, press Edit button below the analysis table (previous page). Modify the parameters of the table as you wish. Press Go! to reflect your preferred parameters on analysis. 20
. This should be useful for Evaluation menu.")

21 6. Setting For your quick reference the following ship groups are set up. All Ships including all vessels which were operated by your company (or section). This should be useful for Evaluation menu. Your Section fleet. In addition to these pre-set groups, you may add new groups with your preferred ships and group names. 1 1 click on button. 2 2 You will see a group set-up pane. Enter your preferred group name, choose a desired ship icon for the group, and press OK button. 3 3 Thence you will find the group icons you created. 21


22 4 4 click on name. button to input your desired ship Input your desired ship name. In this example, WNI SHIP 100 is input. 5 5 The system lists up all vessels having your input word in their ship names. click on your desired vessel name. 22


23 6 6 Thence your selected vessel will be included in the group You may also select your desired vessels from All Ships list. 7 7 click on All Ships icon to view ships included in it. Select the ship you want to assign to the group by clicking on button. 8 8 Choose the desired group by clicking on the your desired group box. To close the group list click on button. 23


24 9 9 To rename a group click on the ship group you want to rename, thence click on button. Enter the new name in the Group Name field, thence click on OK button To delete a ship group click on the group icon you want to delete, click on button, thence click on OK button. 24
25 Appendix A : Ship Performance Assessment Ship performance speed and fuel consumption is analyzed at each given RPM in a calm sea conditions based on ship reported QRT data. QRT data for the period less than 22 hours steaming time and more than 26 hours are not taken into account. FO consumption analyzed is that of main engine converted to 24 hours consumption. In the analysis, the following parameters can be configured by users arbitrarily. Analysis period(s) Load condition - Laden or Ballast Draft Weather conditions Ship report type - "Verified data" or "Raw Data" Deviation Range Analysis period(s) arranged are (i) Last 12 months, (b) From the Last Dock to date, (c) Year to Year comparison during last three year periods, (d) Dock to Dock Comparison, (e) Event-Divided Period Comparison and (f) your preferred period(s) setting. Weather conditions have four categories - Fair, Moderate, Heavy and Severe where each category consists of wind speed and/or wave height which are determined by users. The weather used in Performance Evaluation is Weathernews' verified data, where Master's reported weather is retained, but not used in the Performance Evaluation. "Verified data" applies only where the vessel concerned is under OSR service: The nature of OSR means that any data irregularity will have been corrected by our OSR staff, where our staff may contact the ship master for data confirmation/update, or the data may not be included in ship performance analysis when it still looks suspicious even after our scrutiny with the help of the ship master. "Raw data" means that the QRT reports sent from the ship are imported direct into Weathernews QRT database and employed in EXSITE. Therefore the curves depicted based on the raw QRT data may include errors and/or suspicious elements. Deviation Range is used to filter out "Raw Data" as well as "Verified data" by the customer setting their own data deviation limit parameters (e.g. 10%) Note the vessel's speed at any given RPM is through-water speed, calibrated taking into account current factor calculated in the vessel's heading direction (See Fig 1). For example, if a vessel's reported over-ground speed is 15 Knots, and the calculated current factor is 0.5 Knots in the direction of ship heading, the "through the water" speed would be 14.5 Knots. Fig. 1 How to calculate current factor 25
26 Daily FOC [mt/24h] Daily FOC [mt/24h] Step 1: FOC-RPM correlation analysis In order to have FOC-RPM correlation analysis curve the actual fuel oil consumption included in QRT reports are decomposed into the following two components. FOC actual = FOC calm (RPM, Loading condition) + ΔFOC(RPM, Weather condition) Note ΔFOC(RPM, Weather condition) can be neglected when the item of interest is the actual FOC in a calm sea only. You may employ deviation filtering function when spikes and/or suspicious data are seen on the chart, which makes the data set as follows. (1-R) FOC calm < FOC actual < (1+R) FOC calm Through this process you have the revised FOC-RPM correlation analysis curve as shown in Figure 3. Fig.3: Revised FOC-RPM correlation analysis curve In this case deviation range R=50% is adopted. This is followed by the following regression analysis which is effective to minimize deviation between the actual FOC and modelestimated FOC (FOC actual - FOC calm (RPM, Loading condition)) This is the initial FOC-RPM correlation analysis curve as shown in Fig fitting curve reported data 25 Fig.2: Initial FOC-RPM correlation analysis curve Some spikes are seen between RPM 60 and 80 in this example RPM RPM fitting curve reported data Step 2: Ship Speed - RPM correlation analysis The same steps are applied to the Ship Speed - RPM correlation analysis. Step 3: Speed - FOC Correlation analysis Speed - FOC Correlation analysis is depicted once Ship Speed - RPM correlation analysis and FOC-RPM correlation analysis are made. 26
Fleet Asset Management
 Fleet Asset Management Maximum Profit by Minimum Planning April, 2017 1 PERFORMERS Performance is all that matters and that is what Fleet Asset Management is all about Brad Pitt Einstein Old Russian lady
ON SITE SYSTEMS Chemical Safety Assistant
 ON SITE SYSTEMS Chemical Safety Assistant CS ASSISTANT WEB USERS MANUAL On Site Systems 23 N. Gore Ave. Suite 200 St. Louis, MO 63119 Phone 314-963-9934 Fax 314-963-9281 Table of Contents INTRODUCTION
M E R C E R W I N WA L K T H R O U G H
 H E A L T H W E A L T H C A R E E R WA L K T H R O U G H C L I E N T S O L U T I O N S T E A M T A B L E O F C O N T E N T 1. Login to the Tool 2 2. Published reports... 7 3. Select Results Criteria...
mylab: Chemical Safety Module Last Updated: January 19, 2018
 : Chemical Safety Module Contents Introduction... 1 Getting started... 1 Login... 1 Receiving Items from MMP Order... 3 Inventory... 4 Show me Chemicals where... 4 Items Received on... 5 All Items... 5
1 Executive summary. 2 Principles of SAT-OCEAN service
 S SCOPE OF WORK FOR ROUTING SERVICES 1 Executive summary SAT-OCEAN has developed an innovative routing service enabling for significant time and energy savings. This solution is going beyond traditional
: : User Manual: : - 10 December
 : : User Manual: : - 0 December 06 - : : User Manual: : Table of Contents. Map Control. How to move a map. How to zoom in and out a map 4. How to inquire Ocean Currents. How to inquire predicted current
Lightcloud Application
 Controlling Your Lightcloud System Lightcloud Application Lightcloud Application Navigating the Application Devices Device Settings Organize Control Energy Scenes Schedules Demand Response Power Up State
MDSS Functional Prototype Display System Preview April 2002
 MDSS Functional Prototype Display System Preview April 2002 Bill Mahoney National Center for Atmospheric Research Images shown are valid as of 15 April 2002 NCAR MDSS Display System - Overview The MDSS
RADIATION PROCEDURES MANUAL Procedure Cover Sheet
 RADIATION PROCEDURES MANUAL Procedure Cover Sheet Procedure Title: Radioactive Material Inventory Procedure Number: TSO-09-16-REV 0 Effective Date: June 18, 2009 Approved By: Date: 11 August, 2009 Technical
MAGNETITE OXIDATION EXAMPLE
 HSC Chemistry 7.0 1 MAGNETITE OXIDATION EXAMPLE Pelletized magnetite (Fe 3 O 4 ) ore may be oxidized to hematite (Fe 2 O 3 ) in shaft furnace. Typical magnetite content in ore is some 95%. Oxidation is
VOYAGE (PASSAGE) PLANNING
 PLANNING") VOYAGE (PASSAGE) PLANNING Introduction O Passage planning or voyage planning is a procedure of developing a complete description of a vessel's voyage from start to finish. O Production of a passage plan
VOYAGE (PASSAGE) PLANNING Introduction O Passage planning or voyage planning is a procedure of developing a complete description of a vessel's voyage from start to finish. O Production of a passage plan
TECDIS and TELchart ECS Weather Overlay Guide
 1 of 24 TECDIS and TELchart ECS provides a very advanced weather overlay feature, using top quality commercial maritime weather forecast data available as a subscription service from Jeppesen Marine. The
FireFamilyPlus Version 5.0
 FireFamilyPlus Version 5.0 Working with the new 2016 NFDRS model Objectives During this presentation, we will discuss Changes to FireFamilyPlus Data requirements for NFDRS2016 Quality control for data
Quality Measures Green Light Report Online Management Tool. Self Guided Tutorial
 Quality Measures Green Light Report Online Management Tool Self Guided Tutorial 1 Tutorial Contents Overview Access the QM Green Light Report Review the QM Green Light Report Tips for Success Contact PointRight
Store User Guide - Forecasting. Jimmy John s
 Store User Guide - Forecasting Jimmy John s All rights reserved. This publication contains proprietary information of HotSchedules. No part of this publication may be reproduced, stored in a retrieval
CHEMICAL INVENTORY ENTRY GUIDE
 CHEMICAL INVENTORY ENTRY GUIDE Version Date Comments 1 October 2013 Initial A. SUMMARY All chemicals located in research and instructional laboratories at George Mason University are required to be input
Frequently Asked Questions
 Frequently Asked Questions Can I still get paid via direct deposit? Can I use e- wallet to pay for USANA auto ship orders? Can I use e- wallet to pay for USANA products? Can I use e- wallet to pay for
Introduction to Weather Analytics & User Guide to ProWxAlerts. August 2017 Prepared for:
 Introduction to Weather Analytics & User Guide to ProWxAlerts August 2017 Prepared for: Weather Analytics is a leading data and analytics company based in Washington, DC and Dover, New Hampshire that offers
User Manuel. EurotaxForecast. Version Latest changes ( )
") User Manuel EurotaxForecast Version 1.23.0771- Latest changes (19.07.2003) Contents Preface 5 Welcome to Eurotax Forecast...5 Using this manual 6 How to use this manual?...6 Program overview 7 General
User Manuel EurotaxForecast Version 1.23.0771- Latest changes (19.07.2003) Contents Preface 5 Welcome to Eurotax Forecast...5 Using this manual 6 How to use this manual?...6 Program overview 7 General
How to Make or Plot a Graph or Chart in Excel
 This is a complete video tutorial on How to Make or Plot a Graph or Chart in Excel. To make complex chart like Gantt Chart, you have know the basic principles of making a chart. Though I have used Excel
Forecast User Manual FORECAST. User Manual. Version P a g e
 FORECAST Version 1.0 1 P a g e Version Created By Created On Verified By Verified On Description No Draft Mr. Jayendrasinh 22/04/2016 Gohil 1.0 Mr. Jayendrasinh Gohil 23/04/2016 Mr. Hemal Patel 2 P a g
Using the Budget Features in Quicken 2008
 Using the Budget Features in Quicken 2008 Quicken budgets can be used to summarize expected income and expenses for planning purposes. The budget can later be used in comparisons to actual income and expenses
Computer simulation of radioactive decay
 Computer simulation of radioactive decay y now you should have worked your way through the introduction to Maple, as well as the introduction to data analysis using Excel Now we will explore radioactive
General Chemistry Lab Molecular Modeling
 PURPOSE The objectives of this experiment are PROCEDURE General Chemistry Lab Molecular Modeling To learn how to use molecular modeling software, a commonly used tool in chemical research and industry.
Create Satellite Image, Draw Maps
 Create Satellite Image, Draw Maps 1. The goal Using Google Earth, we want to create and import a background file into our Adviser program. From there, we will be creating paddock boundaries. The accuracy
Section 7: Hazard Avoidance
 7.1 In-Flight Hazard Awareness Section 7: Hazard Avoidance As technology improves, pilots have more and more real-time information within reach in all phases of flight. Terrain proximity, real-time weather
Guide to Hydrologic Information on the Web
 NOAA s National Weather Service Guide to Hydrologic Information on the Web Colorado River at Lees Ferry Photo: courtesy Tim Helble Your gateway to web resources provided through NOAA s Advanced Hydrologic
Manual Seatrack Web Brofjorden
 December 2011 Manual Seatrack Web Brofjorden A user-friendly system for forecasts and backtracking of drift and spreading of oil, chemicals and substances in water 1. Introduction and Background... 3 1.1
NEW HOLLAND IH AUSTRALIA. Machinery Market Information and Forecasting Portal *** Dealer User Guide Released August 2013 ***
 NEW HOLLAND IH AUSTRALIA Machinery Market Information and Forecasting Portal *** Dealer User Guide Released August 2013 *** www.cnhportal.agriview.com.au Contents INTRODUCTION... 5 REQUIREMENTS... 6 NAVIGATION...
Building Inflation Tables and CER Libraries
 Building Inflation Tables and CER Libraries January 2007 Presented by James K. Johnson Tecolote Research, Inc. Copyright Tecolote Research, Inc. September 2006 Abstract Building Inflation Tables and CER
Exercises for Windows
 Exercises for Windows CAChe User Interface for Windows Select tool Application window Document window (workspace) Style bar Tool palette Select entire molecule Select Similar Group Select Atom tool Rotate
New SPOT Program. Customer Tutorial. Tim Barry Fire Weather Program Leader National Weather Service Tallahassee
 New SPOT Program Customer Tutorial Tim Barry Fire Weather Program Leader National Weather Service Tallahassee tim.barry@noaa.gov Live Demonstration http://www.weather.gov/spot/ Live Demonstration http://www.weather.gov/spot/
Technical Procedure for Glass Refractive Index Measurement System 3 (GRIM 3)
") Technical Procedure for Glass Refractive Index Measurement System 3 (GRIM 3) 1.0 Purpose - This technical procedure shall be followed for the operation of the GRIM 3. 2.0 Scope - This procedure applies
Technical Procedure for Glass Refractive Index Measurement System 3 (GRIM 3) 1.0 Purpose - This technical procedure shall be followed for the operation of the GRIM 3. 2.0 Scope - This procedure applies
Location Intelligence Infrastructure Asset Management. Confirm. Confirm Mapping Link to ArcMap Version v18.00b.am
 Location Intelligence Infrastructure Asset Management Confirm Confirm Mapping Link to ArcMap Version v18.00b.am Information in this document is subject to change without notice and does not represent a
An area chart emphasizes the trend of each value over time. An area chart also shows the relationship of parts to a whole.
 Excel 2003 Creating a Chart Introduction Page 1 By the end of this lesson, learners should be able to: Identify the parts of a chart Identify different types of charts Create an Embedded Chart Create a
Tutorial. Getting started. Sample to Insight. March 31, 2016
 Getting started March 31, 2016 Sample to Insight CLC bio, a QIAGEN Company Silkeborgvej 2 Prismet 8000 Aarhus C Denmark Telephone: +45 70 22 32 44 www.clcbio.com support-clcbio@qiagen.com Getting started
From BASIS DD to Barista Application in Five Easy Steps
 Y The steps are: From BASIS DD to Barista Application in Five Easy Steps By Jim Douglas our current BASIS Data Dictionary is perfect raw material for your first Barista-brewed application. Barista facilitates
Monitoring Scour Critical Bridges During Floods For Local Bridge Owners. Presented by
 Monitoring Scour Critical Bridges During Floods For Local Bridge Owners Presented by SAFETY FIRST DO NOT ENDANGER YOURSELF OR OTHERS WHILE MONITORING BRIDGES DO NOT ENTER FLOOD WATERS FLOOD WATERS INCLUDE
Lab 1 Uniform Motion - Graphing and Analyzing Motion
 Lab 1 Uniform Motion - Graphing and Analyzing Motion Objectives: < To observe the distance-time relation for motion at constant velocity. < To make a straight line fit to the distance-time data. < To interpret
Appendix B Microsoft Office Specialist exam objectives maps
 B 1 Appendix B Microsoft Office Specialist exam objectives maps This appendix covers these additional topics: A Excel 2003 Specialist exam objectives with references to corresponding material in Course
CLEA/VIREO PHOTOMETRY OF THE PLEIADES
 CLEA/VIREO PHOTOMETRY OF THE PLEIADES Starting up the program The computer program you will use is a realistic simulation of a UBV photometer attached to a small (diameter=0.4 meters) research telescope.
McIDAS-V Tutorial Displaying Point Observations from ADDE Datasets updated July 2016 (software version 1.6)
") McIDAS-V Tutorial Displaying Point Observations from ADDE Datasets updated July 2016 (software version 1.6) McIDAS-V is a free, open source, visualization and data analysis software package that is the
McIDAS-V Tutorial Displaying Point Observations from ADDE Datasets updated July 2016 (software version 1.6) McIDAS-V is a free, open source, visualization and data analysis software package that is the
From BASIS DD to Barista Application in Five Easy Steps
 Y The steps are: From BASIS DD to Barista Application in Five Easy Steps By Jim Douglas our current BASIS Data Dictionary is perfect raw material for your first Barista-brewed application. Barista facilitates
Electric Fields and Equipotentials
 OBJECTIVE Electric Fields and Equipotentials To study and describe the two-dimensional electric field. To map the location of the equipotential surfaces around charged electrodes. To study the relationship
MotiveWave Hurst Cycles Guide Version: 1.0
 Version: 1.0 2018 MotiveWave Software Version 1.0 2018 MotiveWave Software Page 1 of 18 Acknowledgements Special thanks to Michael Richards from Time Price Analysis (https://www.timepriceanalysis.com)
You w i ll f ol l ow these st eps : Before opening files, the S c e n e panel is active.
 You w i ll f ol l ow these st eps : A. O pen a n i m a g e s t a c k. B. Tr a c e t h e d e n d r i t e w i t h t h e user-guided m ode. C. D e t e c t t h e s p i n e s a u t o m a t i c a l l y. D. C
Virtual Beach Making Nowcast Predictions
 Virtual Beach 3.0.6 Making Nowcast Predictions In this module you will learn how to: A. Create a real-time connection to Web data services through EnDDaT B. Download real-time data to make a Nowcast prediction
LED Lighting Facts: Product Submission Guide
 LED Lighting Facts: Product Submission Guide NOVEMBER 2017 1 P a g e L E D L i g h t i n g F a c t s : M a n u f a c t u r e r P r o d u c t S u b m i s s i o n G u i d e TABLE OF CONTENTS Section 1) Accessing
41. Sim Reactions Example
 HSC Chemistry 7.0 41-1(6) 41. Sim Reactions Example Figure 1: Sim Reactions Example, Run mode view after calculations. General This example contains instruction how to create a simple model. The example
NMR Predictor. Introduction
 NMR Predictor This manual gives a walk-through on how to use the NMR Predictor: Introduction NMR Predictor QuickHelp NMR Predictor Overview Chemical features GUI features Usage Menu system File menu Edit
Experiment: Oscillations of a Mass on a Spring
 Physics NYC F17 Objective: Theory: Experiment: Oscillations of a Mass on a Spring A: to verify Hooke s law for a spring and measure its elasticity constant. B: to check the relationship between the period
Sales Analysis User Manual
 Sales Analysis User Manual Confidential Information This document contains proprietary and valuable, confidential trade secret information of APPX Software, Inc., Richmond, Virginia Notice of Authorship
Computer Complaints. Management System [CCMS] User Manual. This user Manual describes with Screen Shots the features and functionalities of CCMS
![Computer Complaints. Management System [CCMS] User Manual. This user Manual describes with Screen Shots the features and functionalities of CCMS](/thumbs/93/113182702.jpg "Computer Complaints. Management System [CCMS] User Manual. This user Manual describes with Screen Shots the features and functionalities of CCMS") Computer Complaints Management System [CCMS] User Manual 2013 This user Manual describes with Screen Shots the features and functionalities of CCMS High Court of Karnataka Computer Main Center Office Ph
Computer Complaints Management System [CCMS] User Manual 2013 This user Manual describes with Screen Shots the features and functionalities of CCMS High Court of Karnataka Computer Main Center Office Ph
MeteoGroup FleetGuard. The world s most comprehensive SaaS fleet management system
 MeteoGroup FleetGuard The world s most comprehensive SaaS fleet management system The fleet management challenge Whether you are fleet operator or charter owner, you bear great responsibility for revenue,
SeeSAR 7.1 Beginners Guide. June 2017
 SeeSAR 7.1 Beginners Guide June 2017 Part 1: Basics 1 Type a pdb code and press return or Load your own protein or already existing project, or Just load molecules To begin, let s type 2zff and download
Space Objects. Section. When you finish this section, you should understand the following:
 GOLDMC02_132283433X 8/24/06 2:21 PM Page 97 Section 2 Space Objects When you finish this section, you should understand the following: How to create a 2D Space Object and label it with a Space Tag. How
Comparing whole genomes
 BioNumerics Tutorial: Comparing whole genomes 1 Aim The Chromosome Comparison window in BioNumerics has been designed for large-scale comparison of sequences of unlimited length. In this tutorial you will
New Cloud Solutions by My TimeZero
 New Cloud Solutions by My TimeZero 1. TimeZero Products under My TimeZero 2. Creating and Logging into My TimeZero Account 3. Linking My TimeZero Products with Users 3-1 Finding Friends 3-2 Saving Settings
Ligand Scout Tutorials
 Ligand Scout Tutorials Step : Creating a pharmacophore from a protein-ligand complex. Type ke6 in the upper right area of the screen and press the button Download *+. The protein will be downloaded and
Using the FCMQ`s snowmobile trail interactive map
 Using the FCMQ`s snowmobile trail interactive map Recommended browsers: Google Chrome, Mozilla Firefox or Internet Explorer 10 or newer. The interactive map is compatible with any type of mobile device
ST-Links. SpatialKit. Version 3.0.x. For ArcMap. ArcMap Extension for Directly Connecting to Spatial Databases. ST-Links Corporation.
 ST-Links SpatialKit For ArcMap Version 3.0.x ArcMap Extension for Directly Connecting to Spatial Databases ST-Links Corporation www.st-links.com 2012 Contents Introduction... 3 Installation... 3 Database
Demand Forecasting. for. Microsoft Dynamics 365 for Operations. User Guide. Release 7.1. April 2018
 Demand Forecasting for Microsoft Dynamics 365 for Operations User Guide Release 7.1 April 2018 2018 Farsight Solutions Limited All Rights Reserved. Portions copyright Business Forecast Systems, Inc. This
Watershed Modeling Orange County Hydrology Using GIS Data
 v. 10.0 WMS 10.0 Tutorial Watershed Modeling Orange County Hydrology Using GIS Data Learn how to delineate sub-basins and compute soil losses for Orange County (California) hydrologic modeling Objectives
Bloomsburg University Weather Viewer Quick Start Guide. Software Version 1.2 Date 4/7/2014
 Bloomsburg University Weather Viewer Quick Start Guide Software Version 1.2 Date 4/7/2014 Program Background / Objectives: The Bloomsburg Weather Viewer is a weather visualization program that is designed
Table of Contents Chemicals & Fertilizers
 Table of Contents Chemicals & Fertilizers Chemicals & Fertilizers 4 Introduction... 4 Chemical & Fertilizer Browse Table... 5 Grounds Dimension Table... 7 Editing Grounds Area Names... 8 Adding New Grounds
University of Colorado Denver Anschutz Medical Campus Online Chemical Inventory System User s Manual
 University of Colorado Denver Anschutz Medical Campus Online Chemical Inventory System User s Manual Hazardous Materials Division 303-724-0345 chemical.inventory@ucdenver.edu May, 2017 Table of Contents
Mass Asset Additions. Overview. Effective mm/dd/yy Page 1 of 47 Rev 1. Copyright Oracle, All rights reserved.
 Overview Effective mm/dd/yy Page 1 of 47 Rev 1 System References None Distribution Oracle Assets Job Title * Ownership The Job Title [list@yourcompany.com?subject=eduxxxxx] is responsible for ensuring
The TexasET Network and Website User s Manual
 The TexasET Network and Website http://texaset.tamu.edu User s Manual By Charles Swanson and Guy Fipps 1 September 2013 Texas AgriLIFE Extension Service Texas A&M System 1 Extension Program Specialist;
Cerno Application Note Extending the Limits of Mass Spectrometry
 Creation of Accurate Mass Library for NIST Database Search Novel MS calibration has been shown to enable accurate mass and elemental composition determination on quadrupole GC/MS systems for either molecular
(THIS IS AN OPTIONAL BUT WORTHWHILE EXERCISE)
") PART 2: Analysis in ArcGIS (THIS IS AN OPTIONAL BUT WORTHWHILE EXERCISE) Step 1: Start ArcCatalog and open a geodatabase If you have a shortcut icon for ArcCatalog on your desktop, double-click it to start
PART 2: Analysis in ArcGIS (THIS IS AN OPTIONAL BUT WORTHWHILE EXERCISE) Step 1: Start ArcCatalog and open a geodatabase If you have a shortcut icon for ArcCatalog on your desktop, double-click it to start
Introduction to Coastal GIS
 Introduction to Coastal GIS Event was held on Tues, 1/8/13 - Thurs, 1/10/13 Time: 9:00 am to 5:00 pm Location: Roger Williams University, Bristol, RI Audience: The intended audiences for this course are
IncuCyte ZOOM NeuroTrack Fluorescent Processing
 IncuCyte ZOOM NeuroTrack Fluorescent Processing The NeuroTrack TM Software Module (Cat No 9600-0011) is used to measure the processes of neurons in monoculture or with fluorescent labeling in co-culture.
Appendix 4 Weather. Weather Providers
 Appendix 4 Weather Using weather data in your automation solution can have many benefits. Without weather data, your home automation happens regardless of environmental conditions. Some things you can
Nobeltec TimeZero V2.0.2
 Nobeltec TimeZero V2.0.2 New Features: Windows 8 Compatibility Nobeltec TimeZero v2 is now compatible with Windows 8 for Intel Compatible PC and will work as a Windows desktop app. IMPORTANT NOTICE: Nobeltec
How to Perform a Site Based Plant Search
 PlantSelector Help Use PlantSelector to get detailed information and photos of plants by: Searching for plants that will grow well at your planting site. How do I do this? OR Searching for plants with
LED Lighting Facts: Manufacturer Guide
 LED Lighting Facts: Manufacturer Guide 2018 1 P a g e L E D L i g h t i n g F a c t s : M a n u f a c t u r e r G u i d e TABLE OF CONTENTS Section 1) Accessing your account and managing your products...
Computational Chemistry Lab Module: Conformational Analysis of Alkanes
 Introduction Computational Chemistry Lab Module: Conformational Analysis of Alkanes In this experiment, we will use CAChe software package to model the conformations of butane, 2-methylbutane, and substituted
Calculating Bond Enthalpies of the Hydrides
 Proposed Exercise for the General Chemistry Section of the Teaching with Cache Workbook: Calculating Bond Enthalpies of the Hydrides Contributed by James Foresman, Rachel Fogle, and Jeremy Beck, York College
Getting started with BatchReactor Example : Simulation of the Chlorotoluene chlorination
 Getting started with BatchReactor Example : Simulation of the Chlorotoluene chlorination 2011 ProSim S.A. All rights reserved. Introduction This document presents the different steps to follow in order
Food Safety Management System
 Introduction The company has planned, established, documented and implemented a food safety management system for the site, in order to continually improve its effectiveness in accordance with legislation,
The Geodatabase Working with Spatial Analyst. Calculating Elevation and Slope Values for Forested Roads, Streams, and Stands.
 GIS LAB 7 The Geodatabase Working with Spatial Analyst. Calculating Elevation and Slope Values for Forested Roads, Streams, and Stands. This lab will ask you to work with the Spatial Analyst extension.
OECD QSAR Toolbox v.4.1. Tutorial illustrating new options for grouping with metabolism
 OECD QSAR Toolbox v.4.1 Tutorial illustrating new options for grouping with metabolism Outlook Background Objectives Specific Aims The exercise Workflow 2 Background Grouping with metabolism is a procedure
Page 1. A Grieg Group Company
 Page 1 ECDIS PAST, PRESENT & Future 2000-2010 Past Present 2010-2015 2015... Future Page 2 History Page 3 DEEPLY - Past What is going on there????? I am Checking now Sir Page 4 ECDIS History ECDIS has
Harvard Life Science Outreach December 7, 2017 Measuring ecosystem carbon fluxes using eddy covariance data ACTIVITIES I. NAME THAT ECOSYSTEM!
 Harvard Life Science Outreach December 7, 2017 Measuring ecosystem carbon fluxes using eddy covariance data ACTIVITIES I. NAME THAT ECOSYSTEM! Objective: Distinguish ecosystems (tropical forest vs. temperate
Setting Up and Checking-In Serials Using Aleph Predictive Functionality
 Harvard University Library Aleph Staff Office for Information Systems Training Program SERP Learner s Guide Setting Up and Checking-In Serials Using Aleph Predictive Functionality Table of Contents 1.
D.T.M: TRANSFER TEXTBOOKS FROM ONE SCHOOL TO ANOTHER
 Destiny Textbook Manager allows users with full access to transfer Textbooks from one school site to another and receive transfers from the warehouse In this tutorial you will learn how to: Requirements:
Activity P11: Collision Impulse and Momentum (Force Sensor, Motion Sensor)
") Name Class Date Activity P11: Collision Impulse and Momentum (Force Sensor, Motion Sensor) Concept DataStudio ScienceWorkshop (Mac) ScienceWorkshop (Win) Newton s Laws P11 Impulse.DS P14 Collision P14_COLL.SWS
Name Class Date Activity P11: Collision Impulse and Momentum (Force Sensor, Motion Sensor) Concept DataStudio ScienceWorkshop (Mac) ScienceWorkshop (Win) Newton s Laws P11 Impulse.DS P14 Collision P14_COLL.SWS
Advanced Forecast. For MAX TM. Users Manual
 Advanced Forecast For MAX TM Users Manual www.maxtoolkit.com Revised: June 24, 2014 Contents Purpose:... 3 Installation... 3 Requirements:... 3 Installer:... 3 Setup: spreadsheet... 4 Setup: External Forecast
Dock Ligands from a 2D Molecule Sketch
 Dock Ligands from a 2D Molecule Sketch March 31, 2016 Sample to Insight CLC bio, a QIAGEN Company Silkeborgvej 2 Prismet 8000 Aarhus C Denmark Telephone: +45 70 22 32 44 www.clcbio.com support-clcbio@qiagen.com
Two problems to be solved. Example Use of SITATION. Here is the main menu. First step. Now. To load the data.
 Two problems to be solved Example Use of SITATION Mark S. Daskin Department of IE/MS Northwestern U. Evanston, IL 1. Minimize the demand weighted total distance (or average distance) Using 10 facilities
Ørsted. Flexible reporting solutions to drive a clean energy agenda
 Ørsted Flexible reporting solutions to drive a clean energy agenda Ørsted: A flexible reporting solution to drive a clean energy agenda Renewable energy company Ørsted relies on having a corporate reporting
SteelSmart System Cold Formed Steel Design Software Download & Installation Instructions
 Step 1 - Login or Create an Account at the ASI Portal: Login: https://portal.appliedscienceint.com/account/login Create Account: https://portal.appliedscienceint.com/account/register 2 0 1 7 A p p l i
User Guide. Affirmatively Furthering Fair Housing Data and Mapping Tool. U.S. Department of Housing and Urban Development
 User Guide Affirmatively Furthering Fair Housing Data and Mapping Tool U.S. Department of Housing and Urban Development December, 2015 1 Table of Contents 1. Getting Started... 5 1.1 Software Version...
Eurostat Business Cycle Clock (BCC): A user's guide
: A user's guide") EUROPEAN COMMISSION EUROSTAT Directorate C: National Accounts, Prices and Key Indicators Unit C-1: National accounts methodology. Indicators ESTAT.C.1 - National accounts methodology/indicators Eurostat
EUROPEAN COMMISSION EUROSTAT Directorate C: National Accounts, Prices and Key Indicators Unit C-1: National accounts methodology. Indicators ESTAT.C.1 - National accounts methodology/indicators Eurostat
Yes, the Library will be accessible via the new PULSE and the existing desktop version of PULSE.
 F R E Q U E N T L Y A S K E D Q U E S T I O N S THE LIBRARY GENERAL W H A T I S T H E L I B R A R Y? The Library is the new, shorter, simpler name for the Business Development (Biz Dev) Library. It s your
Investigating Factors that Influence Climate
 Investigating Factors that Influence Climate Description In this lesson* students investigate the climate of a particular latitude and longitude in North America by collecting real data from My NASA Data
Instructions for Using Spartan 14
 Instructions for Using Spartan 14 Log in to the computer with your Colby ID and password. Click on the Spartan 14 icon in the dock at the bottom of your screen. I. Building Molecules Spartan has one main
D4.5 Operational METOC service D4.10 Operational Ice Chart service
 D4.5 Operational METOC service D4.10 Operational Ice Chart service Project no. 636329 Project acronym: EfficienSea2 EFFICIENSEA2 efficient, safe and sustainable traffic at sea Funding scheme: Innovation
TOP MARKET SURVEY INSTRUCTION SHEET. Requirements. Overview
 INSTRUCTION SHEET TOP SURVEY TOP SURVEY INSTRUCTION SHEET Overview For nearly 40 years, the ACA has surveyed member agencies and conducted the Top Collection Market Survey. This survey provides critical
CHEMICAL EXCHANGE. The Chemical Exchange Program. When Offering a Chemical for Exchange, consider the following:
 CHEMICAL EXCHANGE The Chemical Exchange Program The AU Chemical Exchange program was established in response to t he Environmental Protection Agency (EPA) requirement for hazardous waste minimization and