Water balance model Graeme H
|
|
|
- Dale Marsh
- 5 years ago
- Views:
Transcription

1 Water balance model Graeme H


2 Water balance model of Lake Ellesmere (Te Waihora) Background Lake variables Water balance Model development Model output Graeme Horrell

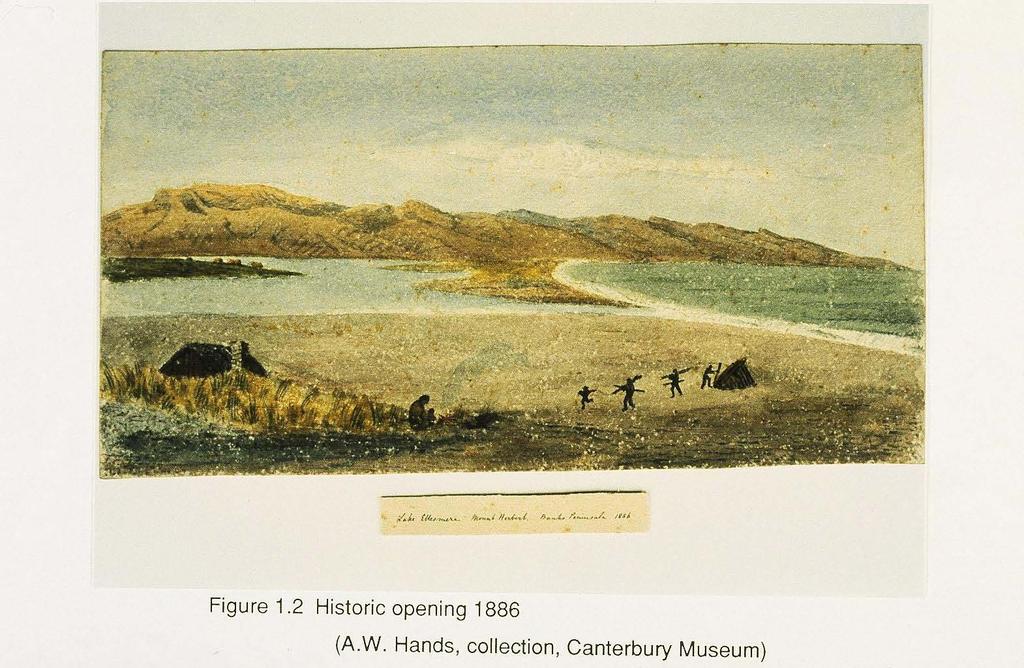
3 Background Catchment area 2072 km 2, 777 km 2 hills, 1295 km 2 plains Historically the lake opened itself at an approximate height of 4 m, with an approximate area of 315 km 2 When managed by Maori the lake was opened at approximately 2.7 m with an area of 290 km 2. Since the late 19th century it has been opened by Europeans and current lake opening levels are; 1.13 m April to July 1.05 m August to March Current area of 189 km 2, mean depth 1.4m

4 Lake water balance variables (It + Ir + Is + Ig +Ias + Irs) (Os +Oe +Oa) = ΔS It = tributary inflows Ir = inflow due to rainfall on the lake Is = Kaitorete Spit seepage inflows Ig = groundwater seepage inflows Ias = artificial opening sea incursion inflow Irs = rough weather sea incursion inflow Os = Kaitorete spit seepage outflow Oe = evaporation Oa = artificial opening outflows ΔS = change in storage
5 Tributary inflows

6 Kaituna River recorder on Banks Peninsula

7 Doyleston Drain at Lake Road
8 Tributaries contribute 62 % of inflows m 3 s -1 Flow in the Harts Creek (m 3 /s) Flow measurement modelled 0 1- Apr Mar Mar Apr Apr Apr Apr Apr Apr Apr Apr Apr Apr Apr Apr Apr- 06
9 Rainfall contributes 16% of inflows m3 s-1

10 Groundwater seepage represents 2% of inflows 0.4 m 3 s -1

11 Artificial opening sea incursions 23 rd June 2008 outflows are approximately 160 m 3 s -1, 2 hours later seawater inflows exceeded 250 m 3 s -1
12 400 Time series Derived of outflows and seawater inflows outflow (-) and seawater inflow (+) associated with the opening of 12th June to 25th June Flows m3/s Southwest storm Jun : days/mm 2-Jul 12-Jul 22-Jul site 7 Derived flows Flows m3/s 4.889units/mm Origin -260 First time measured Tidal influence

13 Artificial opening sea incursions represent 13% of inflows m 3 s -1
14 August to March Opening level Rough weather sea incursions

15 Rough weather sea incursions contribute to 7% of inflows 1.5 m 3 s -1 ough weather sea incursions approximately 80 m 3 s th July 2008
16 Seepage out flows through Kaitorete spit Represents 6% of outflows 1.2 m 3 s -1
17

18 Sea water seeping into the lake through the sea wall

19 Evaporation Lake evaporation was derived from: Class A evaporation pan measurements at Lincoln Penman calculations of evaporation from Broadfields climate station Correction of Penman values to Class A measurements Correction to lake open water evaporation using monthly pan coefficients Average annual lake evaporation is 1075 mm Lake evaporation represents 34% of outflows 6.6 m 3 s -1

20 Artificial opening outflows Artificial opening outflows represent 60% of outflows 11.5 m 3 s- 1
21 Lake Ellesmere (Te Waihora) water balance (It + Ir + Ig + Ias + Irs) - (Os + Oe + Oa) = s Flow % where: period : June Precision of variables (m 3 s - 1) (m 3 s -1) It = tributary inflows Ir = rainfall inflows Ig = groundwater or Ias = artificial opening sea incursion inflows Irs = rough weather sea incursion inflows or Os = Kaitorete spit seepage outflows Oe = evaporation outflows Oa = artificial opening outflows s = change in storage to Total inflows (20.3 m 3 s -1 ) are greater than the total outflows (19.4 m 3 s -1 ) by 0.9 m 3 s -1

22 Tributary inflows Groundwater inflows Rough weather sea incursions Evaporation Outflows Rainfall rtificial opening sea incursions Kaitorete Spit seepage Lake level


23 Model development Other necessary information Calm lake levels Lake area curve Wave conditions necessary for a successful opening, and the outlet closure Daily wave record

24 Purpose of the model is to enable lake level opening scenarios to be tested and evaluated from two key outputs: - new lake level regime - number of openings that may occur
25 The Taumutu staff gauge read daily form 1959 to 2005 Crucial to the model for calm readings - wind and weather - sea water overtopping barrier
26 Te Waihora area curve Lake height Lake area

27 Deriving the relationship between sea conditions and the excavation of the opening
28 Model output 134 actual openings model 137 (38 years) Modelling from 1 st January each year 133 Comparison with Maori openings What did the natural lake levels look like?
29 Number of openings dominated by the wave record Comparison between actual and modelled lake level
30
31 Maori management
32 Natural conditions
33 Thank you
Climate change impacts on Lake Ellesmere (Te Waihora)
") Climate change impacts on Lake Ellesmere (Te Waihora) NIWA Client Report: WLG2010-49 September 2010 NIWA Project: ENC10301 Climate change impacts on Lake Ellesmere (Te Waihora) James Renwick Graeme Horrell
Climate change impacts on Lake Ellesmere (Te Waihora) NIWA Client Report: WLG2010-49 September 2010 NIWA Project: ENC10301 Climate change impacts on Lake Ellesmere (Te Waihora) James Renwick Graeme Horrell
PRELIMINARY DRAFT FOR DISCUSSION PURPOSES
 Memorandum To: David Thompson From: John Haapala CC: Dan McDonald Bob Montgomery Date: February 24, 2003 File #: 1003551 Re: Lake Wenatchee Historic Water Levels, Operation Model, and Flood Operation This
Three main areas of work:
 Task 2: Climate Information 1 Task 2: Climate Information Three main areas of work: Collect historical and projected weather and climate data Conduct storm surge and wave modeling, sea-level rise (SLR)
Changing Hydrology under a Changing Climate for a Coastal Plain Watershed
 Changing Hydrology under a Changing Climate for a Coastal Plain Watershed David Bosch USDA-ARS, Tifton, GA Jeff Arnold ARS Temple, TX and Peter Allen Baylor University, TX SEWRU Objectives 1. Project changes
Technical Note: Hydrology of the Lukanga Swamp, Zambia
 Technical Note: Hydrology of the Lukanga Swamp, Zambia Matthew McCartney July 7 Description The Lukanga swamp is located approximately 5km west of the city of Kabwe, in the Central province of Zambia,
Chiang Rai Province CC Threat overview AAS1109 Mekong ARCC
 Chiang Rai Province CC Threat overview AAS1109 Mekong ARCC This threat overview relies on projections of future climate change in the Mekong Basin for the period 2045-2069 compared to a baseline of 1980-2005.
A Report on a Statistical Model to Forecast Seasonal Inflows to Cowichan Lake
 A Report on a Statistical Model to Forecast Seasonal Inflows to Cowichan Lake Prepared by: Allan Chapman, MSc, PGeo Hydrologist, Chapman Geoscience Ltd., and Former Head, BC River Forecast Centre Victoria
Drought in Southeast Colorado
 Drought in Southeast Colorado Nolan Doesken and Roger Pielke, Sr. Colorado Climate Center Prepared by Tara Green and Odie Bliss http://climate.atmos.colostate.edu 1 Historical Perspective on Drought Tourism
3.0 TECHNICAL FEASIBILITY
 3.0 TECHNICAL FEASIBILITY 3.1 INTRODUCTION To enable seasonal storage and release of water from Lake Wenatchee, an impoundment structure would need to be constructed on the lake outlet channel. The structure
Colorado s 2003 Moisture Outlook
 Colorado s 2003 Moisture Outlook Nolan Doesken and Roger Pielke, Sr. Colorado Climate Center Prepared by Tara Green and Odie Bliss http://climate.atmos.colostate.edu How we got into this drought! Fort
Attachment B to Technical Memorandum No.2. Operations Plan of Ross Valley Detention Basins
 Attachment B to Technical Memorandum No.2 Operations Plan of Ross Valley Detention Basins Operations Plan of Ross Valley Detention Basins Stetson Engineers Inc. January 26, 2011 1.0 Introduction Achieving
Jackson County 2013 Weather Data
 Jackson County 2013 Weather Data 61 Years of Weather Data Recorded at the UF/IFAS Marianna North Florida Research and Education Center Doug Mayo Jackson County Extension Director 1952-2008 Rainfall Data
Technical Note: Hydrology of the Lake Chilwa wetland, Malawi
 Technical Note: Hydrology of the Lake Chilwa wetland, Malawi Matthew McCartney June 27 Description Lake Chilwa is located in the Southern region of Malawi on the country s eastern boarder with Mozambique
The Climate of Seminole County
 The Climate of Seminole County Seminole County is part of the Crosstimbers. This region is a transition region from the Central Great Plains to the more irregular terrain of southeastern Oklahoma. Average
Stream Discharge and the Water Budget
 Regents Earth Science Unit 6: Water Cycle & Climate Name: Lab # Stream Discharge and the Water Budget Introduction: The United States Geological Survey (USGS) measures and publishes values for the daily
2003 Moisture Outlook
 2003 Moisture Outlook Nolan Doesken and Roger Pielke, Sr. Colorado Climate Center Prepared by Tara Green and Odie Bliss http://climate.atmos.colostate.edu Through 1999 Through 1999 Fort Collins Total Water
Hydrologic budget of the ORW mitigation wetland, 2002
 Billabong Hydrology 2002 81 Hydrologic budget of the ORW mitigation wetland, 2002 Li Zhang and William J. Mitsch School of Natural Resources, The Ohio State University Introduction Understanding the hydrologic
AN ASSESSMENT OF THE RELATIONSHIP BETWEEN RAINFALL AND LAKE VICTORIA LEVELS IN UGANDA
 AN ASSESSMENT OF THE RELATIONSHIP BETWEEN RAINFALL AND LAKE VICTORIA LEVELS IN UGANDA BY CATHERINE MULINDE BA (Environmental Management), PGD (Meteorology) Teaching Assistant Department of Geography, Meteorology
Jackson County 2018 Weather Data 67 Years of Weather Data Recorded at the UF/IFAS Marianna North Florida Research and Education Center
 Jackson County 2018 Weather Data 67 Years of Weather Data Recorded at the UF/IFAS Marianna North Florida Research and Education Center Doug Mayo Jackson County Extension Director 1952-2008 Rainfall Data
Variability of Reference Evapotranspiration Across Nebraska
 Know how. Know now. EC733 Variability of Reference Evapotranspiration Across Nebraska Suat Irmak, Extension Soil and Water Resources and Irrigation Specialist Kari E. Skaggs, Research Associate, Biological
The Climate of Payne County
 The Climate of Payne County Payne County is part of the Central Great Plains in the west, encompassing some of the best agricultural land in Oklahoma. Payne County is also part of the Crosstimbers in the
8.1 Attachment 1: Ambient Weather Conditions at Jervoise Bay, Cockburn Sound
 8.1 Attachment 1: Ambient Weather Conditions at Jervoise Bay, Cockburn Sound Cockburn Sound is 20km south of the Perth-Fremantle area and has two features that are unique along Perth s metropolitan coast
The Climate of Kiowa County
 The Climate of Kiowa County Kiowa County is part of the Central Great Plains, encompassing some of the best agricultural land in Oklahoma. Average annual precipitation ranges from about 24 inches in northwestern
2 Groundwater Basin Monitoring
 Zone 7 Water Agency 2 Groundwater Basin Monitoring Programs 2.1 Climatological Monitoring 2 Groundwater Basin Monitoring Programs This section describes Zone 7's Climatological Monitoring Program which
APPENDIX A LAKE EVAPORATION
 APPENDICES APPENDIX A LAKE EVAPORATION 457 APPENDIX A LAKE EVAPORATION A.1 INTRODUCTION The net historic monthly inflows to Okanagan Lake as determined by change in lake storage and outflow corrected for
12 SWAT USER S MANUAL, VERSION 98.1
 12 SWAT USER S MANUAL, VERSION 98.1 CANOPY STORAGE. Canopy storage is the water intercepted by vegetative surfaces (the canopy) where it is held and made available for evaporation. When using the curve
PHYSICAL PROPERTIES TAHOE.UCDAVIS.EDU 8
 PHYSICAL PROPERTIES 8 Lake surface level Daily since 1900 Lake surface level varies throughout the year. Lake level rises due to high stream inflow, groundwater inflow, and precipitation directly onto
UWM Field Station meteorological data
 University of Wisconsin Milwaukee UWM Digital Commons Field Station Bulletins UWM Field Station Spring 992 UWM Field Station meteorological data James W. Popp University of Wisconsin - Milwaukee Follow
The Climate of Texas County
 The Climate of Texas County Texas County is part of the Western High Plains in the north and west and the Southwestern Tablelands in the east. The Western High Plains are characterized by abundant cropland
The Climate of Grady County
 The Climate of Grady County Grady County is part of the Central Great Plains, encompassing some of the best agricultural land in Oklahoma. Average annual precipitation ranges from about 33 inches in northern
2011 Flood: Technical Review of Lake Manitoba, Lake St. Martin and Assiniboine River Water Levels Summary
 2011 Flood: Technical Review of Lake Manitoba, Lake St. Martin and Assiniboine River Water Levels Summary October 2013 Introduction Manitoba experienced unprecedented flooding in 2011. While flooding was
Monthly Long Range Weather Commentary Issued: February 15, 2015 Steven A. Root, CCM, President/CEO
 Monthly Long Range Weather Commentary Issued: February 15, 2015 Steven A. Root, CCM, President/CEO sroot@weatherbank.com JANUARY 2015 Climate Highlights The Month in Review During January, the average
Climate Change Impact Assessment on Long Term Water Budget for Maitland Catchment in Southern Ontario
 215 SWAT CONFERENCE, PURDUE Climate Change Impact Assessment on Long Term Water Budget for Maitland Catchment in Southern Ontario By Vinod Chilkoti Aakash Bagchi Tirupati Bolisetti Ram Balachandar Contents
The Climate of Marshall County
 The Climate of Marshall County Marshall County is part of the Crosstimbers. This region is a transition region from the Central Great Plains to the more irregular terrain of southeastern Oklahoma. Average
PRELIMINARY ASSESSMENT OF SURFACE WATER RESOURCES - A STUDY FROM DEDURU OYA BASIN OF SRI LANKA
 PRELIMINARY ASSESSMENT OF SURFACE WATER RESOURCES - A STUDY FROM DEDURU OYA BASIN OF SRI LANKA THUSHARA NAVODANI WICKRAMAARACHCHI Hydrologist, Water Resources Secretariat of Sri Lanka, Room 2-125, BMICH,
Proposal to limit Namakan Lake to 1970 Upper Rule Curve for remainder of summer
 July 7, 214 Subject: Proposal to limit Namakan Lake to 197 Upper Rule Curve for remainder of summer Background: Flooding in 214 has resulted in the highest water levels on Namakan Lake since 1968, and
9. PROBABLE MAXIMUM PRECIPITATION AND PROBABLE MAXIMUM FLOOD
 9. PROBABLE MAXIMUM PRECIPITATION AND PROBABLE MAXIMUM FLOOD 9.1. Introduction Due to the size of Watana Dam and the economic importance of the Project to the Railbelt, the Probable Maximum Flood (PMF)
The Climate of Pontotoc County
 The Climate of Pontotoc County Pontotoc County is part of the Crosstimbers. This region is a transition region from the Central Great Plains to the more irregular terrain of southeast Oklahoma. Average
Drought Characterization. Examination of Extreme Precipitation Events
 Drought Characterization Examination of Extreme Precipitation Events Extreme Precipitation Events During the Drought For the drought years (1999-2005) daily precipitation data was analyzed to find extreme
What is happening to the Jamaican climate?
 What is happening to the Jamaican climate? Climate Change and Jamaica: Why worry? Climate Studies Group, Mona (CSGM) Department of Physics University of the West Indies, Mona Part 1 RAIN A FALL, BUT DUTTY
WHEN IS IT EVER GOING TO RAIN? Table of Average Annual Rainfall and Rainfall For Selected Arizona Cities
 WHEN IS IT EVER GOING TO RAIN? Table of Average Annual Rainfall and 2001-2002 Rainfall For Selected Arizona Cities Phoenix Tucson Flagstaff Avg. 2001-2002 Avg. 2001-2002 Avg. 2001-2002 October 0.7 0.0
Flood Inundation Mapping under different climate change scenarios in the upper Indus River Basin, Pakistan
 Flood Inundation Mapping under different climate change scenarios in the upper Indus River Basin, Pakistan Sohaib Baig (doctoral student) 16 November 2017 Disaster Prevention Research Institute 1 Kyoto
UK Flooding Feb 2003
 UK Flooding 2000 06 Feb 2003 Britain has taken a battering from floods in the last 5 years, with major events in 1998 and 2000, significant floods in 2001 and minor events in each of the other years. So
2015 Fall Conditions Report
 2015 Fall Conditions Report Prepared by: Hydrologic Forecast Centre Date: December 21 st, 2015 Table of Contents Table of Figures... ii EXECUTIVE SUMMARY... 1 BACKGROUND... 2 SUMMER AND FALL PRECIPITATION...
San Francisco Public Utilities Commission Hydrological Conditions Report For April 2014
 San Francisco Public Utilities Commission Hydrological Conditions Report For April 2014 J. Chester, C. Graham, A. Mazurkiewicz, & M. Tsang, May 13, 2014 Snow in the High Country The view from Bond Pass
2. PHYSICAL SETTING FINAL GROUNDWATER MANAGEMENT PLAN. 2.1 Topography. 2.2 Climate
 FINAL GROUNDWATER MANAGEMENT PLAN 2. PHYSICAL SETTING Lassen County is a topographically diverse area at the confluence of the Cascade Range, Modoc Plateau, Sierra Nevada and Basin and Range geologic provinces.
2003 Water Year Wrap-Up and Look Ahead
 2003 Water Year Wrap-Up and Look Ahead Nolan Doesken Colorado Climate Center Prepared by Odie Bliss http://ccc.atmos.colostate.edu Colorado Average Annual Precipitation Map South Platte Average Precipitation
REDWOOD VALLEY SUBAREA
 Independent Science Review Panel Conceptual Model of Watershed Hydrology, Surface Water and Groundwater Interactions and Stream Ecology for the Russian River Watershed Appendices A-1 APPENDIX A A-2 REDWOOD
The Climate of Bryan County
 The Climate of Bryan County Bryan County is part of the Crosstimbers throughout most of the county. The extreme eastern portions of Bryan County are part of the Cypress Swamp and Forest. Average annual
July, International SWAT Conference & Workshops
 July, 212 212 International SWAT Conference & Workshops Hydrological Modelling of Kosi and Gandak Basins using SWAT Model S. Dutta, Pritam Biswas, Sangita Devi, Suresh A Karth and Bimlesh kumar, Ganga
The Climate of Haskell County
 The Climate of Haskell County Haskell County is part of the Hardwood Forest. The Hardwood Forest is characterized by its irregular landscape and the largest lake in Oklahoma, Lake Eufaula. Average annual
Inflow Forecasting for Hydro Catchments. Ross Woods and Alistair McKerchar NIWA Christchurch
 Inflow Forecasting for Hydro Catchments Ross Woods and Alistair McKerchar NIWA Christchurch Inflows Water flowing into hydro storages Usually measured by monitoring the levels and outflows from hydro storages
Typical Hydrologic Period Report (Final)
") (DELCORA) (Final) November 2015 (Updated April 2016) CSO Long-Term Control Plant Update REVISION CONTROL REV. NO. DATE ISSUED PREPARED BY DESCRIPTION OF CHANGES 1 4/26/16 Greeley and Hansen Pg. 1-3,
(DELCORA) (Final) November 2015 (Updated April 2016) CSO Long-Term Control Plant Update REVISION CONTROL REV. NO. DATE ISSUED PREPARED BY DESCRIPTION OF CHANGES 1 4/26/16 Greeley and Hansen Pg. 1-3,
Weather and Climate of the Rogue Valley By Gregory V. Jones, Ph.D., Southern Oregon University
 Weather and Climate of the Rogue Valley By Gregory V. Jones, Ph.D., Southern Oregon University The Rogue Valley region is one of many intermountain valley areas along the west coast of the United States.
Water Supply Conditions and Outlook June 4, 2018
 Water Supply Conditions and Outlook June 4, 2018 Flow Forecasting & Operations Planning Water Security Agency Overview Water supply conditions across Saskatchewan are generally good with most reservoir
MONITORING THE EFFECTS OF CLIMATE CHANGE ON SPRINGS, SEEPS AND OTHER WATER NATIONAL PRESERVE
 MONITORING THE EFFECTS OF CLIMATE CHANGE ON SPRINGS, SEEPS AND OTHER WATER RESOURCES IN THE MOJAVE NATIONAL PRESERVE Boris Poff and Debra Hughson Mojave National Preserve, California CLIMATE CHANGE Predictions
RAINFALL AVERAGES AND SELECTED EXTREMES FOR CENTRAL AND SOUTH FLORIDA. Thomas K. MacVicar
 TECHNICAL PUBLICATION #83-2 March 1983 RAINFALL AVERAGES AND SELECTED EXTREMES FOR CENTRAL AND SOUTH FLORIDA by Thomas K. MacVicar "This public document was promulgated at an annual cost of $136.74, or
Climate also has a large influence on how local ecosystems have evolved and how we interact with them.
 The Mississippi River in a Changing Climate By Paul Lehman, P.Eng., General Manager Mississippi Valley Conservation (This article originally appeared in the Mississippi Lakes Association s 212 Mississippi
2016 Meteorology Summary
 2016 Meteorology Summary New Jersey Department of Environmental Protection AIR POLLUTION AND METEOROLOGY Meteorology plays an important role in the distribution of pollution throughout the troposphere,
2 Precipitation and Evaporation
 Zone 7 Water Agency 2.1 Program Description 2 Precipitation and Evaporation This section describes Zone 7's Climatological Monitoring Program which tracks rainfall and evaporation in the Valley. Zone 7
PH YSIC A L PROPERT IE S TERC.UCDAVIS.EDU
 PH YSIC A L PROPERT IE S 8 Lake surface level Daily since 1900 Lake surface level varies throughout the year. Lake level rises due to high stream inflow, groundwater inflow and precipitation directly onto
Hydrogeology and Simulated Effects of Future Water Use and Drought in the North Fork Red River Alluvial Aquifer: Progress Report
 Hydrogeology and Simulated Effects of Future Water Use and Drought in the North Fork Red River Alluvial Aquifer: Progress Report Developed in partnership with the Oklahoma Water Resources Board S. Jerrod
Investigation of Rainfall Trend in Jorhat Town, Assam, India
 EUROPEAN ACADEMIC RESEARCH Vol. II, Issue 7/ October 2014 ISSN 2286-4822 www.euacademic.org Impact Factor: 3.1 (UIF) DRJI Value: 5.9 (B+) Investigation of Rainfall Trend in Jorhat Town, MAYURAKSHI BHUYAN
Illinois State Water Survey Division
 Illinois State Water Survey Division SURFACE WATER SECTION SWS Miscellaneous Publication 108 SEDIMENT YIELD AND ACCUMULATION IN THE LOWER CACHE RIVER by Misganaw Demissie Champaign, Illinois June 1989
Rong Jiang. Map of River. Table of Basic Data. China 14. Serial No. : China-14
 Rong Jiang Map of River Table of Basic Data Name(s): Rong Jiang Location: Guangdong Province, Coastways China Area: 4,408 km 2 Serial No. : China-14 N 23 11' ~ 23 55' E 115 37' ~ 116 38' Length of the
4. THE HBV MODEL APPLICATION TO THE KASARI CATCHMENT
 Application of HBV model to the Kasari River, 1994 Page 1 of 6 Application of the HBV model to the Kasari river for flow modulation of catchments characterised by specific underlying features by R. Vedom,
SNOW AS POTENTIAL FLOOD THREAT
 SNOW AS POTENTIAL FLOOD THREAT DANIELA KYSELOVÁ, KATEŘINA HRUŠKOVÁ, ZORA SNOPKOVÁ Slovak hydrometeorological institute, Zelená 5, 974 04 Banská Bystrica, Slovakia In the physical-geographic conditions
The Climate of Murray County
 The Climate of Murray County Murray County is part of the Crosstimbers. This region is a transition between prairies and the mountains of southeastern Oklahoma. Average annual precipitation ranges from
ZUMWALT WEATHER AND CLIMATE ANNUAL REPORT ( )
") ZUMWALT WEATHER AND CLIMATE ANNUAL REPORT (26-29) FINAL DRAFT (9 AUGUST 21) J.D. HANSEN 1, R.V. TAYLOR 2, AND V.S. JANSEN 3 INTRODUCTION The Zumwalt Prairie in northeastern Oregon is a unique grassland
ZUMWALT WEATHER AND CLIMATE ANNUAL REPORT (26-29) FINAL DRAFT (9 AUGUST 21) J.D. HANSEN 1, R.V. TAYLOR 2, AND V.S. JANSEN 3 INTRODUCTION The Zumwalt Prairie in northeastern Oregon is a unique grassland
Monthly Long Range Weather Commentary Issued: APRIL 18, 2017 Steven A. Root, CCM, Chief Analytics Officer, Sr. VP,
 Monthly Long Range Weather Commentary Issued: APRIL 18, 2017 Steven A. Root, CCM, Chief Analytics Officer, Sr. VP, sroot@weatherbank.com MARCH 2017 Climate Highlights The Month in Review The average contiguous
Scarborough Tide Gauge
 Tide Gauge Location OS: 504898E 488622N WGS84: Latitude: 54 16' 56.990"N Longitude: 00 23' 25.0279"W Instrument Valeport 740 (Druck Pressure Transducer) Benchmarks Benchmark Description TGBM = 4.18m above
Causes of high PM 10 values measured in Denmark in 2006
 Causes of high PM 1 values measured in Denmark in 26 Peter Wåhlin and Finn Palmgren Department of Atmospheric Environment National Environmental Research Institute Århus University Denmark Prepared 2 October
Valenciano Reservoir Safe Yield Study. Prepared by: CSA Architects & Engineers, LLP
 Valenciano Reservoir Safe Yield Study Prepared by: CSA Architects & Engineers, LLP CSA Group Prepared for: Puerto Rico Aqueduct and Sewer Authority Planning TABLE OF CONTENTS 1 Introduction...1 1.1 Safe
Minnesota s Climatic Conditions, Outlook, and Impacts on Agriculture. Today. 1. The weather and climate of 2017 to date
 Minnesota s Climatic Conditions, Outlook, and Impacts on Agriculture Kenny Blumenfeld, State Climatology Office Crop Insurance Conference, Sep 13, 2017 Today 1. The weather and climate of 2017 to date
Monthly Long Range Weather Commentary Issued: APRIL 1, 2015 Steven A. Root, CCM, President/CEO
 Monthly Long Range Weather Commentary Issued: APRIL 1, 2015 Steven A. Root, CCM, President/CEO sroot@weatherbank.com FEBRUARY 2015 Climate Highlights The Month in Review The February contiguous U.S. temperature
Study of Hydrometeorology in a Hard Rock Terrain, Kadirischist Belt Area, Anantapur District, Andhra Pradesh
 Open Journal of Geology, 2012, 2, 294-300 http://dx.doi.org/10.4236/ojg.2012.24028 Published Online October 2012 (http://www.scirp.org/journal/ojg) Study of Hydrometeorology in a Hard Rock Terrain, Kadirischist
CoCoRaHS Monitoring Colorado s s Water Resources through Community Collaborations
 CoCoRaHS Monitoring Colorado s s Water Resources through Community Collaborations Nolan Doesken Colorado Climate Center Atmospheric Science Department Colorado State University Presented at Sustaining
Ice Phenomena on the Lower Vistula
 Geophysica (2011), 47(1 2), 57 67 Ice Phenomena on the Lower Vistula Wojciech Majewski Institute of Meteorology and Water Management, 61 Podleśna str. 01-673 Warsaw, Poland (Received: June 2010; Accepted:
Monthly Long Range Weather Commentary Issued: NOVEMBER 16, 2015 Steven A. Root, CCM, Chief Analytics Officer, Sr. VP, sales
 Monthly Long Range Weather Commentary Issued: NOVEMBER 16, 2015 Steven A. Root, CCM, Chief Analytics Officer, Sr. VP, sales sroot@weatherbank.com OCTOBER 2015 Climate Highlights The Month in Review The
Hydrologic Conditions in the Delaware River Basin
 2017 Hydrologic Conditions in the Delaware River Basin Prepared by Operations Staff June 2018 Hydrologic Highlights Hydrologic Conditions in the Delaware River Basin Annual Report 2017 At the start of
Which map shows the stream drainage pattern that most likely formed on the surface of this volcano? A) B)
 B)") 1. When snow cover on the land melts, the water will most likely become surface runoff if the land surface is A) frozen B) porous C) grass covered D) unconsolidated gravel Base your answers to questions
1. When snow cover on the land melts, the water will most likely become surface runoff if the land surface is A) frozen B) porous C) grass covered D) unconsolidated gravel Base your answers to questions
Tracking the Climate Of Northern Colorado Nolan Doesken State Climatologist Colorado Climate Center Colorado State University
 Tracking the Climate Of Northern Colorado Nolan Doesken State Climatologist Colorado Climate Center Colorado State University Northern Colorado Business Innovations November 20, 2013 Loveland, Colorado
Analysis of Rainfall and Other Weather Parameters under Climatic Variability of Parbhani ( )
") International Journal of Current Microbiology and Applied Sciences ISSN: 2319-7706 Volume 7 Number 06 (2018) Journal homepage: http://www.ijcmas.com Original Research Article https://doi.org/10.20546/ijcmas.2018.706.295
International Journal of Current Microbiology and Applied Sciences ISSN: 2319-7706 Volume 7 Number 06 (2018) Journal homepage: http://www.ijcmas.com Original Research Article https://doi.org/10.20546/ijcmas.2018.706.295
County Clare Flood Forecasting System
 County Clare Flood Forecasting System Paul Moroney BE (Civil), C. Eng. M.I.E.I. M.C.I.Arb. Head of the Environment Section Clare County Council (The views expressed in this paper represent the professional
Variability and trends in daily minimum and maximum temperatures and in diurnal temperature range in Lithuania, Latvia and Estonia
 Variability and trends in daily minimum and maximum temperatures and in diurnal temperature range in Lithuania, Latvia and Estonia Jaak Jaagus Dept. of Geography, University of Tartu Agrita Briede Dept.
Disentangling Impacts of Climate & Land Use Changes on the Quantity & Quality of River Flows in Southern Ontario
 Disentangling Impacts of Climate & Land Use Changes on the Quantity & Quality of River Flows in Southern Ontario by Trevor Dickinson & Ramesh Rudra, Water Resources Engineering University of Guelph Acknowledgements
National Integrated Drought Information System. Southeast US Pilot for Apalachicola- Flint-Chattahoochee River Basin 20-March-2012
 National Integrated Drought Information System Southeast US Pilot for Apalachicola- Flint-Chattahoochee River Basin 20-March-2012 Current drought status from Drought Monitor http://www.drought.unl.edu/dm/monitor.html
CHAPTER-11 CLIMATE AND RAINFALL
 CHAPTER-11 CLIMATE AND RAINFALL 2.1 Climate Climate in a narrow sense is usually defined as the "average weather", or more rigorously, as the statistical description in terms of the mean and variability
Jackson County 2014 Weather Data
 Jackson County 2014 Weather Data 62 Years of Weather Data Recorded at the UF/IFAS Marianna North Florida Research and Education Center Doug Mayo Jackson County Extension Director 1952-2008 Rainfall Data
The Colorado Drought of 2002 in Perspective
 The Colorado Drought of 2002 in Perspective Colorado Climate Center Nolan Doesken and Roger Pielke, Sr. Prepared by Tara Green and Odie Bliss http://climate.atmos.colostate.edu Known Characteristics of
Regional Climate Change: Current Impacts and Perspectives Greater Lake Nipissing Stewardship Council Annual Meeting Wednesday April 16, 2014
 Regional Climate Change: Current Impacts and Perspectives Greater Lake Nipissing Stewardship Council Annual Meeting Wednesday April 16, 2014 Speaker: Peter Bullock, Stantec Consulting Information Source:
Lower Tuolumne River Accretion (La Grange to Modesto) Estimated daily flows ( ) for the Operations Model Don Pedro Project Relicensing
 Estimated daily flows ( ) for the Operations Model Don Pedro Project Relicensing") Lower Tuolumne River Accretion (La Grange to Modesto) Estimated daily flows (1970-2010) for the Operations Model Don Pedro Project Relicensing 1.0 Objective Using available data, develop a daily time series
Lower Tuolumne River Accretion (La Grange to Modesto) Estimated daily flows (1970-2010) for the Operations Model Don Pedro Project Relicensing 1.0 Objective Using available data, develop a daily time series
NASA Products to Enhance Energy Utility Load Forecasting
 NASA Products to Enhance Energy Utility Load Forecasting Erica Zell, Battelle zelle@battelle.org, Arlington, VA ESIP 2010 Summer Meeting, Knoxville, TN, July 20-23 Project Overview Funded by the NASA Applied
Champaign-Urbana 2000 Annual Weather Summary
 Champaign-Urbana 2000 Annual Weather Summary ILLINOIS STATE WATER SURVEY 2204 Griffith Dr. Champaign, IL 61820 wxobsrvr@sws.uiuc.edu Maria Peters, Weather Observer January: January started on a mild note,
Meteorological Data recorded at Armagh Observatory from 1795 to 2001: Volume I - Daily, Monthly and Annual Rainfall
 Meteorological Data recorded at Armagh Observatory from 1795 to 2001: Volume I - Daily, Monthly and Annual Rainfall 1838-2001 A. M. García-Suárez, C.J. Butler, D. Cardwell, A.D.S. Coughlin, A. Donnelly,
Missouri River Basin Water Management Monthly Update
 Missouri River Basin Water Management Monthly Update Participating Agencies 255 255 255 237 237 237 0 0 0 217 217 217 163 163 163 200 200 200 131 132 122 239 65 53 80 119 27 National Oceanic and Atmospheric
Watershed simulation and forecasting system with a GIS-oriented user interface
 HydroGIS 96: Application of Geographic Information Systems in Hydrology and Water Resources Management (Proceedings of the Vienna Conference, April 1996). IAHS Publ. no. 235, 1996. 493 Watershed simulation
N 2 3. Lake Huron. St. Clair River. Black River Assessment. Figure 1. Major tributaries to the Black River. 1. Berry Drain 2. Elk Creek.
 1. Berry Drain 2. Elk Creek Deckerville 3. Arnot Creek 4. Black Creek 5. Silver Creek 6. Plum Creek 7. Mill Creek 1 Sandusky Carsonville 8. Stocks Creek Applegate N 2 3 Croswell Peck 0 5 10 Brown City
Study 16.5 Probable Maximum Flood (PMF)
") Initial Study Report Meeting Study 16.5 Probable Maximum Flood (PMF) March 30, 2016 Prepared by 3/30/2016 1 Study 16.5 Status ISR documents (ISR Part D Overview): Status: Initial Study Report: Parts A,
Initial Study Report Meeting Study 16.5 Probable Maximum Flood (PMF) March 30, 2016 Prepared by 3/30/2016 1 Study 16.5 Status ISR documents (ISR Part D Overview): Status: Initial Study Report: Parts A,
Climate Variability. Eric Salathé. Climate Impacts Group & Department of Atmospheric Sciences University of Washington. Thanks to Nathan Mantua
 Climate Variability Eric Salathé Climate Impacts Group & Department of Atmospheric Sciences University of Washington Thanks to Nathan Mantua Northwest Climate: the mean Factors that influence local/regional