Regional Climate Change: Current Impacts and Perspectives Greater Lake Nipissing Stewardship Council Annual Meeting Wednesday April 16, 2014
|
|
|
- Margaret Newton
- 5 years ago
- Views:
Transcription


1 Regional Climate Change: Current Impacts and Perspectives Greater Lake Nipissing Stewardship Council Annual Meeting Wednesday April 16, 2014 Speaker: Peter Bullock, Stantec Consulting

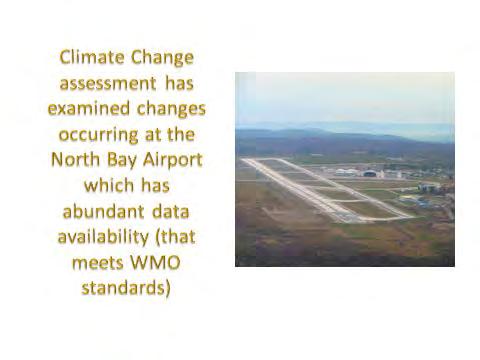
2 Information Source: This presentation is based on work completed for the North Bay- Mattawa Conservation Authority as part of the Integrated Watershed Management Strategy which is still in progress.

3 Study Area: North Bay-Mattawa Conservation Authority


4 Region climatic characteristics are determined from 14 Stations covering a period of 125 years
5 North Bay Airport Chisholm Township
 o C NB Airport 3.")
6 . (3.5 4 o C) Average Annual Temperatures Drinking Water Source Protection: Watershed Characterization, (4 4.5 o C) o C NB Airport 3.8 C Powassan 4.2 C

7 mm/yr. Average Annual Precipitation mm/yr mm/yr NB Airport 1007 mm/yr Powassan 936 mm/yr

8 Known Regional Factors (from previous studies) Lake Nipissing and Georgian Bay have a moderating effect on regional temperatures; Northern Uplands and Almaguin Highlands experience an orographic rainfall effect due to higher elevations The Lake Nipissing basin and the Mattawa lowlands are in a rain shadow and subject to temperature inversions An urban heat island effect occurs over North Bay.
9
10

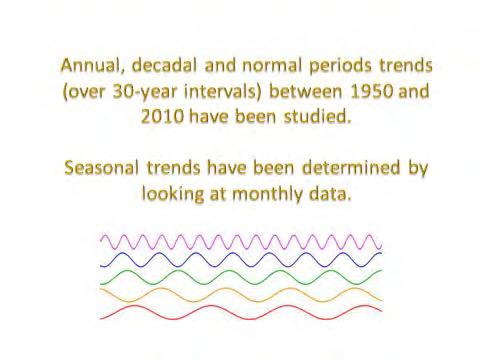
11 C/yr North Bay Airport o C per year since 1950 Trend not evenly distributed

12 8 of the 10 warmest years since records began at the NB Airport have occurred since was warmest year on record
13 Mean Max/Decade o C Mean Ave/Decade o C Mean Min/Decade o C Until 1980 s average temps were actually declining 1950 and no significant change In 2000 s average temps started trending higher more influenced by rising minimums
14 Normal Mean Max o C Normal Mean Average O C Normal Mean Min o C mean temperatures have increased by 0.67 o C between and which is on par with temperature increases reported globally.
 and February (+ 0.")
15 Monthly Normal Temperatures C Monthly Normal Temperatures c Temperatures have increased in every month except October Smallest shift is in October/November greatest shift is in December ( o C) and February ( o C)

16 + 2.6 mm/yr precipitation is increasing at an average rate of 2.6 mm/year.
.")
17 5 of the 10 wettest years at the NB Airport have happened since 1998 (all exceeded 1200 mm/year) was the wettest year on record.
18 1960 s - lowest total precipitation 2000 s - highest Rainfall shaped total precipitation until the decade of the 2000 s when snowfall had the greatest influence
19 Overall precipitation is trending higher mm over the 4 normal periods Rainfall shows a steady increase Snowfall was relatively flat until latest normal period


20 September receives most precipitation precipitation is stable or increasing in every month except for August. Precipitation is increasing most in spring and fall with May and October having the largest monthly increases


21 Stantec has examined the water balance of a forested environment typically found within the region Stantec s interest was to examine what changes were occurring over time Assessment assumes that all water not lost to evapotranspiration ends up as runoff.


22 Input Input Main difference is timing of release of water to the environment Same trend as precipitation on an annual basis

 have occurred")
23 Output Output ET is not very responsive to annual T & P fluctuation 6 of 7 years that ET exceeded 600 mm/yr) have occurred since 1997


24 Output Annual Average Runoff is adjusting more rapidly Runoff is more responsive to fluctuating T & P and is becoming more erratic over time.

25 Illustration of monthly water balance characteristics - very complex with huge month-tomonth variations Wettest time of the year (Rain + Snow Melt) is March/ April followed by September (Rain) Evapotranspiration directly responds to temperature and directly affects runoff When ET exceeds P - runoff is lowest and dependent on lake and aquifer storage to maintain flows Runoff is highest in April/Nov

26 Table 7.7: Hydrologic Water Balance Calculations for Normal Periods North Bay Airport* Normal Rain and Evapo- Runoff Period Snow Melt transpiration (mm) (mm) % (mm) % Runoff is gaining on evapotranspiration as a water loss factor. Storage is assumed to remain constant in the long term

27 AE is increasing in every month except Oct/Nov which reflects monthly temperature trends

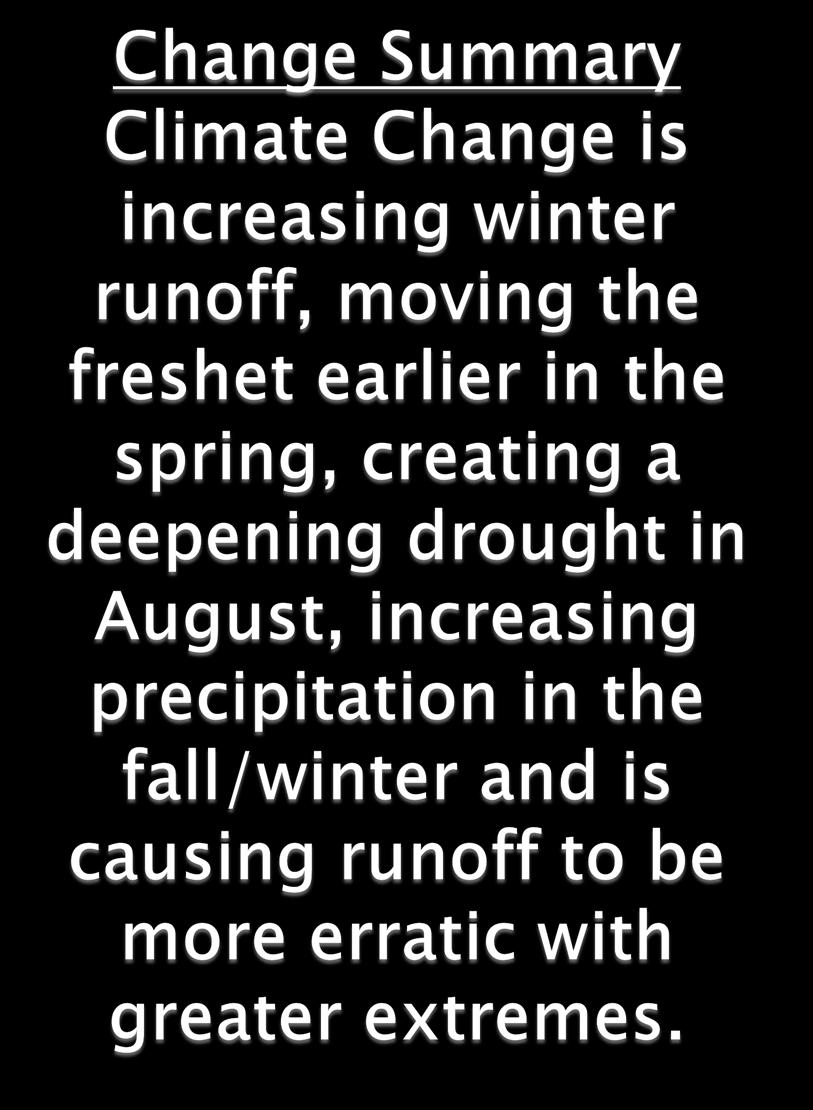
28 Runoff has doubled during the winter period Freshet has shifted from early April to late March and slightly deminished The summer low runoff period is shifting later in the summer and deepening The period between freshet and low summer runoff is widening Runoff is also increasing in Oct Dec period


29 Section 3: Regional Factors Affecting Climate 1. Great Lakes (and Lake Nipissing) influencing regional precipitation Winter Summer

30 Lake Effect - Winter
31 Winter precipitation is greatest where there is a large open fetch of water relative to the prevailing winds (out of the NW) Precipitation accumulations are highest at the edge of the lake and diminishes with distance Lake effect is most pronounced in December/January Shows NBMCA was at the edge of this influence zone during the period

32 Climate Change Impacts to Great Lakes Ice Coverage Ice coverage as of January 22, 2013 Between 1972 and 2010 ice coverage on Lake Huron declined by 62% Ice is forming later and dissipating earlier As northern ice on Georgian Bay\Lake Huron disappears lake effect impacts are starting to encroach into the NBMCA area Ice Concentrations April 10/2014

33 Dec Jan Feb Mar Apr

34 Dec Jan Feb Mar Apr

35 Orographic Effect - Summer

36
37
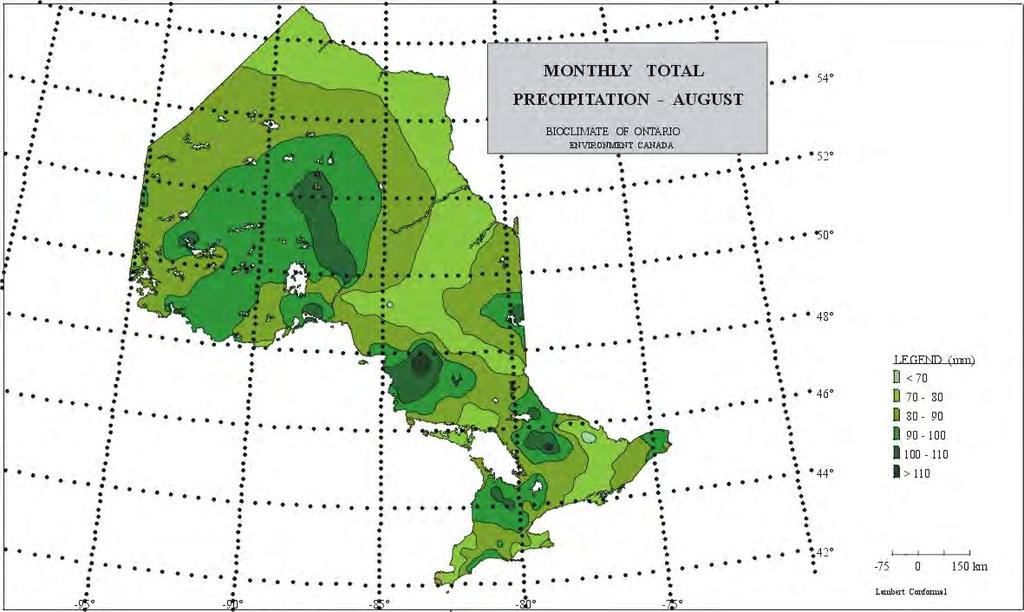
38 Regional Factors Affecting Climate: 2. Declining August precipitation may reflect changing regional transpiration rates August precipitation rates are declining at a time when Great Lakes evaporation rates should be high Forest transpiration may be evolving as the growing seasons shift earlier causing transpiration to decline by late summer.
39
40 Regional Factors Affecting Climate: 3. Topography affects Regional Temperature and Precipitation North Bay Airport data was compared to Powassan

41 Powassan experiences warmer mean temperatures in every month except August Powassan annually is +0.4 o C warmer compared to the North Bay Airport

42 Precipitation pattern is similar North Bay Airport receives more precipitation in most months except in the summer Powassan receives less precipitation overall due to lower elevations Lake Nipissing likely has a significant summer influence but cannot be assessed due to a lack of data
43 Regional Factors Affecting Climate: 4. North Bay Airport Precipitation was compared to monthly precipitation of other regions North Bay Airport monthly precipitation was compared to Ottawa, Sudbury and Huntsville for the period

44 Precipitation in the winter period is remarkable similar North Bay receives about 10% more precipitation Higher precipitation is attributed to North Bay being influenced by the Great Lakes and Lake Nipissing
45 Sudbury s winter precipitation pattern similar to NB Sudbury receives less precipitation in the summer because it is in the lee of Manitoulin Island and has less orographic exposure (348 m) Sudbury may be affected by lack of vegetation in the region from historic mining impacts
46 Winter precipitation in Huntsville is directly effected by lake effect (Dec/Jan) Huntsville receives almost as much precipitation in January as in September Summer precipitation is less because of reduced fetch exposure to GB/LH and it s at a lower elevation (320 m)
 Global warming is causing severe weather events to increase in all categories, driven by more energy trapped within the")
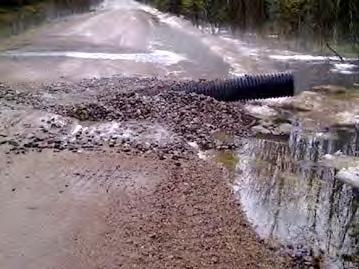
47 Flooding and Erosion Events are typically caused by: Spring freshet which is exacerbated by rain Intense thunderstorms Tropical storms (including decadent hurricanes) Global warming is causing severe weather events to increase in all categories, driven by more energy trapped within the troposphere.

48 Insurance Bureau of Canada examined the frequency of severe weather events in Canada: The number of days with extreme heat, which can cause intense rainfall events, have increased Water conveyance infrastructures such as storm sewers, bridge openings, and constructed channels that use probability information to determine appropriate sizing are being affected In some parts of Canada, storms once experienced every 40 years are now being observed every 6 years on average
49 In the 60 year period the average number of extreme heat days increased from 1.5 to 3 events/year 2005 had the highest number =14

50 Highest probability month has shifted from July to August in 2000 s Period of extreme heat probability is widening to cover all summer months

51 An intense thunderstorm hit Bonfield and East Ferris on August 5, 2008 that resulted in extensive flooding - rainfall near the center of the impact zone exceeded 120 mm over a 6 hour period (est. to be ~ 1:200 year event?) The severity of this event was not captured at either active weather station based on data obtained from amateur sources

52 This historic radar image is for August 5, 2008 at 4:00 pm as the storm started to impact East Ferris as indicated by the red arrow

53 Storm lasted ~ 8 hrs
 Projections are based on an A2 - High Emission")
54 Section 5: Climate Change Projections: Stantec populated Temperature and Precipitation projections for North Bay and Powassan using a tool called the Localizer (from Canadian Climate Change Scenarios Network) Projections are based on an A2 - High Emission Scenario


55 C annual winter spring summer autumn s 5.1 ± ± ± ± ± s 6.6 ± ± ± ± ± s 8.5 ± ± ± ± ± 1.0 Comparable to mean annual temperature of Orillia 6.5 o C
56 mm annual winter spring summer autumn s ± ± ± ± ± s ± ± ± ± ± s ± ± ± ± ± Annual Precipitation to increase by ~80 mm by 2050 Annual Precipitation projected for the 2020 s has already been reached? ( normal period averaged 1044 mm at the NB Airport Precipitation is projected to increase in every season except for the summer period


57 C annual winter spring summer autumn s 5.5 ± ± ± ± ± s 6.9 ± ± ± ± ± s 8.7 ± ± ± ± ± 0.9 Comparable to mean annual temperature for Barrie 6.7 o C

58 mm annual winter spring summer autumn s ± ± ± ± ± s ± ± ± ± ± s ± ± ± ± ± 33.3 Annual average precipitation to increase by ~ 60 mm by 2050 Same summer declining trend as NB Airport
59 North Bay Airport "Record Years" Precipitation Temperature Rain Snow Total Max Mean Min nd rd th th th th nd th st rd th st 9 of 15 are record setting years
60
61
62 An abrupt change in 1997/98 has transformed the region into a new climatic period and this shift is reverberating through climatic normals for the region The concept of normal is now outdated or a misnomer. Climate is no longer static it now is a dynamic variable 2014 so far has seen an unexpected extreme which may be a fluke year or a sign that something else at a global scale has shifted and open the door to the Polar Vortex Only time will tell!

63 Thank You! I like to express my thanks to the North Bay - Mattawa Conservation Authority for conducting climate research and allowing the data to be used in this presentation
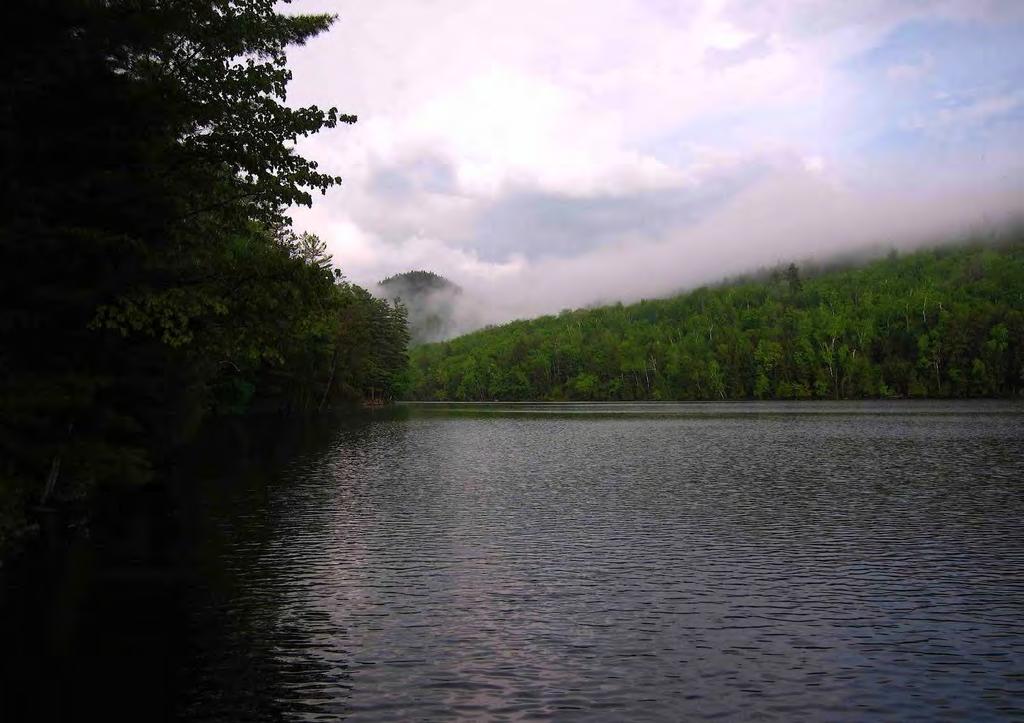
Climate also has a large influence on how local ecosystems have evolved and how we interact with them.
 The Mississippi River in a Changing Climate By Paul Lehman, P.Eng., General Manager Mississippi Valley Conservation (This article originally appeared in the Mississippi Lakes Association s 212 Mississippi
Chiang Rai Province CC Threat overview AAS1109 Mekong ARCC
 Chiang Rai Province CC Threat overview AAS1109 Mekong ARCC This threat overview relies on projections of future climate change in the Mekong Basin for the period 2045-2069 compared to a baseline of 1980-2005.
January 25, Summary
 January 25, 2013 Summary Precipitation since the December 17, 2012, Drought Update has been slightly below average in parts of central and northern Illinois and above average in southern Illinois. Soil
Three main areas of work:
 Task 2: Climate Information 1 Task 2: Climate Information Three main areas of work: Collect historical and projected weather and climate data Conduct storm surge and wave modeling, sea-level rise (SLR)
Changing Hydrology under a Changing Climate for a Coastal Plain Watershed
 Changing Hydrology under a Changing Climate for a Coastal Plain Watershed David Bosch USDA-ARS, Tifton, GA Jeff Arnold ARS Temple, TX and Peter Allen Baylor University, TX SEWRU Objectives 1. Project changes
Champaign-Urbana 2000 Annual Weather Summary
 Champaign-Urbana 2000 Annual Weather Summary ILLINOIS STATE WATER SURVEY 2204 Griffith Dr. Champaign, IL 61820 wxobsrvr@sws.uiuc.edu Maria Peters, Weather Observer January: January started on a mild note,
Champaign-Urbana 2001 Annual Weather Summary
 Champaign-Urbana 2001 Annual Weather Summary ILLINOIS STATE WATER SURVEY 2204 Griffith Dr. Champaign, IL 61820 wxobsrvr@sws.uiuc.edu Maria Peters, Weather Observer January: After a cold and snowy December,
Great Lakes Update. Volume 199: 2017 Annual Summary. Background
 Great Lakes Update Volume 199: 2017 Annual Summary Background The U.S. Army Corps of Engineers (USACE) tracks and forecasts the water levels of each of the Great Lakes. This report is primarily focused
Great Lakes Update. Volume 188: 2012 Annual Summary
 Great Lakes Update Volume 188: 2012 Annual Summary Background The U.S. Army Corps of Engineers (USACE) tracks the water levels of each of the Great Lakes. This report highlights hydrologic conditions of
Champaign-Urbana 1999 Annual Weather Summary
 Champaign-Urbana 1999 Annual Weather Summary ILLINOIS STATE WATER SURVEY 2204 Griffith Dr. Champaign, IL 61820 wxobsrvr@sws.uiuc.edu Maria Peters, Weather Observer A major snowstorm kicked off the new
2016 Fall Conditions Report
 2016 Fall Conditions Report Prepared by: Hydrologic Forecast Centre Date: December 13, 2016 Table of Contents TABLE OF FIGURES... ii EXECUTIVE SUMMARY... 1 BACKGROUND... 5 SUMMER AND FALL PRECIPITATION...
Great Lakes Update. Volume 191: 2014 January through June Summary. Vol. 191 Great Lakes Update August 2014
 Great Lakes Update Volume 191: 2014 January through June Summary The U.S. Army Corps of Engineers (USACE) monitors the water levels of each of the Great Lakes. This report provides a summary of the Great
What is happening to the Jamaican climate?
 What is happening to the Jamaican climate? Climate Change and Jamaica: Why worry? Climate Studies Group, Mona (CSGM) Department of Physics University of the West Indies, Mona Part 1 RAIN A FALL, BUT DUTTY
Champaign-Urbana 1998 Annual Weather Summary
 Champaign-Urbana 1998 Annual Weather Summary ILLINOIS STATE WATER SURVEY Audrey Bryan, Weather Observer 2204 Griffith Dr. Champaign, IL 61820 wxobsrvr@sparc.sws.uiuc.edu The development of the El Nìno
Great Lakes Update. Volume 194: 2015 Annual Summary
 Great Lakes Update Volume 194: 2015 Annual Summary Background The U.S. Army Corps of Engineers (USACE) tracks and forecasts the water levels of each of the Great Lakes. This report summarizes the hydrologic
Minnesota s Climatic Conditions, Outlook, and Impacts on Agriculture. Today. 1. The weather and climate of 2017 to date
 Minnesota s Climatic Conditions, Outlook, and Impacts on Agriculture Kenny Blumenfeld, State Climatology Office Crop Insurance Conference, Sep 13, 2017 Today 1. The weather and climate of 2017 to date
2015 Fall Conditions Report
 2015 Fall Conditions Report Prepared by: Hydrologic Forecast Centre Date: December 21 st, 2015 Table of Contents Table of Figures... ii EXECUTIVE SUMMARY... 1 BACKGROUND... 2 SUMMER AND FALL PRECIPITATION...
Extreme Weather and Climate Change: the big picture Alan K. Betts Atmospheric Research Pittsford, VT NESC, Saratoga, NY
 Extreme Weather and Climate Change: the big picture Alan K. Betts Atmospheric Research Pittsford, VT http://alanbetts.com NESC, Saratoga, NY March 10, 2018 Increases in Extreme Weather Last decade: lack
The hydrologic service area (HSA) for this office covers Central Kentucky and South Central Indiana.
 for this office covers Central Kentucky and South Central Indiana.") January 2012 February 13, 2012 An X inside this box indicates that no flooding occurred within this hydrologic service area. January 2012 continued the string of wet months this winter. Rainfall was generally
January 2012 February 13, 2012 An X inside this box indicates that no flooding occurred within this hydrologic service area. January 2012 continued the string of wet months this winter. Rainfall was generally
Future Weather in Toronto and the GTA
 Future Weather in Toronto and the GTA Due to Climate Change Electrical Sector Meeting, Nov. 23 rd, 2011 Christopher Ll. Morgan, PhD Toronto Environment Office Contents 2 Introduction (Why We Did What We
A Report on a Statistical Model to Forecast Seasonal Inflows to Cowichan Lake
 A Report on a Statistical Model to Forecast Seasonal Inflows to Cowichan Lake Prepared by: Allan Chapman, MSc, PGeo Hydrologist, Chapman Geoscience Ltd., and Former Head, BC River Forecast Centre Victoria
Climate of Columbus. Aaron Wilson. Byrd Polar & Climate Research Center State Climate Office of Ohio.
 Climate of Columbus Aaron Wilson Byrd Polar & Climate Research Center http://bpcrc.osu.edu/greenteam Overview Historical Climatology Climate Change & Impacts Projected Changes Summary 2 Historical Climatology
Storm and Runoff Calculation Standard Review Snowmelt and Climate Change
 Storm and Runoff Calculation Standard Review Snowmelt and Climate Change Presented by Don Moss, M.Eng., P.Eng. and Jim Hartman, P.Eng. Greenland International Consulting Ltd. Map from Google Maps TOBM
Drought in Southeast Colorado
 Drought in Southeast Colorado Nolan Doesken and Roger Pielke, Sr. Colorado Climate Center Prepared by Tara Green and Odie Bliss http://climate.atmos.colostate.edu 1 Historical Perspective on Drought Tourism
Variability of Reference Evapotranspiration Across Nebraska
 Know how. Know now. EC733 Variability of Reference Evapotranspiration Across Nebraska Suat Irmak, Extension Soil and Water Resources and Irrigation Specialist Kari E. Skaggs, Research Associate, Biological
A SURVEY OF HYDROCLIMATE, FLOODING, AND RUNOFF IN THE RED RIVER BASIN PRIOR TO 1870
 A SURVEY OF HYDROCLIMATE, FLOODING, AND RUNOFF IN THE RED RIVER BASIN PRIOR TO 1870 W. F. RANNIE (UNIVERSITY OF WINNIPEG) Prepared for the Geological Survey of Canada September, 1998 TABLE OF CONTENTS
Colorado s 2003 Moisture Outlook
 Colorado s 2003 Moisture Outlook Nolan Doesken and Roger Pielke, Sr. Colorado Climate Center Prepared by Tara Green and Odie Bliss http://climate.atmos.colostate.edu How we got into this drought! Fort
Climate Change and Stormwater. Daniel Brown, Research Associate, GLISA
 Climate Change and Stormwater Daniel Brown, Research Associate, GLISA Global Trends and Regional Trends Global trends are more certain than regional trends. Natural variability plays a larger role at the
Monthly Long Range Weather Commentary Issued: SEPTEMBER 19, 2016 Steven A. Root, CCM, Chief Analytics Officer, Sr. VP,
 Monthly Long Range Weather Commentary Issued: SEPTEMBER 19, 2016 Steven A. Root, CCM, Chief Analytics Officer, Sr. VP, sroot@weatherbank.com SEPTEMBER 2016 Climate Highlights The Month in Review The contiguous
Great Lakes Update. Great Lakes Winter and Spring Summary January June Vol. 187 Great Lakes Update August 2012
 Great Lakes Update Great Lakes Winter and Spring Summary January June 2012 The US Army Corps of Engineers (USACE) Detroit District monitors hydraulic and hydrologic conditions of the Great Lakes. This
5.0 WHAT IS THE FUTURE ( ) WEATHER EXPECTED TO BE?
 WEATHER EXPECTED TO BE?") 5.0 WHAT IS THE FUTURE (2040-2049) WEATHER EXPECTED TO BE? This chapter presents some illustrative results for one station, Pearson Airport, extracted from the hour-by-hour simulations of the future period
5.0 WHAT IS THE FUTURE (2040-2049) WEATHER EXPECTED TO BE? This chapter presents some illustrative results for one station, Pearson Airport, extracted from the hour-by-hour simulations of the future period
The Climate of Haskell County
 The Climate of Haskell County Haskell County is part of the Hardwood Forest. The Hardwood Forest is characterized by its irregular landscape and the largest lake in Oklahoma, Lake Eufaula. Average annual
Current Climate Trends and Implications
 Current Climate Trends and Implications Dr. Mark Seeley Professor emeritus Department of Soil, Water, and Climate University of Minnesota St Paul, MN 55108 Crop Insurance Conference September 12, 2018
Great Lakes Update. Volume 193: 2015 January through June Summary. Vol. 193 Great Lakes Update August 2015
 Great Lakes Update Volume 193: 2015 January through June Summary The U.S. Army Corps of Engineers (USACE) monitors the water levels of each of the Great Lakes. This report provides a summary of the Great
2017 Fall Conditions Report
 2017 Fall Conditions Report Prepared by: Hydrologic Forecast Centre Date: November 15, 2017 Table of Contents TABLE OF FIGURES... ii EXECUTIVE SUMMARY... 1 BACKGROUND... 4 SUMMER AND FALL PRECIPITATION...
Local Ctimatotogical Data Summary White Hall, Illinois
 SWS Miscellaneous Publication 98-5 STATE OF ILLINOIS DEPARTMENT OF ENERGY AND NATURAL RESOURCES Local Ctimatotogical Data Summary White Hall, Illinois 1901-1990 by Audrey A. Bryan and Wayne Armstrong Illinois
8.1 Attachment 1: Ambient Weather Conditions at Jervoise Bay, Cockburn Sound
 8.1 Attachment 1: Ambient Weather Conditions at Jervoise Bay, Cockburn Sound Cockburn Sound is 20km south of the Perth-Fremantle area and has two features that are unique along Perth s metropolitan coast
The Climate of Bryan County
 The Climate of Bryan County Bryan County is part of the Crosstimbers throughout most of the county. The extreme eastern portions of Bryan County are part of the Cypress Swamp and Forest. Average annual
The Climate of Oregon Climate Zone 4 Northern Cascades
 /05 E55 Unbound issue No. 9/ is Does not circulate Special Report 916 May 1993 The Climate of Oregon Climate Zone 4 Property of OREGON STATE UNIVERSITY Library Serials Corvallis, OR 97331-4503 Agricultural
The Climate of Marshall County
 The Climate of Marshall County Marshall County is part of the Crosstimbers. This region is a transition region from the Central Great Plains to the more irregular terrain of southeastern Oklahoma. Average
b) occurs before the anvil shape at the top of the cloud has formed. c) is marked by an absence of significant downdrafts.
 occurs before the anvil shape at the top of the cloud has formed. c) is marked by an absence of significant downdrafts.") Thunderstorms Question 1 The only requirement for a thunderstorm is: a) sinking air. b) upper level convergence. c) still air. d) rising air. Question 2 The mature stage of air-mass thunderstorms: a) is
Thunderstorms Question 1 The only requirement for a thunderstorm is: a) sinking air. b) upper level convergence. c) still air. d) rising air. Question 2 The mature stage of air-mass thunderstorms: a) is
Definitions Weather and Climate Climates of NYS Weather Climate 2012 Characteristics of Climate Regions of NYS NYS s Climates 1.
 Definitions Climates of NYS Prof. Anthony Grande 2012 Weather and Climate Weather the state of the atmosphere at one point in time. The elements of weather are temperature, t air pressure, wind and moisture.
Sierra Weather and Climate Update
 Sierra Weather and Climate Update 2014-15 Kelly Redmond Western Regional Climate Center Desert Research Institute Reno Nevada Yosemite Hydroclimate Workshop Yosemite Valley, 2015 October 8-9 Percent of
Minnesota s Changing Climate: Winter Impacts
 Minnesota s Changing Climate: Winter Impacts Dr. Mark Seeley Climatologist/Meteorologist Dept of Soil, Water, and Climate University of Minnesota 15 th Annual Road Salt Symposium Minnesota Landscape Arboretum
CFCAS project: Assessment of Water Resources Risk and Vulnerability to Changing Climatic Conditions. Project Report II.
 CFCAS project: Assessment of Water Resources Risk and Vulnerability to Changing Climatic Conditions Project Report II. January 2004 Prepared by and CFCAS Project Team: University of Western Ontario Slobodan
The Climate of Grady County
 The Climate of Grady County Grady County is part of the Central Great Plains, encompassing some of the best agricultural land in Oklahoma. Average annual precipitation ranges from about 33 inches in northern
The Climate of Pontotoc County
 The Climate of Pontotoc County Pontotoc County is part of the Crosstimbers. This region is a transition region from the Central Great Plains to the more irregular terrain of southeast Oklahoma. Average
Flood Risk Assessment
 Flood Risk Assessment February 14, 2008 Larry Schick Army Corps of Engineers Seattle District Meteorologist General Assessment As promised, La Nina caused an active winter with above to much above normal
Investigation IV: Seasonal Precipitation and Seasonal Surface Runoff in the US
 Investigation IV: Seasonal Precipitation and Seasonal Surface Runoff in the US Purpose Students will consider the seasonality of precipitation and surface runoff and think about how the time of year can
Climates of NYS. Definitions. Climate Regions of NYS. Storm Tracks. Climate Controls 10/13/2011. Characteristics of NYS s Climates
 Definitions Climates of NYS Prof. Anthony Grande 2011 Weather and Climate Weather the state of the atmosphere at one point in time. The elements of weather are temperature, air pressure, wind and moisture.
The Climate of Payne County
 The Climate of Payne County Payne County is part of the Central Great Plains in the west, encompassing some of the best agricultural land in Oklahoma. Payne County is also part of the Crosstimbers in the
SEPTEMBER 2013 REVIEW
 Monthly Long Range Weather Commentary Issued: October 21, 2013 Steven A. Root, CCM, President/CEO sroot@weatherbank.com SEPTEMBER 2013 REVIEW Climate Highlights The Month in Review The average temperature
The Climate of Kiowa County
 The Climate of Kiowa County Kiowa County is part of the Central Great Plains, encompassing some of the best agricultural land in Oklahoma. Average annual precipitation ranges from about 24 inches in northwestern
2015: A YEAR IN REVIEW F.S. ANSLOW
 2015: A YEAR IN REVIEW F.S. ANSLOW 1 INTRODUCTION Recently, three of the major centres for global climate monitoring determined with high confidence that 2015 was the warmest year on record, globally.
Monthly Long Range Weather Commentary Issued: February 15, 2015 Steven A. Root, CCM, President/CEO
 Monthly Long Range Weather Commentary Issued: February 15, 2015 Steven A. Root, CCM, President/CEO sroot@weatherbank.com JANUARY 2015 Climate Highlights The Month in Review During January, the average
1 What Is Climate? TAKE A LOOK 2. Explain Why do areas near the equator tend to have high temperatures?
 CHAPTER 17 1 What Is Climate? SECTION Climate BEFORE YOU READ After you read this section, you should be able to answer these questions: What is climate? What factors affect climate? How do climates differ
Lake Tahoe Watershed Model. Lessons Learned through the Model Development Process
 Lake Tahoe Watershed Model Lessons Learned through the Model Development Process Presentation Outline Discussion of Project Objectives Model Configuration/Special Considerations Data and Research Integration
The Climate of Murray County
 The Climate of Murray County Murray County is part of the Crosstimbers. This region is a transition between prairies and the mountains of southeastern Oklahoma. Average annual precipitation ranges from
What Is Climate Change?
 1 CCAPS: Climate Change 101 Series, Topic 4. What is Climate Change? Climate Change 101 Series About this topic. The blog-posts entitled Climate Change 101 Series are designed for a general audience and
4. THE HBV MODEL APPLICATION TO THE KASARI CATCHMENT
 Application of HBV model to the Kasari River, 1994 Page 1 of 6 Application of the HBV model to the Kasari river for flow modulation of catchments characterised by specific underlying features by R. Vedom,
Your Creekside at Bethpage Weather with 2017 Forecasts. By Kevin Walls
 Your Creekside at Bethpage Weather with 2017 Forecasts By Kevin Walls Lets discuss. What are the Weather Extremes? Why are our wind patterns always the same? What are the causes of our weather patterns?
Climate change projections for Ontario: an updated synthesis for policymakers and planners
 Ministry of Natural Resources and Forestry Climate change projections for Ontario: an updated synthesis for policymakers and planners Shannon Fera and Adam Hogg Ontario Ministry of Natural Resources and
Climate Change and Climate Trends in Our Own Backyard
 Climate Change and Climate Trends in Our Own Backyard Dr. Mark Seeley Department of Soil, Water, and Climate University of Minnesota St Paul, MN 55108 For IATP: Rural Climate Dialogue Grand Rapids, MN
The Climate of Texas County
 The Climate of Texas County Texas County is part of the Western High Plains in the north and west and the Southwestern Tablelands in the east. The Western High Plains are characterized by abundant cropland
The weather in Iceland 2012
 The Icelandic Meteorological Office Climate summary 2012 published 9.1.2013 The weather in Iceland 2012 Climate summary Sunset in Reykjavík 24th April 2012 at 21:42. View towards west from the balcony
Illinois Drought Update, December 1, 2005 DROUGHT RESPONSE TASK FORCE Illinois State Water Survey, Department of Natural Resources
 Illinois Drought Update, December 1, 2005 DROUGHT RESPONSE TASK FORCE Illinois State Water Survey, Department of Natural Resources For more drought information please go to http://www.sws.uiuc.edu/. SUMMARY.
Monthly Long Range Weather Commentary Issued: NOVEMBER 16, 2015 Steven A. Root, CCM, Chief Analytics Officer, Sr. VP, sales
 Monthly Long Range Weather Commentary Issued: NOVEMBER 16, 2015 Steven A. Root, CCM, Chief Analytics Officer, Sr. VP, sales sroot@weatherbank.com OCTOBER 2015 Climate Highlights The Month in Review The
Figure 1. Carbon dioxide time series in the North Pacific Ocean (
 Evidence #1: Since 1950, Earth s atmosphere and oceans have changed. The amount of carbon released to the atmosphere has risen. Dissolved carbon in the ocean has also risen. More carbon has increased ocean
Seasonal and Spatial Patterns of Rainfall Trends on the Canadian Prairie
 Seasonal and Spatial Patterns of Rainfall Trends on the Canadian Prairie H.W. Cutforth 1, O.O. Akinremi 2 and S.M. McGinn 3 1 SPARC, Box 1030, Swift Current, SK S9H 3X2 2 Department of Soil Science, University
2011 Year in Review TORNADOES
 2011 Year in Review The year 2011 had weather events that will be remembered for a long time. Two significant tornado outbreaks in April, widespread damage and power outages from Hurricane Irene in August
UK Flooding Feb 2003
 UK Flooding 2000 06 Feb 2003 Britain has taken a battering from floods in the last 5 years, with major events in 1998 and 2000, significant floods in 2001 and minor events in each of the other years. So
Disentangling Impacts of Climate & Land Use Changes on the Quantity & Quality of River Flows in Southern Ontario
 Disentangling Impacts of Climate & Land Use Changes on the Quantity & Quality of River Flows in Southern Ontario by Trevor Dickinson & Ramesh Rudra, Water Resources Engineering University of Guelph Acknowledgements
Dust storm variability over EGYPT By Fathy M ELashmawy Egyptian Meteorological Authority
 WMO WORKSHOP ON CLIMATE MONITORING INCLUDING THE IMPLEMENTATION OF CLIMATE WATCH SYSTEMS FOR ARAB COUNTRIES IN WEST ASIA, AMMAN, JORDAN, 27-29 MAY 2013 Dust storm variability over EGYPT By Fathy M ELashmawy
Meteorology. Circle the letter that corresponds to the correct answer
 Chapter 3 Worksheet 1 Meteorology Name: Circle the letter that corresponds to the correct answer 1) If the maximum temperature for a particular day is 26 C and the minimum temperature is 14 C, the daily
Significant Rainfall and Peak Sustained Wind Estimates For Downtown San Francisco
 Significant Rainfall and Peak Sustained Wind Estimates For Downtown San Francisco Report Prepared by John P. Monteverdi, PhD, CCM July 30, 1998 Mayacamas Weather Consultants 1. Impact of Location The location
Natural Disasters and Storms in Philadelphia. What is a storm? When cold, dry air meets warm, moist (wet) air, there is a storm.
 air, there is a storm.") Natural Disasters and Storms in Philadelphia 1. What is a natural disaster? 2. Does Philadelphia have many natural disasters? o Nature (noun) everything in the world not made No. Philadelphia does not
Natural Disasters and Storms in Philadelphia 1. What is a natural disaster? 2. Does Philadelphia have many natural disasters? o Nature (noun) everything in the world not made No. Philadelphia does not
DROUGHT MONITORING BULLETIN
 DROUGHT MONITORING BULLETIN 24 th November 2014 Hot Spot Standardized Precipitation Index for time period from November 2013 to April 2014 was, due to the lack of precipitation for months, in major part
Colorado State University, Fort Collins, CO Weather Station Monthly Summary Report
 Colorado State University, Fort Collins, CO Weather Station Monthly Summary Report Month: December Year: 2017 Temperature: Mean T max was 47.2 F which is 4.4 above the 1981-2010 normal for the month. This
Monthly Long Range Weather Commentary Issued: APRIL 1, 2015 Steven A. Root, CCM, President/CEO
 Monthly Long Range Weather Commentary Issued: APRIL 1, 2015 Steven A. Root, CCM, President/CEO sroot@weatherbank.com FEBRUARY 2015 Climate Highlights The Month in Review The February contiguous U.S. temperature
Climate. Annual Temperature (Last 30 Years) January Temperature. July Temperature. Average Precipitation (Last 30 Years)
 January Temperature. July Temperature. Average Precipitation (Last 30 Years)") Climate Annual Temperature (Last 30 Years) Average Annual High Temp. (F)70, (C)21 Average Annual Low Temp. (F)43, (C)6 January Temperature Average January High Temp. (F)48, (C)9 Average January Low Temp.
Climate Annual Temperature (Last 30 Years) Average Annual High Temp. (F)70, (C)21 Average Annual Low Temp. (F)43, (C)6 January Temperature Average January High Temp. (F)48, (C)9 Average January Low Temp.
WHEN IS IT EVER GOING TO RAIN? Table of Average Annual Rainfall and Rainfall For Selected Arizona Cities
 WHEN IS IT EVER GOING TO RAIN? Table of Average Annual Rainfall and 2001-2002 Rainfall For Selected Arizona Cities Phoenix Tucson Flagstaff Avg. 2001-2002 Avg. 2001-2002 Avg. 2001-2002 October 0.7 0.0
Will a warmer world change Queensland s rainfall?
 Will a warmer world change Queensland s rainfall? Nicholas P. Klingaman National Centre for Atmospheric Science-Climate Walker Institute for Climate System Research University of Reading The Walker-QCCCE
Climate Change and Climate Trends in Our Own Backyard
 Climate Change and Climate Trends in Our Own Backyard Dr. Mark Seeley Department of Soil, Water, and Climate University of Minnesota St Paul, MN 55108 For IATP: Winona Rural Climate Dialogue Citizen Jury
The Climate of Seminole County
 The Climate of Seminole County Seminole County is part of the Crosstimbers. This region is a transition region from the Central Great Plains to the more irregular terrain of southeastern Oklahoma. Average
RELATIVE IMPORTANCE OF GLACIER CONTRIBUTIONS TO STREAMFLOW IN A CHANGING CLIMATE
 Proceedings of the Second IASTED International Conference WATER RESOURCE MANAGEMENT August 20-22, 2007, Honolulu, Hawaii, USA ISGN Hardcopy: 978-0-88986-679-9 CD: 978-0-88-986-680-5 RELATIVE IMPORTANCE
Geostatistical Analysis of Rainfall Temperature and Evaporation Data of Owerri for Ten Years
 Atmospheric and Climate Sciences, 2012, 2, 196-205 http://dx.doi.org/10.4236/acs.2012.22020 Published Online April 2012 (http://www.scirp.org/journal/acs) Geostatistical Analysis of Rainfall Temperature
Exemplar for Internal Achievement Standard. Mathematics and Statistics Level 3
 Exemplar for internal assessment resource Mathematics and Statistics for Achievement Standard 91580 Exemplar for Internal Achievement Standard Mathematics and Statistics Level 3 This exemplar supports
PHYSICAL PROPERTIES TAHOE.UCDAVIS.EDU 8
 PHYSICAL PROPERTIES 8 Lake surface level Daily since 1900 Lake surface level varies throughout the year. Lake level rises due to high stream inflow, groundwater inflow, and precipitation directly onto
Seasonal Summary. Great Lakes Winter By the North American Ice Service
 Seasonal Summary Great Lakes Winter 2014-2015 By the North American Ice Service Summary for the Great Lakes The 2014-2015 winter in the Great Lakes region was a season that was punctuated by three distinct
Highlights of the 2006 Water Year in Colorado
 Highlights of the 2006 Water Year in Colorado Nolan Doesken, State Climatologist Atmospheric Science Department Colorado State University http://ccc.atmos.colostate.edu Presented to 61 st Annual Meeting
9. PROBABLE MAXIMUM PRECIPITATION AND PROBABLE MAXIMUM FLOOD
 9. PROBABLE MAXIMUM PRECIPITATION AND PROBABLE MAXIMUM FLOOD 9.1. Introduction Due to the size of Watana Dam and the economic importance of the Project to the Railbelt, the Probable Maximum Flood (PMF)
Extreme Weather and Risks to Infrastructure. Heather Auld & Neil Comer Risk Sciences International
 Extreme Weather and Risks to Infrastructure Heather Auld & Neil Comer Risk Sciences International The Science is Valid and the Evidence grows Stronger AGREE Climate Change Disagree More Intense Rainfall
Annex I to Target Area Assessments
 Baltic Challenges and Chances for local and regional development generated by Climate Change Annex I to Target Area Assessments Climate Change Support Material (Climate Change Scenarios) SWEDEN September
David R. Vallee Hydrologist-in-Charge NOAA/NWS Northeast River Forecast Center
 David R. Vallee Hydrologist-in-Charge NOAA/NWS Northeast River Forecast Center Record flooding along the Shawsheen River during the 2006 Mother s Day Floods Calibrate and implement a variety of hydrologic
CLIMATE CHANGE IMPACTS ON ICE REGIME OF THE RIVERS IN MONGOLIA
 Ice in the Environment: Proceedings of the 16th IAHR International Symposium on Ice Dunedin, New Zealand, 2nd 6th December 2002 International Association of Hydraulic Engineering and Research CLIMATE CHANGE
CLIMATE READY BOSTON. Climate Projections Consensus ADAPTED FROM THE BOSTON RESEARCH ADVISORY GROUP REPORT MAY 2016
 CLIMATE READY BOSTON Sasaki Steering Committee Meeting, March 28 nd, 2016 Climate Projections Consensus ADAPTED FROM THE BOSTON RESEARCH ADVISORY GROUP REPORT MAY 2016 WHAT S IN STORE FOR BOSTON S CLIMATE?
Activity 2.2: Recognizing Change (Observation vs. Inference)
") Activity 2.2: Recognizing Change (Observation vs. Inference) Teacher Notes: Evidence for Climate Change PowerPoint Slide 1 Slide 2 Introduction Image 1 (Namib Desert, Namibia) The sun is on the horizon
Activity 2.2: Recognizing Change (Observation vs. Inference) Teacher Notes: Evidence for Climate Change PowerPoint Slide 1 Slide 2 Introduction Image 1 (Namib Desert, Namibia) The sun is on the horizon
Observed Climate Variability and Change: Evidence and Issues Related to Uncertainty
 Observed Climate Variability and Change: Evidence and Issues Related to Uncertainty David R. Easterling National Climatic Data Center Asheville, North Carolina Overview Some examples of observed climate
2003 Moisture Outlook
 2003 Moisture Outlook Nolan Doesken and Roger Pielke, Sr. Colorado Climate Center Prepared by Tara Green and Odie Bliss http://climate.atmos.colostate.edu Through 1999 Through 1999 Fort Collins Total Water
Study of Hydrometeorology in a Hard Rock Terrain, Kadirischist Belt Area, Anantapur District, Andhra Pradesh
 Open Journal of Geology, 2012, 2, 294-300 http://dx.doi.org/10.4236/ojg.2012.24028 Published Online October 2012 (http://www.scirp.org/journal/ojg) Study of Hydrometeorology in a Hard Rock Terrain, Kadirischist