COLORADO WATER SUPPLY CONDITIONS UPDATE
|
|
|
- Mark Stephens
- 5 years ago
- Views:
Transcription
1 COLORADO WATER SUPPLY CONDITIONS UPDATE FROM THE OFFICE OF THE STATE ENGINEER: COLORADO DIVISION OF WATER RESOURCES February 1, 2016 ROOM 818, 1313 SHERMAN ST., DENVER, CO ; The Surface Water Supply Index (SWSI) is used as an indicator of water supply conditions in the seven major river basins of the state and in each of the 41 smaller watersheds, or HUCs. The Colorado Water Conservation Board (CWCB) completed a major revision to the Colorado Drought Plan in At that time, Colorado adopted a new SWSI analysis based on the components shown below, which vary depending on the time of year. The new SWSI is based on a ranking of total volume in a HUC or major river basin ranked against similar volumes in historical years. For instance, in January, the total volume in a HUC is based on the forecasted runoff at specific locations plus the volume in storage in specific reservoirs. That total volume is ranked against similar total volumes that occurred each January between 1970 and Time Period January 1 June 1 July 1 September 1 October 1 December 1 SWSI Components Forecasted Runoff + Reservoir Storage Previous Month's Streamflow + Reservoir Storage Reservoir Storage Recently, CWCB and the Division of Water Resources (DWR) (both Divisions of the Colorado Department of Natural Resources) completed a software project to implement an automated calculation of the SWSI and to document the underlying hydrologic data. July 1, 2015 was the first month that the new DNR SWSI was published. The results are summarized within this monthly report and additional information, maps & data are available at: This document also contains reports about regional conditions prepared by each DWR Division Office. The SWSI calculation for the winter season is based on forecasted runoff as well as reservoir storage. The statewide SWSI values for January (February 1) range from a low of -0.6 in the Yamp-White River Basin to a high of 2.1 in the Arkansas River Basin. There was little change in water supply conditions compared to last month and water supply remains especially strong in the Arkansas River Basin. The following SWSI values were computed for each of the seven major basins for February 1, Basin February 1 SWSI Change from Previous Month* Change from Previous Year Arkansas Colorado Gunnison Rio Grande San Juan-Dolores South Platte Yampa-White SWSI Scale Severe Moderate Near Normal Above Normal Abundant Drought Drought Supply Supply Supply 1
2 SURFACE WATER SUPPLY INDEX FOR COLORADO BY MAJOR RIVER BASIN YAMPA - WHITE -0.6 SOUTH PLATTE +1.0 COLORADO -0.1 LEGEND Major River Basin Boundary SWSI Value GUNNISON +1.5 ARKANSAS SCALE +4 Abundant Supply RIO GRANDE Above Normal Supply 0 Near Normal Supply SAN JUAN - DOLORES Moderate Drought -4 Severe Drought February 1, 2016

3 SURFACE WATER SUPPLY INDEX FOR COLORADO BY HUC February 1, 2016
4 February 1, 2016 SWSI Values by HUC and Non Exceedance Probabilities (NEP) Basin HUC ID HUC Name SWSI Reservoir Storage NEP Forecasted Runoff NEP Arkansas Colorado Gunnison Rio Grande San Juan- Dolores South Platte Yampa- White Total Vol (AF) Arkansas Headwaters , Upper Arkansas , Upper Arkansas-Lake Meredith , Huerfano , Upper Arkansas-John Martin Reservoir , Purgatoire , Colorado Headwaters ,510, Blue , Eagle 0.4 None , Roaring Fork , Colorado Headwaters-Plateau ,321, East-Taylor , Upper Gunnison ,539, Tomichi , North Fork Gunnison , Lower Gunnison 0.6 None 58 1,550, Uncompahgre , San Miguel 1.6 None , Rio Grande Headwaters , Alamosa-Trinchera , Saguache 1.6 None 69 37, Conejos , Upper Dolores , Upper San Juan , Piedra 1.4 None , Animas , Middle San Juan , Mancos , South Platte Headwater , Upper South Platte , Middle South Platte-Cherry Creek , Clear 0.5 None , St. Vrain , Big Thompson , Cache La Poudre , Middle South Platte-Sterling , North Platte Headwaters -0.1 None , Upper Yampa , Lower Yampa -0.8 None , Little Snake -0.7 None , Upper White -0.4 None ,000 NEP is non exceedance percentage for total reservoir storage in HUC and total streamflow forecast volume in HUC (if there is more than one of each type of component, their volumes are added together). Total Vol is the volume of reservoir storage plus streamflow forecast volume in HUC combined. NEP is calculated compared to the volume of actual natural flow and active storage historically occurring this month during the period
5 HUC ID HUC Name Arkansas Headwaters Upper Arkansas Upper Arkansas- Lake Meredith Huerfano River Upper Arkansas- John Martin Reservoir Purgatoire River Colorado Headwaters Blue River February 1, 2016 SWSI Component Information By HUC Component Component Name Volume (AF) Component NEP for Month ARKANSAS RIVER AT SALIDA 245, CLEAR CREEK RESERVOIR 7, HOMESTAKE RESERVOIR 41, TURQUOISE LAKE 74, TWIN LAKES RESERVOIR 47, PUEBLO RESERVOIR 249, PUEBLO RESERVOIR INFLOW 380, CUCHARAS RIVER AT BOYD RANCH NR LA VETA 11, HUERFANO RIVER NEAR REDWING 12, LAKE HENRY 6, MEREDITH RESERVOIR 34, PUEBLO RESERVOIR INFLOW 380, CUCHARAS RESERVOIR CUCHARAS RIVER AT BOYD RANCH NR LA VETA 11, HUERFANO RIVER NEAR REDWING 12, ADOBE CREEK RESERVOIR 66, CUCHARAS RIVER AT BOYD RANCH NR LA VETA 11, HUERFANO RIVER NEAR REDWING 12, JOHN MARTIN RESERVOIR 232, PUEBLO RESERVOIR INFLOW 380, PURGATOIRE RIVER AT TRINIDAD 43, PURGATOIRE RIVER AT TRINIDAD 43, TRINIDAD LAKE 26, COLORADO RIVER NEAR DOTSERO 1,390, WILLIAMS FORK RESERVOIR 78, WOLFORD MOUNTAIN RESERVOIR 42, BLUE RIVER INFLOW TO GREEN MOUNTAIN RES 290, GREEN MOUNTAIN RESERVOIR 61, Eagle River EAGLE RIVER BELOW GYPSUM 330, Roaring Fork Colorado Headwaters- Plateau East-Taylor Upper Gunnison Tomichi ROARING FORK AT GLENWOOD SPRINGS 675, RUEDI RESERVOIR 70, COLORADO RIVER NEAR CAMEO 2,310, VEGA RESERVOIR 11, EAST RIVER AT ALMONT 176, TAYLOR PARK RESERVOIR 69, TAYLOR R INF TO TAYLOR PARK RESERVOIR 99, BLUE MESA RESERVOIR 590, CRAWFORD RESERVOIR 6, FRUITLAND RESERVOIR 1, GUNNISON R INF TO BLUE MESA RESERVOIR 690, LAKE FORK AT GATEVIEW, CO 137, MORROW POINT RESERVOIR 109, SILVER JACK RESERVOIR 4, TOMICHI CREEK AT GUNNISON, CO 85, VOUGA RESERVOIR NEAR DOYLEVILLE Cucharas Reservoir is empty due to a filling restriction 5
6 HUC ID HUC Name Component Name Component Volume (AF) Component NEP for Month North Fork NORTH FORK GUNNISON R NR SOMERSET 275, Gunnison PAONIA RESERVOIR Lower Gunnison GUNNISON RIVER NR GRAND JUNCTION 1,550, RIDGEWAY RESERVOIR 63, Uncompahgre UNCOMPAHGRE RIVER AT COLONA 157, San Miguel SAN MIGUEL RIVER NEAR PLACERVILLE 147, Rio Grande Headwaters Alamosa-Trinchera CONTINENTAL RESERVOIR 2, RIO GRANDE NEAR DEL NORTE 555, RIO GRANDE RESERVOIR 30, SANTA MARIA RESERVOIR 19, ALAMOSA CREEK ABOVE TERRACE RESERVOIR 72, CULEBRA CREEK AT SAN LUIS 24, MOUNTAIN HOME 2, SANGRE DE CRISTO 17, TERRACE RESERVOIR 4, TRINCHERA CK 13, UTE CREEK 14, Saguache Creek SAGUACHE CREEK NEAR SAGUACHE, CO 37, CONEJOS RIVER NEAR MOGOTE 205, Conejos River PLATORO RESERVOIR 12, Upper Dolores River Upper San Juan DOLORES RIVER BELOW MCPHEE RESERVOIR 350, GROUNDHOG RESERVOIR 19, MCPHEE RESERVOIR 246, LOS PINOS RIVER NEAR BAYFIELD 210, SAN JUAN RIVER NEAR CARRACAS 430, VALLECITO RESERVOIR 85, Piedra River PIEDRA RIVER NEAR ARBOLES 240, ANIMAS RIVER AT DURANGO 455, Animas River FLORIDA RIVER INFLOW TO LEMON RESERVOIR 60, LEMON RESERVOIR 21, Middle San Juan LA PLATA RIVER AT HESPERUS 26, LONG HOLLOW RESERVOIR Mancos River JACKSON GULCH RESERVOIR 5, MANCOS RIVER NEAR MANCOS 35, South Platte Headwaters Upper South Platte ANTERO RESERVOIR ELEVENMILE CANYON RESERVOIR 99, ELEVENMILE CANYON RESV INFLOW 46, SPINNEY MOUNTAIN RESERVOIR 32, BEAR CREEK ABV EVERGREEN 15, CHEESMAN LAKE 68, DILLON RESERVOIR 236, SOUTH PLATTE RIVER AT SOUTH PLATTE 160, Empty for repair 6
7 HUC ID HUC Name Component Name Component Volume (AF) Component NEP for Month BARR LAKE 20, BEAR CREEK ABV EVERGREEN 15, BIG THOMPSON R AT MOUTH, NR DRAKE, CO 85, BOULDER CREEK NEAR ORODELL 55, CACHE LA POUDRE R AT CANYON MOUTH 210, Middle South CLEAR CREEK AT GOLDEN 103, Platte-Cherry Creek HORSECREEK RESERVOIR 8, MILTON RESERVOIR 19, SAINT VRAIN CREEK AT LYONS 85, SOUTH BOULDER CK NR ELDORADO SPRINGS, CO 37, SOUTH PLATTE RIVER AT SOUTH PLATTE 160, STANDLEY RESERVOIR 38, Clear Creek CLEAR CREEK AT GOLDEN 103, BOULDER CREEK NEAR ORODELL 55, BUTTONROCK (RALPH PRICE) RESERVOIR 6,400 1 GROSS RESERVOIR 28, St. Vrain MARSHALL RESERVOIR 6, SAINT VRAIN CREEK AT LYONS 85, SOUTH BOULDER CK NR ELDORADO SPRINGS, CO 37, TERRY RESERVOIR 5, UNION RESERVOIR 11, BIG THOMPSON R AT MOUTH, NR DRAKE, CO 85, BOYD LAKE 35, CARTER LAKE 71, Big Thompson LAKE GRANBY 365, LAKE LOVELAND RESERVOIR LONE TREE RESERVOIR 6, MARIANO RESERVOIR 1, WILLOW CREEK RESERVOIR 6, BLACK HOLLOW RESERVOIR 3, CACHE LA POUDRE 8, CACHE LA POUDRE R AT CANYON MOUTH 210, CHAMBERS LAKE 4, Cache La Poudre COBB LAKE 18, FOSSIL CREEK RESERVOIR 7, HALLIGAN RESERVOIR 6, HORSETOOTH RESERVOIR 102, WINDSOR RESERVOIR 10,
8 HUC ID HUC Name Middle South Platte-Sterling Component Name Component Volume (AF) Component NEP for Month BEAR CREEK ABV EVERGREEN 15, BIG THOMPSON R AT MOUTH, NR DRAKE, CO 85, BOULDER CREEK NEAR ORODELL 55, CACHE LA POUDRE R AT CANYON MOUTH 210, CLEAR CREEK AT GOLDEN 103, EMPIRE RESERVOIR 23, JACKSON LAKE RESERVOIR 24, JULESBURG RESERVOIR 16, POINT OF ROCKS RESERVOIR 61, PREWITT RESERVOIR 17, RIVERSIDE RESERVOIR 40, SAINT VRAIN CREEK AT LYONS 85, SOUTH BOULDER CK NR ELDORADO SPRINGS, CO 37, SOUTH PLATTE RIVER AT SOUTH PLATTE 160, North Platte Headwaters NORTH PLATTE R NR NORTHGATE 230, ELK RIVER NEAR MILNER, CO 310, ELKHEAD CREEK ABOVE LONG GULCH 70, Upper Yampa STAGECOACH RESERVOIR NR OAK CREEK 34, YAMCOLO RESERVOIR 6, YAMPA RIVER AT STEAMBOAT SPRINGS 255, Lower Yampa YAMPA RIVER NEAR MAYBELL 875, Little Snake LITTLE SNAKE RIVER NEAR LILY 285, Upper White WHITE RIVER NEAR MEEKER 265, NEP is non exceedance percentage (percentile) for volume of the component compared to this month during the historical period
9 SOUTH PLATTE BASIN Feb-16 Basinwide Conditions Assessment The SWSI value for the month was 1.0. Though at times it felt January 2016 was a cold, dry month, it was actually fairly close to normal for January. With the exception of the southeast corner of Water Division 1 (the Republican River basin) temperatures were near normal (temperatures were above normal in the southeast corner). Precipitation was also generally close to normal in most areas of Division 1. The exception was again the southeast corner of the Division where precipitation was significantly below normal. The snowpack in the South Platte Basin was near normal at the end of January. The February 1, 2016 water equivalent was 108% of normal. This indicates the spring runoff should be near normal as generally about one half of the snow water equivalent in the South Platte basin is reached by the end of January. Once again, the exception to all the normalness in the South Platte basin in January 2016 is the river flow at the Kersey and Julesburg index gages. Flow at both gages was well above normal in January. The overall flow at the Julesburg gage was approximately 254 % of the long term January mean flow of 512 cfs. The actual January 2016 mean flow was approximately 1300 cfs. The overall flow at the Kersey gage was approximately 141 % of the long term December mean flow of 652 cfs. The actual January 2016 mean flow was approximately 920 cfs. As has been the case for quite some time, calls during January 2016 in the South Platte basin were more junior than normal. The South Platte mainstem was under free river conditions the whole month, which is only somewhat unusual. The unusual thing is that the free river was caused by an abundant water supply, rather than the usual cause, very cold weather. The Big Thompson River, Boulder Creek, and Clear Creek were under call for much or all of the month. Reservoir storage at the end of January 2016 in the South Platte basin remained good, just not quite as good as it has been. The long term average storage for the end of January is 71% of capacity. The January 2016 end of the month reservoir storage was at 74% of capacity. While this is still above average, it is less above average that has been the case for the last several months. CUMULATIVE FLOW, Acre-Feet SOUTH PLATTE RIVER NR. KERSEY, FLOW BY WATER YEAR 3,000,000 2,500,000 2,000,000 1,500,000 1,000, ,000 0 Oct Nov Dec Jan Feb March April May June July Aug Sept WET (1983) DRY (1964) AVG 2016 REPRESENTATIVE RESERVOIRS 300, ,000 Usable Storage, acre-feet 200, , ,000 50,000 0 Dillon Horsetooth Eleven Mile Cheesman Jackson Barr Lake Avg. 1/31 Contents 1/31/16 Contents 9

10 10
11 ARKANSAS BASIN Feb-16 Basinwide Conditions Assessment The SWSI value for the month was 2.1. Outlook Reservoir storage in the Pueblo Winter Water Program totaled 105,593 acre-feet as of the end of January. This storage amount is significantly more than last year s storage to date of 88,867 acre-feet and represents 145% of the last twenty year average. Conservation storage in John Martin Reservoir has accumulated 22,655 acre-feet versus 9,891 acre-feet as of the end of January last year. Administrative/Management Concerns Due to the above average conditions in 2015 and a very good winter storage period, there is significant concern about a likely spill of account water from Pueblo Reservoir. The Southeastern Colorado Water Conservancy District and Bureau of Reclamation will work towards the highest priority of the Fryingpan- Arkansas Project, which is to maximize storage of ARKANSAS RIVER NR. PORTLAND, FLOW BY WATER YEAR project water. To make room for 2016 west slope imports, water will continue to be moved downstream 1,200,000 from Turquoise and Twin Lakes Reservoirs to Pueblo Reservoir. That additional storage, coupled with 1,000,000 robust winter water storage, will place temporary storage accounts owned by some municipal interests, 800,000 well associations and the Upper Arkansas Water Conservancy District and Lower Arkansas Valley Water 600,000 Conservancy District, at risk of spill by April 15, The Arkansas Basin is faced with a dilemma that has 400,000 not occurred for quite some time in that almost all 200,000 storage vessels are likely to fill creating a situation where there simply are not good alternatives for 0 moving the water stored in the temporary accounts. CUMULATIVE FLOW, Acre-Feet Oct Nov Dec Jan Feb March April May June July Aug Sept WET (1984) DRY (2002) AVG ,000 REPRESENTATIVE RESERVOIRS 250,000 Usable Storage, acre-feet 200, , ,000 50,000 0 John Martin Pueblo Turquoise Twin Lakes Avg. 1/31 Contents 1/31/16 Contents 11

12 12
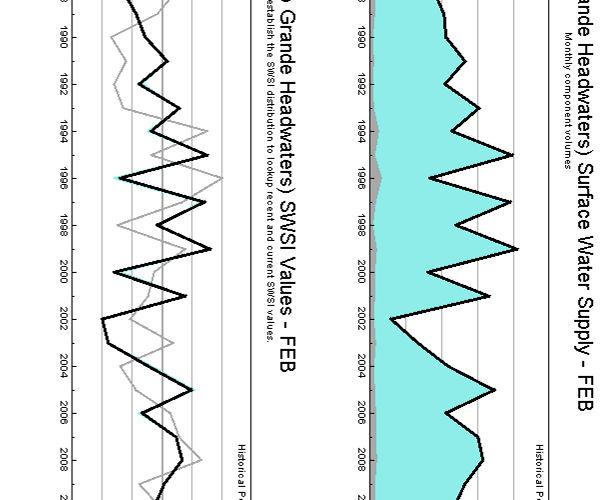
13 RIO GRANDE BASIN Feb-16 Basinwide Conditions Assessment The SWSI value for the month was 0.7. Flow at the gaging station Rio Grande near Del Norte averaged 179 cfs (103% of normal). The Conejos River near Mogote had a mean flow of 48 cfs (98% of normal). Limited snowfall in the San Juans and Sangre de Cristos during late December and all of January was offset by a heavy snowstorm the last weekend of January. Overall, the upper Rio Grande Basin has above average snowpack at start of February. January turned bitter cold after a big snowstorm on the 8th and 9th. The layer of snow on the ground produced temperatures as low as -26 degrees in Alamosa. Other than that week-long icebox, temperatures have been warmer than normal this winter. Outlook Current Natural Resources Conservation Service stream flow forecasts are predicting runoff in area streams to be in the range of 103% (Rio San Antonio), 104% (Culebra Creek near San Luis) to 116% (Saguache Creek) of average during the 2016 irrigation season. The even spread of snowpack across the upper Rio Grande Basin is a rare treat. Typically, an area or areas of the basin are substantially better or worse than other drainages. Current National Weather Service forecasts for February through April, 2016 are calling for near normal temperatures and above normal precipitation in this area of the state. The effects of El Nino should linger in southern Colorado through June. Administrative/Management Concerns Much effort was spent during January finalizing streamflow and diversion records. The annual meetings of local districts and ditch boards are held this time of year to reflect back on the 2015 season and plan for the upcoming irrigation season. Public Use Impact Winter sports enthusiasts are enjoying a year of above-average snow conditions. The snowpack seems to have a nice balance within the high, intermediate, and low elevations. CUMULATIVE FLOW, Acre-Feet 1,200,000 1,000, , , , ,000 35,000 30,000 RIO GRANDE NR. DEL NORTE, FLOW BY WATER YEAR 0 Oct Nov Dec Jan Feb March April May June July Aug Sept WET (1987) DRY (2002) AVG 2016 REPRESENTATIVE RESERVOIRS Usable Storage, acre-feet 25,000 20,000 15,000 10,000 5,000 0 Rio Grande Platoro Santa Maria Avg. 1/31 Contents 1/31/16 Contents 13

14 14
15 GUNNISON BASIN Feb-16 Basinwide Conditions Assessment The SWSI value for the month was 1.5. January precipitation was again above average in almost all areas of the Gunnison basin. South areas of the basin were favored with locations south of the Gunnison River receiving up to 130% of the average while areas north of the River received up to 110% of average. Snow water equivalent (SWE) values for the basin, calculated from an average of Gunnison basin Snotel sites remained stable at 119% of the 30 year median for February 1st. Still leading the way are the southwestern areas, with the basin draining to Ridgway Reservoir containing 120% of the 30 year median, while the Schofield site on the East River contains only 93%. Further, it appears that there is a greater amount of lower elevation snow this year, which is apparent when viewing SWE at Columbine Pass (Uncompahgre Plateau) and Idarado that contain 164% and 144% of the median. These sites are relatively low elevation when compared with other Gunnison Snotel sites. Outlook The February, March and April outlook from the National Weather Service places the Gunnison basin within an area expected to receive above average precipitation and average temperatures. The February 1st snowpack forecast from the NRCS on February 1st predicts that with average snow the rest of the season we would end up at 114% of the median peak SWE. Colorado Basin River Forecast Center (CBRFC) April to July runoff forecasts predict streamflows greater than 110% of the median for all streams in the Gunnison basin except the East River where 96% is forecast Administrative/Management Concerns DWR, the Colorado River District (CRWCD) and the Uncompahgre Valley Water Users Association (UVWUA) are waiting to hear the results of a grant application that would provide funding to add satellite telemetry on six of the UVWUA s main delivery canals. DWR expects to install these systems prior to the irrigation season if the grant award is made in the next month. Taylor Park continues to accrue second fill water and contains 16,546 acre-feet on February 1st. Crystal Dam releases stayed near 1,100 cfs during the past month, which reduced Blue Mesa to within 1 foot of the ft target to reduce the likelihood of icing issues upstream of Blue Mesa. If forecasted inflows to Blue Mesa remain the same until May 1st, the Black Canyon NP reserve water right one-day peak target would be 5,102 cfs, while the Aspinall Unit ROD flow target would be 8,070 cfs for 10 days. Public Use Impacts As mentioned in the January report, very cold weather during the first two weeks of January caused significant ice accumulation on both the Taylor and Gunnison Rivers near the City of Gunnison, which resulted in ice jam flooding events on January 1st and January 12th. These ice jams were caused by the buildup of frazil ice dams and their subsequent release of impounded water. Frazil ice is generated by rivers with open water and turbulent flow during extreme cold events (-20 degrees F). Consistent with the results of studies performed on these types of ice jams that show the period immediately following the cold snap creates the most problems, we did not experience any further major ice jam flooding events on the Gunnison even though temperatures remained cold. CUMULATIVE FLOW, Acre-Feet Usable Storage, acre-feet 250, , , ,000 50,000 80,000 70,000 60,000 50,000 40,000 30,000 20,000 10,000 UNCOMPAHGRE RIVER NR. RIDGWAY, FLOW BY WATER YEAR 0 Oct Nov Dec Jan Feb March April May June July Aug Sept WET (1984) DRY (1977) AVG 2016 REPRESENTATIVE RESERVOIRS 0 Taylor Park Crawford Fruitland Avg 1/31 Contents 1/31/16 Contents 15

16 16
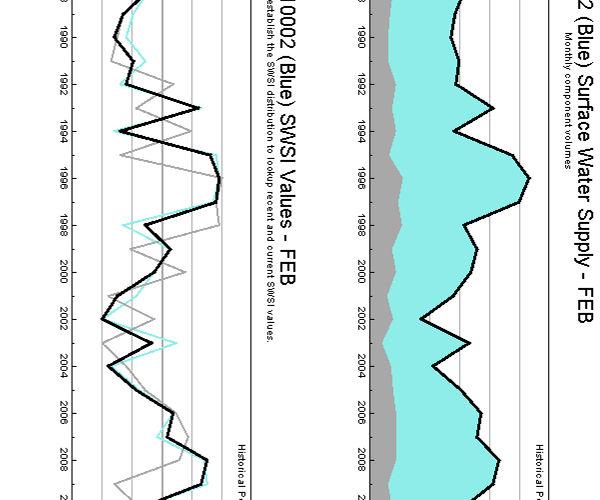
17 COLORADO BASIN Feb-16 Basinwide Conditions Assessment The SWSI value for the month was Outlook Colorado River flows continue near average or slightly below average with tributary flows running slightly below average throughout February with the exception of the Blue River, which is running above average. As of February 10, the Upper Colorado River Basin snowpack was 112 percent of median snow water equivalent and 105 percent of average precipitation. Forecasts call for average precipitation with above normal temperatures for western Colorado through February. Administrative/Management Concerns The call on the Colorado River main stem remains the Shoshone Hydro Power right for 1250 cfs. Accordingly, Green Mountain Reservoir is releasing to pass inflows, provide contract and HUP obligations and make C-BT replacements. Public Use Impacts A Basalt court case, High Valley Farms could affect the state s pot industry. The water court referee has asked High Valley Farms to answer the question of whether a water right to grow marijuana in Colorado can be lawfully granted when the plant is illegal under federal law. If this court were to determine that, contrary to the findings of the state engineer, the use of water for marijuana facilities is not a beneficial use, the entire industry, which reportedly employs almost 16,000 residents, would be shut down, wrote Rhonda J. Bazil, an attorney in Aspen for High Valley Farms. CUMULATIVE FLOW, Acre-Feet 3,500,000 3,000,000 2,500,000 2,000,000 1,500,000 1,000, ,000 COLORADO RIVER NR. DOTSERO, FLOW BY WATER YEAR 0 Oct Nov Dec Jan Feb March April May June July Aug Sept WET (1984) DRY (2002) AVG ,000 REPRESENTATIVE RESERVOIRS 70,000 60,000 Usable Storage, acre-feet 50,000 40,000 30,000 20,000 10,000 0 Green Mountain Ruedi Williams Fork Avg. 1/31 Contents 1/31/16 Contents 17

18 18
19 YAMPA/WHITE BASIN Feb-16 Basinwide Conditions Assessment The SWSI value for the month was January precipitation was above average in the Yampa, White, and North Platte River basins. Precipitation for the month, as measured at the SNOTEL sites operated by NRCS, was reported at 114% of average for the combined Yampa, White, and North Platte River basins. Total precipitation for the water year as a percent of average to date in the combined basins at the end of January was 99%. Snowpack for the combined basins stands at 106%. The snow water equivalent (SWE) as of January 31, 2016 was 100% of average for the North Platte River basin and 104% of average for the Yampa River basin and White River basin. NRCS predicts slightly below average to average spring and summer streamflows in the Yampa, White, and North Platte River basins. The latest runoff forecasts from the NRCS for the April through July period are 102% of average for the North Platte River near Northgate, 96% of average for the Yampa River near Maybell, 83% of average for the Little Snake River near Lily, and 95% of average for the White River near Meeker Due to cold temperatures and snow depth on ice, all Division 6 stream gages except the Yampa River and White River gages are either closed for the winter season or currently ice/snow-affected. Outlook As of January 31st Fish Creek Reservoir was storing approximately 2,721 AF, 65% of capacity. The capacity of Fish Creek Reservoir is 4,167 AF. Yamcolo Reservoir was storing 6,600 AF at the end of January The capacity of Yamcolo Reservoir is 8,700 AF. On January 31tst, 2016, Stagecoach Reservoir was storing 34,400 AF which is 103% of capacity. On January 31st, Elkhead Creek Reservoir was 64% full and storing 15,881 AF. 200,000 Water stored in Fish Creek Reservoir is used primarily for municipal purposes, Yamcolo Reservoir is used for 100,000 irrigation purposes and Elkhead Creek Reservoir is used for municipal, industrial, recreational, and fish 0 recovery releases. Stagecoach Reservoir is primarily used for recreation though a significant amount of stored water is allocated for municipal, industrial, irrigation and augmentation uses. Public Use Impacts Steamboat Ski Resort has recorded 274 inches of snow as of February 12, At Stagecoach State Park the reservoir is completely iced over with approximately 8 12 inches of cover. Steamboat Lake State Park has 6.5 to 8 inches of ice covering the lake as of 1/7/2016. Ice fishing is available during winter months. Ice conditions can vary so please use caution. CUMULATIVE FLOW, Acre-feet 700, , , , ,000 YAMPA RIVER AT STEAMBOAT, FLOW BY WATER YEAR Oct Nov Dec Jan Feb March April May June July Aug Sept WET (1984) DRY (1977) AVG

20 20
21 SAN JUAN-DOLORES BASIN Feb-16 Basinwide Conditions Assessment The SWSI value for the month was 1.2. Flow at the Animas River at Durango was estimated to average 191 cfs (94% of average). The flow at the Dolores River at was estimated to average 48 cfs (94% of average). The La Plata River at Hesperus was estimated to average 7.7 cfs (111% of average). Precipitation in Durango was 1.54 inches for the month, 79% of the 30-year average of 1.95 inches. Precipitation was the 56 highest amount recorded in January, in Durango, out of 122 years of record. Precipitation to date in Durango, for the water year, is 9.56 inches, 142% of the 30-year average of 6.75 inches. End of last month precipitation to date, for the water year was 159% of average. The average high and low temperatures for the month of January in Durango were 39o and 13o. In comparison, the 30-year average high and low for the month is 41o and 14o. At the end of the month Vallecito Reservoir contained 85,882 acre-feet compared to its average content of 55,737 acre-feet (154% of average). McPhee Reservoir was up to 246,323 acre-feet compared to its average content of 259,374 (95% of average), while Lemon Reservoir was up to 21,450 acre-feet as compared to its average content of 19,758 acre-feet (109% of average). Outlook Precipitation (1.54 inches) was below average for January in Durango. There were 56 years out of 122 years of record where there was more precipitation than this year. Flows in the rivers within the basin remained near average for the month. There were 55 out of 106 years of record where the total flow past the Animas River at Durango stream gauge was more than this ANIMAS RIVER NR. DURANGO, FLOW BY WATER YEAR year. There were 48 out of 105 years of record where the total flow past the Dolores stream gauge was 1,000,000 more than this year and 31 out of 99 years of record 900,000 where the total flow past the La Plata River at 800,000 Hesperus gauge was more than this year. On January 31, the NRCS SNOTEL sites reported an average snowwater equivalent within the basin at 123%. End of last 600, ,000 month the snow-water-equivalent was 128%. CUMULATIVE FLOW, Acre-Feet 500, , , , ,000 0 Oct Nov Dec Jan Feb March April May June July Aug Sept WET (1973) DRY (2002) AVG ,000 REPRESENTATIVE RESERVOIRS 350, ,000 Usable Storage, acre-feet 250, , , ,000 50,000 0 McPhee Vallecito Lemon Avg. 1/31 Contents 1/31/16 Contents 21

22 22
23
24
25
26
27
28
29
30
31
32
33

34
35
36

37
38
39
40
41

42
43
44
45
46
47

48
49
50
51
52
53
54

55
56
57
58
59
60
61
62
63
COLORADO WATER SUPPLY CONDITIONS UPDATE
 COLORADO WATER SUPPLY CONDITIONS UPDATE FROM THE OFFICE OF THE STATE ENGINEER: COLORADO DIVISION OF WATER RESOURCES February 1, 2017 ROOM 818, 1313 SHERMAN ST., DENVER, CO 80203 303-866-3581; www.water.state.co.us
COLORADO WATER SUPPLY CONDITIONS UPDATE
 COLORADO WATER SUPPLY CONDITIONS UPDATE FROM THE OFFICE OF THE STATE ENGINEER: COLORADO DIVISION OF WATER RESOURCES December 211 ROOM 818, 1313 SHERMAN ST., DENVER, CO 823 33-866-3581; www.water.state.co.us
COLORADO WATER SUPPLY CONDITIONS UPDATE
 COLORADO WATER SUPPLY CONDITIONS UPDATE FROM THE OFFICE OF THE STATE ENGINEER: COLORADO DIVISION OF WATER RESOURCES January 215 ROOM 818, 1313 SHERMAN ST., DENVER, CO 823 33-866-3581; www.water.state.co.us
Colorado Water Supply Outlook Report January 1, 2018
 Colorado Water Supply Outlook Report January 1, 2018 A mid-mountain vantage point at Crested Butte Ski area provides a view of the low-snow conditions in the surrounding area. On December 19 th, when this
A Review of the 2007 Water Year in Colorado
 A Review of the 2007 Water Year in Colorado Nolan Doesken Colorado Climate Center, CSU Mike Gillespie Snow Survey Division, USDA, NRCS Presented at the 28 th Annual AGU Hydrology Days, March 26, 2008,
Colorado Water Supply Outlook Report April 1, 2016
 Colorado Water Supply Outlook Report April 1, 216 Kevin Houck and Allison Franz of the Colorado Water Conservation Board measure the Willow Creek Pass snow course. This snow course recorded 129% of normal
PRECIPITATION. Last Week Precipitation:
 12/3/2014 NIDIS Drought and Water Assessment PRECIPITATION The images above use daily precipitation statistics from NWS COOP, CoCoRaHS, and CoAgMet stations. From top to bottom, and left to right: most
Webinar and Weekly Summary February 15th, 2011
 Webinar and Weekly Summary February 15th, 2011 -Assessment of current water conditions - Precipitation Forecast - Recommendations for Drought Monitor Upper Colorado Normal Precipitation Upper Colorado
The Colorado Drought : 2003: A Growing Concern. Roger Pielke, Sr. Colorado Climate Center.
 The Colorado Drought 2001-2003: 2003: A Growing Concern Roger Pielke, Sr. Colorado Climate Center Prepared by Tara Green and Odie Bliss http://climate.atmos.colostate.edu 2 2002 Drought History in Colorado
PRECIPITATION. Last Week Precipitation:
 2/24/2015 NIDIS Drought and Water Assessment PRECIPITATION The images above use daily precipitation statistics from NWS COOP, CoCoRaHS, and CoAgMet stations. From top to bottom, and left to right: most
Becky Bolinger Water Availability Task Force November 13, 2018
 Colorado Climate Center WATF Climate Update Becky Bolinger Water Availability Task Force November 13, 2018 COLORADO CLIMATE CENTER Water Year 2018 Colorado s Climate in Review COLORADO CLIMATE CENTER
NIDIS Intermountain West Drought Early Warning System February 19, 2019
 NIDIS Intermountain West Drought Early Warning System February 19, 2019 Precipitation The images above use daily precipitation statistics from NWS COOP, CoCoRaHS, and CoAgMet stations. From top to bottom,
-Assessment of current water conditions. - Precipitation Forecast. - Recommendations for Drought Monitor
 2 June 12, 2012 -Assessment of current water conditions - Precipitation Forecast - Recommendations for Drought Monitor 7-day average discharge compared to historical discharge for the day
A Review of the 2003 Water Year in Colorado
 Hydrology Days 24 A Review of the 23 Water Year in Colorado Nolan J. Doesken 1 Colorado Climate Center, Atmospheric Science Department, Colorado State University, Fort Collins, Colorado Michael A. Gillespie
NIDIS Intermountain West Drought Early Warning System February 12, 2019
 NIDIS Intermountain West Drought Early Warning System February 12, 2019 Precipitation The images above use daily precipitation statistics from NWS COOP, CoCoRaHS, and CoAgMet stations. From top to bottom,
NIDIS Intermountain West Drought Early Warning System December 4, 2018
 12/4/2018 NIDIS Drought and Water Assessment NIDIS Intermountain West Drought Early Warning System December 4, 2018 Precipitation The images above use daily precipitation statistics from NWS COOP, CoCoRaHS,
PERCENT BIAS ASSESSMENT OF WATER-SUPPLY OUTLOOKS IN THE COLORADO RIVER BASIN. Brent Harrison 1 and Roger Bales 2 ABSTRACT INTRODUCTION
 PERCENT BIAS ASSESSMENT OF WATER-SUPPLY OUTLOOKS IN THE COLORADO RIVER BASIN Brent Harrison 1 and Roger Bales 2 ABSTRACT Water-supply forecasts on various watersheds are intended to predict the April through
NIDIS Intermountain West Drought Early Warning System January 15, 2019
 NIDIS Drought and Water Assessment NIDIS Intermountain West Drought Early Warning System January 15, 2019 Precipitation The images above use daily precipitation statistics from NWS COOP, CoCoRaHS, and
-Assessment of current water conditions. - Precipitation Forecast. - Recommendations for Drought Monitor
 April 27, 2010 -Assessment of current water conditions - Precipitation Forecast - Recommendations for Drought Monitor 7 Day Precipitation 19-25 April 2010 Month-to-Date Precipitation 1-25 April 2010
Upper Missouri River Basin February 2018 Calendar Year Runoff Forecast February 6, 2018
 Upper Missouri River Basin February 2018 Calendar Year Runoff Forecast February 6, 2018 Calendar Year Runoff Forecast Explanation and Purpose of Forecast U.S. Army Corps of Engineers, Northwestern Division
NIDIS Intermountain West Drought Early Warning System February 6, 2018
 NIDIS Intermountain West Drought Early Warning System February 6, 2018 Precipitation The images above use daily precipitation statistics from NWS COOP, CoCoRaHS, and CoAgMet stations. From top to bottom,
NIDIS Intermountain West Drought Early Warning System December 11, 2018
 NIDIS Drought and Water Assessment NIDIS Intermountain West Drought Early Warning System December 11, 2018 Precipitation The images above use daily precipitation statistics from NWS COOP, CoCoRaHS, and
PRECIPITATION. Last Week Precipitation:
 PRECIPITATION The images above use daily precipitation statistics from NWS COOP, CoCoRaHS, and CoAgMet stations. From top to bottom, and left to right: most recent 7-days of accumulated precipitation in
NIDIS Intermountain West Drought Early Warning System April 18, 2017
 1 of 11 4/18/2017 3:42 PM Precipitation NIDIS Intermountain West Drought Early Warning System April 18, 2017 The images above use daily precipitation statistics from NWS COOP, CoCoRaHS, and CoAgMet stations.
Precipitation. Standardized Precipitation Index. NIDIS Intermountain West Regional Drought Early Warning System January 3, 2017
 1/3/2017 NIDIS Drought and Water Assessment NIDIS Intermountain West Regional Drought Early Warning System January 3, 2017 Precipitation The images above use daily precipitation statistics from NWS COOP,
NIDIS Weekly Climate, Water and Drought Assessment Summary. Upper Colorado River Basin July 31, 2012
 NIDIS Weekly Climate, Water and Drought Assessment Summary Upper Colorado River Basin July 31, 2012 Fig. 1: July month-to-date precipitation in inches. Fig. 2: SNOTEL WYTD precipitation percentiles (50%
NIDIS Intermountain West Drought Early Warning System January 22, 2019
 NIDIS Drought and Water Assessment NIDIS Intermountain West Drought Early Warning System January 22, 2019 Precipitation The images above use daily precipitation statistics from NWS COOP, CoCoRaHS, and
FEMA Hazards Loss Modeling Task Force (MOTF) Situation Report #14. Colorado Spring Flood Risk ***FINAL REPORT***
 Situation Report #14. Colorado Spring Flood Risk ***FINAL REPORT***") FEMA Hazards Loss Modeling Task Force (MOTF) Situation Report #14 Colorado Spring Flood Risk FEMA Modeling Task Force (MOTF) Denver Federal Center, Building 710A Denver, Colorado 80225 Email: FEMA-MOTF@fema.dhs.gov
FEMA Hazards Loss Modeling Task Force (MOTF) Situation Report #14 Colorado Spring Flood Risk FEMA Modeling Task Force (MOTF) Denver Federal Center, Building 710A Denver, Colorado 80225 Email: FEMA-MOTF@fema.dhs.gov
NIDIS Intermountain West Regional Drought Early Warning System February 7, 2017
 NIDIS Drought and Water Assessment NIDIS Intermountain West Regional Drought Early Warning System February 7, 2017 Precipitation The images above use daily precipitation statistics from NWS COOP, CoCoRaHS,
Upper Missouri River Basin December 2017 Calendar Year Runoff Forecast December 5, 2017
 Upper Missouri River Basin December 2017 Calendar Year Runoff Forecast December 5, 2017 Calendar Year Runoff Forecast Explanation and Purpose of Forecast U.S. Army Corps of Engineers, Northwestern Division
Chapter 4 Population Change in Colorado s River Basins: A Brief History from 1950 to 2000 and Forecasts from 2000 to 2030
 Jim Westkott 1 1Department of Local Affairs, State of Colorado Abstract This chapter will summarize and present data on population change in Colorado from to and on expected change from to by river basin.
NIDIS Weekly Climate, Water and Drought Assessment Summary. Upper Colorado River Basin June 28, 2011
 NIDIS Weekly Climate, Water and Drought Assessment Summary Upper Colorado River Basin June 28, 2011 PrecipitaFon and Snowpack Fig. 1: June month to date precipitafon in inches. Fig. 2: June 19 25 precipitafon
Upper Missouri River Basin May 2018 Calendar Year Runoff Forecast May 4, 2018
 Calendar Year Runoff Forecast Explanation and Purpose of Forecast Upper Missouri River Basin May 2018 Calendar Year Runoff Forecast May 4, 2018 U.S. Army Corps of Engineers, Northwestern Division Missouri
NIDIS Intermountain West Drought Early Warning System October 30, 2018
 10/30/2018 NIDIS Drought and Water Assessment NIDIS Intermountain West Drought Early Warning System October 30, 2018 Precipitation The images above use daily precipitation statistics from NWS COOP, CoCoRaHS,
NIDIS Intermountain West Drought Early Warning System December 18, 2018
 NIDIS Intermountain West Drought Early Warning System December 18, 2018 Precipitation The images above use daily precipitation statistics from NWS COOP, CoCoRaHS, and CoAgMet stations. From top to bottom,
PRECIPITATION. Last Week Precipitation:
 1/28/2015 NIDIS Drought and Water Assessment PRECIPITATION The images above use daily precipitation statistics from NWS COOP, CoCoRaHS, and CoAgMet stations. From top to bottom, and left to right: most
NIDIS Intermountain West Drought Early Warning System May 1, 2018
 NIDIS Intermountain West Drought Early Warning System May 1, 2018 Precipitation The images above use daily precipitation statistics from NWS COOP, CoCoRaHS, and CoAgMet stations. From top to bottom, and
PRECIPITATION. Last Week Precipitation:
 PRECIPITATION The images above use daily precipitation statistics from NWS COOP, CoCoRaHS, and CoAgMet stations. From top to bottom, and left to right: most recent 7-days of accumulated precipitation in
Colorado CoCoRaHS. Colorado CoCoRaHS. Because Every Drop Counts! November 2014 Volume 2, Issue 11
 U.S. PRECIPITATION (% OF AVERAGE) LOOKING BACK AT OCTOBER 2014 October was a fairly dry month for much of the nation with the exception of the Pacific Northwest, portions of New England and the Tennessee
Precipitation. Standardized Precipitation Index. NIDIS Intermountain West Drought Early Warning System September 5, 2017
 9/6/2017 NIDIS Drought and Water Assessment NIDIS Intermountain West Drought Early Warning System September 5, 2017 Precipitation The images above use daily precipitation statistics from NWS COOP, CoCoRaHS,
San Francisco Public Utilities Commission Hydrological Conditions Report For March 2016
 San Francisco Public Utilities Commission Hydrological Conditions Report For March 2016 J. Chester, C. Graham, A. Mazurkiewicz, & M. Tsang, April 7, 2016 Snow Surveyor Chris Graham crossing Huckleberry
-Assessment of current water conditions. - Precipitation Forecast. - Recommendations for Drought Monitor
 2 June 26 th, 2012 -Assessment of current water conditions - Precipitation Forecast - Recommendations for Drought Monitor CMPDSI Value Percentile Rank Characteristic -1.0 - -1.9 21-30 Abnormally
-Assessment of current water conditions. - Precipitation Forecast. - Recommendations for Drought Monitor
 2 May 1 st, 2012 -Assessment of current water conditions - Precipitation Forecast - Recommendations for Drought Monitor AHPS Water Year Precipitation as Percentage of Normal 7-day average
 October 16 th, 2012 2010-12 La Niña event reached its biggest peak since the mid-70s in late 2010, followed by a brief excursion to ENSOneutral conditions during mid-2011; it reached a second peak last
Upper Missouri River Basin January 2018 Calendar Year Runoff Forecast January 3, 2018
 Calendar Year Runoff Forecast Upper Missouri River Basin January 2018 Calendar Year Runoff Forecast January 3, 2018 Explanation and Purpose of Forecast U.S. Army Corps of Engineers, Northwestern Division
NIDIS Drought and Water Assessment
 7/23/13 1:57 PM PRECIPITATION The images above use daily precipitation statistics from NWS COOP, CoCoRaHS, and CoAgMet stations. From top to bottom, and left to right: most recent 7-days of accumulated
-Assessment of current water conditions. - Precipitation Forecast. - Recommendations for Drought Monitor
 2 May 8 th, 2012 -Assessment of current water conditions - Precipitation Forecast - Recommendations for Drought Monitor AHPS Analysis 5/7/12 7-day average discharge compared to historical
Long-term Precipitation Trends in Colorado. Nolan Doesken Colorado State Climatologist Presented: Friday, December 12, 2008
 Long-term Precipitation Trends in Colorado Nolan Doesken Colorado State Climatologist Presented: Friday, December 12, 28 Colorado Mean Annual Precipitation (1971-2) Of All Our Climate Observing Stations
Oregon Water Conditions Report May 1, 2017
 Oregon Water Conditions Report May 1, 2017 Mountain snowpack in the higher elevations has continued to increase over the last two weeks. Statewide, most low and mid elevation snow has melted so the basin
Highlights of the 2006 Water Year in Colorado
 Highlights of the 2006 Water Year in Colorado Nolan Doesken, State Climatologist Atmospheric Science Department Colorado State University http://ccc.atmos.colostate.edu Presented to 61 st Annual Meeting
Modeling of peak inflow dates for a snowmelt dominated basin Evan Heisman. CVEN 6833: Advanced Data Analysis Fall 2012 Prof. Balaji Rajagopalan
 Modeling of peak inflow dates for a snowmelt dominated basin Evan Heisman CVEN 6833: Advanced Data Analysis Fall 2012 Prof. Balaji Rajagopalan The Dworshak reservoir, a project operated by the Army Corps
PRECIPITATION. Last Week Precipitation:
 12/30/2014 NIDIS Drought and Water Assessment PRECIPITATION The images above use daily precipitation statistics from NWS COOP, CoCoRaHS, and CoAgMet stations. From top to bottom, and left to right: most
Drought and Future Water for Southern New Mexico
 Drought and Future Water for Southern New Mexico David S. Gutzler University of New Mexico gutzler@unm.edu * The big drought of 2018 * Longer term challenges for water supply * Forecasting streamflow Elephant
Colorado s 2003 Moisture Outlook
 Colorado s 2003 Moisture Outlook Nolan Doesken and Roger Pielke, Sr. Colorado Climate Center Prepared by Tara Green and Odie Bliss http://climate.atmos.colostate.edu How we got into this drought! Fort
Colorado weather and climate update: a bit more than halfway through the water year (Or: What s going on with the weather?? )
") Colorado weather and climate update: a bit more than halfway through the water year (Or: What s going on with the weather?? ) Russ S. Schumacher Colorado State Climatologist Director, Colorado Climate
Colorado weather and climate update: a bit more than halfway through the water year (Or: What s going on with the weather?? ) Russ S. Schumacher Colorado State Climatologist Director, Colorado Climate
9. PROBABLE MAXIMUM PRECIPITATION AND PROBABLE MAXIMUM FLOOD
 9. PROBABLE MAXIMUM PRECIPITATION AND PROBABLE MAXIMUM FLOOD 9.1. Introduction Due to the size of Watana Dam and the economic importance of the Project to the Railbelt, the Probable Maximum Flood (PMF)
DK DM M EMORANDUM D ECEMBER 28, 2018 SUBJECT:
 TO: CC: FROM: SUBJECT: BOARD OF DIRECTORS M EMORANDUM D ECEMBER 28, 2018 ANDY MUELLER, GENERAL MANAGER DAVE DK KANZER, P.E. & DON MEYER, P.E. DK DM COLORADO RIVER BASIN WATER SUPPLY CONDITIONS UPDATE AND
PRELIMINARY DRAFT FOR DISCUSSION PURPOSES
 Memorandum To: David Thompson From: John Haapala CC: Dan McDonald Bob Montgomery Date: February 24, 2003 File #: 1003551 Re: Lake Wenatchee Historic Water Levels, Operation Model, and Flood Operation This
NIDIS Drought and Water Assessment
 NIDIS Drought and Water Assessment PRECIPITATION The images above use daily precipitation statistics from NWS COOP, CoCoRaHS, and CoAgMet stations. From top to bottom, and left to right: most recent 7-days
2015 Fall Conditions Report
 2015 Fall Conditions Report Prepared by: Hydrologic Forecast Centre Date: December 21 st, 2015 Table of Contents Table of Figures... ii EXECUTIVE SUMMARY... 1 BACKGROUND... 2 SUMMER AND FALL PRECIPITATION...
Precipitation. Standardized Precipitation Index. NIDIS Intermountain West Regional Drought Early Warning System December 6, 2016
 12/9/2016 NIDIS Drought and Water Assessment NIDIS Intermountain West Regional Drought Early Warning System December 6, 2016 Precipitation The images above use daily precipitation statistics from NWS COOP,
Oregon Water Conditions Report April 17, 2017
 Oregon Water Conditions Report April 17, 2017 Mountain snowpack continues to maintain significant levels for mid-april. By late March, statewide snowpack had declined to 118 percent of normal after starting
NIDIS Intermountain West Drought Early Warning System October 17, 2017
 NIDIS Drought and Water Assessment NIDIS Intermountain West Drought Early Warning System October 17, 2017 Precipitation The images above use daily precipitation statistics from NWS COOP, CoCoRaHS, and
2. PHYSICAL SETTING FINAL GROUNDWATER MANAGEMENT PLAN. 2.1 Topography. 2.2 Climate
 FINAL GROUNDWATER MANAGEMENT PLAN 2. PHYSICAL SETTING Lassen County is a topographically diverse area at the confluence of the Cascade Range, Modoc Plateau, Sierra Nevada and Basin and Range geologic provinces.
NIDIS Intermountain West Drought Early Warning System November 14, 2017
 NIDIS Intermountain West Drought Early Warning System November 14, 2017 Precipitation The images above use daily precipitation statistics from NWS COOP, CoCoRaHS, and CoAgMet stations. From top to bottom,
Colorado CoCoRaHS. Colorado CoCoRaHS. Because Every Drop Counts! October 2014 Volume 2, Issue 10
 U.S. PRECIPITATION (% OF AVERAGE) LOOKING BACK AT SEPTEMBER 2014 September was dry for much of the nation with a few exceptions; one of those being the central Rockies. In Colorado, it was wetter-than-average
San Francisco Public Utilities Commission Hydrological Conditions Report For April 2014
 San Francisco Public Utilities Commission Hydrological Conditions Report For April 2014 J. Chester, C. Graham, A. Mazurkiewicz, & M. Tsang, May 13, 2014 Snow in the High Country The view from Bond Pass
2003 Moisture Outlook
 2003 Moisture Outlook Nolan Doesken and Roger Pielke, Sr. Colorado Climate Center Prepared by Tara Green and Odie Bliss http://climate.atmos.colostate.edu Through 1999 Through 1999 Fort Collins Total Water
NIDIS Intermountain West Drought Early Warning System March 26, 2019
 NIDIS Intermountain West Drought Early Warning System March 26, 2019 The images above use daily precipitation statistics from NWS COOP, CoCoRaHS, and CoAgMet stations. From top to bottom, and left to right:
PRECIPITATION. Last Week Precipitation:
 3/30/2016 NIDIS Drought and Water Assessment PRECIPITATION The images above use daily precipitation statistics from NWS COOP, CoCoRaHS, and CoAgMet stations. From top to bottom, and left to right: most
NIDIS Intermountain West Drought Early Warning System September 4, 2018
 NIDIS Drought and Water Assessment NIDIS Intermountain West Drought Early Warning System September 4, 2018 Precipitation The images above use daily precipitation statistics from NWS COOP, CoCoRaHS, and
January 2011 Calendar Year Runoff Forecast
 January 2011 Calendar Year Runoff Forecast 2010 Runoff Year Calendar Year 2010 was the third highest year of runoff in the Missouri River Basin above Sioux City with 38.8 MAF, behind 1978 and 1997 which
-Assessment of current water conditions. - Precipitation Forecast. - Recommendations for Drought Monitor
 May 31 st, 2011 -Assessment of current water conditions - Precipitation Forecast - Recommendations for Drought Monitor Upper Colorado River Basin Snow Snowpack % of average to date: 347% Percent
Weather Modification Activities in the Colorado River Basin. Mohammed Mahmoud
 Weather Modification Activities in the Colorado River Basin Mohammed Mahmoud Historical Information Authorized by 1968 Basin Project Act Substantially completed in 1993 Responsible for repaying reimbursable
Wind River Indian Reservation and Surrounding Area Climate and Drought Summary
 Northern Arapaho Tribe Wind River Indian Reservation and Surrounding Area Climate and Drought Summary Spring Events & Summer Outlook 2016 Wet Spring Leads To Flooding Spring was very wet across most of
Tracking the Climate Of Northern Colorado Nolan Doesken State Climatologist Colorado Climate Center Colorado State University
 Tracking the Climate Of Northern Colorado Nolan Doesken State Climatologist Colorado Climate Center Colorado State University Northern Colorado Business Innovations November 20, 2013 Loveland, Colorado
Wind River Indian Reservation and Surrounding Area Climate and Drought Summary
 Northern Arapaho Tribe Wind River Indian Reservation and Surrounding Area Climate and Drought Summary Spring Events & Summer Outlook 2015 Spring Was Warm And Very Wet Across The Region The spring season
PRECIPITATION. Last Week Precipitation:
 12/1/2015 NIDIS Drought and Water Assessment PRECIPITATION The images above use daily precipitation statistics from NWS COOP, CoCoRaHS, and CoAgMet stations. From top to bottom, and left to right: most
Missouri River Basin Water Management
 Missouri River Basin Water Management US Army Corps of Engineers Missouri River Navigator s Meeting February 12, 2014 Bill Doan, P.E. Missouri River Basin Water Management US Army Corps of Engineers BUILDING
NIDIS Weekly Climate, Water and Drought Assessment Summary Upper Colorado River Basin Pilot Project 13 July 2010
 NIDIS Weekly Climate, Water and Drought Assessment Summary Upper Colorado River Basin Pilot Project 13 July 2010 Precipitation and Snowpack Over the past week, precipitation in the Upper Colorado River
NIDIS Weekly Climate, Water and Drought Assessment Summary. Upper Colorado River Basin
 NIDIS Weekly Climate, Water and Drought Assessment Summary Upper Colorado River Basin August 3, 2010 Precipitation and Snowpack Fig. 1: July precipitation in inches Fig. 2: July precip as percent of average
Forecast Challenges for the Colorado Basin River Forecast Center
 Forecast Challenges for the Colorado Basin River Forecast Center John Lhotak, Development and Operations Hydrologist Improving Sub-Seasonal to Seasonal (S2S) Workshop May 16th, 2018 1 River Forecast Centers
Souris River Basin Spring Runoff Outlook As of March 1, 2019
 Souris River Basin Spring Runoff Outlook As of March 1, 2019 Prepared by: Flow Forecasting & Operations Planning Water Security Agency Basin Conditions Summer rainfall in 2018 over the Saskatchewan portion
Illinois Drought Update, December 1, 2005 DROUGHT RESPONSE TASK FORCE Illinois State Water Survey, Department of Natural Resources
 Illinois Drought Update, December 1, 2005 DROUGHT RESPONSE TASK FORCE Illinois State Water Survey, Department of Natural Resources For more drought information please go to http://www.sws.uiuc.edu/. SUMMARY.
NIDIS Intermountain West Drought Early Warning System January 16, 2018
 NIDIS Drought and Water Assessment NIDIS Intermountain West Drought Early Warning System January 16, 2018 Precipitation The images above use daily precipitation statistics from NWS COOP, CoCoRaHS, and
The Colorado Drought of 2002 in Perspective
 The Colorado Drought of 2002 in Perspective Colorado Climate Center Nolan Doesken and Roger Pielke, Sr. Prepared by Tara Green and Odie Bliss http://climate.atmos.colostate.edu Known Characteristics of
January 25, Summary
 January 25, 2013 Summary Precipitation since the December 17, 2012, Drought Update has been slightly below average in parts of central and northern Illinois and above average in southern Illinois. Soil
Wind River Indian Reservation and Surrounding Area Climate and Drought Summary
 Northern Arapaho Tribe Wind River Indian Reservation and Surrounding Area Climate and Drought Summary Winter Events & Spring Outlook 2015-2016 Winter Was Warm And Dry Winter was warm and dry for the Wind
REDWOOD VALLEY SUBAREA
 Independent Science Review Panel Conceptual Model of Watershed Hydrology, Surface Water and Groundwater Interactions and Stream Ecology for the Russian River Watershed Appendices A-1 APPENDIX A A-2 REDWOOD
NIDIS Intermountain West Drought Early Warning System December 30, 2018
 1/2/2019 NIDIS Drought and Water Assessment NIDIS Intermountain West Drought Early Warning System December 30, 2018 Precipitation The images above use daily precipitation statistics from NWS COOP, CoCoRaHS,
Drought in Southeast Colorado
 Drought in Southeast Colorado Nolan Doesken and Roger Pielke, Sr. Colorado Climate Center Prepared by Tara Green and Odie Bliss http://climate.atmos.colostate.edu 1 Historical Perspective on Drought Tourism
The following information is provided for your use in describing climate and water supply conditions in the West as of April 1, 2003.
 Natural Resources Conservation Service National Water and Climate Center 101 SW Main Street, Suite 1600 Portland, OR 97204-3224 Date: April 8, 2003 Subject: April 1, 2003 Western Snowpack Conditions and
INVISIBLE WATER COSTS
 Every Drop Every Counts... Drop Counts... INVISIBLE WATER COSTS Corn - 108.1 gallons per pound How much water it takes to produce... Apple - 18.5 gallons to grow Beef - 1,581 gallons per pound Oats - 122.7
NIDIS Weekly Climate, Water and Drought Assessment Summary. Upper Colorado River Basin February 28, 2012
 NIDIS Weekly Climate, Water and Drought Assessment Summary Upper Colorado River Basin February 28, 2012 PrecipitaGon and Snowpack Fig. 1: February month- to- date precipitagon in inches. Fig. 2: February
Let s Talk Climate! Nolan Doesken Colorado Climate Center Colorado State University. Yampatika Seminar February 16, 2011 Steamboat Springs, Colorado
 Let s Talk Climate! Nolan Doesken Colorado Climate Center Colorado State University Yampatika Seminar February 16, 2011 Steamboat Springs, Colorado First -- A short background In 1973 the federal government
Water Supply Conditions and Outlook October 1, 2018
 Water Supply Conditions and Outlook October 1, 2018 Flow Forecasting & Operations Planning Water Security Agency Overview Water supply conditions across Saskatchewan remain near normal, with most reservoirs
NIDIS Intermountain West Drought Early Warning System April 24, 2018
 NIDIS Intermountain West Drought Early Warning System April 24, 2018 Precipitation The images above use daily precipitation statistics from NWS COOP, CoCoRaHS, and CoAgMet stations. From top to bottom,
Midwest and Great Plains Drought and Climate Summary 20 February 2014
 Midwest and Great Plains Drought and Climate Summary 20 February 2014 Wendy Ryan Assistant State Climatologist Colorado Climate Center Colorado State University wendy.ryan@colostate.edu 970-491-8506 General
PRECIPITATION. Last Week Precipitation:
 7/23/2014 NIDIS Drought and Water Assessment PRECIPITATION The images above use daily precipitation statistics from NWS COOP, CoCoRaHS, and CoAgMet stations. From top to bottom, and left to right: most
2003 Water Year Wrap-Up and Look Ahead
 2003 Water Year Wrap-Up and Look Ahead Nolan Doesken Colorado Climate Center Prepared by Odie Bliss http://ccc.atmos.colostate.edu Colorado Average Annual Precipitation Map South Platte Average Precipitation