Sheridan Expressway-Hunts Point Planning Study
|
|
|
- Sheila Stephens
- 5 years ago
- Views:
Transcription
1 Sheridan Expressway-Hunts Point Planning Study Final Summary Report Summary of Hunts Point Markets Driver Surveys March 2012 Prepared for: NYC Department of Transportation Prepared by: STV Incorporated i
2 Table of Contents Executive Summary... iii 1. Purpose and Need of Survey Analysis Approach/Methodology Vehicle Classification Count Findings Survey Data Results and Reduction a. Survey Data Results for Fish Market b. Survey Data Results for Meat Market c. Survey Data Results for Produce Market Conclusions Lessons Learned from Survey Effort List of Tables Table 1: Sample Size Targets Based on Vehicle Classifications... 8 Table 2: Vehicle Class Results for Fish Market Table 3: Product In and Product Out Results by Vehicle Class for Fish Market Table 4: Product In for Fish Market by Origin Table 5: Product Out for Fish Market by Destination Table 6: Product In and Out for Fish Market by O/D Table 7: Frequency of Visit Results for Fish Market Table 8: Trip Origin Results for Fish Market Table 9: Trip Destination Results for Fish Market Table 10: Time or Schedule Results for Fish Market Table 11: Survey Question 8a: if yes to Question 8, do you Table 12: Vehicle Class Results for Meat Market Table 13: Product In and Product Out Results by Vehicle Class For Meat Market Table 15: Product Out for Meat Market by Destination Table 16: Product In and Product Out for Meat Market by O/D Table 17: Frequency of Visit Results for Meat Market Table 18: Trip Origin Results for Meat Market Table 19: Trip Destination Results for Meat Market Table 20: Time or Schedule Results for Meat Market Table 21: Survey Question 8a: if yes to Question 8, do you Table 22: Vehicle Class Results for Produce Market Table 23: Product In and Product Out in Results for Produce Market Table 24: Product In Results for Produce Market by Origin Table 25: Product Out Results for Produce Market by Destination Table 26: Product In and Out Produce Market by O/D Table 27: Frequency of Visit Results for Produce Market Table 28: Trip Origin Results for Produce Market Table 29: Trip Destination Results for Produce Market Table 30: Time or Schedule Results for Produce Market Table 31: Survey Question 8a: if yes to Question 8, do you Table 33: Product Out by Destination for All Markets i
3 Table 34: Both Product In and Product Out by Origin /Destination for All Markets Table 35: Sheridan Expressway Users List of Figures Figure 1: Hunts Point Market Study Area and Routes... 1 Figure 2: Fish Market 24-hour Arrivals by Hour by Vehicle Class... 4 Figure 3: Produce Market 24-hour Arrivals by Hour by Vehicle Class... 5 Figure 4: Meat Market 24-hour Arrivals by Hour by Vehicle Class... 6 List of Appendices Appendix...46 ii
4 Executive Summary On-site origin/destination surveys were conducted at the three public wholesale markets in Hunts Point markets the New Fulton Fish Market (Fish Market), the Hunts Point Meat Market (Meat Market), and the Hunts Point Terminal Produce Market (Produce Market) to gain an understanding of tripmaking characteristics for vehicles entering and leaving the Hunts Point markets in terms of vehicle class, vehicle origins and destinations, reasons for the trip (i.e., delivering product to the facility or taking out product that was purchased at the facility), and local and regional access routes used for travel to and from the Hunts Point markets. The data collected and the findings of the surveys will be used to supplement the on-going analysis for the Sheridan Expressway-Hunts Point Planning Study. Several steps were undertaken to prepare for the full survey, including site visits to check for unusual roadway configurations, coordination with each market manager, pre-survey traffic counts for market entries to identify the weekday periods with the highest traffic volumes for the subsequent full driver surveys, and a pilot survey to test a draft questionnaire. The actual full surveys were performed in mid-september Over 1,400 surveys were collected for all three markets, with a target sample size of 95-percent confidence level with a confidence interval of +/-5. Vehicle Classification Count Findings The Produce and Fish Markets had similar ten-hour peak periods during their typical weekday operations, beginning in the early morning (12-1 AM) and continuing through the late morning (10-11 AM). Conversely, the peak ten-hour period for the Meat Market started and ended later, beginning at 5 AM and ending at about 4 PM. The Meat and Fish markets exhibited sharp peaks with vans, box trucks (2- and 3-axle trucks), and tractor trailers arriving during their peak periods. On the other hand, the Produce Market had about one-third of its tractor trailers arriving during its peak period. Market Survey Findings a. Product In vs. Product Out Taking Product In For vehicles bringing product into the markets, the most common origins were New Jersey, the Bronx, Long Island, Queens, and Brooklyn. Taking Product Out Vans and box trucks also were almost exclusively used to take product out of the markets. For all three markets, a majority of activity involved taking product out of the markets and distributing it to destinations primarily in Manhattan, New Jersey, the Bronx, Queens, and Long Island. At the Fish and Produce Markets, over 80 percent of the vehicles were taking product out. For the Meat Market, this percentage was somewhat lower at 70 percent. Both There were some cases when vehicles both brought in product and took out product; however, they represented very small percentages. The most common origins for these types of trips were the Bronx, Long Island, Queens, Manhattan, and Westchester. iii
5 b. Trip Repetition Nearly all the Fish Market (93 percent) indicated that they visit the market either every day or a few times per week. Similarly, a majority of Produce Market (85 percent) and Meat Market (75 percent) answered that they visit the market either every day or a few times per week. Frequent trips to the markets have cascading effects on travel frequency and use of local and regional roads. c. Routings From southeast of Hunts Point, the Throgs Neck and Whitestone bridges were most often used to cross into the Bronx, followed by the Robert F. Kennedy (RFK) (formerly, Triboro) Bridge. Once in the Bronx, the Bruckner Expressway was most often used to travel to the markets. None of these routes resulted in the use of the Sheridan Expressway. Generally, coming from the New England Division states, most drivers used the New England Thruway, and most connected to the Bruckner Expressway while some connected to the Sheridan Expressway. For the New York State areas that are north of the five boroughs, the two routes to cross the Bronx were I-87 and the. After that, some drivers would stay on the Major Deegan Expressway to connect to the Bruckner Expressway or use the Cross Bronx Expressway to the Sheridan Expressway. From Manhattan, the Willis Avenue Bridge was the primary crossing used to enter the Bronx, from which Bruckner Boulevard was used to travel to the markets. Returning to Manhattan, the Third Avenue Bridge (which forms the outbound crossing of a one-way pair with the Willis Avenue Bridge) was most often used. In general, for all three markets, from points west (and to a small extent from the north), the -Trans-Manhattan Expressway-Alexander Hamilton Bridge corridor was used to cross into the Bronx. From the, the two primary routes used to access the markets were the Major Deegan/Bruckner Expressway combination and the Cross Bronx/Sheridan Expressway combination. The Sheridan Expressway was used by approximately 19 percent of all trips into and out of Hunts Point. Thus, the influence of commercial travel from or through New Jersey on the use of the Sheridan Expressway was significant (about 1 in 5 trips to and/or from Hunts Point markets). d. Lessons Learned Based on the surveys conducted at the Hunts Point Markets, the following lessons and recommendations for future conduct of origin/destination (O/D) surveys at the markets are presented below. Increase the Number of Surveyors at Each Entry Lane Increasing the number of surveyors at each entry lanes would allow surveyors to leap frog each other while conducting surveys. Stationing at least two surveyors (from one) per open lane would increase the capture rate for completing surveys. Lengthen Survey Duration Increase the number of hours of the survey to capture a reasonable number of vehicles of a certain type to improve survey accuracy. For example, a reasonable number of tractor iv
6 trailers could not be surveyed for the Produce Market within the ten-hour survey period because of the low volumes of entries during the peak period. Survey Timing While a significant effort was made to identify the peak ten-hour time period to capture the highest number of vehicles entering the markets, it was observed that by 7 AM, traffic volumes began to fall and by 9 AM, the peaks were virtually over. It is recommended that the surveys be started closer to the opening time of the markets and with additional personnel to better cover heaviest peak activity. Focused Survey Questions and Choices Focused questions and responses allow for faster implementation of the survey, and ensure accurate answers (i.e., less confusion on the part of the person being surveyed or chance of error) and less time required for data reduction. There should be no extraneous questions included in the surveys that are not related to the core purpose of the survey irrespective of how brief an inquiry may be. The survey focus will vary depending on the nature of the information being sought; however, more care on the part of the survey team should involve a focus on logical O/D links so that when a driver answer is given that is illogical, the surveyor immediately knows to re-ask the question. Origin/destination questions should specify whether drivers are questioned based on the start/end of their trips on the survey date or the beginning/end of their journey. Multi-Lingual Surveyors While some multilingual surveyors that spoke Chinese and Spanish were part of the overall survey team at each market, not every surveyor had these skills nor were such staff available for each lane. Thus, there were some instances when a language barrier prevented a survey from being conducted. However, the capture rate could be increased by having interpreters at every lane. v
, and the Hunts Point Terminal Produce Market (Produce Market).")
7 1. Purpose and Need of Survey On-site origin/destination surveys were conducted at the three public wholesale markets in Hunts Point: the New Fulton Fish Market (Fish Market), the Hunts Point Cooperative Market (Meat Market), and the Hunts Point Terminal Produce Market (Produce Market). The purpose of this effort was to gain an understanding of tripmaking characteristics for vehicles entering and leaving the Hunts Point markets in terms of: vehicle class, i.e., the types and quantities of vehicles accessing these facilities (vans, box trucks, tractor trailers), vehicle origins and destinations, i.e., the location where the vehicle begins and ends its trip, trip purpose, i.e., delivering product to the facility or taking out product that was purchased at the facility, and local and regional access routes, i.e., the in and outbound access routes used for travel to and from the Hunts Point markets. The data collected and the findings of the surveys will be used to supplement the on-going analysis for the Sheridan Expressway-Hunts Point Land Use & Transportation Study. The Hunts Point markets (indicated by the star) as well as the primary crossings and routes used to access the markets are shown in Figure 1. Figure 1: Hunts Point Market Study Area and Routes 1
8 2. Analysis Approach/Methodology A number of steps were undertaken to prepare for the full survey. First, during the early morning hours of July 28, 2011, STV staff visited each market entry to observe queue buildups, if any, at each gate; whether there were any unusual roadway configurations either at each market or on the adjacent roadways that may affect the stationing of STV field personnel; and to determine vehicle processing rates at the gates. During this field reconnaissance it was observed that a number of drivers were of Asian or Hispanic origin, so during preparatory discussions held, we included staff that had foreign language skills to administer the survey to such drivers. New York City Economic Development Corporation (NYCEDC) assisted with coordination with each market manager in terms of the purpose for the study, and whether the actual survey method (of having field personnel speak with each truck or van driver as they enter) was acceptable. There were also discussions involving possible concerns about queue buildup caused by the surveyors conducting each driver interview. If this were to occur, surveyors were to temporarily cease work to allow vehicle queues to dissipate. Market manager asked the STV team to prepare informational flyers for them to distribute to entering drivers at each plaza (see Appendix 1) informing the drivers of the upcoming survey 1. In early July 2011, New York City Department of Transportation (NYCDOT) undertook 24-hour traffic counts for one-week period at the market entrances. In addition, one full day of vehicle classification counts were conducted on July 8 th (Meat Market), July 11 th (Produce Market), and August 14 th (Fish Market) 2. Using these data, an analysis was undertaken to identify the day of the week with the highest traffic volumes and the highest ten-hour peak period, which determined the days and time periods to perform the full driver surveys. In addition, prior to conducting the full driver survey, a questionnaire was developed and tested via a pilot survey conducted on Thursday, September 1 st between 5:30 and 9 AM at all three markets 3. Based on the results of the pilot survey, some revisions to the questionnaire were made to simplify the survey questions, and eliminate any questions that were found to be confusing. One potentially confusing question that was eliminated related to asking the driver whether he or she was a jobber, part of a tenant fleet, food distributer, direct customer, or independent trucker. This question was removed from the survey because many surveyed drivers did not know their job type. The final survey instrument is shown in Appendix 2. The survey data collection effort was structured as follows: 1 The number of flyers distributed was 9,000 at the Produce Market, and 3,000 each at the Meat and Fish Markets. 2 Both the week-long entry count and one-day vehicle classification count data were collected through the use of video cameras installed at each market entry roadway by American Traffic Information (ATI), a traffic count subconsultant, under a separate NYCDOT task order. 3 The times of the pilot surveys were: Food Market, 5:30-6:30 AM; Meat Market, 6:45-7:45 AM; Produce Market, 8-9 AM 2
9 The toll plaza represented the cordon line for each market. Three to four surveyors and one supervisor/relief person were positioned at the toll booth entrances of each market to intercept vehicles as they entered the facility prior to paying the entry toll; vehicles were not surveyed or stopped as they left the facility. In addition, passenger vehicles and service vehicles (i.e., plumbers, refrigeration repairs, etc.) were not surveyed. The configuration of each toll plaza by market is: Fish Market: 3 entry lanes, 2 exit lanes Meat Market: 3 entry lanes; 1 exit lane Produce Meat: 4 entry lanes; no exit lanes at toll plaza The O/D surveys were performed on the following three days: Meat Market, Friday, September 9 th (5 AM to 3 PM) Fish Market, Friday, September 16 th (12 to 10 AM) Produce Market, Monday, September 19 th (1 to 11 AM) 4 3. Vehicle Classification Count Findings The following findings are based on analyses of the September 2011 vehicle classification counts at the entrance to each market. These data were used to establish the confidence levels for the number of surveys collected. Both the Produce and Fish Markets had similar ten-hour peak periods during their typical weekday, beginning in the early morning (12-1 AM) and continuing through the late morning (10-11 AM). Both of these markets exhibited sharp peaks with vans, box trucks, and tractor trailers arriving during the peak period. Conversely, the peak ten-hour period for the Meat Market started and ended later, beginning at 5 AM and ending at about 4 PM. The majority of vans and box trucks bound for the Meat Market per day entered the facility during this peak period, whereas just over half of all the tractor trailers arrived during the same time period. Figures 2 to 4 show the 24-hour arrivals for the markets. 4 The survey was originally planned for Monday, September 12 th ; however, the Director of Public Safety for the Produce Market was not properly informed prior to the conduct of the survey to direct his staff to allow survey personnel presence. This resulted in a one-week delay to establish the proper protocol. 3
10 Figure 2: Fish Market 24-hour Arrivals by Hour by Vehicle Class 4

11 Figure 3: Produce Market 24-hour Arrivals by Hour by Vehicle Class 5

12 Figure 4: Meat Market 24-hour Arrivals by Hour by Vehicle Class 6
13 4. Survey Data Results and Reduction The appropriate sample size was calculated based on: 1) traffic volumes of the peak day of the week, and 2) whether the appropriate sample size could be obtained during a ten-hour survey period on a selected peak day of the week. In general, a reasonable sample size was determined on achieving 95-percent confidence level with a confidence interval of +/-5 (i.e., a 95-percent certainty that the percentage of the population who would pick an answer lies within the confidence interval, in this case +/-5). Table 1 lists by market, the total number of vehicles by vehicle class on the survey day based on the 24-hour classification counts, the recommended sample size to achieve 95-percent confidence level with a confidence interval of +/-5 and +/-6, the total number of vehicles surveyed by vehicle class for the peak ten-hour period. Over 1,400 surveys were collected for all three markets. Every effort was made to achieve the target sample size for a 95-percent confidence level with a confidence interval of +/-6, at a minimum within the ten-hour survey period. However, in the cases where this was not achieved, it was due to elements beyond the surveyors control (for example, the low number of tractor trailers that entered the Fish Market during the survey period). Also, there were a few cases where the surveyor did not record the vehicle type, so the vehicle-type data discussed below does not include such incomplete surveys. For the Produce Market, a total of 605 surveys was collected (159 vans, 335 box trucks, 111 tractor trailers). Vans achieved a 95-percent confidence level, with a confidence interval of +/-7. Box trucks met the needed sample size to achieve 95-percent confidence level with a confidence interval of +/-5. Tractor trailers attained a 95-percent confidence level, with a confidence interval of +/-9. For the Meat Market, a total of 405 surveys was collected (99 vans, 203 box trucks, 101 tractor trailers, 2 unidentified). Vans met the 95-percent confidence level, with a confidence interval of +/-9. Box trucks and tractor trailers achieved a 95-percent confidence level, with confidence intervals of +/-6 and +/-7, respectively. For the Fish Market, a total of 394 surveys was collected (224 vans, 160 box trucks, 10 tractor trailers). Vans met 95-percent confidence level, and with a confidence interval of +/-4. Box trucks met the sample size for 95-percent confidence level with a confidence interval of +/-5. The capture rate for tractor trailers was about 80 percent; however, the expected number of tractor-trailers based on the vehicle classification counts did not arrive. Thus, tractor trailers met the 95-percent confidence level, it did so with a confidence interval of +/-16. The collected data were reduced and summarized using Excel spreadsheets (which can be found in the Appendices 3-8). After the data were entered, cleaning steps, such as grouping specific destinations/origins into broader well-known locations, were necessary. For example, Astoria and Flushing were categorized as Queens. In addition, complete routes were developed out of partial answers when possible. If a survey had the to Major Deegan Expressway as the route taken to the markets, it was assumed that they would also take the Bruckner Expressway. This assumption was made because the Major Deegan Expressway turns into Bruckner Expressway after the RFK Bridge; however, a path to the markets via the Major Deegan Expressway could involve vehicles to use Bruckner Boulevard. In cases where there was more than one logical choice to complete a route, the answer was left alone so as to not skew the 7
14 survey. For example, an answer such as to Cross Bronx Expressway has multiple options: from the Cross Bronx a driver could primarily use the Major Deegan route, the Sheridan Expressway route, or local streets to access the markets. Table 1: Sample Size Targets Based on Vehicle Classifications Market 24-hr Count 95% CI (confidence interval of 5) Produce Market, 1-11 AM, Monday, 9/19/11 95% CI (confidence interval of 6) Recommended Sample Size 8 Peak- Period Volume 95% CI (confidence interval achieved) of the 24-hr Count Surveys Collected Van Box Truck 1, * Tractor Trailer Total 2, , * Meat Market, 5 AM-3 PM, Friday, 8/9/11 Van Box Truck Tractor Trailer Total 1, * Fish Market, AM, Friday, 8/16/11 Van * Box Truck * Tractor Trailer Total * * confidence interval met Incomplete surveys (such as those that had one or two unanswered questions or selected answers that do not make sense) were also counted toward the final totals because they do contain useful information from other questions. The main reasons for these unusable/missing answers were due to drivers not understanding the question, not knowing the answer (i.e., not pay attention to the roadway names due to route familiarity), or refusing to answer (impatient to move forward in the line). Therefore, in some cases, individual question totals will not always add up to the grand total number of surveys collected for the market. The following sections of the report will provide details regarding where trips are originating from or destined to. For reader clarity, refer to the following geographic notes. Trips to/from outside of New York State, the U.S. Census division categories (under regions) were used. i) Northeast Region New England Division (ME, NH, VT, MA, RI, CT) Middle Atlantic Division (NY, PA, NJ) ii) South Region South Atlantic Division (MD, DE, WV, VA, Washington DC, NC, SC, GA, FL)
15 East South Central Division (KY, TN, MS, AL) West South Central Division (OK, AR, TX, LA) iii) Midwest Region East North Central Division (WI, MI, IL, IN, OH) West North Central Division (ND, SD, MN, NE, IA, KS, MO) iv) West Region Mountain Division (MT, ID, WY, NV, UT, CO, AZ, NM) Pacific Division (AK, WA, OR, CA, HI) Trips within New York City are referred to by borough; namely, Manhattan, Bronx, Queens, Brooklyn, and Staten Island. Trips to/from Long Island refer to Nassau and Suffolk counties. The term Upstate was used as a catchall for all counties other than the five New York City boroughs (each of which is a separate county) and Westchester County. Thus, Upstate refers to 56 counties north of Westchester County. 9
16 4a. Survey Data Results for Fish Market Survey Question 1: Vehicle Class More than half of the vehicles entering the Fish Market were vans, accounting for 57 percent of vehicles. Box trucks represent the other significant number of vehicles entering the market, at just over 40 percent. Tractor trailers only represent 2.5 percent of the vehicles entering the Fish Market. The results for this survey question are listed in Table 2. Table 2: Vehicle Class Results for Fish Market Vehicle Type Van Box Truck Tractor Trailer Total Total Survey Question 2: Are you taking product out or bringing product in or both? The majority of vehicles (87 percent) entering the Fish Market were taking product out. That is, vehicles were arriving empty and picking up product to bring back to their business or distribute to businesses. Vehicles taking out products from the Fish Market were predominantly destined to New York City, New Jersey, and Long Island. The destinations with the highest percentages were New Jersey (19 percent), Manhattan (16 percent), Queens (14 percent), the Bronx (14 percent), Brooklyn (12 percent), and Long Island (11 percent). Of the vehicles taking product out, approximately 60 percent were vans and almost 40 percent were box trucks. Only one tractor trailer was taking product out, the rest of the tractor trailers (nine vehicles) were bringing product in. Some of the tractor trailers were coming from local airports (such as Newark International Airport) and shipping ports (in Elizabeth, NJ). Only 10 percent of vehicles were bringing in product or making deliveries to the Fish Market (60 percent of these were made by box trucks). Vehicles bringing product into the Fish Market generally originated from within New York City, New Jersey, and Long Island. Queens (23 percent), Long Island (15 percent), and New Jersey (13 percent) accounted for the highest percentage of origins in New York City, New Jersey, and Long Island. In addition, Maryland (within the South Atlantic Division of the South Region) had a significant share of vehicles bringing product into the Fish Market, accounting for over 12 percent of the total number of vehicles making deliveries to the Fish Market. The results for this survey question are listed in Tables 3 to 6. Table 3: Product In and Product Out Results by Vehicle Class for Fish Market Vehicle Class Bringing Product In Taking Product Out Both No Answer Total % Box Truck Vans Tractor Trailer Total
17 Table 4: Product In for Fish Market by Origin Product In Origin Total % New England MA ME Middle Atlantic NJ South Atlantic MD VA FL Long Island Queens Upstate New York State Manhattan Bronx Brooklyn Staten Island Total Table 5: Product Out for Fish Market by Destination Product Out Destination Total % MA New England CT ME Middle Atlantic NJ Long Island Queens Westchester New York State Upstate Manhattan Bronx Brooklyn Staten Island No Answer Total
18 Table 6: Product In and Out for Fish Market by O/D Both-Product In and Product Out Origin/Destination Total % New England MA/MA New York State Queens/Queens Bronx/Bronx Bronx/Manhattan Brooklyn/Brooklyn Long Island/Queens Long Island/Manhattan Total Survey Question 3: How often do you visit? Over 90 percent of indicated that they traveled to the Fish Market either a few times per week (48 percent) or every day (44 percent). The results for this survey question are listed in Table 7. Table 7: Frequency of Visit Results for Fish Market Frequency of Visit Few Times/Month Few Times/Week Daily Rarely No Answer Total Total Survey Question 4: Where did you begin your trip? Approximately 73 percent of trips to the Fish Market originated within New York State. The top three origins within New York were Queens with 20 percent, and Brooklyn and Long Island both at 12 percent. From the Middle Atlantic Division (within the Northeast Region), New Jersey accounted for over 21 percent overall for the region. A few vehicles (4 percent) came from the New England Division (of the Northeast Region). Fewer than 1 percent of the vehicles originated from the South Atlantic Division of the South Region (i.e., Florida). The results for this survey question are listed in Table 8. 12
19 Table 8: Trip Origin Results for Fish Market Origin Total % ME New England MA CT Middle Atlantic PA NJ MD South Atlantic VA FL Long Island Queens Westchester New York State Upstate Manhattan Bronx Brooklyn Staten Island Total Survey Question 5: How did you get here today? The following section summarizes popular routes taken by the drivers to the Fish Market. Due to a high percentage of drivers from New York State, the region was broken down to more specific areas. Similarly New Jersey, although belonging to the Middle Atlantic Division (of the Northeast Region), is mentioned separately below. Inbound Fish Market trips were categorized by the Bronx screenline location which marked their entry into the study area. There are eight such primary entry points, listed below in order of highest use (see Appendix 9 for trip distribution figures). Throgs Neck/Whitestone Bridge to Bruckner Expressway/Boulevard (27 percent) to Cross Bronx Expressway to Sheridan Expressway 20 percent) RFK Bridge to Bruckner Boulevard (15 percent) Willis Avenue Bridge to Bruckner Boulevard (11 percent) Local streets and highways from Bronx origins (such as Southern Boulevard) (10 percent) All other entry routes (such as I-87, Macombs Dam Bridge, 138 th Street Bridge) (7 percent) (These could include a few indirect routings such as the New England Thruway to the Cross Bronx Expressway to the Sheridan Expressway.) New England Thruway to Bruckner Expressway/Boulevard (6 percent) to Major Deegan Expressway to Bruckner Boulevard (4 percent) 13
20 From the Bronx Just over 40 percent of with Bronx trip origins indicated they used local streets. Bruckner Expressway was a popular choice with 22 percent of drivers using the roadway as part of their route to the market. Twelve percent of traveled on Bruckner Boulevard. Cross Bronx and Major Deegan expressways were used by 9 percent of the drivers. Only 3 percent of the drivers replied they used the Sheridan Expressway. These drivers would travel southbound on the Bronx River Parkway to connect to the Bruckner Expressway via the Sheridan Expressway. From Brooklyn For trips originating in Brooklyn, three routes comprise 80 percent of the responses. Almost half (40 percent) crossed the Willis Avenue Bridge and took Bruckner Boulevard to the Fish Market. Another quarter of drivers crossed the RFK Bridge to Bruckner Expressway. Finally, nearly 20 percent of drivers used the Throgs Neck or Whitestone Bridge to Bruckner Expressway. From Manhattan For the 20 drivers who originated in Manhattan, 70 percent of them (14 ) used the Willis Avenue Bridge to cross into the Bronx and then used Bruckner Boulevard in the Bronx. The Major Deegan Expressway was the answer for two drivers. From Queens More than half of (60 percent) crossed the Throgs Neck or Whitestone Bridge to the Bruckner Expressway to access the Fish Market. Approximately 30 percent of drivers used the RFK Bridge to the Bruckner Expressway. A small percentage (5 percent) used the Willis Avenue Bridge from Manhattan to Bruckner Boulevard (a no-toll option). From Long Island From Long Island, over three-fourths of drivers (77 percent) responded that they used the Throgs Neck or Whitestone Bridge to the Bruckner Expressway. A small percentage (9 percent) used the RFK Bridge to the Bruckner Expressway. A few drivers indicated they used RFK Bridge or Willis Avenue Bridge to Bruckner Boulevard. From Upstate Twenty percent of indicated that they used the Major Deegan Expressway to the Bruckner Expressway. Fifteen percent of indicated that they crossed into the Bronx via the, then to the Cross Bronx and Sheridan expressways. Another 10 percent indicated using the, then looping south using the Major Deegan Expressway to Bruckner Expressway. From Westchester One-third of indicated that they used the New England Thruway (I-95 South) to the Bruckner Expressway. Similar to the from Upstate, 25 percent of said they used the Major Deegan and Bruckner expressways. The remaining responses indicate that I-87 and the Bronx River Parkway were used. The two that took the Bronx River Parkway were vans. From New England Division (of the Northeast Region) For the drivers from the New England Region (i.e., Connecticut, Massachusetts, Maine), the popular route was New England Thruway to Bruckner Expressway or Bruckner Boulevard. From South Atlantic Division (of the South Region) The majority of the drivers coming from the South Atlantic Division avoided Manhattan and used the to cross over into the 14
21 Bronx. Most of the drivers took the Cross Bronx Expressway to the Sheridan Expressway from the. Some drivers would travel southbound via the Major Deegan Expressway to the Bruckner Expressway. From New Jersey Almost two-thirds (63 percent) of the indicated they used the to the Cross Bronx and Sheridan expressways. The to the Major Deegan and the Bruckner expressways was an alternate route, and represented 14 percent of responses. Nearly 20 percent of drivers indicated using the and Cross Bronx Expressway without indicating which roadway was used to access the Hunts Point Markets (thought the Sheridan Expressway was likely to be used to access the markets). The remainder of the used the Willis Avenue Bridge from Manhattan. Survey Question 6: Where will you be going after you leave the market? Within New York City (i.e., the five boroughs), Queens had the highest percentage of destinations at almost 16 percent, Manhattan followed closely at just over 15 percent, the Bronx had 12 percent, Brooklyn had 11 percent, and Staten Island had 1 percent (see Table 9). For the rest of New York State, approximately 10 percent of the drivers went to Long Island after departing the Fish Market, 5 percent went Upstate, and 3 percent were destined to Westchester. For the Middle Atlantic area, New Jersey accounted for over 17 percent of the destinations. The highest destination for the New England Division was to Connecticut, with almost 3 percent. Massachusetts had almost 2 percent of destinations. Rhode Island and Maine had less than 1 percent of destinations. Two drivers (less than 1 percent) replied that they were uncertain about their destination because they would receive instructions within the market. Eleven drivers (just under 3 percent) did not answer the question. 15
22 Table 9: Trip Destination Results for Fish Market Destination Total % ME New England MA CT RI Middle Atlantic NJ PA South Atlantic MD Long Island Queens Westchester New York State Upstate Manhattan Bronx Brooklyn Staten Island Uncertain No Answer Total Survey Question 7: What route will you take to your next destination? The following section summarizes popular routes taken by the drivers departing the Fish Market. Due to a high percentage of drivers from New York State, the region was broken down to more specific areas. Only New Jersey was mentioned below for the Middle Atlantic Division (of the Northeast Region) because it accounted for almost 98 percent. Outbound Fish Market trips were categorized by the Bronx screenline location which marked their exit out to the study area. There are eight such primary exit points, listed below in order of highest use (see Appendix 9 for trip distribution figures). Bruckner Expressway/Boulevard to Throgs Neck/Whitestone Bridge (22 percent) Bruckner Boulevard to Third Avenue Bridge (16 percent) Sheridan Expressway to Cross Bronx Expressway to (16 percent) All other exit routes (such as I-87, Macombs Dam Bridge, 138 th Street Bridge) (14 percent) (These could include a few indirect routings such after exiting Hunts Point, drivers use the Sheridan Expressway to the Cross Bronx Expressway to the Whitestone Bridge.) Local streets and highways to Bronx destinations (such as Southern Boulevard) (14 percent) Bruckner Boulevard to RFK Bridge (12 percent) Bruckner Expressway/Boulevard to New England Thruway (4 percent) Bruckner Boulevard to Major Deegan Expressway to (2 percent) 16
23 To The Bronx Approximately half of the did not answer this question. Most of these drivers had taken the same route many times, thus they no longer pay attention to the names of the roadways. Of the half that did respond to the question, 25 percent would use local streets or Bruckner Boulevard. The Major Deegan Expressway/Bruckner Expressway combination was mentioned by another 13 percent. To Brooklyn Over one-third of (36 percent) would take the Bruckner Expressway to the RFK Bridge to their destinations. Another quarter indicated they would use Bruckner Boulevard to the Third Avenue Bridge. Finally, 10 percent would use the Bruckner Expressway to access the Throgs Neck or Whitestone Bridge. To Manhattan Sixty percent of the drivers destined for Manhattan said they would use Bruckner Boulevard and the Third Avenue Bridge. The remainder of responses indicated they would use various local streets or highways to the Third Avenue Bridge or the RFK Bridge, but these percentages were small. To Queens The Throgs Neck or Whitestone Bridge and the RFK Bridge were the primary crossings used from the Bronx to Queens. Over 60 percent would use the Bruckner Expressway to access the Throgs Neck or Whitestone Bridge. Approximately 25 percent of drivers would use the Bruckner Expressway to cross via the RFK Bridge. A small percentage (8 percent) would use Bruckner Boulevard to access either the RFK or Third Avenue bridges. However, when traveling southbound from Hunts Point, drivers could only access the on-ramp of the RFK Bridge via Bruckner Boulevard. Thus, it may be that these drivers had mistaken the Bruckner Expressway for the Bruckner Boulevard, or do not differentiate between the two. To Long Island To return to Long Island, drivers overwhelmingly responded that they would use the Bruckner Expressway to the Throgs Neck or Whitestone Bridge (85 percent). Similar to the Queens-bound drivers, a small percentage (5 percent) may have mistaken the Bruckner Expressway for the Bruckner Boulevard as the route used to access the RFK Bridge. The remaining drivers indicated they would use Bruckner Boulevard to access these bridges or travel to Manhattan via the Third Avenue Bridge. To Upstate A quarter of indicated that they would use the Major Deegan and Bruckner expressways. Fifteen percent said they would use the Bruckner Expressway to New England Thruway (I-95 North). Ten percent of drivers responded that they would use the Bruckner Expressway to the Sheridan Expressway to Cross Bronx Expressway to the. To Westchester More than half of drivers (55 percent) took the Bruckner Expressway to New England Thruway. One-quarter of indicated that they would use the Major Deegan and Bruckner expressways. Nearly 20 percent of (two vans) indicated that they would use the Bruckner Expressway to the Bronx River Parkway. New England Division (of the Northeast Region) The majority of these drivers replied that they would take the Bruckner and Cross Bronx expressways to connect to the New England Thruway. 17
24 To New Jersey Nearly 70 percent of drivers destined to New Jersey indicated they would use the Sheridan Expressway to the Cross Bronx Expressway to the to return to New Jersey. Almost 10 percent would use the Bruckner and Major Deegan expressways to the. Nearly 15 percent of drivers indicated they would use the Cross Bronx Expressway and the, without indicating which roadway would be used to access the Cross Bronx Expressway. Survey Question 8: When you leave the market, do you need to get to your destination by a certain time? Approximately 65 percent of drivers surveyed indicated that they did not have to be at a specific destination after leaving the Fish Market, especially for drivers from farther away as they replied that their supervisors understood that traffic could be very unpredictable. Thirty-two percent of drivers responded that they did have to arrive at their destination at a certain time, although the majority of these drivers indicated that if they were late, there would be no consequences. For drivers who indicated there would be some type of consequence associated with arriving late to their destination, approximately 20 percent indicated that they would lose business, about 4 percent indicated that they would need to pay a fine, and roughly 2 percent responded that they would be in trouble with boss. The results for this survey question are listed in Tables 10 and 11. Table 10: Time or Schedule Results for Fish Market Time or Schedule Requirement Yes No No Answer Total Totals Table 11: Survey Question 8a: if yes to Question 8, do you Consequence of Being Late Total Responses % Nothing Lose business Pay fine No answer Stuck in traffic Trouble with boss Customer complaints Total
25 4b. Survey Data Results for Meat Market Survey Question 1: Vehicle Class Half of the vehicles entering the Meat Market were box trucks. Tractor trailers and vans, each accounted for about 25 percent of the total number of vehicle surveyed. The results for this survey question are listed in Table 12 below. Table 12: Vehicle Class Results for Meat Market Vehicle Type Van Box Truck Tractor Trailer No Answer Total Total Survey Question 2: Are you taking product out or bringing product in or both? Over 67 percent of vehicles entering the Meat Market were taking product out. Just over 29 percent of vehicles were bringing product in or making a delivery to the Meat Market. Approximately half of the vehicles entering the Meat Market were box trucks. About 75 percent of these box trucks were taking product out. Vans and tractor trailers, each makes up about 25 percent of the total vehicles surveyed. Nearly half of the vehicles that brought product in were tractor trailers. For vehicles bringing product in, New Jersey accounted for the highest share of origins, at over 24 percent. The Bronx, Brooklyn, and Long Island accounted for sizeable percentages of origins at over 10 percent for the Bronx and Long Island individually, and just over 9 percent for Brooklyn. Virginia, Delaware, and North Carolina (within the South Atlantic Division of the South Region), each represents between 5 and 6 percent of the origins. For vehicles taking product out, the Bronx was the destination for 24 percent of these trips. Other high percentage destinations were Manhattan, New Jersey, and Queens, with about 13 percent each. Long Island, Brooklyn, Upstate, and Westchester County, each fell within the 5 to 6 percent range. The results for this survey question are listed in Tables 13 to 16. Table 13: Product In and Product Out Results by Vehicle Class For Meat Market Vehicle Class Bringing Product In Taking Product Out Both No Answer Total % Box Truck Vans Tractor Trailer No Answer Total
26 Table 14: Product In for Meat Market by Origin Product In Origin Total % New England CT Middle Atlantic NJ PA DE MD South Atlantic VA SC NC Long Island Queens Upstate New York State Manhattan Bronx Brooklyn Westchester IN East North Central IL MI OH West North Central NE West South Central TX Canada Total
27 Table 15: Product Out for Meat Market by Destination Product Out Destination Total % New England MA CT Middle Atlantic NJ PA VA South Atlantic NC DE Long Island Queens Westchester New York State Upstate Manhattan Bronx Brooklyn Staten Island Mountain UT Canada Uncertain No Answer Total
28 Table 16: Product In and Product Out for Meat Market by O/D Both-Product In and Product Out Origin/Destination Total % New England/ Middle Atlantic CT/Bronx Westchester/NJ Middle Atlantic Upstate/Westchester Bronx/Long Island Manhattan/Bronx Manhattan/Manhattan Brooklyn/Manhattan Long Island/Long Island Long Island/Bronx Total Survey Question 3: How often do you visit? Approximately three-quarters of indicated that they traveled to the Meat Market either every day (46 percent) or a few times per week (31 percent). The results for this survey question are listed in Table 17. Table 17: Frequency of Visit Results for Meat Market Frequency of Visit Few Times/Month Few Times/Week Daily Rarely No Answer Total Total Survey Question 4: Where did you begin your trip? The top origins for vehicles entering the Meat Market were the Bronx (23 percent), New Jersey (15 percent), Queens (11 percent), and Long Island (10 percent). Manhattan and Brooklyn also were significant origin points, each accounted for about 7 percent of these trips. Overall, the five boroughs of New York City, New Jersey, and Long Island accounted for 73 percent of origins. Westchester County and Upstate accounted for another 11 percent of origins. The remainder of origins was of the Middle Atlantic Region (of the Northeast Division). The results for this survey question are listed in Table
29 Table 18: Trip Origin Results for Meat Market Origin Total % New England MA CT Middle Atlantic PA NJ DE MD South Atlantic VA SC NC Long Island Queens Upstate New York State Manhattan Bronx Brooklyn Staten Island Westchester IN East North Central IL MI OH West North Central NE MO West South Central TX Mountain UT CO Pacific CA Canada Total Survey Question 5: How did you get here today? The following section summarizes popular routes taken by the drivers to the Meat Market. Due to a high percentage of drivers from New York State, the region was broken down to more specific areas. The complete table with results for this question can be found in the Appendix. Inbound Meat Market trips were categorized by the Bronx screenline location which marked their entry into the study area. There are eight such primary entry points, listed below in order of highest use (see Appendix 9 for trip distribution figures). to Cross Bronx Expressway to Sheridan Expressway (23 percent) 23
30 Local streets and highways from Bronx origins (such as Southern Boulevard) (21 percent) RFK Bridge to Bruckner Boulevard (17 percent) Throgs Neck/Whitestone Bridge to Bruckner Expressway/Boulevard (13 percent) Willis Avenue Bridge to Bruckner Boulevard (9 percent) All other entry routes (8 percent) (These could include a few indirect routings such as the New England Thruway to the Cross Bronx Expressway to the Sheridan Expressway.) to Major Deegan Expressway to Bruckner Boulevard (6 percent) New England Thruway to Bruckner Expressway/Boulevard (3 percent) From The Bronx Nearly 50 percent of the with the Bronx as the trip origin indicated they used local streets. An additional 30 percent used the Bruckner Expressway and Bruckner Boulevard. The remainder of drivers indicated they used local highways and arterials, including the Cross Bronx and Sheridan expressways and the Bronx River Parkway or Southern Boulevard. From Brooklyn Nearly 45 percent of said they crossed the RFK Bridge to Bruckner Boulevard. Another third used the RFK Bridge to Bruckner Expressway. Finally, 11 percent of drivers used the Willis Avenue Bridge to Bruckner Boulevard. From Manhattan The majority of Manhattan drivers used the Willis Avenue Bridge to Bruckner Boulevard (80 percent). About 15 percent indicated that they used the 145 th Street Bridge and local roads. A small percentage (6 percent) used the 181 st Street/Washington Bridge to either the Cross Bronx or Sheridan expressways or local roads. From Queens The majority of drivers from Queens responded that they either used the RFK Bridge to the Bruckner Boulevard (35 percent) or the RFK Bridge to the Bruckner Expressway (30 percent). However, traveling northbound on the elevated Bruckner Expressway after the RFK Bridge would take drivers past Hunts Point, as there is no exit until east of the Bronx River Parkway other than access to the northbound Sheridan Expressway. As with the Fish Market, it could be that drivers do not make a distinction between the Bruckner Expressway and Bruckner Boulevard when traveling to/from the RFK Bridge. One quarter of crossed the Throgs Neck or Whitestone Bridge to the Bruckner Expressway to access the Meat Market. From Long Island Over 80 percent of from Long Island responded that they used the Throgs Neck or Whitestone Bridge to the Bruckner Expressway. A small percentage (8 percent) used the RFK Bridge to the Bruckner Expressway. Several drivers indicated they used the Throgs Neck Bridge, Whitestone Bridge, RFK Bridge, or Willis Avenue Bridge to Bruckner Boulevard. From Upstate A third of replied that they used the Major Deegan and Bruckner Expressway as the route in the Bronx. Fifteen percent of specified that they used I- 87 to the Major Deegan Expressway to the Bruckner Expressway. Another 15 percent of indicated that they crossed into the Bronx via the to the Cross Bronx and Sheridan expressways. 24
31 From Westchester Similar to drivers from Upstate, NY, 40 percent of indicated that they used the Major Deegan and Bruckner expressways. Nearly 20 percent of indicated that they used the New England Thruway to the Bruckner Expressway. From the New England Division (of the Northeast Region) The majority of drivers from the north chose to take the New England Thruway to Bruckner Expressway or Bruckner Boulevard. A handful of drivers took the Cross Bronx to the Sheridan Expressway. From the Midwest, West, and South Regions (of the Northeast Region) The majority of the drivers avoided Manhattan and used the corridor to cross over into the Bronx. Most of the drivers took the Cross Bronx Expressway to the Sheridan Expressway after getting off of the. Some drivers traveled southbound via the Major Deegan Expressway to the Bruckner Expressway. Survey Question 6: Where will you be going after you leave the market? Drivers responded that the Bronx and New Jersey were most often their destination upon leaving the Meat Market, each accounted for 14 to 16 percent of responses, respectively. Manhattan was a destination for over 7 percent of drivers and Long Island and Queens each accounted for just over 6 percent of destinations. Drivers that replied they were tenants or done for the day make up almost 19 percent. These drivers had made all their deliveries for the day, and were returning to the market to park the company vehicle. Most of these drivers replied that they go out daily, some even more than once per day to make deliveries to nearby locations, such as the five boroughs, Long Island, New Jersey, and Westchester. New York State accounted for half of all destinations. The Middle Atlantic Division represented 16 percent. Only 3 percent of the drivers surveyed were going to the New England Division (of the Northeast Region). The other regions of the United States accounted for 1 percent. Drivers from Canada also accounted for less than 1 percent. Four percent of the drivers will get instructions inside the market and therefore were uncertain of their next destination. The results for this survey question are listed in Table
32 Table 19: Trip Destination Results for Meat Market Destination Total % New England MA CT Middle Atlantic PA NJ DE South Atlantic MD VA NC Long Island Queens Upstate New York State Manhattan Bronx Brooklyn Staten Island Westchester East North Central IL West North Central NE Mountain UT West South Central TX Canada Uncertain Done for the Day Tenant (not leaving) No Answer Total Survey Question 7: What route will you take to your next destination? Due to a lot of drivers not leaving the market once they entered, this question was not answered by almost one third of the. The following section summarizes popular routes taken by the drivers to the Meat Market. New York State was broken down to specific areas since it contains a large number of destinations. The complete table with results for this question can be found in the Appendix. Outbound Meat Market trips were categorized by the Bronx screenline location at which marked their exit out to the study area. There are eight such primary exit points, listed below in order of highest use (see Appendix 9 for trip distribution figures). Sheridan Expressway to Cross Bronx Expressway to (24 percent) Local streets and highways to Bronx destinations (such as Southern Boulevard) (23 percent) 26
33 All other exit routes (13 percent) (These could include a few indirect routings such after exiting Hunts Point, drivers use the Sheridan Expressway to the Cross Bronx Expressway to the Whitestone Bridge.) Bruckner Expressway/Boulevard to Throgs Neck/Whitestone Bridge (12 percent) Bruckner Boulevard to RFK Bridge (11 percent) Bruckner Boulevard to Third Avenue Bridge (9 percent) Bruckner Boulevard to Major Deegan Expressway to (5 percent) Bruckner Expressway/Boulevard to New England Thruway (4 percent) To The Bronx Just over one third of the drivers did not answer this question. Most of these drivers had memorized the route, thus they no longer pay attention to the names of the roadways. Of the ones that did respond, almost one third would use Bruckner Boulevard, 14 percent would use local streets, and 6 percent would use the Sheridan Expressway to the Cross Bronx Expressway. To Brooklyn The Bruckner Expressway to the RFK Bridge (29 percent), Bruckner Expressway to the Throgs Neck or Whitestone Bridge (21 percent) and Bruckner Boulevard to the RFK Bridge (21 percent) were the three primary routes drivers would use to travel back to Brooklyn. As noted earlier, from Hunts Point the RFK Bridge can only be accessed from the Bruckner Boulevard; thus drivers that replied they would take the expressway, most likely mistaken the Bruckner Expressway for the Bruckner Boulevard, or make no distinction between the two. To Manhattan About three-fourths of the drivers destined for Manhattan said they would use Bruckner Boulevard and the Third Avenue Bridge. Other routes such as 138 th, 145 th, and 181 st Street bridges were mentioned, though these were small percentages. To Queens About one-third of indicated they would use the Bruckner Boulevard and cross via the RFK Bridge. The other one-third of drivers replied that they would use the Bruckner Expressway to access the RFK Bridge; this could be assumed that they meant the Bruckner Boulevard. Twenty percent said they would use the Bruckner Expressway to access the Throgs Neck or Whitestone Bridge. To Long Island Most of the drivers indicated they would use the Bruckner Expressway (72 percent) or Bruckner Boulevard (8 percent) to the Throgs Neck or Whitestone Bridge. To Upstate A majority of indicated that they would use the Major Deegan and Bruckner expressways to I-87 (35 percent). Another one-third of the drivers would use the Sheridan Expressway to get to the Cross Bronx Expressway, further downstream, 24 percent would cross over to New Jersey via the and 6 percent would take the northbound I-87. Twenty-five percent responded that they would use the Cross Bronx and Bruckner expressways. To Westchester Half of the drivers would use the Bruckner Expressway to the New England Thruway. One-third of indicated that they would use the Major Deegan and Bruckner expressways. 27
34 To New Jersey The popular route to take for these drivers was the Sheridan Expressway to the Cross Bronx Expressway to. Almost 30 percent of New Jersey-bound drivers would use the Bruckner and Major Deegan expressways to the. To New England Division (of the Northeast Region) Most of these drivers were destined for Connecticut, and the most common roadways taken were the Bruckner Expressway and the New England Thruway. Survey Question 8: When you leave the market, do you need to get to your destination by a certain time? Just over 61 percent of drivers surveyed responded that they did not have to be at a specific destination after leaving the Meat Market. Eighteen percent of drivers responded that they did have to arrive at their destination at a certain time. For drivers who responded yes to Question 8, nearly half (45 percent) indicated there would be no consequence for arriving at their destination late. For those drivers who do pay consequences, the most common response was they would lose business. The results for this survey question are listed in Tables 20 and 21. Table 20: Time or Schedule Results for Meat Market Time or Schedule Requirement Yes No No Answer Total Totals % 61.8% 20.2% 100 Table 21: Survey Question 8a: if yes to Question 8, do you Consequence of Being Late Total Responses % Nothing No answer Lose business Other Pay fine Lose job Total
35 4c. Survey Data Results for Produce Market Survey Question 1: Vehicle Class More than half of the vehicles (57 percent) entering the Produce Market were box trucks. Tractor trailers accounted for the next highest percent of vehicle types, representing just over 26 percent, followed by vans, which make up 18 percent of the vehicles entering the Produce Market. The results for this survey question are listed in Table 22. Table 22: Vehicle Class Results for Produce Market Vehicle Type Van Box Truck Tractor Trailer Total Total Survey Question 2: Are you taking product out or bringing product in or both? Similar to the Fish Market, a majority of vehicles (82 percent) entering the Produce Market was taking product out to bring back to their business or to distribute to businesses. In terms of bringing product into the market, only 16 percent of vehicles did this. More than half of the vehicles at the Produce Market were box trucks, over a quarter of them were vans, and approximately 18 percent were tractor trailers. For vehicles bringing product in, California and the Bronx had the highest share of origins, both nearly 15 percent. New Jersey accounted for over 12 percent, followed by Canada with over 8 percent of origins and Texas with over 6 percent. The vehicles that bring product into the Produce Market from these origins were mainly tractor trailers, except for vehicles coming from the Bronx, which were mostly box trucks. For vehicles taking product out, Manhattan was the destination for over 20 percent of outbound trips, followed in close succession by Queens (18 percent), the Bronx (17 percent), and New Jersey (16 percent). Brooklyn and Long Island had sizable percentages, representing over 8.5 percent and nearly 7 percent of destinations, respectively. The results for this survey question are listed in Tables 23 to 26. Table 23: Product In and Product Out in Results for Produce Market Vehicle Class Bringing Product In Taking Product Out Both No Answer Total % Box Truck Vans Tractor Trailer Total
36 Table 24: Product In Results for Produce Market by Origin Product In Origin Total % MA New England ME CT Middle Atlantic PA NJ DE South Atlantic VA FL Queens Upstate New York State Manhattan Bronx Brooklyn East South Central TN West North Central MN East North Central OH Mountain ID West South Central TX AR WA Pacific OR CA Canada Total
37 Table 25: Product Out Results for Produce Market by Destination Product Out Destination Total % New England MA CT Middle Atlantic NJ PA Long Island Queens Westchester New York State Upstate Manhattan Bronx Brooklyn Staten Island Pacific CA Uncertain No Answer Total Table 26: Product In and Out Produce Market by O/D Both-Product In and Product Out Origin/Destination Total % New England CT/CT Bronx/Manhattan Queens/Queens Westchester/Westchester Middle Atlantic Westchester/Uncertain Manhattan/Bronx Bronx/Bronx NJ/Uncertain Total
38 Survey Question 3: How often do you visit? Approximately 88 percent of indicated that they traveled to the Produce Market either every day (54 percent) or a few times per week (34 percent). The results for this survey question are listed in Table 27. Table 27: Frequency of Visit Results for Produce Market Frequency of Visit Few Times/Month Few Times/Week Daily Rarely No Answer Total Total Survey Question 4: Where did you begin your trip? The highest number of vehicles at the Produce Market originated from the Bronx at 23 percent. Queens had the second highest origin at 20 percent, followed by New Jersey at 15 percent. Brooklyn, Manhattan, and Long Island were also significant points of origins in New York, ranging between 7 and 8 percent. For the Middle Atlantic Division (within the Northeast Region), New Jersey was the highest origin at over 15 percent. Of the Regions, California has the most origins at almost 3 percent. Overall, the five boroughs of New York City, New Jersey, and Long Island accounted for 83 percent of origins. The Westchester County/Yonkers/Upstate region accounted for nearly 6 percent of origins. The results for this survey question are listed in Table
39 Table 28: Trip Origin Results for Produce Market Origin Total % MA New England ME CT Middle Atlantic NJ PA DE South Atlantic VA FL Long Island Queens Upstate New York State Manhattan Bronx Brooklyn Staten Island Westchester East North Central OH East South Central TN West North Central MN West South Central TX AR Mountain ID CA Pacific OR WA Canada Total
40 Survey Question 5: How did you get here today? The following section summarizes popular routes taken by the drivers to the Produce Market. Inbound Produce Market trips were categorized by the Bronx screenline location at which marked their entry into the study area. There are eight such primary entry points, listed below in order of highest use (see Appendix 9 for trip distribution figures). Throgs Neck/Whitestone Bridge to Bruckner Expressway/Boulevard (21 percent) Local streets and highways from Bronx origins (such as Southern Boulevard) (20 percent) to Cross Bronx Expressway to Sheridan Expressway (17 percent) RFK Bridge to Bruckner Boulevard (15 percent) All other entry routes (15 percent) (These could include a few indirect routings such as the New England Thruway to the Cross Bronx Expressway to the Sheridan Expressway.) Willis Avenue Bridge to Bruckner Boulevard (8 percent) New England Thruway to Bruckner Expressway/Boulevard (2 percent) to Major Deegan Expressway to Bruckner Boulevard (2 percent) From The Bronx Just over 50 percent of with Bronx trip origins indicated they used local streets, and 14 percent said that they used Bruckner Boulevard. In addition, 13 percent did not recall the names of the streets that they took to get to the market; most likely because they were too familiar with the route and no longer pay attention to the names. The remainder indicated that they used local highways including the Major Deegan, Cross Bronx, Sheridan, and Bruckner expressways. From Brooklyn Over 40 percent of drivers crossed the RFK Bridge to Bruckner Expressway. About 30 percent crossed the Willis Avenue Bridge and took Bruckner Boulevard to the Produce Market. Finally, 14 percent of drivers used the RFK Bridge to Bruckner Boulevard. From Manhattan Nearly half of the trips that originated in Manhattan used the Willis Avenue Bridge and Bruckner Boulevard (45 percent). The 181 st Street Bridge to the Cross Bronx and Sheridan expressways accounted for another 15 percent of responses. The remainder of responses indicated that the Willis Avenue, 155 th Street (Macombs Dam), RFK, 145 th Street, and University Heights bridges were used to cross into the Bronx; the Cross Bronx-Sheridan Expressway combination and Bruckner Expressway were used within the Bronx. From Queens Just over half of the crossed the Throgs Neck or Whitestone Bridge to the Bruckner Expressway. Approximately one-quarter of drivers used the RFK Bridge to the Bruckner Expressway. Some drivers would use Bruckner Boulevard as a local roadway after they get off of the Willis Avenue Bridge (9 percent), the RFK Bridge (8 percent), and the Throgs Neck or Whitestone Bridge (4 percent). From Long Island Over 85 percent of drivers responded that they used the Throgs Neck or Whitestone Bridge to the Bruckner Expressway. A small percentage (5 percent) used the Throgs Neck or Whitestone Bridge to Bruckner Boulevard. 34
41 From Upstate One-third of indicated that they used the Major Deegan and Bruckner expressways. A quarter of drivers indicated that they used I-87 to the Major Deegan/Bruckner Expressway. Another quarter responded that they used the to the Cross Bronx Expressway to the Sheridan Expressway. From Westchester Sixty percent of indicated that they used I-87 to the Major Deegan/Bruckner Expressway. About 30 percent of drivers used New England Thruway to the Bruckner Expressway. From New Jersey Almost 60 percent of indicated that they used the to the Cross Bronx Expressway to the Sheridan Expressway. The to the Major Deegan or Bruckner expressways was an alternate route and represented 13 percent of responses. Twentyseven percent of drivers indicated using the and Cross Bronx Expressway without indicating which roadway was used to access the Hunts Point markets. A small percentage of drivers used the Willis Avenue Bridge from Manhattan and I-87 to the Major Deegan/Bruckner Expressway. From New England Division (of the Northeast Region) Two routes were popular among drivers that originated from the New England Division. More than 40 percent of drivers used the New England Thruway to the Cross Bronx Expressway and then to the Sheridan Expressway. The same amount of drivers took the Bruckner Expressway after getting off of I-95. From the Midwest, West, and South Regions The majority of the drivers took the to the Cross Bronx Expressway to the Sheridan Expressway. A few took the Major Deegan Expressway to the Bruckner Expressway after crossing the. From Canada Most drivers used the to the Cross Bronx Expressway to the Sheridan Expressway. Survey Question 6: Where will you be going after you leave the market? When leaving the Produce Market, Manhattan was the borough with the highest number of driver destinations, with nearly 18 percent of responses, followed closely by New Jersey (17 percent) and Queens (16 percent). The Bronx also had a significant percentage of destinations with nearly 15 percent. The New York/New Jersey/Long Island region accounted for 81 percent of all destinations. Westchester County/Upstate represents 4 percent of destinations. The results for this survey question are listed in Table
42 Table 29: Trip Destination Results for Produce Market Destination Total % New England MA CT Middle Atlantic NJ PA DE South Atlantic VA FL Long Island Queens Upstate New York State Manhattan Bronx Brooklyn Staten Island Westchester East South Central TN East North Central OH West North Central MN West South Central TX Pacific CA Uncertain Done for the Day No Answer Total Survey Question 7: What route will you take to your next destination? The following section summarizes popular routes taken by the drivers to the Produce Market. Outbound Produce Market trips were categorized by the Bronx screenline location which marked their exit out of the study area. There are eight such primary exit points, listed below in order of highest use (see Appendix 9 for trip distribution figures). All other exit routes (such as I-87, Macombs Dam Bridge, 138 th Street Bridge) (19 percent) Bruckner Boulevard to Third Avenue Bridge (18 percent) Bruckner Expressway/Boulevard to Throgs Neck/Whitestone Bridge (17 percent) Sheridan Expressway to Cross Bronx Expressway to (15 percent) Local streets and highways to Bronx destinations (15 percent) (These could include a few indirect routings such after exiting Hunts Point, drivers use the Sheridan Expressway to the Cross Bronx Expressway to the Whitestone Bridge.) Bruckner Boulevard to RFK Bridge (14 percent) 36
43 Bruckner Expressway/Boulevard to New England Thruway (1 percent) Bruckner Boulevard to Major Deegan Expressway to (1 percent) To The Bronx Thirty percent of the did not answer this question; most of these drivers had memorized the route thus they no longer pay attention to the names of the roadway. Of those that did respond to the question, over one-quarter indicated that they would use local streets. Ten percent of indicated they would use the Major Deegan Expressway, and 8 percent would use Bruckner Boulevard. To Brooklyn Over 50 percent of drivers said they would take the Bruckner Expressway to the RFK Bridge. As mentioned for the other markets, these drivers do not seem to make a distinction between the service road and the expressway; therefore, they must had meant Bruckner Boulevard instead, since the RFK Bridge could not be access from the expressway (56 percent). Bruckner Boulevard to the Third Avenue Bridge represented 16 percent of responses. Ten percent of the would take Bruckner Expressway to the Throgs Neck or Whitestone Bridge. To Manhattan Nearly 70 percent of the drivers bound for Manhattan said they would use Bruckner Boulevard and the Third Avenue Bridge. The Sheridan Expressway to the Cross Bronx Expressway to the 181 st Street Bridge and Southern Boulevard to the Third Avenue Bridge each accounted for an additional 7 percent of responses. Other crossings such as 138 th Street, 145 th Street, and the RFK bridges were mentioned but their percentages were minor. To Queens About 50 percent of said they would use the Bruckner Expressway to access the Throgs Neck or Whitestone Bridge. Over one-third of indicated they would use the Bruckner Expressway (which they most likely meant Bruckner Boulevard instead) and crossed via the RFK Bridge (35 percent). To Long Island Three-quarters of drivers indicated they would use the Bruckner Expressway to the Throgs Neck or Whitestone Bridge. Another 15 percent of indicated they would use Bruckner Boulevard to access the Throgs Neck or Whitestone Bridge. Small percentages would use Southern Boulevard or the Sheridan Expressway to the Cross Bronx Expressway to access these crossings. To Upstate One-third of drivers responded that they would use the Major Deegan and Bruckner expressways. One-fourth of the drivers specified that they would access I-87 by the Major Deegan and Bruckner expressways. An additional 25 percent would access I-87 via the Cross Bronx and Sheridan expressways. To Westchester Over half of drivers would use the Major Deegan and Bruckner expressways to I-87 (59 percent). About 30 percent would use the Bruckner Expressway to New England Thruway. The small percentage of remaining indicated that they would use the Bruckner Expressway or the Cross Bronx Expressway. To New Jersey More than 50 percent of drivers indicated they would use the Sheridan Expressway to the Cross Bronx Expressway to to return to New Jersey. Over one-third of drivers indicated they would the Cross Bronx Expressway and the without indicating 37
44 which roadway would be used to access the Cross Bronx Expressway. Just over 5 percent would use the Bruckner and Major Deegan expressways the. Survey Question 8: When you leave the market, do you need to get to your destination by a certain time? Approximately 70 percent of drivers surveyed indicated that they did not have to be at a specific destination after leaving the Produce Market. Only 24 percent of drivers responded that they did have to arrive at their destination at a certain time; however, a majority of these drivers (62 percent) responded that if they were late, there would be no consequences. For drivers who indicated there would be some type of consequence associated with arriving late to their destination, losing business was the most common response (20 percent) and just over 3 percent indicated that they would need to pay a fine. The results for this survey question are listed in Tables 30 and 31. Table 30: Time or Schedule Results for Produce Market Time or Schedule Requirement Yes No No Answer Total Totals Table 31: Survey Question 8a: if yes to Question 8, do you Consequence of Being Late Total Responses % Nothing Lose business No answer Pay fine Customer complaints Trouble with boss Lose job Total Conclusions Vehicle Classification Count Findings From the September 2011 vehicle classification counts at the entrance to each market, both the Produce and Fish Markets had similar ten-hour peak periods during their typical weekday, beginning in the early morning (12-1 AM) and continuing through the late morning (10-11 AM). Conversely, the peak ten-hour period for the Meat Market started and ended later, beginning at 5 AM and ending at about 4 PM. The Meat and Fish markets exhibited sharp peaks with vans, box trucks, and tractor trailers arriving during their peak periods. On the other hand, the Produce Market had about one-third of its tractor trailers arriving during its peak period. 38
45 Produce Market Vehicle Classification Count Findings Three-fourths of the daily vans entering the Produce Market (76 percent) arrived during the tenhour peak period (1-11 AM). Just over half of all box trucks (54 percent) arrived during this time. However, about one-third of tractor-trailers arrived during the ten-hour peak period. It was likely that most tractor-trailers arrived prior to the peak because they were delivering a commodity that will be bought by buyers arriving later during the peak. Within a 24-hour period, the peak ten-hour period accounted for 55 percent of all vans, box trucks, and tractor trailers entering the Produce Market. Meat Market Vehicle Classification Count Findings Nearly 80 percent of vans, 70 percent of box trucks, and 60 percent of tractor trailers entering the Meat Market on a typical day arrived during the ten-hour peak period (5 AM - 3 PM). Taken together, the peak ten-hour peak period accounted for 71 percent of all vans, box trucks, and tractor trailers entering the Meat Market. Fish Market Vehicle Classification Count Findings Over 90 percent of the daily vans entering the Fish Market arrived during the ten-hour peak period (12-10 AM). Over 80 percent of box trucks and nearly three-quarters of tractor-trailers arrived at the Fish Market during the peak period as well. Within a 24-hour period, the peak tenhour period accounted for 88 percent of all vans, box trucks, and tractor trailers entering the Fish Market. Market Survey Findings For vehicles bringing product into the markets, the most common origins were New Jersey, the Bronx, Long Island, Queens, and Brooklyn. A complete summary of product in by origin for all markets is listed in Table 32. Both vans and box trucks were almost exclusively used to take product out of the markets. At the Fish and Produce Markets, over 80 percent of the vehicles were taking product out. For the Meat Market, this percentage was somewhat lower at 70 percent. For all three markets, a majority of activity involved taking product out of the markets and distributing it to destinations primarily in the Bronx, Manhattan, New Jersey, Queens, and Brooklyn. A complete summary of product out by destination for all markets is listed in Table 33. There were some cases when vehicles both bought in product and took product out; however, they represented very small percentages. The most common origins for these types of trips were the Bronx, Queens, and Manhattan. A complete summary of product in and out by origin for all markets is listed in Table
46 Table 32: Product In by Origin for All Markets Origin Fish Market Meat Market Produce Market Total % MA New England ME CT Middle Atlantic PA NJ DE MD South Atlantic VA NC SC FL Long Island Queens Upstate New York State Manhattan Bronx Brooklyn Staten Island Westchester East South Central TN IL East North Central IN MI OH West North Central NE MN West South Central AR TX Mountain ID CA Pacific OR WA Canada Total
47 Table 33: Product Out by Destination for All Markets Destination Fish Market Meat Market Produce Market Total % MA New England ME CT Middle Atlantic PA NJ DE South Atlantic VA NC Long Island Queens Upstate New York State Manhattan Bronx Brooklyn Staten Island Westchester Mountain UT Pacific CA Canada Uncertain No Answer Total ,
48 Table 34: Both Product In and Product Out by Origin /Destination for All Markets New England New England/Middle Atlantic Middle Atlantic Origin/Destination Fish Market Meat Market Produce Market Total % MA/MA CT/CT CT/Bronx Bronx/Bronx Bronx/Manhattan Bronx/Long Island Brooklyn/Brooklyn Brooklyn/Manhattan Queens/Queens Long Island/Queens Long Island/Long Island Long Island/Manhattan Long Island/Bronx Westchester/Westchester Westchester/Uncertain Westchester/NJ Upstate/Westchester Manhattan/Manhattan Manhattan/Bronx NJ/Uncertain Total Nearly all the Fish Market (93 percent) indicated that they visit the market either every day or a few times per week. Similarly, a majority of Produce Market (85 percent) and Meat Market (75 percent) answered that they visit the market either every day or a few times per week. This results in frequent trips to the markets, which has cascading effects on travel frequency and use of local and regional roads. From Long Island, Queens, and Brooklyn to Hunts Point Market, the Throgs Neck and Whitestone bridges were most often used to cross into the Bronx, followed by the RFK Bridge. Once in the Bronx, the Bruckner Expressway was most often used to travel to the markets. None of these routes result in the use of the Sheridan Expressway. Generally, coming from the New England Division states, most drivers used the New England Thruway, some would connect to the Bruckner Expressway while others connected to the Sheridan Expressway via the Cross Bronx Expressway. For the New York State areas that are north of the five boroughs, the two routes to cross the Bronx were I-87 and. After that, some drivers would stay on the Major Deegan Expressway to connect to the Bruckner Expressway or use the Cross Bronx Expressway to the Sheridan Expressway. 42
49 From Manhattan, the Willis Avenue Bridge was the primary crossing used to enter the Bronx, from which Bruckner Boulevard was used to travel to the markets. Returning to Manhattan, the Third Avenue Bridge (which functions as outbound in a one-way pair with the Willis Avenue Bridge) was most often used. In general, for all three markets, from points west (and to a small extent from the north), the was used to cross into the Bronx. From the, the two primary routes used to access the markets were the Major Deegan/Bruckner Expressway combination and the Cross Bronx/Sheridan Expressway combination. Of all markets, the Produce Market drivers most often use the Sheridan Expressway (40 percent). In terms of inbound vs. outbound travel, the Sheridan Expressway is slightly favored (56 percent) by drivers coming in to the markets. Table 35 breaks down the Sheridan Expressway use by market and by direction. The Sheridan Expressway was used by approximately 19 percent of all trips into and out of Hunts Point (484 out of 2,542 trips [ins and/or outs]). Thus, the influence of commercial travel from or through New Jersey on the use of the Sheridan Expressway was significant (about 1 in 5 trips to and/or from Hunts Point markets). Table 35: Sheridan Expressway Users Travel Direction Fish Market Meat Market Produce Market Total % From Hunts Point To Hunts Point Total For all markets, inbound trips were categorized by the Bronx screenline location which marked their entry into the study area. There are eight such primary entry points, listed below in order of highest use (see Appendix 9 for trip distribution figures). Throgs Neck/Whitestone Bridge to Bruckner Expressway/Boulevard (20 percent) to Cross Bronx Expressway to Sheridan Expressway (19 percent) Local streets and highways from Bronx origins (such as Southern Boulevard) (18 percent) RFK Bridge to Bruckner Boulevard (16 percent) All other entry routes (11 percent) (These could include a few indirect routings such as the New England Thruway to the Cross Bronx Expressway to the Sheridan Expressway.) Willis Avenue Bridge to Bruckner Boulevard (9 percent) to Major Deegan Expressway to Bruckner Boulevard (4 percent) New England Thruway to Bruckner Expressway/Boulevard (3 percent) For all markets, outbound trips were categorized by the Bronx screenline location at which marked their exit out of the study area. There are eight such primary exit points, listed below in order of highest use (see Appendix 9 for trip distribution figures). Bruckner Expressway/Boulevard to Throgs Neck/Whitestone Bridge (18 percent) Sheridan Expressway to Cross Bronx Expressway to (17 percent)
50 Local streets and highways to Bronx destinations (such as Southern Boulevard) (17 percent) All other exit routes (16 percent) (These could include a few indirect routings such after exiting Hunts Point, drivers use the Sheridan Expressway to the Cross Bronx Expressway to the Whitestone Bridge.) Bruckner Boulevard to Third Avenue (15 percent) Bruckner Boulevard to RFK Bridge (13 percent) Bruckner Expressway/Boulevard to New England Thruway (2 percent) Bruckner Boulevard to Major Deegan Expressway to (2 percent) 6. Lessons Learned from Survey Effort Based on the surveys conducted at the Hunts Point Markets, the following lessons and recommendations for future conduct of O/D surveys at the markets are presented below. a. Increase the Number of Surveyors at Each Entry Lane Increasing the number of surveyors at each entry lanes would allow surveyors to leap frog each other while conducting surveys. Stationing at least two surveyors per open lane would increase the capture rate for completing surveys as opposed to one surveyor per lane, and it would ensure that traffic at the toll lanes keeps moving. Traffic queuing at the toll booths was a concern expressed by all of the facility managers during the survey; however, such queuing did not manifest since we had a field supervisor on hand to prevent these occurrences. b. Lengthen Survey Duration Increase the number of hours of the survey to capture a reasonable number of vehicles of a certain type to improve survey accuracy. For example, a reasonable number of tractor trailers could not be surveyed for the Produce Market within the ten-hour survey period because of the low volumes of tractor-trailer entries during the peak traffic-entry period. c. Survey Timing While a significant effort was made to identify the peak ten-hour time period to capture the highest number of vehicles entering the markets, it was observed that by 7 AM, traffic volumes began to fall and by 9 AM, the peaks were virtually over. It is recommended that the surveys be started closer to the opening time of the markets and with additional personnel to better cover the heaviest of the peak activity. Details follow below. The Produce Market survey period (1-11 AM) should commence at 10 PM and end at 9 AM to account for potential daily variations in truck-entry peak periods. The traffic count data indicate that at 1 AM on the survey day, there was a high volume of trucks already entering the market, indicating that truck activity began before then, which was not evident in the July 2011 traffic counts. Moreover, there was a significant drop in trucks entering between 9 and 11 AM, so including additional personnel would not increase the surveys conducted to the point of meeting the desired confidence interval. The Fish Market s AM survey period did reflect the actual peak times for vehicle activities, and thus the targeted confidence levels of +/- 5 were met for vans and box trucks. 44
51 Tractor trailer sampling did not meet the confidence interval because the sheer volume of these trucks did not arrive in the 10-hour survey period. The survey time could be extended beyond 10 AM to increase the sampling to achieve the desired confidence level; this would likely involve a longer survey period. The Meat Market survey period (5 AM - 3 PM) did capture the actual peak for this market, but additional surveyors were needed to meet the targeted confidence intervals. Two surveyors per lane would likely allow confidence intervals to be met. d. Focused Survey Questions and Choices Focused questions and responses allow for faster implementation of the survey, and ensure accurate answers (i.e., less confusion on the part of the person being surveyed or chance of error) and less time required for data reduction. There should be no extraneous questions included in the surveys that are not related to the core purpose of the survey irrespective of how brief an inquiry may be. The survey focus will vary depending on the nature of the information being sought; however, more care on the part of the survey team should involve a focus on logical O/D links so that when a driver answer is given that is illogical, the surveyor immediately knows to re-ask the question. Origin/destination questions should specify whether long-haul drivers are questioned based on the start/end of their trips on the survey date or the beginning/end of their journey. e. Multi-Lingual Surveyors While some multilingual surveyors that spoke Chinese and Spanish were part of the overall survey team at each market, not every surveyor had these skills nor were such staff available for each lane. Thus, there were some instances when a language barrier prevented a survey from being conducted. However, the capture rate could be increased by having interpreters at every lane. 45
52 Appendices 46

53 Appendix 1: Informational Flyer 47

54 48
55 Appendix 2: Sample Survey 49
56 Appendix 3: Fish Market Inbound Trips by Origin and Route Brooklyn Crossing into Bronx Regional/Local in Bronx Willis Ave. Bridge Bruckner Blvd % Triboro (RFK) Bridge Bruckner 11 23% Throgs Neck/Whitestone Bridge Bruckner 8 17% Triboro (RFK) Bridge Bruckner Blvd. 3 6% Willis Ave. Bridge No answer 2 4% Willis Ave. Bridge Local Streets 2 4% Willis Ave. Bridge Major Deegan 1 2% Triboro (RFK) Bridge Southern Blvd. 1 2% % Bronx Crossing into Bronx Regional/Local in Bronx Not applicable Local Streets 19 43% Not applicable No answer 10 23% Not applicable Bruckner Blvd. 3 7% Not applicable Major Deegan /Bruckner 3 7% Not applicable Cross Bronx 2 5% Not applicable 163rd Street 1 2% Not applicable Bronx River Parkway/Bruckner /Sheridan 1 2% Not applicable Bruckner 1 2% Not applicable Cross Bronx /Bruckner 1 2% Not applicable Southern Blvd. 1 2% New England Thruway/I-95 South Bruckner 1 2% Triboro (RFK) Bridge Bruckner Blvd. 1 2% % CT Crossing into Bronx Regional/Local in Bronx New England Thruway/I-95 South New England Thruway/I-95 South Bruckner 4 80% Bruckner Blvd. 1 20% 5 100% 50
57 FL Crossing into Bronx Regional/Local in Bronx 2 100% 2 100% Long Island Crossing into Bronx Regional/Local in Bronx Throgs Necks/Whitestone Bruckner 36 77% Triboro (RFK) Bridge Bruckner 4 9% Throgs Neck/Whitestone Bridge Major Deegan 2 4% Throgs Neck/Whitestone Bridge Southern Blvd. 2 4% Triboro (RFK) Bridge Bruckner Blvd. 2 4% Willis Ave. Bridge Bruckner Blvd. 1 2% % MA Crossing into Bronx Regional/Local in Bronx New England Thruway/I-95 South New England Thruway/I-95 South New England Thruway/I-95 South Bruckner 4 67% Bruckner Blvd. 1 17% Southern Blvd. 1 17% 6 100% Manhattan Crossing into Bronx Regional/Local in Bronx Willis Ave Bridge Bruckner Blvd % No answer Major Deegan 2 10% I-287 Cross Westchester Bruckner 1 5% River Side Drive Cross Bronx 1 5% Triboro (RFK) Bridge Bruckner 1 5% Willis Ave. Bridge Southern Blvd. 1 5% % 51
58 MD Crossing into Bronx Regional/Local in Bronx Major Deegan /Bruckner 3 60% 2 40% 5 100% ME Crossing into Bronx Regional/Local in Bronx New England Thruway/I-95 South Bruckner 3 100% 3 100% NJ Crossing into Bronx Regional/Local in Bronx 52 63% Cross Bronx 16 19% Major Deegan /Bruckner 12 14% Willis Ave Bridge Southern Blvd. 1 1% Willis Ave. Bridge Bruckner Blvd. 1 1% No answer No answer 1 1% % PA Crossing into Bronx Regional/Local in Bronx Major Deegan /Bruckner 1 100% 1 100% Queens Crossing into Bronx Regional/Local in Bronx Throgs Neck/Whitestone Bridge Bruckner 49 62% Triboro (RFK) Bridge Bruckner 21 27% Willis Ave. Bridge Bruckner Blvd. 4 5% Triboro (RFK) Bridge Bruckner Blvd. 1 1% Triboro (RFK) Bridge Northern? 1 1% Willis Ave. Bridge Didn t stop 1 1% Willis Ave. Bridge No answer 1 1% No answer Bruckner 1 1% % 52
59 Staten Island Crossing into Bronx Regional/Local in Bronx Triboro (RFK) Bridge Bruckner 5 36% Willis Ave. Bridge Bruckner Blvd. 5 36% 1 7% Throgs Neck/Whitestone Bridge Bruckner 1 7% Willis Ave. Bridge Southern Blvd. 1 7% No answer Bruckner 1 7% % Upstate, NY Crossing into Bronx Regional/Local in Bronx No answer Major Deegan /Bruckner 4 17% 3 13% Cross Bronx 1 4% Tappan Zee Bridge Major Deegan /Bruckner 1 4% No answer Bronx River Parkway Major Deegan /Bruckner Major Deegan /Cross Bronx /Sheridan Major Deegan /Bruckner 2 9% 2 9% 1 4% 1 4% I-87 Bruckner Blvd. 1 4% I-87 Major Deegan 1 4% No answer Cross Bronx 1 4% No answer Major Deegan /Bruckner 2 9% New England Thruway/I-95 South Bruckner 1 4% Tappan Zee Major Deegan 1 4% Unresponsive Unresponsive 1 4% % VA Crossing into Bronx Regional/Local in Bronx 1 100% 1 100% 53
60 Westchester Crossing into Bronx Regional/Local in Bronx New England Thruway/I-95 South Bruckner 4 29% No answer Major Deegan /Bruckner 5 36% Bronx River Parkway Bruckner 2 14% I-87 Major Deegan /Bruckner 1 7% No answer Bruckner Blvd. 1 7% No answer Cross Bronx /Bruckner 1 7% % Total Number of surveys
61 Appendix 4: Fish Market Outbound Trips by Destination and Route Brooklyn Regional/Local in Bronx Crossing out of Bronx Bruckner Triboro (RFK) Bridge 16 36% Bruckner Blvd. 3rd Ave Bridge 11 25% Bruckner Throgs Neck/Whitestone Bridge 5 11% No answer 3rd Ave Bridge 3 7% Major Deegan 3rd Ave Bridge 3 7% Bruckner No answer 2 5% No answer No answer 2 5% Bruckner Throgs Neck/Whitestone Bridge 1 2% Bruckner Blvd No answer 1 2% % Bronx Regional/Local in Bronx Crossing out of Bronx No answer Not applicable 25 52% Bruckner Blvd Not applicable 7 15% Local Streets Not applicable 5 10% Major Deegan /Bruckner Not applicable 6 13% Southern Blvd Not applicable 1 2% Cross Bronx /Bruckner Not applicable 2 4% /Bruckner Not applicable 1 2% Pelham Pkwy Not applicable 1 2% % CT Regional/Local in Bronx Crossing out of Bronx Bruckner New England Thruway/I-95 North 8 80% Cross Bronx No answer 1 10% No answer No answer 1 10% % No Answer Regional/Local in Bronx Crossing out of Bronx Not applicable Done for the day 1 50% Not applicable Don't Know Yet 1 50% 2 100% 55
62 Long Island Regional/Local in Bronx Crossing out of Bronx Bruckner /Cross Bronx Major Deegan /Bruckner Throgs Neck/Whitestone Bridge % Triboro (RFK) Bridge 2 5% Bruckner Blvd Throgs Neck/Whitestone Bridge 1 2% Bruckner Blvd 3rd Ave Bridge 1 2% Southern Blvd Throgs Neck/Whitestone Bridge 1 2% No answer Throgs Neck/Whitestone Bridge 1 2% % MA Regional/Local in Bronx Crossing out of Bronx Bruckner /Cross Bronx New England Thruway/I-95 North 5 71% Major Deegan /Bruckner No answer 1 14% Bruckner No answer 1 14% 7 100% Manhattan Regional/Local in Bronx Crossing out of Bronx Bruckner Blvd. 3rd Ave. Bridge 36 60% No Answer 3rd Ave. Bridge 6 10% No answer No answer 5 8% Bruckner Triboro (RFK) Bridge 3 5% Major Deegan No answer 3 5% Southern Blvd 3rd Ave. Bridge 1 2% Cross Bronx 3rd Ave. Bridge 1 2% Major Deegan 3rd Ave. Bridge 1 2% Bruckner Blvd. 138th Street Bridge 1 2% Cross Bronx Riverside Drive 1 2% Bruckner Blvd. Triboro (RFK) Bridge 1 2% Bruckner No answer 1 2% % MD Regional/Local in Bronx Crossing out of Bronx 1 100% 1 100%
63 ME Regional/Local in Bronx Crossing out of Bronx Bruckner /Cross Bronx NJ Regional/Local in Bronx Crossing out of Bronx No answer 3 100% 3 100% /Bruckner 47 69% Cross Bronx 10 15% Bruckner /Major Deegan 6 9% No answer No answer 5 7% % PA Regional/Local in Bronx Crossing out of Bronx Bruckner /Cross Bronx Queens Regional/Local in Bronx Crossing out of Bronx 1 100% 1 100% Bruckner Throgs Neck/Whitestone Bridge 39 64% Bruckner Triboro (RFK) Bridge 15 25% Bruckner 3rd Ave Bridge 1 2% Major Deegan/Bruckner Triboro (RFK) Bridge 1 2% Bruckner Blvd. Triboro (RFK) Bridge 3 5% Bruckner Blvd 3rd Ave Bridge 2 3% % RI Regional/Local in Bronx Crossing out of Bronx Bruckner New England Thruway/I-95 North 1 100% 1 100% 57
64 Staten Island Regional/Local in Bronx Crossing out of Bronx Bruckner Triboro (RFK) Bridge 3 75% /Bruckner 1 25% 4 100% Upstate, NY Regional/Local in Bronx Crossing out of Bronx Major Deegan /Bruckner No answer 5 25% Bruckner New England Thruway/I-95 North 3 15% /Bruckner 2 10% Bruckner Rt 9A 1 5% Major Deegan /Bruckner Blvd. 1 5% Major Deegan /Bruckner Tappan Zee 1 5% Major Deegan /Bruckner No answer 2 10% Bruckner No answer 1 5% /Bruckner No answer 1 5% /Major Deegan No answer 1 5% No answer No answer 1 5% Major Deegan /Bruckner Blvd. No answer 1 5% % Westchester Regional/Local in Bronx Crossing out of Bronx Bruckner New England Thruway/I-95 North 6 50% Major Deegan /Bruckner No answer 4 33% Bruckner Bronx River Parkway 2 17% % 58
65 No Destination Provided Regional/Local in Bronx Crossing out of Bronx No answer No answer 5 42% Bruckner No answer 3 25% Bruckner Throgs Neck/Whitestone Bridge 1 8% Bruckner Triboro (RFK) Bridge 1 8% 1 8% 11 92% Total Number of surveys
66 Appendi x 5: Meat Market Inbound Trips by Origin and RouteBro oklyn Crossing into Bronx Regional/Local in Bronx Triboro (RFK) Bridge Bruckner Blvd % Triboro (RFK) Bridge Bruckner 9 33% Willis Ave. Bridge Bruckner Blvd. 3 11% No answer Bruckner 2 7% Throgs Neck/Whitestone Bridge Bruckner 1 4% % Bronx Crossing into Bronx Regional/Local in Bronx Not applicable Local streets 52 55% Not applicable Bruckner Blvd/ 22 23% Not applicable Cross Bronx /Bruckner 3 3% Not applicable 3 3% Not applicable Cross Bronx 2 2% Not applicable Major Deegan /Bruckner 4 4% Not applicable Bronx River Pkwy/Bruckner 1 1% Not applicable Bruckner 1 1% Not applicable Cross Bronx /Southern Blvd 1 1% New England Thruway/I-95 South No answer 1 1% Not applicable Southern Blvd 1 1% Throgs Neck/Whitestone Bridge 1 1% Triboro (RFK) Bridge Bruckner Blvd 1 1% Triboro (RFK) Bridge Bruckner 1 1% % CT Crossing into Bronx Regional/Local in Bronx New England Thruway/I-95 Cross Bronx 5 45% 60
67 South New England Thruway/I-95 South New England Thruway/I-95 South /Bruckner Cross Bronx /Bruckner Blvd. 2 18% 2 18% 2 18% % CA Crossing into Bronx Regional/Local in Bronx 1 100% 1 100% Canada Crossing into Bronx Regional/Local in Bronx % 1 33% No answer Cross Bronx /Bruckner 1 33% No answer Major Deegan /Bruckner 1 33% 3 100% CO Crossing into Bronx Regional/Local in Bronx % 1 100% 1 100% DE Crossing into Bronx Regional/Local in Bronx Major Deegan /Bruckner Triboro (RFK) Bridge Major Deegan /Bruckner % % 20% 1 10% % IL Crossing into Bronx Regional/Local in Bronx Major Deegan /Bruckner 1 100% 1 100% 61
68 IN Crossing into Bronx Regional/Local in Bronx Major Deegan /Bruckner 1 50% 1 50% 2 100% Long Island Crossing into Bronx Regional/Local in Bronx Throgs Necks/Whitestone Bruckner 32 82% Triboro (RFK) Bridge Bruckner 3 8% Throgs Neck/Whitestone Bruckner Blvd. Bridge 1 3% Triboro (RFK) Bridge Bruckner Blvd. 1 3% Willis Ave. Bridge Bruckner Blvd. 1 3% N/A Major Deegan /Bruckner 1 3% % MA Crossing into Bronx Regional/Local in Bronx New England Thruway/I-95 South Bruckner 1 100% 1 100% Manhattan Crossing into Bronx Regional/Local in Bronx Willis Ave Bridge Bruckner Blvd 23 79% 145th Street Bridge Local streets 4 14% 181st St/Washington Bridge 1 3% 181st St St/Washington Bridge Local streets 1 3% % MD Crossing into Bronx Regional/Local in Bronx 3 100% 62
69 3 100% MI Crossing into Bronx Regional/Local in Bronx 1 100% 1 100% MO Crossing into Bronx Regional/Local in Bronx Triboro (RFK) Bridge Bruckner Blvd 1 100% 1 100% NC Crossing into Bronx Regional/Local in Bronx 6 86% Cross Bronx 1 14% 7 100% NE Crossing into Bronx Regional/Local in Bronx 1 50% Major Deegan /Bruckner 1 50% 2 100% NJ Crossing into Bronx Regional/Local in Bronx 41 66% Major Deegan /Bruckner 14 23% Cross Bronx //Bruckner 2 3% Willis Ave. Bridge Bruckner Blvd 2 3% Cross Bronx 1 2% Local streets 1 2% Triboro (RFK) Bridge Bruckner 1 2% % 63
70 OH Crossing into Bronx Regional/Local in Bronx Triboro (RFK) Bridge Bruckner 1 100% 1 100% PA Crossing into Bronx Regional/Local in Bronx 4 67% Major Deegan /Bruckner 2 33% 6 100% Queens Crossing into Bronx Regional/Local in Bronx Triboro (RFK) Bridge Bruckner Blvd 15 35% Triboro (RFK) Bridge Bruckner 13 30% Throgs Neck/Whitestone Bridge Cross Bronx /Bruckner 12 28% Throgs Neck/Whitestone Bruckner Blvd Bridge 1 2% Willis Ave. Bridge Bruckner Blvd 1 2% No answer Bruckner 1 2% % SC Crossing into Bronx Regional/Local in Bronx 1 100% 1 100% Staten Island Crossing into Bronx Regional/Local in Bronx Major Deegan /Bruckner 1 50% Triboro (RFK) Bridge Bruckner 1 50% 2 100% TX Crossing into Bronx Regional/Local in Bronx 1 100% 64
71 1 100% Upstate, NY Crossing into Bronx Regional/Local in Bronx No answer Major Deegan /Bruckner 7 28% 3 12% I-87 Cross Bronx /Bruckner 3 12% No answer Cross Bronx /Bruckner 3 12% Major Deegan /Bruckner 2 8% Major Deegan /Southern Blvd 1 4% I % No answer 1 4% New England Thruway/I-95 South Bruckner 1 4% % UT Crossing into Bronx Regional/Local in Bronx 1 100% 1 100% VA Crossing into Bronx Regional/Local in Bronx 7 88% Willis Ave Bridge Bruckner Blvd. 1 13% 8 100% 65
72 Westchester Crossing into Bronx Regional/Local in Bronx No answer Major Deegan /Bruckner 7 32% New England Thruway/I-95 Cross Bronx /Bruckner South 3 14% I-87 Major Deegan /Bruckner 2 9% No answer Major Deegan /Bruckner 6 27% No answer Local streets 1 5% No answer 2 9% New England Thruway/I-95 South Bruckner Blvd 1 5% % Total Number of surveys
73 Appendix 6: Meat Market Outbound Trips by Destination and Route Brooklyn Regional/Local in Bronx Crossing out of Bronx Bruckner Triboro/(RFK) Bridge 4 29% Bruckner Throgs Neck/Whitestone Bridge 3 21% Bruckner Blvd Triboro/(RFK) Bridge 3 21% Bruckner Blvd 3rd Ave Bridge 1 7% 1 7% No answer No answer 1 7% Bruckner No answer 1 7% % Bronx Regional/Local in Bronx Crossing out of Bronx No answer Not Applicable 22 33% Bruckner Blvd Not Applicable 17 26% Local streets Not Applicable 9 14% Not Applicable 4 6% Cross Bronx Not Applicable 2 3% Major Deegan /Bruckner Not Applicable 2 3% Bruckner New England Thurway/I-95 North 2 3% Bruckner Blvd 3rd Ave Bridge 1 2% Bruckner Bronx River Pkwy 1 2% Bruckner Not Applicable 1 2% Clearview (not in Bronx) Throgs Neck/Whitestone Bridge Bridge 1 2% Cross Bronx /Bruckner Not Applicable 1 2% Major Deegan Not Applicable 1 2% Cross Bronx /Southern Blvd Not Applicable 1 2% Roosevelt Ave (Queens) Not Applicable 1 2% % 67
74 CT Regional/Local in Bronx Crossing out of Bronx Cross Bronx /Bruckner No answer 4 36% Bruckner New England Thurway/I-95 North 2 18% New England Thurway/I-95 North 1 9% No answer New England Thurway/I-95 North 1 9% 1 9% Bruckner Bronx River Pkwy 1 9% Cross Bronx /Bruckner Blvd No answer 1 9% % Canada Regional/Local in Bronx Crossing out of Bronx Major Deegan /Bruckner No answer 1 33% 2 67% 3 100% DE Regional/Local in Bronx Crossing out of Bronx 6 86% Major Deegan /Bruckner Expy 1 14% 7 100% IL Regional/Local in Bronx Crossing out of Bronx Major Deegan /Bruckner 1 100% 1 68
75 Long Island Regional/Local in Bronx Crossing out of Bronx Bruckner Throgs Neck/Whitestone Bridge 18 72% Bruckner Blvd Throgs Neck/Whitestone Bridge 2 8% Bruckner 1 4% 1 4% No answer Throgs Neck/Whitestone Bridge 1 4% Bruckner Triboro/(RFK) Bridge 1 4% Bruckner No answer 1 4% % MA Regional/Local in Bronx Crossing out of Bronx Major Deegan /Bruckner Blvd New England Thurway/I-95 North 1 100% 1 Manhattan Regional/Local in Bronx Crossing out of Bronx Bruckner Blvd 3rd Ave Bridge 22 73% Bruckner Blvd. 138th Street Bridge 1 3% Major Deegan 145th Street Bridge 1 3% E 149th Street 145th Street Bridge 1 3% Bruckner New England Thurway/I-95 North 1 3% Cross Bronx /Bruckner No answer 1 3% Bruckner Blvd No answer 1 3% Major Deegan / Bruckner Expressway University Heights Bridge 1 3% No answer No answer 1 3% % MD Regional/Local in Bronx Crossing out of Bronx 3 100% 3 100% NC Regional/Local in Bronx Crossing out of Bronx Major Deegan/Bruckner 4 100% 4 100% 69
76 NE Regional/Local in Bronx Crossing out of Bronx Major Deegan /Bruckner 1 100% 1 100% NJ Regional/Local in Bronx Crossing out of Bronx 35 60% Major Deegan /Bruckner 16 28% Cross Bronx 4 7% Follows GPS 1 2% Bruckner Blvd Triboro/(RFK) Bridge 1 2% Bruckner Triboro/(RFK) Bridge 1 2% % PA Regional/Local in Bronx Crossing out of Bronx 4 57% Cross Bronx 2 29% Major Deegan /Bruckner 1 14% 7 100% Queens Regional/Local in Bronx Crossing out of Bronx Bruckner Triboro/(RFK) Bridge 8 31% Bruckner Blvd Triboro/(RFK) Bridge 8 31% Bruckner Throgs Neck/Whitestone Bridge 6 23% Bruckner No answer 2 8% Bruckner Blvd 3rd Ave Bridge 1 4% No answer No answer 1 4% % Staten Island Regional/Local in Bronx Crossing out of Bronx Bruckner Triboro/(RFK) Bridge 2 100% 2 100% 70
77 TX Regional/Local in Bronx Crossing out of Bronx 1 100% 1 100% Upstate, NY Regional/Local in Bronx Crossing out of Bronx Major Deegan /Bruckner I % Major Deegan /Bruckner Tappan Zee Bridge 1 6% I % Cross Bronx /Bruckner No answer 4 24% 1 6% Cross Bronx /Bruckner Throgs Neck/Whitestone Bridge 1 6% % UT Regional/Local in Bronx Crossing out of Bronx 1 100% 1 100% VA Regional/Local in Bronx Crossing out of Bronx 5 100% 5 100% Westchester Regional/Local in Bronx Crossing out of Bronx New England Thurway/I-95 North 9 41% Bruckner Major Deegan /Bruckner No answer 10 45% No answer 1 5% No answer No answer 1 5% Bruckner Blvd New England Thurway/I-95 North 1 5% % 71
78 No Destination Regional/Local in Bronx Crossing out of Bronx Done for the day 57 63% Tenant (not leaving) 18 20% Don't Know Yet 16 18% % No answer Regional/Local in Bronx Crossing out of Bronx 1 11% No answer 1 11% No answer No answer 7 78% 9 100% Total Number of surveys
79 Appendix 7: Produce Market Inbound Trips by Origin and Route Bronx Crossing into Bronx Regional/Local in Bronx Not applicable Local streets 60 43% Not applicable Bruckner Blvd 15 11% Not applicable Bruckner 6 4% Not applicable Cross Bronx 6 4% Not applicable Major Deegan /Bruckner 6 4% Not applicable 4 3% Not applicable Sheridan 3 2% Not applicable Cross Bronx /Bruckner 2 1% Not applicable Southern Blvd 2 1% Not applicable Bronx River Pkwy/Bruckner 1 1% Not applicable Gun Hill Road 1 1% Not applicable Randall Ave 4 3% Not applicable East Bay Ave 3 2% Not applicable Tiffany St 3 2% Not applicable Oak Point Ave 2 1% Not applicable Hunts Point Ave 1 1% Not applicable Lafayette St 1 1% Not applicable Veile Ave 1 1% Not applicable Whittier Street 1 1% Not applicable Garrsion Ave 1 1% Not applicable Doesn't Know 13 9% Hutchinson Pkwy Bruckner Blvd 1 1% Not applicable Pelham Pkwy/Cross Bronx /Bruckner Blvd 1 1% % Brooklyn Crossing into Bronx Regional/Local in Bronx Triboro (RFK) Bridge Bruckner 22 44% Willis Ave Bridge Bruckner Blvd 14 28% Triboro (RFK) Bridge Bruckner Blvd 7 14% Throgs Neck/Whitestone Bruckner Bridge 3 6% Throgs Neck/Whitestone Bruckner Blvd Bridge 1 2% Throgs Neck/Whitestone Bridge 1 2% Triboro (RFK) Bridge Southern Blvd 1 2% No answer Local streets 1 2% % 73
80 CT Crossing into Bronx Regional/Local in Bronx New England Thurway/I- 95 South New England Thurway/I- 95 South New England Thurway/I- 95 South Bruckner Southern Blvd 7 54% 5 38% 1 8% % CA Crossing into Bronx Regional/Local in Bronx 10 67% Cross Bronx 3 20% Major Deegan /Bruckner 1 7% Doesn't know 1 7% % Canada Crossing into Bronx Regional/Local in Bronx 6 75% Cross Bronx 1 13% I-87 Major Deegan /Bruckner 1 13% 8 100% DE Crossing into Bronx Regional/Local in Bronx 1 50% Major Deegan /Bruckner Triboro (RFK) Bridge 1 50% 2 100% FL Crossing into Bronx Regional/Local in Bronx Cross Bronx 1 33% Followed GPS 1 33% Triboro (RFK) Bridge Bruckner 1 33% 3 100% 74
81 ID Crossing into Bronx Regional/Local in Bronx 1 50% Cross Bronx 1 50% 2 100% Long Island Crossing into Bronx Regional/Local in Bronx Throgs Necks/Whitestone Bruckner 37 86% Throgs Necks/Whitestone Bruckner Blvd 2 5% Triboro (RFK) Bridge Bruckner Blvd 1 2% Triboro (RFK) Bridge Bruckner 1 2% Triboro (RFK) Bridge Cross Bronx 1 2% Willis Ave Bridge Bruckner Blvd 1 2% % MA Crossing into Bronx Regional/Local in Bronx New England Thurway/I- 95 South Bruckner 2 67% No answer 1 33% 3 100% Manhattan Crossing into Bronx Regional/Local in Bronx Willis Ave Bridge Bruckner Blvd 18 45% 181st Street Bridge 6 15% 155th Street Bridge 161st Street 3 8% Willis Ave Bridge Southern Blvd 3 8% Triboro (RFK) Bridge Bruckner 3 8% 145th Street Bridge 149th Street 2 5% Triboro (RFK) Bridge Bruckner Blvd 2 5% Triboro (RFK) Bridge Southern Blvd 2 5% University Heights Bridge Fordham Rd 1 3% % ME Crossing into Bronx Regional/Local in Bronx I-87 Major Deegan 1 100% 1 100% 75
82 MN Crossing into Bronx Regional/Local in Bronx 1 100% 1 NJ Crossing into Bronx Regional/Local in Bronx 52 57% Cross Bronx 25 27% Major Deegan /Bruckner 12 13% I-87 Major Deegan /Bruckner 1 1% Willis Ave. Bridge Bruckner Blvd 1 1% % OH Crossing into Bronx Regional/Local in Bronx Cross Bronx 1 100% 1 100% OR Crossing into Bronx Regional/Local in Bronx 3 100% 3 100% PA Crossing into Bronx Regional/Local in Bronx Cross Bronx 3 43% 3 43% Major Deegan /Bruckner 1 14% 7 100% 76
83 Queens Crossing into Bronx Regional/Local in Bronx Throgs Neck/Whitestone Bridge Bruckner 62 51% Triboro (RFK) Bridge Bruckner 28 23% Willis Ave Bridge Bruckner Blvd 11 9% Triboro (RFK) Bridge Bruckner Blvd 10 8% Throgs Neck/Whitestone Bridge Bruckner Blvd 5 4% No answer Major Deegan /Bruckner Blvd 2 2% Throgs Neck/Whitestone Cross Bronx Bridge 1 1% Triboro (RFK) Bridge Local streets 1 1% Willis Ave Bridge Local streets 1 1% % Staten Island Crossing into Bronx Regional/Local in Bronx Triboro (RFK) Bridge Bruckner 9 60% Willis Ave Bridge Bruckner Blvd 4 27% Cross Bronx 1 7% Triboro (RFK) Bridge Bruckner Blvd 1 7% % TN Crossing into Bronx Regional/Local in Bronx Cross Bronx 1 100% 1 100% TX Crossing into Bronx Regional/Local in Bronx 6 100% 6 100% 77
84 Upstate, NY Crossing into Bronx Regional/Local in Bronx No answer Major Deegan /Bruckner 4 33% I-87 Major Deegan /Bruckner 3 25% 3 25% Cross Bronx 1 8% New England Thurway/I- 95 South Bruckner 1 8% % VA Crossing into Bronx Regional/Local in Bronx Cross Bronx 3 75% 1 25% 4 100% Westchester Crossing into Bronx Regional/Local in Bronx I-87 New England Thurway/I- 95 South N/A Major Deegan /Bruckner 10 43% Bruckner 6 26% Major Deegan /Bruckner 5 22% N/A Bruckner 1 4% N/A Cross Bronx 1 4% % AR Crossing into Bronx Regional/Local in Bronx 1 100% 1 100% WA Crossing into Bronx Regional/Local in Bronx 1 100% 1 100% Total Number of surveys
85 Appendix 8: Produce Market Outbound Trips by Destination and Route Brooklyn Regional/Local in Bronx Crossing out of Bronx Bruckner Triboro (RFK) Bridge 28 56% Bruckner Blvd 3rd Ave Bridge 8 16% Bruckner Throgs Neck/Whitestone Bridge 5 10% Southern Blvd 3rd Ave Bridge 2 4% Bruckner Blvd Throgs Neck/Whitestone Bridge 2 4% No answer No answer 2 4% I-95 South Throgs Neck/Whitestone Bridge 1 2% No answer Throgs Neck/Whitestone Bridge 1 2% Southern Blvd Triboro (RFK) Bridge 1 2% % Bronx Regional/Local in Bronx Crossing out of Bronx No answer Not applicable 37 41% Local streets Not applicable 21 23% Major Deegan Not applicable 8 9% Bruckner Blvd Not applicable 6 7% Bruckner Not applicable 3 3% Not applicable 4 4% Cross Bronx Not applicable 2 2% Bronx River Pkwy/Bruckner Not applicable 2 2% Southern Blvd Not applicable 2 2% Major Deegan /169th Street Not applicable 1 1% Grand Concourse Not applicable 1 1% I-95 North Not applicable 1 1% Sheridan Not applicable 1 1% Truxton Ave Not applicable 1 1% % CT Regional/Local in Bronx Crossing out of Bronx Bruckner New England Thurway/I-95 North 4 40% Cross Bronx /Bruckner N/A 6 60% % 79
86 CA Regional/Local in Bronx Crossing out of Bronx 2 40% Cross Bronx 1 20% Major Deegan /Bruckner 1 20% Sheridan 3rd Ave Bridge 1 20% 5 100% DE Regional/Local in Bronx Crossing out of Bronx 2 Major Deegan /Bruckner Expy Triboro (RFK) Bridge 1 67% 33% 3 100% FL Regional/Local in Bronx Crossing out of Bronx No answer Follows GPS 1 50% No answer No answer 1 50% 2 100% LI Regional/Local in Bronx Crossing out of Bronx Bruckner Throgs Necks/Whitestone 25 76% Bruckner Blvd Throgs Necks/Whitestone 5 15% Throgs Necks/Whitestone Expy 1 3% Southern Blvd Throgs Necks/Whitestone 1 3% No answer No answer 1 3% % MA Regional/Local in Bronx Crossing out of Bronx Cross Bronx /Bruckner New England Thurway/I-95 North 4 80% Bruckner Blvd 3rd Ave Bridge 1 20% 5 100% 80
87 Manhattan Regional/Local in Bronx Crossing out of Bronx Bruckner Blvd 3rd Ave Bridge 73 68% 181st Street Bridge 8 7% Southern Blvd 3rd Ave Bridge 7 7% Local streets 145th Street Bridge 5 5% Major Deegan 145th Street Bridge /Bruckner Expy 4 4% No answer No answer 4 4% Bruckner Expy Triboro (RFK) 3 3% Local streets 155th Street Bridge 1 1% Major Deegan 155th Street Bridge /Bruckner Expy Major Deegan /Bruckner Expy University Heights Bridge 1 1% 1 1% % MN Regional/Local in Bronx Crossing out of Bronx 1 100% 1 100% NJ Regional/Local in Bronx Crossing out of Bronx Cross Bronx /Sheridan 55 54% Cross Bronx 34 34% Major Deegan /Bruckner 6 6% No answer No answer 4 4% Southern Blvd 1 1% No answer 1 1% % OH Regional/Local in Bronx Crossing out of Bronx Cross Bronx 1 100% 1 100% 81
88 PA Regional/Local in Bronx Crossing out of Bronx % 5 50% Cross Bronx 3 30% Major Deegan /Bruckner 2 20% % Queens Regional/Local in Bronx Crossing out of Bronx Bruckner Throgs Neck/Whitestone Bridge 47 48% Bruckner Triboro (RFK) Bridge 34 35% No answer Follows GPS 1 1% No answer No answer 8 8% Bruckner Blvd 3rd Ave Bridge 6 6% Local streets Triboro (RFK) Bridge 1 1% Southern Blvd Triboro (RFK) Bridge 1 1% % Staten Island Regional/Local in Bronx Crossing out of Bronx Bruckner Triboro (RFK) Bridge 5 45% Major Deegan /Bruckner 2 18% Cross Bronx 1 9% Bruckner Blvd 3rd Ave Bridge 1 9% No answer No answer 1 9% 1 9% % TN Regional/Local in Bronx Crossing out of Bronx Southern Blvd 1 100% 1 100% TX Regional/Local in Bronx Crossing out of Bronx 1 100% 1 100% 82
89 Upstate, NY Regional/Local in Bronx Crossing out of Bronx Bruckner New England Thurway/I-95 South 1 20% Major Deegan I-87 /Bruckner 4 80% 5 100% VA Regional/Local in Bronx Crossing out of Bronx No answer 1 50% 1 50% 2 100% Westchester Regional/Local in Bronx Crossing out of Bronx Major Deegan /Bruckner I-87 Major Deegan /Bruckner N/A 9 47% 3 Bruckner New England Thurway/I-95 North 4 21% No answer No answer 2 11% Bruckner Blvd I % 19 84% No Destination Regional/Local in Bronx Crossing out of Bronx Not applicable Don't Know Yet 24 48% Not applicable Done for the day 17 34% No answer No answer 9 18% % Total Number of surveys
90 Appendix 9: Trip Distribution by Major Routes 84
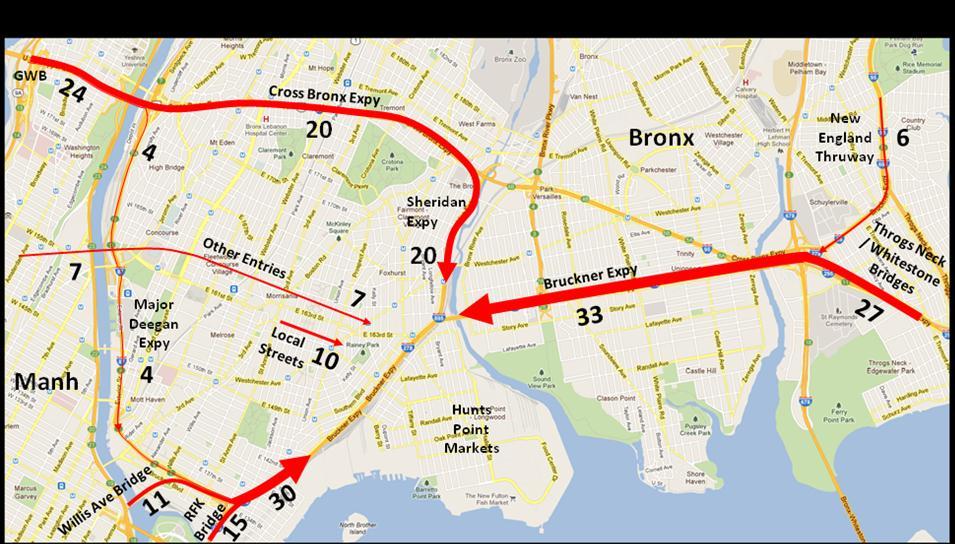
91 85
SAMPLE AUDIT FORMAT. Pre Audit Notification Letter Draft. Dear Registrant:
 Pre Audit Notification Letter Draft Dear Registrant: The Pennsylvania Department of Transportation (PennDOT) is a member of the Federally Mandated International Registration Plan (IRP). As part of this
Nursing Facilities' Life Safety Standard Survey Results Quarterly Reference Tables
 Nursing Facilities' Life Safety Standard Survey Results Quarterly Reference Tables Table of Contents Table 1: Summary of Life Safety Survey Results by State Table 2: Ten Most Frequently Cited Life Safety
Lecture 26 Section 8.4. Mon, Oct 13, 2008
 Lecture 26 Section 8.4 Hampden-Sydney College Mon, Oct 13, 2008 Outline 1 2 3 4 Exercise 8.12, page 528. Suppose that 60% of all students at a large university access course information using the Internet.
Use your text to define the following term. Use the terms to label the figure below. Define the following term.
 Mapping Our World Section. and Longitude Skim Section of your text. Write three questions that come to mind from reading the headings and the illustration captions.. Responses may include questions about
TRAINING ANNOUNCEMENT. Office of Homeland Security COURSE MGT-310
 TRAINING ANNOUNCEMENT Office of Homeland Security COURSE MGT-310 WMD Threat and Risk Assessment September 12-14, 2007 0800-1600 SUNY Maritime College at Fort Schuyler 6 Pennyfield Avenue Baylis Hall, Throggs
Your Galactic Address
 How Big is the Universe? Usually you think of your address as only three or four lines long: your name, street, city, and state. But to address a letter to a friend in a distant galaxy, you have to specify
VHD Daily Totals. Population 14.5% change. VMT Daily Totals Suffolk 24-hour VMT. 49.3% change. 14.4% change VMT
 6.9 Suffolk 6-54 VMT Population and Travel Characteristics Population 14.5% change 2014 1,529,202 VHD Daily Totals 2014 251,060 49.3% change 2040 1,788,175 2040 374,850 VMT Daily Totals 2014 39,731,990
Parametric Test. Multiple Linear Regression Spatial Application I: State Homicide Rates Equations taken from Zar, 1984.
 Multiple Linear Regression Spatial Application I: State Homicide Rates Equations taken from Zar, 984. y ˆ = a + b x + b 2 x 2K + b n x n where n is the number of variables Example: In an earlier bivariate
Summary of Natural Hazard Statistics for 2008 in the United States
 Summary of Natural Hazard Statistics for 2008 in the United States This National Weather Service (NWS) report summarizes fatalities, injuries and damages caused by severe weather in 2008. The NWS Office
Annual Performance Report: State Assessment Data
 Annual Performance Report: 2005-2006 State Assessment Data Summary Prepared by: Martha Thurlow, Jason Altman, Damien Cormier, and Ross Moen National Center on Educational Outcomes (NCEO) April, 2008 The
What Lies Beneath: A Sub- National Look at Okun s Law for the United States.
 What Lies Beneath: A Sub- National Look at Okun s Law for the United States. Nathalie Gonzalez Prieto International Monetary Fund Global Labor Markets Workshop Paris, September 1-2, 2016 What the paper
Border Crossing Freight Delay Data Collection and Analysis World Trade Bridge Laredo International Bridge 4 Laredo, Texas
 Border Crossing Freight Delay Data Collection and Analysis World Trade Bridge Laredo International Bridge 4 Laredo, Texas The border crossing freight delay data collection and analysis project was conducted
Sample Statistics 5021 First Midterm Examination with solutions
 THE UNIVERSITY OF MINNESOTA Statistics 5021 February 12, 2003 Sample First Midterm Examination (with solutions) 1. Baseball pitcher Nolan Ryan played in 20 games or more in the 24 seasons from 1968 through
Appendix 5 Summary of State Trademark Registration Provisions (as of July 2016)
") Appendix 5 Summary of State Trademark Registration Provisions (as of July 2016) App. 5-1 Registration Renewal Assignments Dates Term # of of 1st # of Use # of Form Serv. Key & State (Years) Fee Spec. Use
Appendix 5 Summary of State Trademark Registration Provisions (as of July 2016) App. 5-1 Registration Renewal Assignments Dates Term # of of 1st # of Use # of Form Serv. Key & State (Years) Fee Spec. Use
Smart Magnets for Smart Product Design: Advanced Topics
 Smart Magnets for Smart Product Design: Advanced Topics Today s Presenter Jason Morgan Vice President Engineering Correlated Magnetics Research 6 Agenda Brief overview of Correlated Magnetics Research
NATHAN HALE HIGH SCHOOL PARKING AND TRAFFIC ANALYSIS. Table of Contents
 Parking and Traffic Analysis Seattle, WA Prepared for: URS Corporation 1501 4th Avenue, Suite 1400 Seattle, WA 98101-1616 Prepared by: Mirai Transportation Planning & Engineering 11410 NE 122nd Way, Suite
The Sunland Park flyover ramp is set to close the week of March 19 until early summer
 March 2, 2018 The Sunland Park flyover ramp is set to close the week of March 19 until early summer GO 10 is targeting the week of March 19 to close the Sunland Park Drive flyover entrance ramp to I 10
Cluster Analysis. Part of the Michigan Prosperity Initiative
 Cluster Analysis Part of the Michigan Prosperity Initiative 6/17/2010 Land Policy Institute Contributors Dr. Soji Adelaja, Director Jason Ball, Visiting Academic Specialist Jonathon Baird, Research Assistant
Analyzing Severe Weather Data
 Chapter Weather Patterns and Severe Storms Investigation A Analyzing Severe Weather Data Introduction Tornadoes are violent windstorms associated with severe thunderstorms. Meteorologists carefully monitor
Drought Monitoring Capability of the Oklahoma Mesonet. Gary McManus Oklahoma Climatological Survey Oklahoma Mesonet
 Drought Monitoring Capability of the Oklahoma Mesonet Gary McManus Oklahoma Climatological Survey Oklahoma Mesonet Mesonet History Commissioned in 1994 Atmospheric measurements with 5-minute resolution,
Prepared for: San Diego Association Of Governments 401 B Street, Suite 800 San Diego, California 92101
 Activity-Based Travel Model Validation for 2012 Using Series 13 Data: Coordinated Travel Regional Activity Based Modeling Platform (CT-RAMP) for San Diego County Prepared for: San Diego Association Of
APPENDIX IV MODELLING
 APPENDIX IV MODELLING Kingston Transportation Master Plan Final Report, July 2004 Appendix IV: Modelling i TABLE OF CONTENTS Page 1.0 INTRODUCTION... 1 2.0 OBJECTIVE... 1 3.0 URBAN TRANSPORTATION MODELLING
WOODRUFF ROAD CORRIDOR ORIGIN-DESTINATION ANALYSIS
 2018 WOODRUFF ROAD CORRIDOR ORIGIN-DESTINATION ANALYSIS Introduction Woodruff Road is the main road to and through the commercial area in Greenville, South Carolina. Businesses along the corridor have
Evolution Strategies for Optimizing Rectangular Cartograms
 Evolution Strategies for Optimizing Rectangular Cartograms Kevin Buchin 1, Bettina Speckmann 1, and Sander Verdonschot 2 1 TU Eindhoven, 2 Carleton University September 20, 2012 Sander Verdonschot (Carleton
Trip Generation Characteristics of Super Convenience Market Gasoline Pump Stores
 Trip Generation Characteristics of Super Convenience Market Gasoline Pump Stores This article presents the findings of a study that investigated trip generation characteristics of a particular chain of
Trip Generation Study: A 7-Eleven Gas Station with a Convenience Store Land Use Code: 945
 Trip Generation Study: A 7-Eleven Gas Station with a Convenience Store Land Use Code: 945 Introduction The Brigham Young University Institute of Transportation Engineers student chapter (BYU ITE) completed
Appendixx C Travel Demand Model Development and Forecasting Lubbock Outer Route Study June 2014
 Appendix C Travel Demand Model Development and Forecasting Lubbock Outer Route Study June 2014 CONTENTS List of Figures-... 3 List of Tables... 4 Introduction... 1 Application of the Lubbock Travel Demand
Meteorology 110. Lab 1. Geography and Map Skills
 Meteorology 110 Name Lab 1 Geography and Map Skills 1. Geography Weather involves maps. There s no getting around it. You must know where places are so when they are mentioned in the course it won t be
2006 Supplemental Tax Information for JennisonDryden and Strategic Partners Funds
 2006 Supplemental Information for JennisonDryden and Strategic Partners s We have compiled the following information to help you prepare your 2006 federal and state tax returns: Percentage of income from
AIR FORCE RESCUE COORDINATION CENTER
 AIR FORCE RESCUE COORDINATION CENTER 2006 ANNUAL REPORT 1 TABLE OF CONTENTS AFRCC CHARTER & MISSION STATEMENT 3 AFRCC ORGANIZATION 4 TABLE 1 10 YEAR LOOKBACK 5 TABLE 2 ACTIVITY BY MISSION TYPE 6 TABLE
Expanding the GSATS Model Area into
 Appendix A Expanding the GSATS Model Area into North Carolina Jluy, 2011 Table of Contents LONG-RANGE TRANSPORTATION PLAN UPDATE 1. Introduction... 1 1.1 Background... 1 1.2 Existing Northern Extent of
JEP John E. Jack Pflum, P.E. Consulting Engineering 7541 Hosbrook Road, Cincinnati, OH Telephone:
 JEP John E. Jack Pflum, P.E. Consulting Engineering 7541 Hosbrook Road, Cincinnati, OH 45243 Email: jackpflum1@gmail.com Telephone: 513.919.7814 MEMORANDUM REPORT Traffic Impact Analysis Proposed Soccer
TRAFFIC ALERT FOR WEEK OF February 4 8, 2008
 TRAFFIC ALERT FOR WEEK OF February 4 8, 2008 Highway work zones in the Staunton District The following is a list of highway work that might affect traffic in the Staunton transportation district during
Appendix C Traffic Study
 Final Environmental Impact Statement Appendix C Traffic Study Schofield Generating Station Project, Hawaii October 2015 C-1 Final Environmental Impact Statement This page intentionally left blank. Schofield
Traffic Impact Study
 Traffic Impact Study Statham DRI One University Parkway Prepared for: Barrow County Prepared by: October 2012 Table of Contents Executive Summary i Section 1. Introduction 1 Project Description 1 Methodology
HALFF 16196? TRAFFIC MANAGEMENT PLAN. Richardson ISD Aikin Elementary School Dallas, Texas North Bowser Road Richardson, Texas 75081
 30280 16196? TRAFFIC MANAGEMENT PLAN Exhibit 572B Aikin Elementary School Planned Development District No. 572 Approved City Plan Commission October20, 2016 July 12, 2016 Prepared for HALFF AVO 31586 PHO1
Neighborhood Locations and Amenities
 University of Maryland School of Architecture, Planning and Preservation Fall, 2014 Neighborhood Locations and Amenities Authors: Cole Greene Jacob Johnson Maha Tariq Under the Supervision of: Dr. Chao
A Study of Red Light Cameras in Kansas City, MO
 A Study of Red Light s in Kansas City, MO Prepared by the Special Operations Division Executive Summary This paper will analyze the crash data for the 29 red light cameras located in 17 intersections in
Multiway Analysis of Bridge Structural Types in the National Bridge Inventory (NBI) A Tensor Decomposition Approach
 A Tensor Decomposition Approach") Multiway Analysis of Bridge Structural Types in the National Bridge Inventory (NBI) A Tensor Decomposition Approach By Offei A. Adarkwa Nii Attoh-Okine (Ph.D) (IEEE Big Data Conference -10/27/2014) 1 Presentation
Multiway Analysis of Bridge Structural Types in the National Bridge Inventory (NBI) A Tensor Decomposition Approach By Offei A. Adarkwa Nii Attoh-Okine (Ph.D) (IEEE Big Data Conference -10/27/2014) 1 Presentation
Resources. Amusement Park Physics With a NASA Twist EG GRC
 Resources 141 EG-2003-03-010-GRC 142 EG-2003-03-01o-GRC Vocabulary acceleration-the rate of change of velocity displacement-change in position of an object force-a push or a pull exerted on some object
In the Matter of the Study of State Police Stop Activity at the Southern end of the New Jersey Turnpike
 In the Matter of the Study of State Police Stop Activity at the Southern end of the New Jersey Turnpike We were retained by the ACLU of New Jersey to determine whether the New Jersey State Police (NJSP)
Forecasting the 2012 Presidential Election from History and the Polls
 Forecasting the 2012 Presidential Election from History and the Polls Drew Linzer Assistant Professor Emory University Department of Political Science Visiting Assistant Professor, 2012-13 Stanford University
Monroe County: Key West and Lower Keys
 FDOT PROJECT UPDATES June 15-21, 2015 Monroe County: Key West and Lower Keys Monroe County projects website: www.fdotmonroe.com Opt Out: If you no longer wish to receive these weekly notifications, please
C Further Concepts in Statistics
 Appendix C.1 Representing Data and Linear Modeling C1 C Further Concepts in Statistics C.1 Representing Data and Linear Modeling Use stem-and-leaf plots to organize and compare sets of data. Use histograms
Market Street PDP. Nassau County, Florida. Transportation Impact Analysis. VHB/Vanasse Hangen Brustlin, Inc. Nassau County Growth Management
 Transportation Impact Analysis Market Street PDP Nassau County, Florida Submitted to Nassau County Growth Management Prepared for TerraPointe Services, Inc. Prepared by VHB/Vanasse Hangen Brustlin, Inc.
US History, Ms. Brown Need Help? or Call
 Course: US History/Ms. Brown Homeroom: 7th Grade US History Standard #7H111 Do Now Day #11 Aims: SWBAT locate and label the 5 NYC boroughs and surrounding rivers, bridges and oceans SWBAT locate and label
Class business PS is due Wed. Lecture 20 (QPM 2016) Multivariate Regression November 14, / 44
 Multivariate Regression November 14, / 44") Multivariate Regression Prof. Jacob M. Montgomery Quantitative Political Methodology (L32 363) November 14, 2016 Lecture 20 (QPM 2016) Multivariate Regression November 14, 2016 1 / 44 Class business PS
Multivariate Regression Prof. Jacob M. Montgomery Quantitative Political Methodology (L32 363) November 14, 2016 Lecture 20 (QPM 2016) Multivariate Regression November 14, 2016 1 / 44 Class business PS
COUNCIL POLICY MANUAL
 COUNCIL POLICY MANUAL SECTION: PUBLIC WORKS SUBJECT: SNOW & ICE CONTROL POLICY 2012/2013 GOAL: Pages: 1 of 10 Approval Date: Dec. 3, 2012 Res. # 1001/2012 To annually identify the winter maintenance costs
Active Traffic & Safety Management System for Interstate 77 in Virginia. Chris McDonald, PE VDOT Southwest Regional Operations Director
 Active Traffic & Safety Management System for Interstate 77 in Virginia Chris McDonald, PE VDOT Southwest Regional Operations Director Interstate 77 at Fancy Gap Mountain Mile markers 0-15 Built in late
Greater Toronto Area Cordon Count Summary Analysis of Traffic Trends 1985 to 2011
 Greater Toronto Area Cordon Count Summary Analysis of Traffic Trends 1985 to 2011 Prepared by: Data Management Group Department of Civil Engineering University of Toronto Telephone: (416) 978-3916 Table
EXST 7015 Fall 2014 Lab 08: Polynomial Regression
 EXST 7015 Fall 2014 Lab 08: Polynomial Regression OBJECTIVES Polynomial regression is a statistical modeling technique to fit the curvilinear data that either shows a maximum or a minimum in the curve,
STATISTICAL ANALYSIS OF LAW ENFORCEMENT SURVEILLANCE IMPACT ON SAMPLE CONSTRUCTION ZONES IN MISSISSIPPI (Part 1: DESCRIPTIVE)
") STATISTICAL ANALYSIS OF LAW ENFORCEMENT SURVEILLANCE IMPACT ON SAMPLE CONSTRUCTION ZONES IN MISSISSIPPI (Part 1: DESCRIPTIVE) Tulio Sulbaran, Ph.D 1, David Marchman 2 Abstract It is estimated that every
STATISTICAL ANALYSIS OF LAW ENFORCEMENT SURVEILLANCE IMPACT ON SAMPLE CONSTRUCTION ZONES IN MISSISSIPPI (Part 1: DESCRIPTIVE) Tulio Sulbaran, Ph.D 1, David Marchman 2 Abstract It is estimated that every
FY 2010 Continuing i Planning Program Product Report. Local Transportation and Traffic Data. Wood-Washington-Wirt Interstate Planning Commission
 FY 2010 Continuing i Planning Program Product Report Local Transportation and Traffic Data Travel Time and Delay Data for Belpre and Marietta, Ohio Wood-Washington-Wirt Interstate Planning Commission CONTINUING
CVS Derwood. Local Area Transportation Review
 CVS Derwood Montgomery County, Maryland May 27, 2016 Local Area Transportation Review Prepared for: JC Bar Properties, Inc. Steve Fleming, PE 415 Fallowfield Road, Suite 301 Camp Hill, Pennsylvania 17011
Economic Geography of the Long Island Region
 Geography of Data Economic Geography of the Long Island Region Copyright 2011 AFG 1 The geography of economic activity requires: - the gathering of spatial data - the location of data geographically -
BxM9. Throgs Neck, Bronx, and Midtown, Manhattan. Between. Express Service. Bus Timetable. Effective Winter MTA Bus Company
 Bus Timetable Effective Winter 2019 MTA Bus Company BxM9 Express Service Between Throgs Neck, Bronx, and Midtown, Manhattan If you think your bus operator deserves an Apple Award our special recognition
Data Collection. Lecture Notes in Transportation Systems Engineering. Prof. Tom V. Mathew. 1 Overview 1
 Data Collection Lecture Notes in Transportation Systems Engineering Prof. Tom V. Mathew Contents 1 Overview 1 2 Survey design 2 2.1 Information needed................................. 2 2.2 Study area.....................................
TRAFFIC IMPACT STUDY. Platte Canyon Villas Arapahoe County, Colorado (Arapahoe County Case Number: Z16-001) For
 For") TRAFFIC IMPACT STUDY For Platte Canyon Villas Arapahoe County, Colorado (Arapahoe County Case Number: Z16-001) February 2015 Revised: August 2015 April 2016 July 2016 September 2016 Prepared for: KB Home
TRAFFIC IMPACT STUDY For Platte Canyon Villas Arapahoe County, Colorado (Arapahoe County Case Number: Z16-001) February 2015 Revised: August 2015 April 2016 July 2016 September 2016 Prepared for: KB Home
Swine Enteric Coronavirus Disease (SECD) Situation Report June 30, 2016
 Situation Report June 30, 2016") Animal and Plant Health Inspection Service Veterinary Services Swine Enteric Coronavirus Disease (SECD) Situation Report June 30, 2016 Information current as of 12:00 pm MDT, 06/29/2016 This report provides
Animal and Plant Health Inspection Service Veterinary Services Swine Enteric Coronavirus Disease (SECD) Situation Report June 30, 2016 Information current as of 12:00 pm MDT, 06/29/2016 This report provides
OXFORD HEIGHTS SUBDIVISION EMERGENCY EVACUATION PLAN
 OXFORD HEIGHTS SUBDIVISION EMERGENCY EVACUATION PLAN March 27, 2007 Oxford Heights Overview and Historical Conditions Oxford Heights is a medium sized community located on the southern side of Elizabeth
Appendix BAL Baltimore, Maryland 2003 Annual Report on Freeway Mobility and Reliability
 (http://mobility.tamu.edu/mmp) Office of Operations, Federal Highway Administration Appendix BAL Baltimore, Maryland 2003 Annual Report on Freeway Mobility and Reliability This report is a supplement to:
Daily Disaster Update Sunday, September 04, 2016
 Daily Disaster Update Information distributed to Disaster Notifications should be shared outside of the American Red Cross for business and mission critical purposes only please be wise when sharing information
South Western Region Travel Time Monitoring Program Congestion Management Process Spring 2008 Report
 South Western Region Travel Monitoring Program Congestion Management Process Spring 2008 Report Prepared by: South Western Regional Planning Agency 888 Washington Boulevard Stamford, CT 06901 Telephone:
Focused Traffic Analysis for the One Lincoln Park Project
 September 15, 2015 Mr. Bill Johnson Coldwell Banker 511 Sir Francis Drake Boulevard Greenbrae, CA 94904 Focused Traffic Analysis for the One Lincoln Park Project Dear Mr. Johnson; As requested, W-Trans
III. FORECASTED GROWTH
 III. FORECASTED GROWTH In order to properly identify potential improvement projects that will be required for the transportation system in Milliken, it is important to first understand the nature and volume
Daily Operations Briefing Friday, January 3, :30 a.m. EST
 Daily Operations Briefing Friday, January 3, 2014 8:30 a.m. EST Northeast Winter Storm Situation Winter Storm Warnings/Watches/Advisories & Wind Chill Warnings/Advisories remain in effect from the Tennessee
AFRCC AIR FORCE RESCUE COORDINATION CENTER
 AFRCC AIR FORCE RESCUE COORDINATION CENTER 2003 ANNUAL REPORT AFRCC ANNUAL REPORT TABLE OF CONTENTS AFRCC Mission Statement and Charter... 3 Organizational Chart... 4 Commander's Comments... 5 2003 AFRCC
Appendix B. Traffic Analysis Report
 Appendix B Traffic Analysis Report Report No. 14369/TR/WN02 August 2007 SALLINS BYPASS BYPASS OPTIONEERING ANALYSIS - TRAFFIC REPORT Kildare County Council Áras Chill Dara, Devoy Park, Naas, Co Kildare
CHAPTER 3. CAPACITY OF SIGNALIZED INTERSECTIONS
 CHAPTER 3. CAPACITY OF SIGNALIZED INTERSECTIONS 1. Overview In this chapter we explore the models on which the HCM capacity analysis method for signalized intersections are based. While the method has
WEBER ROAD RESIDENTIAL DEVELOPMENT Single Family Residential Project
 WEBER ROAD RESIDENTIAL DEVELOPMENT Single Family Residential Project WEBER ROAD RESIDENTIAL DEVELOPMENT TRAFFIC IMPACT STUDY TABLE OF CONTENTS 1.0 Executive Summary Page 2.0 Introduction 2.1 DEVELOPMENT
City of Hermosa Beach Beach Access and Parking Study. Submitted by. 600 Wilshire Blvd., Suite 1050 Los Angeles, CA
 City of Hermosa Beach Beach Access and Parking Study Submitted by 600 Wilshire Blvd., Suite 1050 Los Angeles, CA 90017 213.261.3050 January 2015 TABLE OF CONTENTS Introduction to the Beach Access and Parking
Intercity Bus Stop Analysis
 by Karalyn Clouser, Research Associate and David Kack, Director of the Small Urban and Rural Livability Center Western Transportation Institute College of Engineering Montana State University Report prepared
The prediction of passenger flow under transport disturbance using accumulated passenger data
 Computers in Railways XIV 623 The prediction of passenger flow under transport disturbance using accumulated passenger data T. Kunimatsu & C. Hirai Signalling and Transport Information Technology Division,
Trip and Parking Generation Study of Orem Fitness Center-Abstract
 Trip and Parking Generation Study of Orem Fitness Center-Abstract The Brigham Young University Institute of Transportation Engineers student chapter (BYU ITE) completed a trip and parking generation study
Cipra D. Revised Submittal 1
 Cipra D. Revised Submittal 1 Enhancing MPO Travel Models with Statewide Model Inputs: An Application from Wisconsin David Cipra, PhD * Wisconsin Department of Transportation PO Box 7913 Madison, Wisconsin
Shutdown: NYCT s Extreme Weather Strategy for Safety and Recovery
 Shutdown: NYCT s Extreme Weather Strategy for Safety and Recovery Larry Gould Senior Director, Operations Analysis New York City Transit 0 NYCT Subway: 5.3 Million Riders Daily 468 stations 660 track miles
The Northeast United States: Big Cities to Mountain Ranges. Natural Resources Food Transportation Industry X Lumber/trees
 The Northeast United States: Big Cities to Mountain Ranges Classifying / Categorizing Information Natural Resources Food Transportation Industry Lumber/trees Maple Syrup Historic and Cultural Landmarks
Some concepts are so simple
 Density: How Concentrated is Our Population? Morton J. Marcus Director Emeritus, Indiana Business Research Center, Kelley School of Business, Indiana University Some concepts are so simple to understand.
BxM9. Throgs Neck, Bronx, and Midtown, Manhattan. Between. Express Service. Bus Timetable. Effective Winter MTA Bus Company
 Bus Timetable Effective Winter 2018 MTA Bus Company BxM9 Express Service Between Throgs Neck, Bronx, and Midtown, Manhattan If you think your bus operator deserves an Apple Award our special recognition
Typical information required from the data collection can be grouped into four categories, enumerated as below.
 Chapter 6 Data Collection 6.1 Overview The four-stage modeling, an important tool for forecasting future demand and performance of a transportation system, was developed for evaluating large-scale infrastructure
Statistical Mechanics of Money, Income, and Wealth
 Statistical Mechanics of Money, Income, and Wealth Victor M. Yakovenko Adrian A. Dragulescu and A. Christian Silva Department of Physics, University of Maryland, College Park, USA http://www2.physics.umd.edu/~yakovenk/econophysics.html
HOFSTRA UNIVERSITY DEPARTMENT OF INTERCOLLEGIATE ATHLETICS
 HOFSTRA UNIVERSITY DEPARTMENT OF INTERCOLLEGIATE ATHLETICS 2011-2012 VISITING TEAM GUIDE MEN S AND WOMEN S LACROSSE Hempstead, New York Phone: 516-463-4632 Hotels and Dining Information Hotels L.I. Marriott
April 10, Mr. Curt Van De Walle, City Manager City of Castle Hills 209 Lemonwood Drive Castle Hills, Texas 78213
 Mr. Curt Van De Walle, City Manager City of Castle Hills 209 Lemonwood Drive Castle Hills, Texas 78213 Subject: Revised Castle Hills BASIS Charter School Traffic Impact Analysis Review City of Castle Hills,
Appendix C Final Methods and Assumptions for Forecasting Traffic Volumes
 Fairview Ave. and Main St. Improvements and Local Streets Plan Appendices Ada County Highway District Appendix C Final Methods and Assumptions for Forecasting Traffic Volumes January 3, 207 Appendices
Bus Routes, New York NY, August 2017
 Page 1 of 6 Metadata format: ISO 19139 Bus Routes, New York NY, August 2017 ISO 19139 metadata content Resource Identification Information Spatial Representation Information Reference System Information
VIRGINIA S I-77 VARIABLE SPEED LIMIT SYSTEM FOR LOW VISIBILITY CONDITIONS
 VIRGINIA S I-77 VARIABLE SPEED LIMIT SYSTEM FOR LOW VISIBILITY CONDITIONS Christopher D. McDonald, PE, PTOE Regional Operations Director, Southwest Region NRITS and ITS Arizona Annual Conference October
UNITED STATES AND SOUTH AMERICA OUTLOOK (FULL REPORT) Wednesday, April 18, 2018
 Wednesday, April 18, 2018") T-storm Weather Summary Coolness continues over the next week in much of the central U.S., most likely producing the coldest April since 1907 in the Corn Belt, but followed by seasonable to mild weather
T-storm Weather Summary Coolness continues over the next week in much of the central U.S., most likely producing the coldest April since 1907 in the Corn Belt, but followed by seasonable to mild weather
Parking Regulations Dundas Street West, from Bathurst Street to Dovercourt Road
 STAFF REPORT ACTION REQUIRED Parking Regulations Dundas Street West, from Bathurst Street to Dovercourt Road Date: October 28, 2008 To: From: Toronto and East York Community Council Director, Transportation
ONE REGION: PLANNING FOR A STRONG AND JUST METROPOLIS. NYLON # 14: Regional Planning. October 31, 2018
 DRAFT ONE REGION: PLANNING FOR A STRONG AND JUST METROPOLIS NYLON # 14: Regional Planning October 31, 2018 Carolyn Grossman Meagher, Director, Regional Planning Division the New Yorker March 1976. A New
6711 LEE HIGHWAY TRAFFIC IMPACT STUDY ARLINGTON, VIRGINIA
 6711 TRAFFIC IMPACT STUDY ARLINGTON, VIRGINIA Prepared for: NVR, Inc. Prepared by: Wells + Associates, Inc. Michael J. Workosky, PTP, TOPS, TSOS John J. Andrus William L. Zeid, PE 703.917.6620 May 4, 2017
Status Report: Ongoing review of O-D cellular data for the TPB modeled area
 Item #4 Status Report: Ongoing review of O-D cellular data for the TPB modeled area Presentation to the Travel Forecasting Subcommittee September 19, 2014 Ronald Milone, COG/TPB staff National Capital
APPENDIX D.1 TRANSPORTATION: RIDERSHIP MODELING
 APPENDIX D.1 TRANSPORTATION: RIDERSHIP MODELING Appendix D.1: Transportation Ridership Modeling A. INTRODUCTION This Appendix describes the ridership forecasting methodology used by New York City Transit
Regional Transit Development Plan Strategic Corridors Analysis. Employment Access and Commuting Patterns Analysis. (Draft)
") Regional Transit Development Plan Strategic Corridors Analysis Employment Access and Commuting Patterns Analysis (Draft) April 2010 Contents 1.0 INTRODUCTION... 4 1.1 Overview and Data Sources... 4 1.2
Regional Transit Development Plan Strategic Corridors Analysis Employment Access and Commuting Patterns Analysis (Draft) April 2010 Contents 1.0 INTRODUCTION... 4 1.1 Overview and Data Sources... 4 1.2
City of Camrose Winter Road Maintenance Policy
 City of Camrose Winter Road Maintenance Policy The purpose of this policy is to outline the level of service that the City of Camrose delivers regarding the maintenance of roads in winter conditions. 1.
CONTINUING PLANNING PROGRAM LOCAL TRANSPORTATION AND TRAFFIC DATA PRODUCT REPORT [OH Corridors]
![CONTINUING PLANNING PROGRAM LOCAL TRANSPORTATION AND TRAFFIC DATA PRODUCT REPORT [OH Corridors]](/thumbs/94/120123757.jpg "CONTINUING PLANNING PROGRAM LOCAL TRANSPORTATION AND TRAFFIC DATA PRODUCT REPORT [OH Corridors]") CONTINUING PLANNING PROGRAM LOCAL TRANSPORTATION AND TRAFFIC DATA PRODUCT REPORT [OH Corridors] Travel Time and Delay Analysis for Belpre (OH) and Marietta (OH) Fiscal Year 2009 Report WOOD WASHINGTON
CONTINUING PLANNING PROGRAM LOCAL TRANSPORTATION AND TRAFFIC DATA PRODUCT REPORT [OH Corridors] Travel Time and Delay Analysis for Belpre (OH) and Marietta (OH) Fiscal Year 2009 Report WOOD WASHINGTON
Bus Timetable Effective September Local service between Morris Heights and Fort Schuyler (Bx40) or Throgs Neck (Bx42)
 or Throgs Neck (Bx42)") Bus Timetable Effective September 2004 Bx40/Bx42 Local service between Morris Heights and Fort Schuyler (Bx40) or Throgs Neck (Bx42) A new schedule is in effect as of March 12, 2006 and will be posted
Bus Timetable Effective September 2004 Bx40/Bx42 Local service between Morris Heights and Fort Schuyler (Bx40) or Throgs Neck (Bx42) A new schedule is in effect as of March 12, 2006 and will be posted
Department of Transportation and Public Works Customer Satisfaction Survey Provincial Highway System. Highlights Report
 Department of Transportation and Public Works )))))))))))))))))))))))))))) Provincial Highway System Highlights Report The - Provincial Highway System was conducted by the Marketing Research Centre for
Daily Operations Briefing. Thursday, February 13, :30 a.m. EST
 Daily Operations Briefing Thursday, February 13, 2014 8:30 a.m. EST Significant Activity: February 12 13 Significant Events: Winter Storm Southern Plains to Mid-Atlantic Significant Weather: Freezing rain
Palmerston North Area Traffic Model
 Palmerston North Area Traffic Model Presentation to IPWEA 7 November 2014 PNATM Presentation Overview Model Scope and type Data collected The model Forecasting inputs Applications PNCC Aims and Objectives
SITUATION REPORT # 7 NEW JERSEY STATE EMERGENCY OPERATIONS CENTER October 29, 2012, 8:00 A.M.
 SITUATION REPORT # 7 NEW JERSEY STATE EMERGENCY OPERATIONS CENTER October 29, 2012, 8:00 A.M. A. CURRENT SYNOPSIS: The NJ ROIC and NJOEM are responding to the onset of Tropical force winds from Hurricane