APPENDIX D.1 TRANSPORTATION: RIDERSHIP MODELING
|
|
|
- Paul Potter
- 6 years ago
- Views:
Transcription
1 APPENDIX D.1 TRANSPORTATION: RIDERSHIP MODELING
2 Appendix D.1: Transportation Ridership Modeling A. INTRODUCTION This Appendix describes the ridership forecasting methodology used by New York City Transit for this SDEIS. The primary model is the Transit Demand Forecasting Model (TDFM) developed by NYCT. 1 A second model, the MTA Regional Transit Forecasting Model (RTFM), provided forecasts of commuter rail and other suburban transit trips that included a NYCT subway transfer and mode shifts between transit and non-transit modes. The TDFM provided transit ridership forecasts for numerous alternatives and sub-alternatives proposed by the Second Avenue Subway Study. Transit ridership forecasts include projections of the number of transit trips by origin and destination and by subway and bus route. The main components of the methodology include the following: A computer model containing a detailed representation of New York City s subway and bus routes within the context of a geographic information system (GIS) A census tract based zone system for locating the origin and destination of trips A base year (2000) AM peak hour origin and destination trip table Future year (2020) AM peak hour origin and destination trip tables for projecting usage of existing and proposed routes using the subway and bus route computer model. This modeling work has been closely coordinated with regional transportation modeling at the New York Metropolitan Transportation Planning Council (NYMTC), the federally designated metropolitan planning organization (MPO) and the Metropolitan Transportation Authority (MTA). The regional models developed at both of these organizations use NYCT s subway and bus network databases. B. MODELS USED TRANSIT DEMAND FORECASTING MODEL (TDFM) The TDFM is NYCT s in-house model of all subway and bus routes in New York City. This model has been developed and enhanced over the past eight years using TransCAD, a software package that combines transportation demand modeling with a Geographic Information System (GIS). TransCAD is a travel demand forecasting package that is used by many highway and transit agencies, as well as Metropolitan Planning Organizations throughout the country (including the NYMTC, the Metropolitan Planning Organization for the New York metropolitan area). The TDFM has been used extensively at NYCT for short-range planning [e.g., Lenox Avenue Line and Williamsburg Bridge Reconstruction projects) and long-range planning (e.g., East River Crossings Study and the Major Investment Study (MIS) and Draft Environmental Impact Statement (DEIS) prepared for the Manhattan East Side Transit Alternatives (MESA) Study in 1999]. It has also been integrated into 1 Modeling Transit Demand in the Big Apple from a Transit Agency Perspective, James J. Barry, Jeffrey Erlitz, Robert Newhouser and QiFeng Zeng; presented at the Seventh Transportation Research Board Conference on the Application of Transportation Planning Methods, March D.1-1
3 Second Avenue Subway SDEIS two TransCAD based regional models, the MTA s RTFM and NYMTC s Best Practice Model (BPM), which includes a full highway demand modeling capability in addition to transit modeling. The GIS capability in TransCAD has enabled NYCT to include the spatial detail that is needed to accurately represent the interaction between transit travel demand and the location of bus stops and subway stations. For example, the model includes a walk network that allows it to predict trips that might use the street grid to access alternative bus and subway services, rather than more simplistically assuming that all trips are made from the center of an origin zone in a straight line to a single subway or bus stop. The model also represents the characteristics of individual transit routes (e.g., the Lexington Avenue and service) separately, rather than the characteristics of a whole transit line or service (e.g., the Lexington Avenue express service). Thus, the model can predict results for each route separately. The TDFM estimates how people use the transit system in New York City during the morning (AM) peak hour. The AM peak hour was chosen because the travel demand is highest during this hour, and transit facilities and services are sized to accommodate this level of demand. (Typically, trips are made in a more concentrated time period during the morning rush; during the evening, trips are spread over a longer period.) Travel demand is represented in the model by transit trip tables, which list trips made by subway, NYCT buses, and other local and express buses in New York City. The trip tables contain estimates of the origins and destinations of patrons using the transit system, by analysis zones, e.g. census tracts or split census tracts. The origin and destination trip tables were constructed from the journey-to-work data provided in the 1990 U.S. Census of Population and Housing, Census Transportation Planning Package (CTPP). These are the latest Census data of this information currently available. The trip tables were also updated using recent ridership counts, information on origins and destinations derived from MetroCard data, and a prediction of future growth in population, labor force, and employment by census tract in Manhattan prepared by AKRF, Inc. A more detail discussion on the prediction of future growth is in Chapter 6 of this SDEIS, Social and Economic Conditions. The TDFM estimates route choices using information on transit service (routes, travel time, frequency, transfer connections) to predict which route patrons will choose. It is used to produce forecasts of riders by subway or bus route. These forecasts are suitable for general planning analysis, such as comparing the No Build Alternative and Second Avenue Subway alignment options in this document. The model outputs from the TDFM provide information on the volumes (i.e., transit riders) on various subway and bus routes, including passengers boarding and exiting trains and transferring between subway routes at various stations, and summary statistics on passenger hours and miles traveled by transit. These data were used to evaluate and compare the changes in ridership and service operations between the No Build Alternative and alternative alignments of the Second Avenue Subway. Potential improvements and decline in service were compared using such measures as station leave-load volumes 1 and volume-to-capacity (v/c) ratios. 2 REGIONAL TRANSIT FORECASTING MODEL (RTFM) The RTFM is a model of regional travel in the New York metropolitan area, including NYCT subway and bus riders; commuters using Metro-North Railroad, Long Island Rail Road (LIRR), and New Jersey Transit; automobile travelers; and people using other travel modes, including taxi, 1 2 Leave-load volume is the estimated number of passengers on-board a subway train as it leaves a station, based upon field observations or TDF model outputs. Volume-to-capacity ratio is the ratio of passenger demand to capacity of scheduled subway or bus services during the analysis period (e.g. AM peak hour). D.1-2
4 Appendix D.1: Transportation Ridership Modeling bicycle, and walk. The model divides such trips into three types: home-based work (i.e., a trip to work from home), home-based other (i.e., a trip from home to another destination), and non-home based (i.e., a trip that begins away from home). The RTFM (and its earlier versions) has been used for major transit studies in the region including the LIRR East Side Access Project, the MTA s Lower Manhattan Access Study, and Metro-North s Penn Station Access Study. The RTFM network database includes NYCT s subway and bus network from the NYCT TDFM as well as the commuter rail system and is used by NYMTC for the MTA region portion of the BPM transit network. For this SDEIS, the RTFM was used to provide forecasts of commuter rail riders using the subway and estimates of changes in mode usage (e.g., from auto to transit). The RTFM provided station-by-station estimates of commuter rail riders who would also use the Lexington Avenue and Second Avenue Lines, as well as commuters who would shift to transit from other modes. C. APPLICATION OF TDFM FOR SECOND AVENUE SUBWAY The steps involved in applying the model for the Second Avenue Subway Project are described below and illustrated in Figure D.1-1. The transit modeling process entailed four basic steps: 1) development of the zone system and transit network for the entire city (including coding and validation); 2) the development of existing and future travel demand (origin and destination trip matrices); 3) inclusion of the RTFM forecasts of commuter rail to subway transfers and mode share shifts; and 4) assignment of future trips to the future networks. TDFM PROCESS The ridership forecasting process must account for both the supply of transit service and the demand for the transit service. A change in either one can change the forecast of ridership on a proposed route. Figures D.1-2, D.1-3, and D.1-4 contain charts of the process used in this model with transit service shown on the left side of each chart and transit demand shown on the right side. The current process was updated from 1995 base year networks and trip tables used in the MESA Study s MIS/DEIS. The base year (2000) process includes coding scheduled subway and bus service into the model and developing an origin and destination trip table to represent transit demand. This very detailed process must ensure that the travel choices faced by travelers are carefully simulated, including transferring from one subway route to another or between a subway route and a bus route. Similarly, sources of information on transit demand must be carefully selected and combined to ensure that an accurate origin and destination table of transit trips is developed for use in the model. The calibration and validation process, shown at the center of Figure D.1-2, is used to accurately estimate the volume of passengers on each subway and bus route by adjusting parameters in the trip assignment model, updating the trip table and verifying coded service characteristics. Figure D.1-3 shows the development of the future year (2020) No Build transit service and trip table. To ensure that the service and demand are interacting in a reasonable way, a checking and validation process is used. Major transit service improvements in the No Build alternative include the free busto-subway transfers that started July 1, 1997, and the opening of the 63rd Street connection with the Queens Boulevard Line in Additional transit trips from the commuter rail and mode choice model components of the RTFM are added to the trip table to produce the final 2020 No Build trip table. With the No Build network completed and validated, the coding of build alternatives proceeds by adding new services and modifying existing services to accommodate use of existing lines by the Second Ave Subway service. The final build alternative is passed on to the RTFM Mode Choice Model, which estimates new trips attracted to transit. Figure D.1-4 outlines this process and shows the final product to be a set of alternative specific trip tables that include the new trips attributed to D.1-3
5 Second Avenue Subway SDEIS transit. Each of these trip tables is used as input to the transit trip assignment model. The model produces the final ridership forecasts for each alternative. DEVELOPMENT OF ZONE SYSTEM AND TRANSPORTATION NETWORKS DEVELOPMENT OF A ZONE SYSTEM The TDFM evaluates a travel network made of different travel modes. For this evaluation, a zone system was created to represent the origins and destination of trips made in the network. These zones are used to build trip tables or origin and destination matrices that show the number of current (or future) trips that people typically make between each zone. Census tracts were selected as the zones for the study so that 1990 (and in the future, when data are available, 2000) census journey-to-work data could be used. In this model, New York City is divided into 2,288 zones (see Table D.1-1). Each zone has a centroid that represents an approximate location in the zone where trips begin or end. Using over 2,000 zones reduces the size of the zones so that any errors due to this approximation are minimized. To provide greater detail close to the alternatives routes, a number of the census tracts that straddled Lexington and Second Avenues were split into smaller units (census block groups). Table D.1-1 Zones by Borough Borough New York Bronx Kings Queens Richmond Total Zones ,288 D.1-4
6 Appendix D.1: Transportation Ridership Modeling D.1-5 Figure D.1-5 Manhattan East Side Zone System with Subway Routes ROUTE CODING AND NETWORKS DEVELOPMENT NYCT has revised and enhanced the TDFM model to take advantage of computer speed and memory improvements and upgrades in the software package, TransCAD. Transit ridership forecasting for the long and short list of alternatives in the 1999 MESA MIS/DEIS was developed using the traditional trip assignment modeling approach with the following enhancements: A detailed NYC transit network with all NYCT subway and bus routes and all NYCDOT franchised bus routes, plus an extensive walk network covering most of Manhattan. All transit routes and related transfer passageway are re-coded into the route system format. A detailed zone system with 2,288 internal zones comprised of individual census tracts or census tracts split along block group lines. Two external zones were developed to account for Metro North users transferring to subway routes within or in the vicinity of Grand Central Terminal and 125th Street and Park Avenue.
7 Second Avenue Subway SDEIS A Stochastic User Equilibrium Assignment procedure that accounts for crowding constraints as well as the multiple transit route choices available in many areas of New York City. Transit Route Systems Forecasting transit ridership changes resulting from major service changes or additions requires a model of New York City s large and complex transit network. It is important that this model not only be accurate and verifiable but that the updating process be efficient and the addition of proposed new routes be manageable. To achieve these objectives NYCT switched its route coding to the new route system feature in TransCAD. A route system is a collection of routes stored together in a map layer. Each route is composed of a series of line features that are stored in another layer in the map. Bus routes are composed of line features from a layer containing all the streets in New York City. Subway routes are composed of line features from a layer containing all the subway, surface and elevated rights-of-way in the New York City subway system and the Staten Island Rapid Transit System. More than one route can operate over a single line segment, whether it is a street or a rail structure. Adding a bus route to existing streets or adding a subway route to existing lines is a relatively simple operation with this route system feature. When a route uses a new street or subway line, the street or subway line must be added to the line layer first. CREATION OF AM PEAK HOUR TRANSIT NETWORKS Transit networks were created for existing conditions in the base year (2000) and for the No Build scenario and each Build alternative in the future analysis year (2020), based on route-by-route service plans. Transit Network The transit network is a computer-based model of the transit travel choices available to passengers during the AM peak hour. It was designed with sufficient detail to represent accurately the numerous route choices available for travel to areas, such as Manhattan south of 60th Street and downtown Brooklyn. The components of the transit network include the following: All NYCT subway and Staten Island Railway (SIR) routes with AM peak hour service frequencies, travel times, and passenger-carrying capacities. A walk network with walking times and capacities for passageways between subway routes. All NYCT and New York City Department of Transportation (NYCDOT)-franchised local and express bus routes with AM peak hour service frequencies, travel times and passenger-carrying capacities. NYCDOT Staten Island Ferry route with AM peak hour service frequencies, travel times, and passenger-carrying capacities. Access and egress links for connecting zones with subway stations and/or bus stops or with street intersections in the walk network areas. Fares and transfer charges in accordance with the MTA s current fare policy. For future conditions, the model s transit network was adjusted to reflect a future service plan for all routes expected to be operating in the analysis year. The No Build Alternative s service plan includes the recent completion of the 63rd Street Tunnel Connector in Queens and the future restoration of full subway service on the Manhattan Bridge. The No Build Alternative and the Second Avenue Subway build alternatives also include the LIRR East Side Access Project, which will bring LIRR trains into Grand Central Terminal. D.1-6
8 Appendix D.1: Transportation Ridership Modeling Transit Network Specification In order for TransCAD to assign trips to routes, a network file must be created and configured to depict the key features of New York City s transit system such as express/local subway services and numerous transfer passageways between subway lines. In creating a transit network one must specify the source of all attributes, i.e., the route layer, the stop layer, and the line layer. The route layer has descriptive information such as route name, mode, headway, passenger carrying capacity and fare amount. The line layer contains length, transit in-vehicle time, and walk time. For in-vehicle time, NYCT uses the travel time table look up option. The line layer includes all streets (see Figure D.1-6) in New York City, but in order to provide reasonable connectivity several link types were specified. These link types can represent either walking links or different types of station access or transfer links. Together these links are called nontransit links. The stop layer has subway stations and bus stop information. Listed below are definitions of the various non-transit links. A transit network combines all the routes and associated model components described above into a model of the transit system as passengers would view it when choosing their path from origin to destination. Transit networks are used to solve best path problems and for performing transit trip assignments. Transit trip assignment (with capacity constraint) is a mathematical procedure that takes information from the transit network, computes the best path for all the trips in the trip table and checks the results for links with total passengers in excess of the specified passenger carrying capacity. Links over capacity are given a penalty value that makes the link less attractive for the subsequent iteration of the trip assignment. Figure D.1-6 Infrastructure Layer (Streets) Sample AVE W 25 ST 8 AVE W 28 ST W 41 ST BROADWAY W 27 ST W 26 ST 6 AVE W 36 ST W 35 ST W 34 ST W 33 ST W 32 ST W 31 ST W 30 ST W 29 ST E 27 ST E 26 ST SHUBERT AL 7 AVE TIMES SQ W 38 ST W 37 ST E 28 ST W 40 ST W 39 ST 5 AVE E 31 ST ARK AV SOUTH W 49 ST W 48 ST W 43 ST W 42 ST E 29 ST E 30 ST W 45 ST W 44 ST E 36 ST E 35 ST PARK AV W 47 ST W 46 ST E 34 ST W 50 ST E 39 ST E 38 ST W 51 ST E 40 ST ROCKEFELLER PZ E 37 ST W 52 ST VANDERBILT AV SNIFFEN CT E 33 ST E 32 ST ST DE PEW PL LEXINGTON AV MADISON AV 3 AVE QNS MDTWN TNNL EN E 42 ST E 43 ST E 45 ST E 46 ST 2 AVE E 41 ST QNS MDTWN TNNL ET F D R DR E 47 ST E 49 ST E 44 ST TUDOR CITY PL QNS MIDTOWN TNNL E 51 ST E 48 ST FDR DR SVC RD W E 57 ST E 56 ST E 54 ST E 53 ST E 52 ST 1 AVE E 55 ST E 50 ST E 58 MITCH FDR DR E D.1-7
9 Second Avenue Subway SDEIS A walk network consists of street links included in the model to allow trips to go between zones and bus stops or subway stations. These streets can also be used to transfer between bus or subway routes if there is no better connection. Most streets in Manhattan and Downtown Brooklyn are included plus all other streets used by at least one bus route (Figure D.1-7). This walk network allows the model to account for the typical New York City practice of someone walking past the nearest subway station to access another nearby station on a route that provides more direct access to the person s destination. AVE W 25 ST 8 AVE W 28 ST W 41 ST BROADWAY W 27 ST W 26 ST 6 AVE W 36 ST W 35 ST W 34 ST W 33 ST W 32 ST W 31 ST W 30 ST W 29 ST E 27 ST E 26 ST SHUBERT AL 7 AVE TIMES SQ W 38 ST W 37 ST E 28 ST W 40 ST W 39 ST 5 AVE E 31 ST W 48 ST W 43 ST W 42 ST E 29 ST W 49 ST E 30 ST PARK AV SOUTH W 45 ST W 44 ST E 35 ST W 47 ST W 46 ST E 36 ST PARK AV E 34 ST W 50 ST E 39 ST E 38 ST W 51 ST E 40 ST ROCKEFELLER PZ E 37 ST W 52 ST VANDERBILT AV SNIFFEN CT E 33 ST E 32 ST ST Figure D.1-7 Walk Network Sample DE PEW PL LEXINGTON AV MADISON AV 3 AVE QNS MDTWN TNNL EN E 42 ST E 43 ST E 46 ST E 45 ST 2 AVE E 41 ST QNS MDTWN TNNL ET F D R DR E 47 ST QNS MIDTOWN TNNL E 49 ST E 44 ST TUDOR CITY PL E 51 ST FDR DR SVC RD W E 56 ST E 57 ST E 48 ST E 54 ST E 53 ST E 52 ST 1 AVE E 55 ST E 50 ST E 58 MITCH FDR DR E Using the line layer as a foundation, subway and bus routes and stops are coded into the model. Figure D.1-8 shows a sample of the coding for subway routes and stops in Manhattan. Subway-to-subway transfers are special transfer links included in the model where two or more subway stations are linked by passageways. These transfer links contain measured walking times from the center of the platform or, in the case of proposed transfers, an estimated walking time based on the design layout. In corridors used by the proposed Second Avenue Subway and the Lexington Avenue Line, special transfer routes were created using these links so that more detailed information on transfer movements could be obtained from the model. See Figure D.1-9. Access links provides a path between zone centroids and nearby transit stops or, in the case of walk access links, between zone centroids and nearby street intersections. See Figure D D.1-8
10 Appendix D.1: Transportation Ridership Modeling 9 AVE W 25 ST 8 AVE W 41 ST 7 Ave W 28 ST W 42 ST BROADWAY W 27 ST W 26 ST 8 Ave 6 AVE 6 Ave Broadway W 36 ST W 35 ST W 34 ST W 33 ST W 32 ST W 31 ST W 30 ST W 29 ST 7 AVE E 27 ST E 26 ST SHUBERT AL TIMES SQ W 38 ST W 37 ST E 28 ST 42 St Shuttle W 40 ST W 39 ST 5 AVE E 31 ST PARK AV SOUTH W 48 ST E 29 ST W 49 ST W 43 ST E 30 ST Figure D.1-8 Subway Links and Stations Sample W 45 ST W 44 ST E 35 ST PARK AV W 47 ST W 46 ST E 34 ST W 50 ST E 39 ST E 38 ST Lexington Ave W 51 ST Flushing E 40 ST ROCKEFELLER PZ E 37 ST W 53 ST W 52 ST VANDERBILT AV SNIFFEN CT E 33 ST E 32 ST DE PEW PL LEXINGTON AV MADISON AV 3 AVE QNS MDTWN TNNL EN E 42 ST E 36 ST E 43 ST Queens E 46 ST E 45 ST 2 AVE E 41 ST QNS MDTWN TNNL ET F D R DR E 47 ST E 49 ST E 44 ST TUDOR CITY PL QNS MIDTOWN TNNL E 51 ST 2 Ave FDR DR SVC RD W E 56 ST E 57 ST E 54 ST E 53 ST E 52 ST E 48 ST 1 AVE E 55 ST E 50 ST E 58 ST MITCHELL PL FDR DR ENTRY RP AVE 8 AVE W 25 ST W 28 ST W 41 ST 7 Ave W 42 ST BROADWAY W 27 ST W 26 ST 8 Ave 6 AVE 6 Ave Broadway W 36 ST W 35 ST W 34 ST W 33 ST W 32 ST W 31 ST W 30 ST W 29 ST SHUBERT AL 7 AVE E 27 ST E 26 ST TIMES SQ W 38 ST W 37 ST E 28 ST 42 St Shuttle W 40 ST W 39 ST 5 AVE E 31 ST ARK AV SOUTH W 49 ST W 48 ST E 29 ST W 43 ST E 30 ST W 45 ST W 44 ST E 36 ST E 35 ST PARK AV Figure D.1-9 Subway Transfer Links Sample W 47 ST W 46 ST E 34 ST W 50 ST E 39 ST E 38 ST Lexington Ave W 51 ST Flushing E 40 ST E 37 ST ROCKEFELLER PZ W 52 ST 3 AVE E 33 ST E 32 ST VANDERBILT AV SNIFFEN CT ST DE PEW PL LEXINGTON AV MADISON AV Subway Transfer QNS MDTWN TNNL EN E 42 ST Queens E 46 ST E 45 ST 2 AVE E 41 ST QNS MDTWN TNNL ET F D R DR E 47 ST E 43 ST QNS MIDTOWN TNNL E 49 ST E 44 ST TUDOR CITY PL E 51 ST 2 Ave FDR DR SVC RD W E 56 ST E 57 ST E 48 ST E 54 ST E 53 ST E 52 ST 1 AVE E 55 ST E 50 ST E 58 MITCH FDR DR E D.1-9
11 Second Avenue Subway SDEIS 9 AVE W 25 ST 8 AVE W 41 ST 7 Ave W 28 ST W 42 ST BROADWAY W 27 ST W 26 ST 8 Ave 6 AVE 6 Ave Broadway W 36 ST W 35 ST W 34 ST W 33 ST W 32 ST W 31 ST W 30 ST W 29 ST 7 AVE E 27 ST E 26 ST SHUBERT AL TIMES SQ W 38 ST W 37 ST E 28 ST 42 St Shuttle W 40 ST W 39 ST 5 AVE E 31 ST PARK AV SOUTH W 48 ST E 29 ST W 49 ST W 43 ST E 30 ST W 45 ST W 44 ST E 36 ST E 35 ST PARK AV W 47 ST W 46 ST E 34 ST W 50 ST E 39 ST E 38 ST Lexington Ave W 51 ST Flushing E 40 ST ROCKEFELLER PZ E 37 ST E 33 ST E 32 ST Walk Access VANDERBILT AV SNIFFEN CT 3 AVE Figure D.1-10 Access Links and Zones DE PEW PL LEXINGTON AV MADISON AV Subway Transfer QNS MDTWN TNNL EN E 42 ST Queens E 46 ST E 45 ST 2 AVE E 41 ST QNS MDTWN TNNL ET F D R DR E 47 ST E 43 ST QNS MIDTOWN TNNL E 49 ST E 44 ST TUDOR CITY PL E 51 ST 2 Ave FDR DR SVC RD W E 56 ST E 57 ST E 48 ST E 54 ST E 53 ST E 52 ST 1 AVE E 55 ST E 50 ST E 58 ST MITCHELL PL FDR DR ENTRY RP In addition to information provide above there are two other essential items that are needed before creating a network. One is a mode table, which allows the user to define a set of modes. For each mode, service parameters (such as headways, transfer times, etc.) are defined for all routes. This table can be used for both transit and non-transit modes. The second is a mode transfer table. This table controls mode-to-mode transfers. For instance, a passenger transferring from subway to local bus will have a free transfer, but will incur a second fare transferring from subway to express bus. Transit Networks Building & Configuration There are several steps in creating a transit network. First, several selection sets are made so that TransCAD recognizes the source of all necessary attributes: Select nodes that will represent centroids. Select appropriate non-transit links Select appropriate routes and stops The next step is to configure the network. NYCT used standard and optional features in TransCAD to customize the transit networks and route systems in the TDFM to account for the complexities of the New York City Transit system, e.g., express/local subway lines and intersecting subway lines with transfer passageways. There are several types of settings to specify: General: The general settings allow you to set the travel time field, path method, maximum trip cost, maximum transfers, maximum transfer time, value of time and centroids. D.1-10
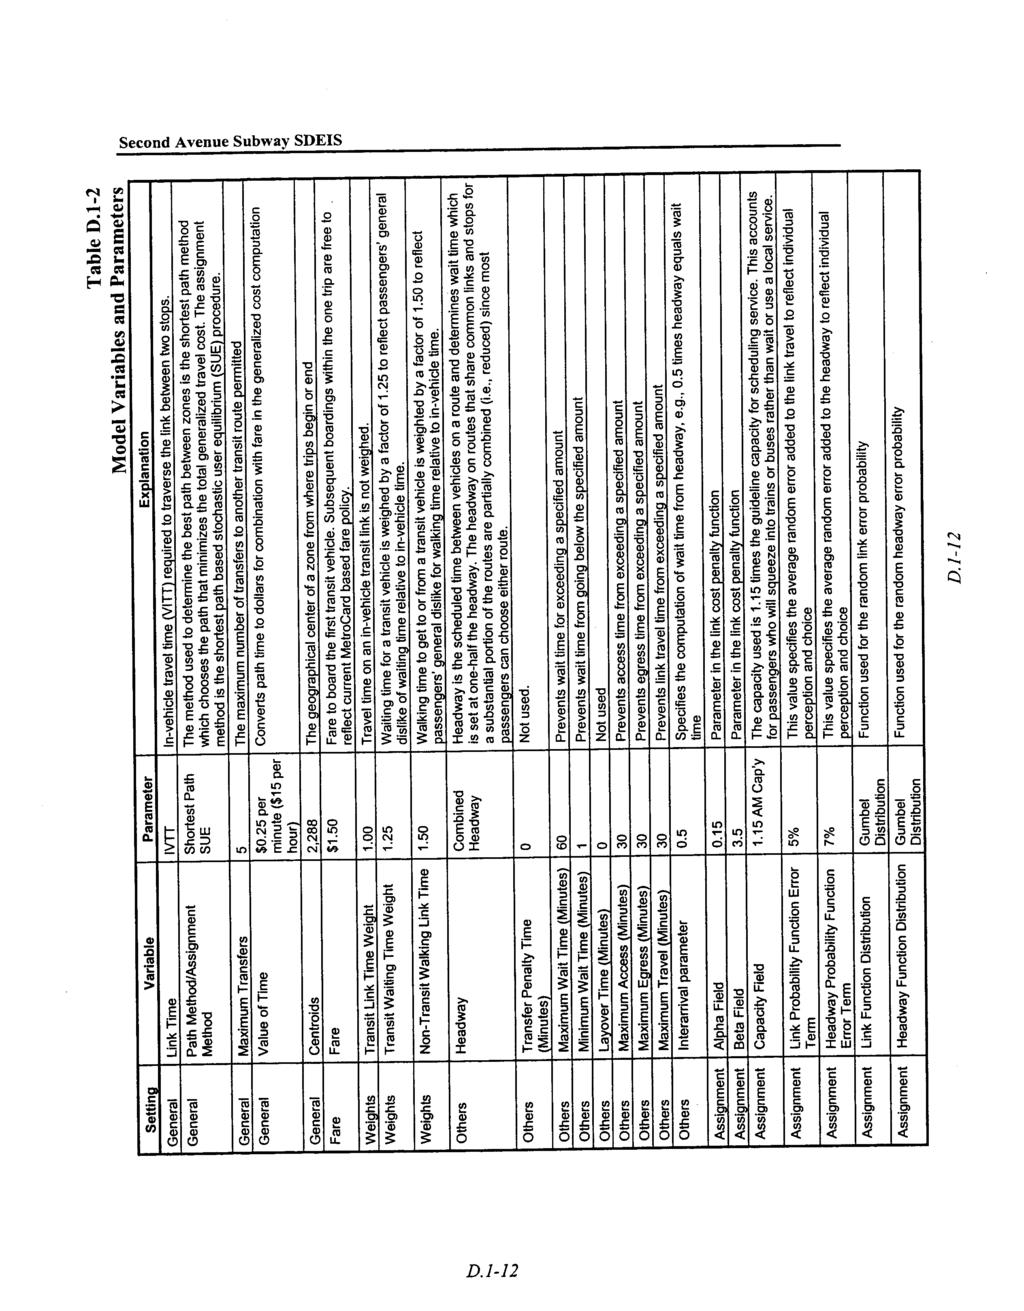
12 Appendix D.1: Transportation Ridership Modeling Mode: The mode settings allow you to temporary enable or disable modes. Fare: The fare settings allow you to choose a fare system that represents flat fares, zonal fares, zonal fares by mode, or mixed fares. A fixed fare regardless of distance represents flat fares. To replicate NYCT fare system, we use the flat fare system. A transfer fare can also be set in a similar fashion. The fare settings also allow you to specify the number of free transfers and the number of free transfers before charging a full fare. Weights: The weights setting allows you to set weights or factors to account for riders relative perception of in-vehicle time, transfer time, waiting time, dwelling time and non-transit link time. Other: Allows you to set other time costs such as waiting times, transfer times, dwell times and layover times. It is also used to set minimum and maximum waiting times, maximum access, egress and travel times. Also, an inter-arrival parameter (determines the relationship between waiting times and headways) can be set. Travel Time Tables: These tables contain the time it takes to travel on each segment of a route based on scheduled running times for existing routes or simulated travel times for proposed routes. In addition to the general settings above, Table D.1-2 below has details regarding all parameters used by NYCT and a brief explanation. Highway Network The RTFM characterizes the highway system using a network representation of all expressways, parkways, and arterial roadways in the New York metropolitan area. NYMTC, as part of its Best Practice Model (BPM), does the maintenance and processing of these networks. The BPM highway network is included in the MTA s RTFM in the form of matrices that represent peak-period congested travel time, distance, and tolls between each pair of transportation analysis zones in the modeling region. D.1-11
13
14 Appendix D.1: Transportation Ridership Modeling DEVELOPMENT OF TRANSIT TRIP TABLES A trip table is a matrix of passenger movement volumes between each origin zone and destination zone. It represents the transit travel demand. For the Second Avenue Subway, a transit-only trip table was developed, based on a table created initially for the MESA Study s MIS/DEIS. For the MESA Study, origin and destination matrices were developed, based upon 1990 Census journey-to-work data, surveys and ridership counts to develop an accurate 1995 base year AM Peak Hour Trip Table. For the Second Avenue Subway, the 1995 zone-to-zone trip table was updated to 2000, with extensive checks and calibrations performed by NYCT using MetroCard data and field checks. 1 The MetroCard usage data was used to generate a station-to-station trip matrix, which NYCT used for model calibration and validation. 2 The 2000 trip table was updated to account for residential and non-residential land use changes that occurred within Manhattan between 1990 and The 2000 Population and Employment data compiled by AKRF was used as the basis for this update. The 2000 trip table was not updated to include changes in travel patterns that occurred following the events of September 11, 2001, because these changes were viewed as temporary in the context of long-range transportation planning. The 2000 trip table was the best available approximation of normal travel patterns in the region. The 2000 trip table was then adjusted to reflect 2020 conditions in the future without the project (No Build Alternative). This was done using growth factors, which were based on journey-to-work forecasts developed by NYMTC as part of its population, employment, and labor force forecasts for the city s five counties. See Table D.1-3. The countywide forecast for Manhattan (New York County) was then allocated to specific census tracts in Manhattan, based on local development plans and projections also compiled by AKRF. This development forecasting process is described in more detail in Chapter 6, Social and Economic Conditions. For the future conditions with and without the Second Avenue Subway in place, the RTFM identified the number of commuter rail passengers transferring to the Lexington Avenue and Second Avenue subway lines at 125th Street and Grand Central Terminal. These additional transit trips were added to the 2020 Build trip table used for the No Build and Build Alternatives. In addition, the mode choice component of the RTFM produced forecast of new transit modes shifting from other primary modes (e.g., auto, taxi, commuter rail). These additional transit trips were also included in the 2020 trip table. 1 2 The journey-to-work data in the Census Transportation Planning Package (CTPP) from the 2000 Census is not yet available. Origin and Destination Estimation in New York City Using Automated Fare System Data, James J. Barry, Robert Newhouser, paper presented at the 8th Transportation Research Board (TRB) Conference on the Application of Transportation Planning Methods, Corpus Christi, Texas, April 23-26, D.1-13
15 Second Avenue Subway SDEIS Table D.1-3 Journey-to-Work Projects 2000 to 2020 Borough to Borought Residence Workplace /2000 Ratio Bronx Bronx 178, , Brooklyn 16,178 17, Manhattan 150, , Queens 150,805 20, Staten Island 988 1, NYC Total 363, , Brooklyn Bronx 11,172 13, Brooklyn 439, , Manhattan 310, , Queens 50,091 62, Staten Island 6,222 7, NYC Total 818, , Manhattan Bronx 22,395 24, Brooklyn 27,706 29, Manhattan 572, , Queens 19,680 22, Staten Island 2,091 2, NYC Total 644, , Queens Bronx 22,429 25, Brooklyn 87,920 95, Manhattan 336, , Queens 348, , Staten Island 4,459 5, NYC Total 799, , Staten Island Bronx 1,216 1, Brooklyn 26,382 30, Manhattan 53,026 65, Queens 3,848 4, Staten Island 81,083 99, NYC Total 165, , NYC Total Bronx 235, , Brooklyn 597, , Source: Manhattan 1,424,392 1,601, Queens 438, , Staten Island 94, , NYC Total 2,791,423 3,170, Journey-to-Work Flows CTPP Base, New York Metropolitan Council, 9/27/95 D.1-14
16 Appendix D.1: Transportation Ridership Modeling D. APPLICATION OF THE MODE CHOICE COMPONENT OF THE REGIONAL TRANSIT FORECASTING MODEL The MTA s RTFM was used to predict travel mode choices made by travelers. The NYCT transit networks for the No Build Alternative and Second Avenue Subway were incorporated into the MTA s RTFM, so the model could accurately reflect the proposed improvements to the subway system. The mode choice component is one of the most important aspects of the RTFM. This component predicts the shifts in market share for each mode of travel that would result from changes to the transportation network. These predictions are based on the characteristics of the trip makers, the trip purpose, and on the characteristics of each mode, including in-vehicle travel time, waiting time, fare, and number of transfers. The mode choice component calculates the number of person trips on each zone-to-zone combination for each of nine modes: Automobile (Drive Alone): Single-occupancy motorized trips that drive from origin to destination without using any transit service. Automobile (Shared-Ride): Multiple-occupant motorized trips that drive from origin to destination without using any transit service. Walk-to-Commuter Rail: Trips that use commuter rail (i.e., LIRR, Metro-North, or NJ Transit rail) during some portion of the trip from origin to destination. This includes transitto-commuter rail trips and commuter rail-to-transit trips where automobile is not used to access public transportation. Drive-to-Commuter Rail: Trips that use commuter rail (i.e., LIRR, Metro-North, or NJ Transit rail) during some portion of the trip from origin to destination. This includes transitto-commuter rail trips and commuter rail-to-transit trips where automobile is used to access public transportation. Walk-to-Transit (No Commuter Rail Use): Trips that use transit (subway, bus, PATH, ferry, or light rail transit) during some portion of the trip from origin to destination but do not use commuter rail (these trips would be characterized as commuter rail trips). This includes transit trips where automobile is not used to access public transportation. Drive-to-Transit (No Commuter Rail Use): Trips that use transit (subway, bus, PATH, ferry, or light rail transit) during some portion of the trip from origin to destination but do not use commuter rail (these trips would be characterized as commuter rail trips). This includes transit trips where automobile is used to access public transportation. Taxi: Trips that utilize taxis from origin to destination without using any transit service. Walk: Trips that utilize walk only from origin to destination without using any transit service. Ferry: Trips that utilize ferry from origin to destination without using any other transit services. Improvements such as the Second Avenue Subway change the relative attractiveness of these modes and result in mode shifts. D.1-15
17 Second Avenue Subway SDEIS E. ASSIGNMENT OF FUTURE TRIPS TRANSIT ASSIGNMENTS The primary objective of the modeling is to forecast the number of transit passengers that will use the various subway and bus routes in the study area during the peak hour. The trip assignment model does this by using passenger trip forecasts with origins and destinations and the simulation of subway and bus routes to determine the most likely routes to be used in the future. Out of the six transit trip assignment methods available in TransCAD, NYCT choose to use Stochastic User Equilibrium (SUE). This method accounts for two key characteristics of the subway system: peak hour crowding and the availability of two or more similar route choices in many corridors. To perform an SUE transit assignment it is necessary to specify both congestion parameters and random error terms as shown in Table D.1-4. where: Table D.1-4 Stochastic User Equilibrium Transit Trip Assignment Model cost t = cost o [1 + A(V t-1 /C) B ] Cost is the combined measure of the cost of the fare and the time required to make a trip, and: cost t = Adjusted link cost cost o = free flow link cost C = Practical capacity of a link V t-1 = volume on the link after the prior increment is loaded A = 0.15 or other value set by user B = 3.5 or other value set by user At each iteration, adding a random component further modifies the link cost. This random component is the product of a random number (chosen from the Gumbel distribution) times user specified error terms. The terms used are as follows: Error term Value Link = 5% Headway = 5% The user equilibrium feature distributes passenger trips between a particular origin and destination to different paths when crowding on part of the path increases beyond practical capacity. The stochastic feature produces assignment results that accurately reflect behavioral responses of passengers to perceived differences in waiting or travel time on one route compared to another. This results in an assignment in which many reasonable paths may be used for each origin and destination pair even when congestion is not an issue. The final step in the modeling process was the assignment of transit trips between an origin zone and a destination zone a process that considers each possible route in the network. The trip assignment process includes the following steps: D.1-16
18 Appendix D.1: Transportation Ridership Modeling The shortest path between two zones is determined based upon the minimum combination of fare and time including walking, waiting, and transferring. In recognition that people perceive their travel time differently depending on whether they are walking or waiting, the model weights walking and transferring times by a factor of 1.50 and waiting time by a factor of Capacity constraints to the subway route are applied by adding travel time when passengers per scheduled subway train exceed service guideline capacity by 15 percent or more. This reflects the fact that as average loadings exceed capacity, station dwell times increase and on-time performance declines and passengers choose not to board very crowded trains. The constraint value is set at 15 percent above guideline capacities to account for situations, such as on the Lexington Avenue Line, where additional trains cannot be added to meet demand and passengers are willing to squeeze into crowded cars. Average waiting times are estimated as headways (the time between arriving trains) divided by two. Approximate combined headways are estimated for cases where two or more routes serve the same corridor. The transit model distributes passenger trips between a particular origin zone and destination zone to different paths when crowding on part of the path increases beyond practical capacity. A stochastic (random error) feature is included to account for choices between similar paths. This feature produces assignment results that more accurately reflect behavioral responses of passengers to perceived differences in waiting or travel time on one route compared with another. This results in an assignment in which many reasonable paths may be used for each origin-destination pair, even when congestion is not an issue. For each of the alternatives tested, the transit model assignment process forecast ridership for each portion of the transit system. F. VALIDATION AND CALIBRATION OF TRIP ASSIGNMENTS Validation and calibration are basic steps required to ensure that the model contains no errors and that it provides ridership by line estimates that are reasonably close to actual counts of passengers on trains at specific locations. Procedures are used to check for errors include: The GIS in TransCAD enables all components of the model including route coding to be observed as a map on a PC screen. This visual checking is used for troubleshooting as well as for continuous quality control. Shortest path routines are used to test for illogical paths between two points on a route that may indicate a coding error Running transit trip assignments for the entire system and analyzing the results compared to counts and other measures of actual train and bus loading Calibration follows validation and focuses on the response of the model to actual or proposed service changes. A model s ridership projections should be reasonably close to actual ridership changes or demonstrate logical responses to proposed service changes. NYCT s TDFM has produced accurate line-by-line ridership forecasts for completed projects including the 63rd Street-Queens Boulevard Connection and the Williamsburg Bridge and Lenox Avenue Line reconstruction projects. Numerous proposed projects have been coded into the model and tested for reasonableness, e.g., changes in headways and travel times on the D.1-17
19 Second Avenue Subway SDEIS Lexington Avenue Line, restoration of full service on the Manhattan Bridge and new transfer passageways at the Broadway-Lafayette St-Bleecker St and Jay St-Lawrence St station pairs. Both validation and calibration are limited by the accuracy of the input demand information, i.e., the trip table. The 1990 Census based trip table has proved to be generally reliable but it has gone through several interim updates and a complete update cannot be done until the 2000 Census journey-to-work data is released next year. This Census based trip table is a zone-to-zone trip table. NYCT has developed another source of origin and destination data, the MetroCard fare system. This MetroCard based trip table is a subway station-to-subway station trip table. MetroCard based origin and destination data is derived from MetroCard transaction records that include the card s serial number, the time the card was used and the ID number of the subway turnstile or bus. Sorting these records by serial number and time produces a sequential list of the stations or buses where the card was used during the course of a day. This information provides the location where each trip begins (trip origins) and the sequence of the transactions provides the information needed to impute the trip destinations. Analysis of NYMTC home interview survey data showed that trip destinations could be imputed from the sequence of trip origins as follows 1 : A high percentage of a person s trips begin at the station where the previous trip ended and; A high percentage of a person s last trip of the day ends at the station where the first trip of the day began Using this methodology, an AM peak trip table was produced using MetroCard transaction records for a weekday in September, This trip table is a station-to-station trip table which means that the stations used is known which is an advantage for calibration. In the zone-to-zone Census based trip table the model chooses the stations used for each trip. The MetroCard based trip table was used in the same model as the zone-to-zone trip table except that only the subway system was used. Since the subway trip input to the model is current and based on actual trip information, the results should show accurate loading distributions and peak load point volumes for each line. In the cases where the results looked wrong, further calibration or error checking was conducted. G. RESULTS REPORTING NYCT has developed a standard model run report for the TDFM. This report contains the following tables and charts for documentation and validation as well as for presentation of forecast results: Cover page documenting the name, date and time of the model run, the network and trip table used and key parameter settings for the network and the assignment model Convergence diagram by iteration for validation purposes Service performance (inbound cordon crossings and peak load point summaries) Manhattan Eastside subway ridership summaries Subway boardings, alightings, and leave-loads for each station (by route and direction) 1 Origin and Destination Estimation in New York City Using Automated Fare System Data, James J. Barry, Robert Newhouser, Adam Rahbee, Shermeen Sayeda; presented at the eighth Transportation Research Board Conference on Applications of Transportation Planning Methods, April, 2001 D.1-18
20 Appendix D.1: Transportation Ridership Modeling Subway transfer summaries - Movement table showing passenger volumes transferring to and from subway routes and transfer routes - Diagrams showing detailed transfer diagrams and data tables for key locations - Non-transit link volumes for subway transfer links that are not routes, subway station entrance links, and subway mezzanine links Bus summaries - Bus cordon volumes - Bus peak load point volumes for selected Manhattan routes - On, off, and leave load volumes for selected Manhattan routes. D.1-19
APPENDIX IV MODELLING
 APPENDIX IV MODELLING Kingston Transportation Master Plan Final Report, July 2004 Appendix IV: Modelling i TABLE OF CONTENTS Page 1.0 INTRODUCTION... 1 2.0 OBJECTIVE... 1 3.0 URBAN TRANSPORTATION MODELLING
GIS Analysis of Crenshaw/LAX Line
 PDD 631 Geographic Information Systems for Public Policy, Planning & Development GIS Analysis of Crenshaw/LAX Line Biying Zhao 6679361256 Professor Barry Waite and Bonnie Shrewsbury May 12 th, 2015 Introduction
Mapping Accessibility Over Time
 Journal of Maps, 2006, 76-87 Mapping Accessibility Over Time AHMED EL-GENEIDY and DAVID LEVINSON University of Minnesota, 500 Pillsbury Drive S.E., Minneapolis, MN 55455, USA; geneidy@umn.edu (Received
Traffic Demand Forecast
 Chapter 5 Traffic Demand Forecast One of the important objectives of traffic demand forecast in a transportation master plan study is to examine the concepts and policies in proposed plans by numerically
3.0 ANALYSIS OF FUTURE TRANSPORTATION NEEDS
 3.0 ANALYSIS OF FUTURE TRANSPORTATION NEEDS In order to better determine future roadway expansion and connectivity needs, future population growth and land development patterns were analyzed as part of
Typical information required from the data collection can be grouped into four categories, enumerated as below.
 Chapter 6 Data Collection 6.1 Overview The four-stage modeling, an important tool for forecasting future demand and performance of a transportation system, was developed for evaluating large-scale infrastructure
Integrating Origin and Destination (OD) Study into GIS in Support of LIRR Services and Network Improvements
 Study into GIS in Support of LIRR Services and Network Improvements") Integrating Origin and Destination (OD) Study into GIS in Support of LIRR Services and Network Improvements GIS In Transit Conference, Washington, DC Long Island Rail Road Pyung ho Kim Date: September
Integrating Origin and Destination (OD) Study into GIS in Support of LIRR Services and Network Improvements GIS In Transit Conference, Washington, DC Long Island Rail Road Pyung ho Kim Date: September
BROOKINGS May
 Appendix 1. Technical Methodology This study combines detailed data on transit systems, demographics, and employment to determine the accessibility of jobs via transit within and across the country s 100
Data Collection. Lecture Notes in Transportation Systems Engineering. Prof. Tom V. Mathew. 1 Overview 1
 Data Collection Lecture Notes in Transportation Systems Engineering Prof. Tom V. Mathew Contents 1 Overview 1 2 Survey design 2 2.1 Information needed................................. 2 2.2 Study area.....................................
BxM9. Throgs Neck, Bronx, and Midtown, Manhattan. Between. Express Service. Bus Timetable. Effective Winter MTA Bus Company
 Bus Timetable Effective Winter 2019 MTA Bus Company BxM9 Express Service Between Throgs Neck, Bronx, and Midtown, Manhattan If you think your bus operator deserves an Apple Award our special recognition
Study Overview. the nassau hub study. The Nassau Hub
 Livable Communities through Sustainable Transportation the nassau hub study AlternativeS analysis / environmental impact statement The Nassau Hub Study Overview Nassau County has initiated the preparation
GIS BASED ANALYSIS OF EXPRESS VS LOCAL STATIONS ON SURROUNDING LAND USES IN NEW YORK CITY
 GIS BASED ANALYSIS OF EXPRESS VS LOCAL STATIONS ON SURROUNDING LAND USES IN NEW YORK CITY GIS in Transit Conference, Washington D.C Date: September 2, 2015 1 Subrina Rahman Supervised by Dr. Candace Brakewood
Prepared for: San Diego Association Of Governments 401 B Street, Suite 800 San Diego, California 92101
 Activity-Based Travel Model Validation for 2012 Using Series 13 Data: Coordinated Travel Regional Activity Based Modeling Platform (CT-RAMP) for San Diego County Prepared for: San Diego Association Of
I. M. Schoeman North West University, South Africa. Abstract
 Urban Transport XX 607 Land use and transportation integration within the greater area of the North West University (Potchefstroom Campus), South Africa: problems, prospects and solutions I. M. Schoeman
Travel Time Calculation With GIS in Rail Station Location Optimization
 Travel Time Calculation With GIS in Rail Station Location Optimization Topic Scope: Transit II: Bus and Rail Stop Information and Analysis Paper: # UC8 by Sutapa Samanta Doctoral Student Department of
Appendixx C Travel Demand Model Development and Forecasting Lubbock Outer Route Study June 2014
 Appendix C Travel Demand Model Development and Forecasting Lubbock Outer Route Study June 2014 CONTENTS List of Figures-... 3 List of Tables... 4 Introduction... 1 Application of the Lubbock Travel Demand
Metrolinx Transit Accessibility/Connectivity Toolkit
 Metrolinx Transit Accessibility/Connectivity Toolkit Christopher Livett, MSc Transportation Planning Analyst Research and Planning Analytics Tweet about this presentation #TransitGIS OUTLINE 1. Who is
URBAN TRANSPORTATION SYSTEM (ASSIGNMENT)
") BRANCH : CIVIL ENGINEERING SEMESTER : 6th Assignment-1 CHAPTER-1 URBANIZATION 1. What is Urbanization? Explain by drawing Urbanization cycle. 2. What is urban agglomeration? 3. Explain Urban Class Groups.
BRANCH : CIVIL ENGINEERING SEMESTER : 6th Assignment-1 CHAPTER-1 URBANIZATION 1. What is Urbanization? Explain by drawing Urbanization cycle. 2. What is urban agglomeration? 3. Explain Urban Class Groups.
StanCOG Transportation Model Program. General Summary
 StanCOG Transportation Model Program Adopted By the StanCOG Policy Board March 17, 2010 What are Transportation Models? General Summary Transportation Models are technical planning and decision support
BxM9. Throgs Neck, Bronx, and Midtown, Manhattan. Between. Express Service. Bus Timetable. Effective Winter MTA Bus Company
 Bus Timetable Effective Winter 2018 MTA Bus Company BxM9 Express Service Between Throgs Neck, Bronx, and Midtown, Manhattan If you think your bus operator deserves an Apple Award our special recognition
Forecasts from the Strategy Planning Model
 Forecasts from the Strategy Planning Model Appendix A A12.1 As reported in Chapter 4, we used the Greater Manchester Strategy Planning Model (SPM) to test our long-term transport strategy. A12.2 The origins
Simplified Trips-on-Project Software (STOPS): Strategies for Successful Application
: Strategies for Successful Application") Simplified Trips-on-Project Software (STOPS): Strategies for Successful Application presented to Transit Committee Florida Model Task Force presented by Cambridge Systematics, Inc. John (Jay) Evans, AICP
Simplified Trips-on-Project Software (STOPS): Strategies for Successful Application presented to Transit Committee Florida Model Task Force presented by Cambridge Systematics, Inc. John (Jay) Evans, AICP
HORIZON 2030: Land Use & Transportation November 2005
 PROJECTS Land Use An important component of the Horizon transportation planning process involved reviewing the area s comprehensive land use plans to ensure consistency between them and the longrange transportation
Transportation Models and Data Initiative
 New York Metropolitan Transportation Council The Metropolitan Planning Organization Transportation Models and Data Initiative Technical Memorandum Tasks 11.4 Development of Best Practice Regional Zone
Shutdown: NYCT s Extreme Weather Strategy for Safety and Recovery
 Shutdown: NYCT s Extreme Weather Strategy for Safety and Recovery Larry Gould Senior Director, Operations Analysis New York City Transit 0 NYCT Subway: 5.3 Million Riders Daily 468 stations 660 track miles
Figure 8.2a Variation of suburban character, transit access and pedestrian accessibility by TAZ label in the study area
 Figure 8.2a Variation of suburban character, transit access and pedestrian accessibility by TAZ label in the study area Figure 8.2b Variation of suburban character, commercial residential balance and mix
California Urban Infill Trip Generation Study. Jim Daisa, P.E.
 California Urban Infill Trip Generation Study Jim Daisa, P.E. What We Did in the Study Develop trip generation rates for land uses in urban areas of California Establish a California urban land use trip
ONE REGION: PLANNING FOR A STRONG AND JUST METROPOLIS. NYLON # 14: Regional Planning. October 31, 2018
 DRAFT ONE REGION: PLANNING FOR A STRONG AND JUST METROPOLIS NYLON # 14: Regional Planning October 31, 2018 Carolyn Grossman Meagher, Director, Regional Planning Division the New Yorker March 1976. A New
INSTITUTE OF POLICY AND PLANNING SCIENCES. Discussion Paper Series
 INSTITUTE OF POLICY AND PLANNING SCIENCES Discussion Paper Series No. 1102 Modeling with GIS: OD Commuting Times by Car and Public Transit in Tokyo by Mizuki Kawabata, Akiko Takahashi December, 2004 UNIVERSITY
BxM9. Between Throgs Neck, Bronx, and Midtown, Manhattan. Special Schedule. The Day After Thanksgiving Martin Luther King Day.
 Special Bus Timetable Effective 2018 MTA Bus Company Special Schedule The Day After Thanksgiving Martin Luther King Day BxM9 Express Service Between Throgs Neck, Bronx, and Midtown, Manhattan If you think
2015 Grand Forks East Grand Forks TDM
 GRAND FORKS EAST GRAND FORKS 2015 TRAVEL DEMAND MODEL UPDATE DRAFT REPORT To the Grand Forks East Grand Forks MPO October 2017 Diomo Motuba, PhD & Muhammad Asif Khan (PhD Candidate) Advanced Traffic Analysis
Background and Planning Context 1.1 INTRODUCTION 1.2 PROJECT LOCATION
 Chapter 1: Background and Planning Context 1.1 INTRODUCTION Metro-North Commuter Railroad Company ( Metro-North or the Project Sponsor ) is proposing the construction of a new, expanded parking garage
Analyzing the Market Share of Commuter Rail Stations using LEHD Data
 Analyzing the Market Share of Commuter Rail Stations using LEHD Data Using Census Data for Transportation Applications Conference, Irvine, CA October 26, 2011 1. What is the size of Metrolink s commute
Regional Transit Development Plan Strategic Corridors Analysis. Employment Access and Commuting Patterns Analysis. (Draft)
") Regional Transit Development Plan Strategic Corridors Analysis Employment Access and Commuting Patterns Analysis (Draft) April 2010 Contents 1.0 INTRODUCTION... 4 1.1 Overview and Data Sources... 4 1.2
Regional Transit Development Plan Strategic Corridors Analysis Employment Access and Commuting Patterns Analysis (Draft) April 2010 Contents 1.0 INTRODUCTION... 4 1.1 Overview and Data Sources... 4 1.2
Case Study: Orange County, California. Overview. Context
 Case Study: Orange County, California Overview The Orange County Transportation Authority (OCTA) provides transit service in a generally automobile-oriented part of southern California. Consequently, OCTA
TRAVEL DEMAND MODEL. Chapter 6
 Chapter 6 TRAVEL DEMAND MODEL As a component of the Teller County Transportation Plan development, a computerized travel demand model was developed. The model was utilized for development of the Transportation
Transit Time Shed Analyzing Accessibility to Employment and Services
 Transit Time Shed Analyzing Accessibility to Employment and Services presented by Ammar Naji, Liz Thompson and Abdulnaser Arafat Shimberg Center for Housing Studies at the University of Florida www.shimberg.ufl.edu
Urban Planning Word Search Level 1
 Urban Planning Word Search Level 1 B C P U E C O S Y S T E M P A R E U O E U R B A N P L A N N E R T N S T D H E C O U N T Y G E R E R D W R E N I C I T Y C O U N C I L A A A S U G G C I L A G P R I R
Alternatives Analysis
 Alternatives Analysis Prepared for: Metropolitan Atlanta Rapid Transit Authority Prepared by: AECOM/Jacobs-JJG Joint Venture Atlanta, GA November 2012 Page Left Intentionally Blank ii TABLE OF CONTENTS
Encapsulating Urban Traffic Rhythms into Road Networks
 Encapsulating Urban Traffic Rhythms into Road Networks Junjie Wang +, Dong Wei +, Kun He, Hang Gong, Pu Wang * School of Traffic and Transportation Engineering, Central South University, Changsha, Hunan,
TRAFFIC FORECAST METHODOLOGY
 CHAPTER 5 TRAFFIC FORECAST METHODOLOGY Introduction Need for County-Level Traffic Forecasting 2030 HC-TSP Model Methodology Model Calibration Future Traffic Forecasts Hennepin County Transportation Systems
A Simplified Travel Demand Modeling Framework: in the Context of a Developing Country City
 A Simplified Travel Demand Modeling Framework: in the Context of a Developing Country City Samiul Hasan Ph.D. student, Department of Civil and Environmental Engineering, Massachusetts Institute of Technology,
Cipra D. Revised Submittal 1
 Cipra D. Revised Submittal 1 Enhancing MPO Travel Models with Statewide Model Inputs: An Application from Wisconsin David Cipra, PhD * Wisconsin Department of Transportation PO Box 7913 Madison, Wisconsin
Bus Timetable Effective September Local service between Morris Heights and Fort Schuyler (Bx40) or Throgs Neck (Bx42)
 or Throgs Neck (Bx42)") Bus Timetable Effective September 2004 Bx40/Bx42 Local service between Morris Heights and Fort Schuyler (Bx40) or Throgs Neck (Bx42) A new schedule is in effect as of March 12, 2006 and will be posted
Bus Timetable Effective September 2004 Bx40/Bx42 Local service between Morris Heights and Fort Schuyler (Bx40) or Throgs Neck (Bx42) A new schedule is in effect as of March 12, 2006 and will be posted
Changes in the Spatial Distribution of Mobile Source Emissions due to the Interactions between Land-use and Regional Transportation Systems
 Changes in the Spatial Distribution of Mobile Source Emissions due to the Interactions between Land-use and Regional Transportation Systems A Framework for Analysis Urban Transportation Center University
III. FORECASTED GROWTH
 III. FORECASTED GROWTH In order to properly identify potential improvement projects that will be required for the transportation system in Milliken, it is important to first understand the nature and volume
Summary. Purpose of the project
 Summary Further development of the market potential model for Oslo and Akershus (MPM23 V2.0) TØI Report 1596/2017 Authors: Stefan Flügel and Guri Natalie Jordbakke Oslo 2017 37 pages Norwegian language
Trip Generation Model Development for Albany
 Trip Generation Model Development for Albany Hui (Clare) Yu Department for Planning and Infrastructure Email: hui.yu@dpi.wa.gov.au and Peter Lawrence Department for Planning and Infrastructure Email: lawrence.peter@dpi.wa.gov.au
CIV3703 Transport Engineering. Module 2 Transport Modelling
 CIV3703 Transport Engineering Module Transport Modelling Objectives Upon successful completion of this module you should be able to: carry out trip generation calculations using linear regression and category
Updating the Urban Boundary and Functional Classification of New Jersey Roadways using 2010 Census data
 Updating the Urban Boundary and Functional Classification of New Jersey Roadways using 2010 Census data By: Glenn Locke, GISP, PMP 1 GIS-T May, 2013 Presentation Overview Purpose of Project Methodology
Analysis and Design of Urban Transportation Network for Pyi Gyi Ta Gon Township PHOO PWINT ZAN 1, DR. NILAR AYE 2
 www.semargroup.org, www.ijsetr.com ISSN 2319-8885 Vol.03,Issue.10 May-2014, Pages:2058-2063 Analysis and Design of Urban Transportation Network for Pyi Gyi Ta Gon Township PHOO PWINT ZAN 1, DR. NILAR AYE
Adapting an Existing Activity Based Modeling Structure for the New York Region
 Adapting an Existing Activity Based Modeling Structure for the New York Region presented to 2018 TRB Innovations in Travel Modeling Conference Attendees presented by Rachel Copperman Jason Lemp with Thomas
Metro Emergency Security Operations Center (ESOC) 410 Center Street City of Los Angeles
 410 Center Street City of Los Angeles") Metro Emergency Security Operations Center (ESOC) 410 Center Street City of Los Angeles Traffic Study August 31, 2015 AECOM 515 South Flower Street, 4 th Floor Los Angeles, CA 90071 Job Number: 60323255
Metro Emergency Security Operations Center (ESOC) 410 Center Street City of Los Angeles Traffic Study August 31, 2015 AECOM 515 South Flower Street, 4 th Floor Los Angeles, CA 90071 Job Number: 60323255
Bus Routes, New York NY, August 2017
 Page 1 of 6 Metadata format: ISO 19139 Bus Routes, New York NY, August 2017 ISO 19139 metadata content Resource Identification Information Spatial Representation Information Reference System Information
Greater Toronto Area Cordon Count Summary Analysis of Traffic Trends 1985 to 2011
 Greater Toronto Area Cordon Count Summary Analysis of Traffic Trends 1985 to 2011 Prepared by: Data Management Group Department of Civil Engineering University of Toronto Telephone: (416) 978-3916 Table
Forecasts for the Reston/Dulles Rail Corridor and Route 28 Corridor 2010 to 2050
 George Mason University Center for Regional Analysis Forecasts for the Reston/Dulles Rail Corridor and Route 28 Corridor 21 to 25 Prepared for the Fairfax County Department of Planning and Zoning Lisa
INCORPORATING URBAN DESIGN VARIABLES IN METROPOLITAN PLANNING ORGANIZATIONS TRAVEL DEMAND MODELS
 INCORPORATING URBAN DESIGN VARIABLES IN METROPOLITAN PLANNING ORGANIZATIONS TRAVEL DEMAND MODELS RONALD EASH Chicago Area Transportation Study 300 West Adams Street Chicago, Illinois 60606 Metropolitan
Exploring Human Mobility with Multi-Source Data at Extremely Large Metropolitan Scales. ACM MobiCom 2014, Maui, HI
 Exploring Human Mobility with Multi-Source Data at Extremely Large Metropolitan Scales Desheng Zhang & Tian He University of Minnesota, USA Jun Huang, Ye Li, Fan Zhang, Chengzhong Xu Shenzhen Institute
Economic Geography of the Long Island Region
 Geography of Data Economic Geography of the Long Island Region Copyright 2011 AFG 1 The geography of economic activity requires: - the gathering of spatial data - the location of data geographically -
Regional Performance Measures
 G Performance Measures Regional Performance Measures Introduction This appendix highlights the performance of the MTP/SCS for 2035. The performance of the Revenue Constrained network also is compared to
Coordinated Transit and Land Use Planning in the Region of Waterloo
 Coordinated Transit and Land Use Planning in the Region of Waterloo Jeffrey M. Casello University of Waterloo Kevin Curtis Graham Vincent Region of Waterloo Transportation Research Board Best Practices:
2040 MTP and CTP Socioeconomic Data
 SE Data 6-1 24 MTP and CTP Socioeconomic Data Purpose of Socioeconomic Data The socioeconomic data (SE Data) shows the location of the population and employment, median household income and other demographic
Lecture 19: Common property resources
 Lecture 19: Common property resources Economics 336 Economics 336 (Toronto) Lecture 19: Common property resources 1 / 19 Introduction Common property resource: A resource for which no agent has full property
APPENDIX G Halton Region Transportation Model
 APPENDIX G Halton Region Transportation Model Halton Region Transportation Master Plan Working Paper No. 1 - Legislative Context Working Paper No. 2 - Active Transportation Halton Transportation Model
Expanding the GSATS Model Area into
 Appendix A Expanding the GSATS Model Area into North Carolina Jluy, 2011 Table of Contents LONG-RANGE TRANSPORTATION PLAN UPDATE 1. Introduction... 1 1.1 Background... 1 1.2 Existing Northern Extent of
City of Hermosa Beach Beach Access and Parking Study. Submitted by. 600 Wilshire Blvd., Suite 1050 Los Angeles, CA
 City of Hermosa Beach Beach Access and Parking Study Submitted by 600 Wilshire Blvd., Suite 1050 Los Angeles, CA 90017 213.261.3050 January 2015 TABLE OF CONTENTS Introduction to the Beach Access and Parking
Regional Performance Measures
 G Performance Measures Regional Performance Measures Introduction This appendix highlights the performance of the MTP/SCS for 2035. The performance of the Revenue Constrained network also is compared to
Preliminary Analysis. Commuter Parking Requirements
 Preliminary Analysis of Commuter Parking Requirements GREAT NECK PARK DISTRICT Board of Commissioners Robert A. Lincoln, Jr., Daniel M. Nachmanoff Frank S. Cilluffo Superintendent Jason R. Marra March,
COMBINATION OF MACROSCOPIC AND MICROSCOPIC TRANSPORT SIMULATION MODELS: USE CASE IN CYPRUS
 International Journal for Traffic and Transport Engineering, 2014, 4(2): 220-233 DOI: http://dx.doi.org/10.7708/ijtte.2014.4(2).08 UDC: 656:519.87(564.3) COMBINATION OF MACROSCOPIC AND MICROSCOPIC TRANSPORT
STILLORGAN QBC LEVEL OF SERVICE ANALYSIS
 4-5th September, STILLORGAN QBC LEVEL OF SERVICE ANALYSIS Mr David O Connor Lecturer Dublin Institute of Technology Mr Philip Kavanagh Graduate Planner Dublin Institute of Technology Abstract Previous
6 th Line Municipal Class Environmental Assessment
 6 th Line Municipal Class Environmental Assessment County Road 27 to St John s Road Town of Innisfil, ON September 6, 2016 APPENDIX L: TRAVEL DEMAND FORECASTING MEMORANDUM Accessible formats are available
FHWA Peer Exchange Meeting on Transportation Systems Management during Inclement Weather
 Travel Demand Modeling & Simulation at GBNRTC Matt Grabau Kimberly Smith Mike Davis Why Model? Travel modeling is a tool for transportation planners and policy makers, to observe impacts of a transportation
Public Open House Meeting Thursday, February 22, Broken Arrow to Tulsa Mass Transit Feasibility Study
 Public Open House Meeting Thursday, February 22, 2007 Broken Arrow to Tulsa Mass Transit Feasibility Study Meeting Agenda Welcome Where we Are What we ve Learned Corridor Study Map Stations (Commuter Rail
3. THE TRANSPORTATION AND TRANSIT MASTER PLAN
 The Master Plan Report Page 3-1 3. THE TRANSPORTATION AND TRANSIT MASTER PLAN 3.1 The Strategy Through the technical and consultation processes "A Balanced Road and Transit System" has been defined as
TRANSPORTATION MODELING
 TRANSPORTATION MODELING Modeling Concept Model Tools and media to reflect and simple a measured reality. Types of Model Physical Model Map and Chart Model Statistics and mathematical Models MODEL? Physical
Speakers: Jeff Price, Federal Transit Administration Linda Young, Center for Neighborhood Technology Sofia Becker, Center for Neighborhood Technology
 Speakers: Jeff Price, Federal Transit Administration Linda Young, Center for Neighborhood Technology Sofia Becker, Center for Neighborhood Technology Peter Haas, Center for Neighborhood Technology Craig
TRAINING ANNOUNCEMENT. Office of Homeland Security COURSE MGT-310
 TRAINING ANNOUNCEMENT Office of Homeland Security COURSE MGT-310 WMD Threat and Risk Assessment September 12-14, 2007 0800-1600 SUNY Maritime College at Fort Schuyler 6 Pennyfield Avenue Baylis Hall, Throggs
Foreword. Vision and Strategy
 GREATER MANCHESTER SPATIAL FRAMEWORK Friends of Walkden Station Consultation Response January 2017 Foreword Friends of Walkden Station are a group of dedicated volunteers seeking to raise the status and
Environmental Analysis, Chapter 4 Consequences, and Mitigation
 Environmental Analysis, Chapter 4 4.17 Environmental Justice This section summarizes the potential impacts described in Chapter 3, Transportation Impacts and Mitigation, and other sections of Chapter 4,
Bx40/Bx42. Between. Bx40 Morris Heights and Fort Schuyler Bx42 Morris Heights and Throgs Neck. Local Service. Bus Timetable
 Bus Timetable Effective as of September 3, 2017 New York City Transit Bx40/Bx42 Local Service a Between Bx40 Morris Heights and Fort Schuyler Bx42 Morris Heights and Throgs Neck If you think your bus operator
Application of GIS in Public Transportation Case-study: Almada, Portugal
 Case-study: Almada, Portugal Doutor Jorge Ferreira 1 FSCH/UNL Av Berna 26 C 1069-061 Lisboa, Portugal +351 21 7908300 jr.ferreira@fcsh.unl.pt 2 FSCH/UNL Dra. FCSH/UNL +351 914693843, leite.ines@gmail.com
NATHAN HALE HIGH SCHOOL PARKING AND TRAFFIC ANALYSIS. Table of Contents
 Parking and Traffic Analysis Seattle, WA Prepared for: URS Corporation 1501 4th Avenue, Suite 1400 Seattle, WA 98101-1616 Prepared by: Mirai Transportation Planning & Engineering 11410 NE 122nd Way, Suite
SBCAG Travel Model Upgrade Project 3rd Model TAC Meeting. Jim Lam, Stewart Berry, Srini Sundaram, Caliper Corporation December.
 SBCAG Travel Model Upgrade Project 3rd Model TAC Meeting Jim Lam, Stewart Berry, Srini Sundaram, Caliper Corporation December. 7, 2011 1 Outline Model TAZs Highway and Transit Networks Land Use Database
VHD Daily Totals. Population 14.5% change. VMT Daily Totals Suffolk 24-hour VMT. 49.3% change. 14.4% change VMT
 6.9 Suffolk 6-54 VMT Population and Travel Characteristics Population 14.5% change 2014 1,529,202 VHD Daily Totals 2014 251,060 49.3% change 2040 1,788,175 2040 374,850 VMT Daily Totals 2014 39,731,990
South Western Region Travel Time Monitoring Program Congestion Management Process Spring 2008 Report
 South Western Region Travel Monitoring Program Congestion Management Process Spring 2008 Report Prepared by: South Western Regional Planning Agency 888 Washington Boulevard Stamford, CT 06901 Telephone:
Technical Memorandum #2 Future Conditions
 Technical Memorandum #2 Future Conditions To: Dan Farnsworth Transportation Planner Fargo-Moorhead Metro Council of Governments From: Rick Gunderson, PE Josh Hinds PE, PTOE Houston Engineering, Inc. Subject:
Economic and Social Urban Indicators: A Spatial Decision Support System for Chicago Area Transportation Planning
 Economic and Social Urban Indicators: A Spatial Decision Support System for Chicago Area Transportation Planning Piyushimita Thakuriah (Vonu), P.S. Sriraj, Paul Metaxatos, Inshu Minocha & Tanushri Swarup
Visitor Flows Model for Queensland a new approach
 Visitor Flows Model for Queensland a new approach Jason. van Paassen 1, Mark. Olsen 2 1 Parsons Brinckerhoff Australia Pty Ltd, Brisbane, QLD, Australia 2 Tourism Queensland, Brisbane, QLD, Australia 1
Predicting MTA Bus Arrival Times in New York City
 Predicting MTA Bus Arrival Times in New York City Man Geen Harold Li, CS 229 Final Project ABSTRACT This final project sought to outperform the Metropolitan Transportation Authority s estimated time of
Bus Timetable Effective January BxM9. Throgs Neck. Express service between Throgs Neck, Bronx, and Midtown, Manhattan
 Bus Timetable Effective January 2006 BxM9 Throgs Neck Express service between Throgs Neck, Bronx, and Midtown, Manhattan Fares Express bus fare is $5 (Senior-Disabled fare is $2.50). MetroCard - Pay-Per-Ride
CVS Derwood. Local Area Transportation Review
 CVS Derwood Montgomery County, Maryland May 27, 2016 Local Area Transportation Review Prepared for: JC Bar Properties, Inc. Steve Fleming, PE 415 Fallowfield Road, Suite 301 Camp Hill, Pennsylvania 17011
Regional Snapshot Series: Transportation and Transit. Commuting and Places of Work in the Fraser Valley Regional District
 Regional Snapshot Series: Transportation and Transit Commuting and Places of Work in the Fraser Valley Regional District TABLE OF CONTENTS Complete Communities Daily Trips Live/Work Ratio Commuting Local
ROUNDTABLE ON SOCIAL IMPACTS OF TIME AND SPACE-BASED ROAD PRICING Luis Martinez (with Olga Petrik, Francisco Furtado and Jari Kaupilla)
") ROUNDTABLE ON SOCIAL IMPACTS OF TIME AND SPACE-BASED ROAD PRICING Luis Martinez (with Olga Petrik, Francisco Furtado and Jari Kaupilla) AUCKLAND, NOVEMBER, 2017 Objective and approach (I) Create a detailed
ROUNDTABLE ON SOCIAL IMPACTS OF TIME AND SPACE-BASED ROAD PRICING Luis Martinez (with Olga Petrik, Francisco Furtado and Jari Kaupilla) AUCKLAND, NOVEMBER, 2017 Objective and approach (I) Create a detailed
THE FUTURE OF FORECASTING AT METROPOLITAN COUNCIL. CTS Research Conference May 23, 2012
 THE FUTURE OF FORECASTING AT METROPOLITAN COUNCIL CTS Research Conference May 23, 2012 Metropolitan Council forecasts Regional planning agency and MPO for Twin Cities metropolitan area Operates regional
Express Bus Stops, New York NY, Nov 2018
 Metadata format: ISO 19139 Express Bus Stops, New York NY, Nov 2018 ISO 19139 metadata content Resource Identification Information Spatial Representation Information Reference System Information Data Quality
High Speed / Commuter Rail Suitability Analysis For Central And Southern Arizona
 High Speed / Commuter Rail Suitability Analysis For Central And Southern Arizona Item Type Reports (Electronic) Authors Deveney, Matthew R. Publisher The University of Arizona. Rights Copyright is held
Tier 2 Final Environmental Assessment I-66 Transportation Technical Report. Appendix E. Travel Demand Forecasting Model Validation Memorandum
 Tier 2 Final Environmental Assessment I-66 Transportation Technical Report Appendix E Travel Demand Forecasting Model Validation Memorandum FINAL AUGUST 216 MEMORANDUM To: Robert Josef, VDOT Northern Virginia
Appendix B. Land Use and Traffic Modeling Documentation
 Appendix B Land Use and Traffic Modeling Documentation Technical Memorandum Planning Level Traffic for Northridge Sub-Area Study Office of Statewide Planning and Research Modeling & Forecasting Section
Subway Station Entrances, New York NY, May 2016
 Page 1 of 6 Metadata format: ISO 19139 Subway Station Entrances, New York NY, May 2016 ISO 19139 metadata content Resource Identification Information Spatial Representation Information Reference System
final report A Recommended Approach to Delineating Traffic Analysis Zones in Florida Florida Department of Transportation Systems Planning Office
 A Recommended Approach to Delineating Traffic Analysis Zones in Florida final report prepared for Florida Department of Transportation Systems Planning Office September 27, 2007 final report A Recommended