TRANSPORTATION MODELING
|
|
|
- Felicia Hodges
- 6 years ago
- Views:
Transcription


1 TRANSPORTATION MODELING


2 Modeling Concept Model Tools and media to reflect and simple a measured reality. Types of Model Physical Model Map and Chart Model Statistics and mathematical Models MODEL?

3 Physical Model

4 Map Model (Desire Line)
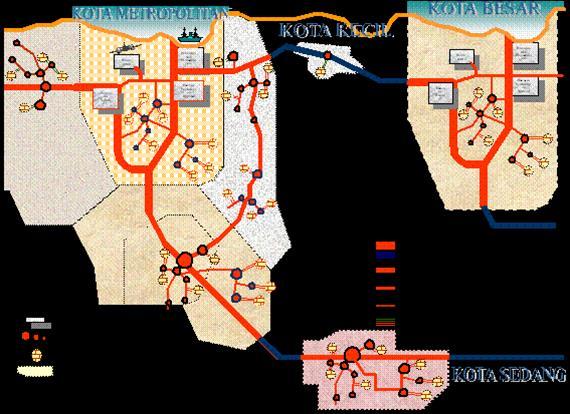
5 Map Model

6 Chart Model

7 Chart Model

8 Statistic and Mathematical Models
9 What is the final goal of designing model? What is variables considered? What is variables that influenced and arranged by planner? What is the theory? How grouping model level? How the role of time? What kind of data that available? How about the calibration and validity?
10 Objectives Help to understanding how the system working Predicted the changes in land use and transport infrastructure system The main variables Land Use Transportation Infrastructure System Traffic flow Parameters that can be set Land Use RTRW, RDTRK, etc. Transportation Infrastructure Tatranas, Tatrawil, Tatralok, etc.
11 Theory/ Concept Accessibility Generated and Attracted Trip Trip Distribution Mode choice Route choice Dynamic Traffic Flow Grouping Level Areas? Combining and Grouping traffic flow? Time Static Model Dynamic Model

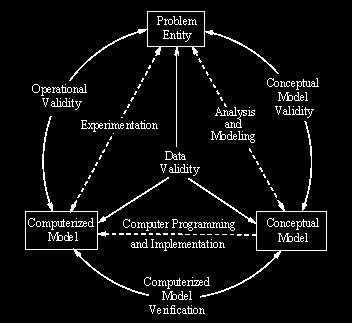
12 Scope Mathematical, statistical, operational research, programming Data Quantity Quality Calibration and Validation Calibration : process of assessing the parameter value of a model with various techniques (numerical analysis, linear algebra, optimization, etc.) Validation : expected models with calibrated parameters before it produce the same output with reality (data) forecasting future Modification : Reduction or addition of several variables suit for the applications in the area or another condition.
13 Determination of the study area Study area divided into several zones, numbers and areas depend on level of accuracy expected The Outside of study area divided into several external zones to reflect the other zones
14 System activities simplified in the zone form and considered to represented by the central zone Internal Zone the zone that located in studies area have major contribution to the movement that occurred External Zone the zone that located outside study area have small contribution to movement occurred Central Zone virtual point that representing the center activity zone, the beginning and the ending of the movement to another zone
15 Network system that simplified in road and joint form Road segment or railway network, etc. The segment must have information of road conditions Node intersection, station, city, etc. Activity and Network systems was connected with central zone Central Zone Link virtual segment that connected to the central zone (activity system) by a node (network system)
16 1 2 Internal Zone Central Zone 4 3 Border Study Study area 5 6
17 gateway Road Node Border area Study area
18 Zone center link Border area Study area 5 6
19
20 Combined Cost Concept Combining three main components of route choice (Distance, cost, time) Combined cost of private cars Gcp = yd + utv + C Where : Gcp = Combined cost for PC (Rp) y = Operating vehicle cost per unit distance (Rp/km) C = parking cost, toll, etc.
21 Combined cost for public transport: G cu = fd + u T a + u T w + u T v + d Where : Gcu D Ta Tw Tv minutes) f u d = Combined cost for PT (Rp) = Distance (distance unit, e.g : km) = walking time (time unit, e.g: minutes) = waiting time PT (time unit, e.g: minutes) = time in public transportation (time unit, e.g: = cost per distance (Rp/km) = time value per unit time (Rp/minutes) = surcharge unmeasured
22 A Simple Model of Land Use / Transport System Objectives: Help to understand how the transportation system works Predict the changes in traffic flows which will result from changes to land use or to the transport system Variables: Land Use System : population and employment Transport system : Distance, Travel time Traffic System
23 Notasi: L A,B P A A B = Land Use in Zone A, B = Traffic Generation from zone A = Traffic Attraction to zone B Q AB(1) = Traffic from zone A to zone B using route 1 T Q AB(1) = Travel time from zone A to zone B using in traffic condition is Q T 0 = Travel time in free-flow traffic = 0 C = Road capacity a = Level of Service index
24 Traffic Generation P A = f (L A ) A B = f (L B ) Traffic Distribution Q AB = P A.A B.k T QAB Mode and Route Choice T QAB(1) = T QAB(2)
25 Activity system : Zone Land Use Population Information A Residential % working age B Employment area Transport characteristic: Route Length (km) To (min.) Los Index (a) Capacity (veh/h) , , , Traffic Distribution Q AB = P A.A B.0,001 T QAB
26 1. The amount of traffic from zone A to zone B if only route 1 that operated? 2. The amount of traffic from zone A to zone B if only route 2 that operated? 3. The amount of traffic from zone A to zone B if route 1 and 2 operating together? 4. The amount of traffic if adding a new road 3 and route 1,2, and 3 are operated together? 5. The amount of traffic if there are changes in residential population become and employment population ?
27 Solution Demand Equation: Q AB = x x 0,001 T QAB = T QAB
28 Supply Equation: Route 1: Route 2: Route 3: T QAB(1) = 25 x ( Q AB(1) ) Q AB(1) T QAB(2) = 40 x Q AB(2) T QAB(3) = 20 x ( Q AB(3) ) Q AB(3)
29 Analytical method If only route 1 that operated: T QAB(1) = Then: Q AB(1) ( Q AB(1) ) x Q AB(1) = (3.000 Q AB(1) ) x Q 2 AB(1) Q AB(1) = 0 Q AB(1) = Q AB(1) = (>>C 1 ) Q AB(1) = veh/h T QAB(1) = 137,2 minutes
30 If only route 2 that operated: T QAB(2) = Q AB(2) x Q AB(2) = (2.000 Q AB(2) ) x Q AB(2) = 0 Q AB(2) = veh/h T QAB(2) = 229 minutes
31 If route 1+2 operating together: Limit 1: Q AB = Q AB(1) + Q AB(2) Limit 2: T QAB = T QAB(1) = T QAB(2) Equal condition 1 and 2: T QAB = = Q AB Q AB(1) +Q AB(2) (1)
32 Equ.(1) Limit 2: T QAB = T QAB(2) = Q AB(1) +Q AB(2) Q AB(2) Q AB(2) = Q AB(1) Q AB(2) Q AB(1) = ,725 Q AB(2) (2)
33 Limit 2: T QAB(1) = T QAB(2) QAB(1) = Q AB(1) Q AB(2) Q AB(2) Q AB(1) 15Q AB(1) Q AB(2) = Q AB(1) Q AB(1) 15Q AB(1) Q AB(2) Q AB(2) = (2)
34 Substitution (1) to (2): ( ,725 Q AB(2) ) 15 ( ,725 Q AB(2) ) Q AB(2) Q AB(2) = ,875Q AB(2) Q AB(2) = 0 (3) Obtainable: Q AB(2) = Q AB(2) = (-, impossible) Then : Q AB(2) = veh/h T QAB(2) = 98,675 mins. Q AB(1) = veh/h T QAB(1) = 98,675 mins. Q AB = veh/h T QAB = 98,675 mins.
35 If route operating together: Limit 1: Q AB = Q AB(1) + Q AB(2) + Q AB(3) Limit 2: T QAB = T QAB(1) = T QAB(2) = T QAB(3) Limit 1: T QAB = = Q AB Q AB(1) +Q AB(2) +Q AB(3) (1)
36 Graphical method From the equation demand and supply, input value of Q AB to obtain value of T QAB, T QAB(1), T QAB(2) or T QAB(3) Plot the value of Q AB and T QAB, to obtain the demand curve Plot the value of Q AB and T QAB(1), T QAB(2) or T QAB(3) to obtain supply curve route 1, 2 and 3 Cutting point between demand and supply curve is a equilibrium point
37 QAB Demand TQAB 0 ~ Supply QAB TQAB(1) TQAB(2) TQAB(3) ~ ~ ~
38 T (Travel time- minutes) Relationship between Q AB and T QAB Demand Supply 1 Supply 2 Supply 3 0 Q (Vehicle per hour)
39 T (Travel time, minutes) Relationship between Q AB and T QAB Demand Supply 1 Supply 2 Supply 3 Supply 1+2 Supply Q (Vehicle per hour)
40 T (Travel time, minutes) Relationship between Q AB and T QAB Demand Supply 1 Supply 2 Supply 3 Supply 1+2 Supply Demand Baru Q (vehicle per hour)
41 Assignment Transportation Characteristic: Route Length (km) To (minutes) LoS index (a) Capacity (veh/h) , , Another data same with example before
42 Complete with analytical method: 1. The amount of traffic from zone A to zone B if only route 1 that operated? 2. The amount of traffic from zone A to zone B if only route 2 that operated? 3. The amount of traffic from zone A to zone B if route 1 and 2 operating together?
Lecture 19: Common property resources
 Lecture 19: Common property resources Economics 336 Economics 336 (Toronto) Lecture 19: Common property resources 1 / 19 Introduction Common property resource: A resource for which no agent has full property
Traffic Demand Forecast
 Chapter 5 Traffic Demand Forecast One of the important objectives of traffic demand forecast in a transportation master plan study is to examine the concepts and policies in proposed plans by numerically
Typical information required from the data collection can be grouped into four categories, enumerated as below.
 Chapter 6 Data Collection 6.1 Overview The four-stage modeling, an important tool for forecasting future demand and performance of a transportation system, was developed for evaluating large-scale infrastructure
Data Collection. Lecture Notes in Transportation Systems Engineering. Prof. Tom V. Mathew. 1 Overview 1
 Data Collection Lecture Notes in Transportation Systems Engineering Prof. Tom V. Mathew Contents 1 Overview 1 2 Survey design 2 2.1 Information needed................................. 2 2.2 Study area.....................................
URBAN TRANSPORTATION SYSTEM (ASSIGNMENT)
") BRANCH : CIVIL ENGINEERING SEMESTER : 6th Assignment-1 CHAPTER-1 URBANIZATION 1. What is Urbanization? Explain by drawing Urbanization cycle. 2. What is urban agglomeration? 3. Explain Urban Class Groups.
BRANCH : CIVIL ENGINEERING SEMESTER : 6th Assignment-1 CHAPTER-1 URBANIZATION 1. What is Urbanization? Explain by drawing Urbanization cycle. 2. What is urban agglomeration? 3. Explain Urban Class Groups.
Palmerston North Area Traffic Model
 Palmerston North Area Traffic Model Presentation to IPWEA 7 November 2014 PNATM Presentation Overview Model Scope and type Data collected The model Forecasting inputs Applications PNCC Aims and Objectives
Measuring connectivity in London
 Measuring connectivity in London OECD, Paris 30 th October 2017 Simon Cooper TfL City Planning 1 Overview TfL Connectivity measures in TfL PTALs Travel time mapping Catchment analysis WebCAT Current and
Analysis and Design of Urban Transportation Network for Pyi Gyi Ta Gon Township PHOO PWINT ZAN 1, DR. NILAR AYE 2
 www.semargroup.org, www.ijsetr.com ISSN 2319-8885 Vol.03,Issue.10 May-2014, Pages:2058-2063 Analysis and Design of Urban Transportation Network for Pyi Gyi Ta Gon Township PHOO PWINT ZAN 1, DR. NILAR AYE
California Urban Infill Trip Generation Study. Jim Daisa, P.E.
 California Urban Infill Trip Generation Study Jim Daisa, P.E. What We Did in the Study Develop trip generation rates for land uses in urban areas of California Establish a California urban land use trip
APPENDIX IV MODELLING
 APPENDIX IV MODELLING Kingston Transportation Master Plan Final Report, July 2004 Appendix IV: Modelling i TABLE OF CONTENTS Page 1.0 INTRODUCTION... 1 2.0 OBJECTIVE... 1 3.0 URBAN TRANSPORTATION MODELLING
CIV3703 Transport Engineering. Module 2 Transport Modelling
 CIV3703 Transport Engineering Module Transport Modelling Objectives Upon successful completion of this module you should be able to: carry out trip generation calculations using linear regression and category
Development of modal split modeling for Chennai
 IJMTES International Journal of Modern Trends in Engineering and Science ISSN: 8- Development of modal split modeling for Chennai Mr.S.Loganayagan Dr.G.Umadevi (Department of Civil Engineering, Bannari
APPENDIX I: Traffic Forecasting Model and Assumptions
 APPENDIX I: Traffic Forecasting Model and Assumptions Appendix I reports on the assumptions and traffic model specifications that were developed to support the Reaffirmation of the 2040 Long Range Plan.
Network Equilibrium Models: Varied and Ambitious
 Network Equilibrium Models: Varied and Ambitious Michael Florian Center for Research on Transportation University of Montreal INFORMS, November 2005 1 The applications of network equilibrium models are
COMBINATION OF MACROSCOPIC AND MICROSCOPIC TRANSPORT SIMULATION MODELS: USE CASE IN CYPRUS
 International Journal for Traffic and Transport Engineering, 2014, 4(2): 220-233 DOI: http://dx.doi.org/10.7708/ijtte.2014.4(2).08 UDC: 656:519.87(564.3) COMBINATION OF MACROSCOPIC AND MICROSCOPIC TRANSPORT
Appendixx C Travel Demand Model Development and Forecasting Lubbock Outer Route Study June 2014
 Appendix C Travel Demand Model Development and Forecasting Lubbock Outer Route Study June 2014 CONTENTS List of Figures-... 3 List of Tables... 4 Introduction... 1 Application of the Lubbock Travel Demand
Trip Distribution Modeling Milos N. Mladenovic Assistant Professor Department of Built Environment
 Trip Distribution Modeling Milos N. Mladenovic Assistant Professor Department of Built Environment 25.04.2017 Course Outline Forecasting overview and data management Trip generation modeling Trip distribution
Changes in the Spatial Distribution of Mobile Source Emissions due to the Interactions between Land-use and Regional Transportation Systems
 Changes in the Spatial Distribution of Mobile Source Emissions due to the Interactions between Land-use and Regional Transportation Systems A Framework for Analysis Urban Transportation Center University
3.0 ANALYSIS OF FUTURE TRANSPORTATION NEEDS
 3.0 ANALYSIS OF FUTURE TRANSPORTATION NEEDS In order to better determine future roadway expansion and connectivity needs, future population growth and land development patterns were analyzed as part of
The Tyndall Cities Integrated Assessment Framework
 The Tyndall Cities Integrated Assessment Framework Alistair Ford 1, Stuart Barr 1, Richard Dawson 1, Jim Hall 2, Michael Batty 3 1 School of Civil Engineering & Geosciences and Centre for Earth Systems
A Simplified Travel Demand Modeling Framework: in the Context of a Developing Country City
 A Simplified Travel Demand Modeling Framework: in the Context of a Developing Country City Samiul Hasan Ph.D. student, Department of Civil and Environmental Engineering, Massachusetts Institute of Technology,
Public Transport Versus Private Car: GIS-Based Estimation of Accessibility Applied to the Tel Aviv Metropolitan Area
 Public Transport Versus Private Car: GIS-Based Estimation of Accessibility Applied to the Tel Aviv Metropolitan Area Itzhak Benenson 1, Karel Martens 3, Yodan Rofe 2, Ariela Kwartler 1 1 Dept of Geography
Forecasts from the Strategy Planning Model
 Forecasts from the Strategy Planning Model Appendix A A12.1 As reported in Chapter 4, we used the Greater Manchester Strategy Planning Model (SPM) to test our long-term transport strategy. A12.2 The origins
Trip Generation Model Development for Albany
 Trip Generation Model Development for Albany Hui (Clare) Yu Department for Planning and Infrastructure Email: hui.yu@dpi.wa.gov.au and Peter Lawrence Department for Planning and Infrastructure Email: lawrence.peter@dpi.wa.gov.au
GIS Analysis of Crenshaw/LAX Line
 PDD 631 Geographic Information Systems for Public Policy, Planning & Development GIS Analysis of Crenshaw/LAX Line Biying Zhao 6679361256 Professor Barry Waite and Bonnie Shrewsbury May 12 th, 2015 Introduction
2040 MTP and CTP Socioeconomic Data
 SE Data 6-1 24 MTP and CTP Socioeconomic Data Purpose of Socioeconomic Data The socioeconomic data (SE Data) shows the location of the population and employment, median household income and other demographic
City of Johannesburg Department: Development Planning And Urban Management Development Planning and Facilitation
 City of Johannesburg Department: Development Planning And Urban Management Development Planning and Facilitation Marlboro Urban Development Framework: Discussion Document July 2007 1 Prepared for Department
6 th Line Municipal Class Environmental Assessment
 6 th Line Municipal Class Environmental Assessment County Road 27 to St John s Road Town of Innisfil, ON September 6, 2016 APPENDIX L: TRAVEL DEMAND FORECASTING MEMORANDUM Accessible formats are available
Decentralisation and its efficiency implications in suburban public transport
 Decentralisation and its efficiency implications in suburban public transport Daniel Hörcher 1, Woubit Seifu 2, Bruno De Borger 2, and Daniel J. Graham 1 1 Imperial College London. South Kensington Campus,
NATHAN HALE HIGH SCHOOL PARKING AND TRAFFIC ANALYSIS. Table of Contents
 Parking and Traffic Analysis Seattle, WA Prepared for: URS Corporation 1501 4th Avenue, Suite 1400 Seattle, WA 98101-1616 Prepared by: Mirai Transportation Planning & Engineering 11410 NE 122nd Way, Suite
CIE4801 Transportation and spatial modelling Modal split
 CIE4801 Transportation and spatial modelling Modal split Rob van Nes, Transport & Planning 31-08-18 Delft University of Technology Challenge the future Content Nested logit part 2 Modelling component 3:
ROUNDTABLE ON SOCIAL IMPACTS OF TIME AND SPACE-BASED ROAD PRICING Luis Martinez (with Olga Petrik, Francisco Furtado and Jari Kaupilla)
") ROUNDTABLE ON SOCIAL IMPACTS OF TIME AND SPACE-BASED ROAD PRICING Luis Martinez (with Olga Petrik, Francisco Furtado and Jari Kaupilla) AUCKLAND, NOVEMBER, 2017 Objective and approach (I) Create a detailed
ROUNDTABLE ON SOCIAL IMPACTS OF TIME AND SPACE-BASED ROAD PRICING Luis Martinez (with Olga Petrik, Francisco Furtado and Jari Kaupilla) AUCKLAND, NOVEMBER, 2017 Objective and approach (I) Create a detailed
transportation research in policy making for addressing mobility problems, infrastructure and functionality issues in urban areas. This study explored
 ABSTRACT: Demand supply system are the three core clusters of transportation research in policy making for addressing mobility problems, infrastructure and functionality issues in urban areas. This study
TRAVEL DEMAND MODEL. Chapter 6
 Chapter 6 TRAVEL DEMAND MODEL As a component of the Teller County Transportation Plan development, a computerized travel demand model was developed. The model was utilized for development of the Transportation
Elevator Dispatching as Mixed Integer Linear Optimization Problem
 Elevator Dispatching as Mixed Integer Linear Optimization Problem Mirko Ruokokoski 1 Harri Ehtamo 1 Janne Sorsa 2 Marja-Liisa Siikonen 2 1 Systems Analysis Laboratory Helsinki University of Techonology,
The Spatial Structure of Cities: International Examples of the Interaction of Government, Topography and Markets
 Module 2: Spatial Analysis and Urban Land Planning The Spatial Structure of Cities: International Examples of the Interaction of Government, Topography and Markets Alain Bertaud Urbanist Summary What are
The 3V Approach. Transforming the Urban Space through Transit Oriented Development. Gerald Ollivier Transport Cluster Leader World Bank Hub Singapore
 Transforming the Urban Space through Transit Oriented Development The 3V Approach Gerald Ollivier Transport Cluster Leader World Bank Hub Singapore MDTF on Sustainable Urbanization The China-World Bank
Appendix C Final Methods and Assumptions for Forecasting Traffic Volumes
 Fairview Ave. and Main St. Improvements and Local Streets Plan Appendices Ada County Highway District Appendix C Final Methods and Assumptions for Forecasting Traffic Volumes January 3, 207 Appendices
Simulating Mobility in Cities: A System Dynamics Approach to Explore Feedback Structures in Transportation Modelling
 Simulating Mobility in Cities: A System Dynamics Approach to Explore Feedback Structures in Transportation Modelling Dipl.-Ing. Alexander Moser [amoser@student.tugraz.at] IVT Tagung 2013 - Kloster Kappel
WEBER ROAD RESIDENTIAL DEVELOPMENT Single Family Residential Project
 WEBER ROAD RESIDENTIAL DEVELOPMENT Single Family Residential Project WEBER ROAD RESIDENTIAL DEVELOPMENT TRAFFIC IMPACT STUDY TABLE OF CONTENTS 1.0 Executive Summary Page 2.0 Introduction 2.1 DEVELOPMENT
III. FORECASTED GROWTH
 III. FORECASTED GROWTH In order to properly identify potential improvement projects that will be required for the transportation system in Milliken, it is important to first understand the nature and volume
The Model Research of Urban Land Planning and Traffic Integration. Lang Wang
 International Conference on Materials, Environmental and Biological Engineering (MEBE 2015) The Model Research of Urban Land Planning and Traffic Integration Lang Wang Zhejiang Gongshang University, Hangzhou
A BASE SYSTEM FOR MICRO TRAFFIC SIMULATION USING THE GEOGRAPHICAL INFORMATION DATABASE
 A BASE SYSTEM FOR MICRO TRAFFIC SIMULATION USING THE GEOGRAPHICAL INFORMATION DATABASE Yan LI Ritsumeikan Asia Pacific University E-mail: yanli@apu.ac.jp 1 INTRODUCTION In the recent years, with the rapid
Route Choice Analysis: Data, Models, Algorithms and Applications Emma Frejinger Thesis Supervisor: Michel Bierlaire
 p. 1/15 Emma Frejinger Thesis Supervisor: Michel Bierlaire p. 2/15 Which route would a given traveler take to go from one location to another in a transportation network? Car trips (uni-modal networks)
South Bristol Link Forecasting Report
 South Bristol Link April 2013 Atkins 5098941 AVTM Forecasting v2 PI (Draft 120331) Draft 31 March 2012 1 Notice This document and its contents have been prepared and are intended solely for West of England
Course Outline Introduction to Transportation Highway Users and their Performance Geometric Design Pavement Design
 Course Outline Introduction to Transportation Highway Users and their Performance Geometric Design Pavement Design Speed Studies - Project Traffic Queuing Intersections Level of Service in Highways and
Transit Market Index. Validating Local Potential for Transit Ridership
 Transit Market Index Validating Local Potential for Transit Ridership Transit Market Areas Characteristics 2010 TPP Characterized by different levels of transit service. Core Areas, 1 & 2: A variety of
INTRODUCTION TO TRANSPORTATION SYSTEMS
 INTRODUCTION TO TRANSPORTATION SYSTEMS Lectures 5/6: Modeling/Equilibrium/Demand 1 OUTLINE 1. Conceptual view of TSA 2. Models: different roles and different types 3. Equilibrium 4. Demand Modeling References:
The spatial network Streets and public spaces are the where people move, interact and transact
 The spatial network Streets and public spaces are the where people move, interact and transact The spatial network Cities are big spatial networks that create more of these opportunities Five key discoveries
Metrolinx Transit Accessibility/Connectivity Toolkit
 Metrolinx Transit Accessibility/Connectivity Toolkit Christopher Livett, MSc Transportation Planning Analyst Research and Planning Analytics Tweet about this presentation #TransitGIS OUTLINE 1. Who is
Data driven approaches to Urban Planning Experience from Derry/Londonderry
 Data driven approaches to Urban Planning Experience from Derry/Londonderry Anna Rose RTPI Belfast 11 th of September 1 June 26 07:47AM 2 The value of the City The space of the city is a theatre: playing
A Land Use Transport Model for Greater London:
 Spatio-Temporal Analysis of Network Data and Road Developments Launch Event Workshop UCL Monday 18 May 2009 A Land Use Transport Model for Greater London: With Applications to an Integrated Assessment
Figure 8.2a Variation of suburban character, transit access and pedestrian accessibility by TAZ label in the study area
 Figure 8.2a Variation of suburban character, transit access and pedestrian accessibility by TAZ label in the study area Figure 8.2b Variation of suburban character, commercial residential balance and mix
Where to Find My Next Passenger?
 Where to Find My Next Passenger? Jing Yuan 1 Yu Zheng 2 Liuhang Zhang 1 Guangzhong Sun 1 1 University of Science and Technology of China 2 Microsoft Research Asia September 19, 2011 Jing Yuan et al. (USTC,MSRA)
Taming the Modeling Monster
 Taming the Modeling Monster Starring: Ellen Greenberg Scott McCarey Jim Charlier Audience Poll, part 1 Elected Officials Board Members Public Staff Consultants Journalists Other Audience Poll, part 2 Modeling
Travel Time Calculation With GIS in Rail Station Location Optimization
 Travel Time Calculation With GIS in Rail Station Location Optimization Topic Scope: Transit II: Bus and Rail Stop Information and Analysis Paper: # UC8 by Sutapa Samanta Doctoral Student Department of
Prepared for: San Diego Association Of Governments 401 B Street, Suite 800 San Diego, California 92101
 Activity-Based Travel Model Validation for 2012 Using Series 13 Data: Coordinated Travel Regional Activity Based Modeling Platform (CT-RAMP) for San Diego County Prepared for: San Diego Association Of
City of Hermosa Beach Beach Access and Parking Study. Submitted by. 600 Wilshire Blvd., Suite 1050 Los Angeles, CA
 City of Hermosa Beach Beach Access and Parking Study Submitted by 600 Wilshire Blvd., Suite 1050 Los Angeles, CA 90017 213.261.3050 January 2015 TABLE OF CONTENTS Introduction to the Beach Access and Parking
I. M. Schoeman North West University, South Africa. Abstract
 Urban Transport XX 607 Land use and transportation integration within the greater area of the North West University (Potchefstroom Campus), South Africa: problems, prospects and solutions I. M. Schoeman
1.225 Transportation Flow Systems Quiz (December 17, 2001; Duration: 3 hours)
") 1.225 Transportation Flow Systems Quiz (December 17, 2001; Duration: 3 hours) Student Name: Alias: Instructions: 1. This exam is open-book 2. No cooperation is permitted 3. Please write down your name
1.225 Transportation Flow Systems Quiz (December 17, 2001; Duration: 3 hours) Student Name: Alias: Instructions: 1. This exam is open-book 2. No cooperation is permitted 3. Please write down your name
A new delay forecasting system for the Passenger Information Control system (PIC) of the Tokaido-Sanyo Shinkansen
 of the Tokaido-Sanyo Shinkansen") Computers in Railways X 199 A new delay forecasting system for the Passenger Information Control system (PIC) of the Tokaido-Sanyo Shinkansen K. Fukami, H. Yamamoto, T. Hatanaka & T. Terada Central Japan
Computers in Railways X 199 A new delay forecasting system for the Passenger Information Control system (PIC) of the Tokaido-Sanyo Shinkansen K. Fukami, H. Yamamoto, T. Hatanaka & T. Terada Central Japan
January 12, Mr. Ryan Granger TMGB Wilson, LLC 2221 Health Drive SW, Suite 2200 Wyoming, Michigan 49519
 January 12, 2018 Mr. Ryan Granger TMGB Wilson, LLC 2221 Health Drive SW, Suite 2200 Wyoming, Michigan 49519 Re: Proposed Reserve at Rivertown Mixed-Use Development Updated Trip Generation and Site Driveway
Accessibility Instruments in Planning Practice Spatial Network Analysis for Multi-Modal Transport Systems (SNAMUTS): Adelaide
: Adelaide") Accessibility Instruments in Planning Practice Spatial Network Analysis for Multi-Modal Transport Systems (SNAMUTS): Adelaide Prof Carey Curtis, Dr Jan Scheurer, Roger Mellor, Oscar Thomson Curtin University,
Accessibility Instruments in Planning Practice Spatial Network Analysis for Multi-Modal Transport Systems (SNAMUTS): Adelaide Prof Carey Curtis, Dr Jan Scheurer, Roger Mellor, Oscar Thomson Curtin University,
1 h. Page 1 of 12 FINAL EXAM FORMULAS. Stopping Sight Distance. (2 ) N st U Where N=sample size s=standard deviation t=z value for confidence level
 N st U Where N=sample size s=standard deviation t=z value for confidence level") Page 1 of 12 FINAL EXAM FORMULAS Stopping Sight Distance 2 2 V V d 1.47Vt 1.075 i f a 2 2 Vi Vf d 1.47Vt 30( f 0.01 G) Where d = distance (ft) V = speed (mph) t = time (sec) a=deceleration rate (ft/sec
Page 1 of 12 FINAL EXAM FORMULAS Stopping Sight Distance 2 2 V V d 1.47Vt 1.075 i f a 2 2 Vi Vf d 1.47Vt 30( f 0.01 G) Where d = distance (ft) V = speed (mph) t = time (sec) a=deceleration rate (ft/sec
StanCOG Transportation Model Program. General Summary
 StanCOG Transportation Model Program Adopted By the StanCOG Policy Board March 17, 2010 What are Transportation Models? General Summary Transportation Models are technical planning and decision support
Technical Memorandum #2 Future Conditions
 Technical Memorandum #2 Future Conditions To: Dan Farnsworth Transportation Planner Fargo-Moorhead Metro Council of Governments From: Rick Gunderson, PE Josh Hinds PE, PTOE Houston Engineering, Inc. Subject:
A Framework for Dynamic O-D Matrices for Multimodal transportation: an Agent-Based Model approach
 A Framework for Dynamic O-D Matrices for Multimodal transportation: an Agent-Based Model approach Nuno Monteiro - FEP, Portugal - 120414020@fep.up.pt Rosaldo Rossetti - FEUP, Portugal - rossetti@fe.up.pt
Managing Growth: Integrating Land Use & Transportation Planning
 Managing Growth: Integrating Land Use & Transportation Planning Metro Vancouver Sustainability Community Breakfast Andrew Curran Manager, Strategy June 12, 2013 2 Integrating Land Use & Transportation
Extracting mobility behavior from cell phone data DATA SIM Summer School 2013
 Extracting mobility behavior from cell phone data DATA SIM Summer School 2013 PETER WIDHALM Mobility Department Dynamic Transportation Systems T +43(0) 50550-6655 F +43(0) 50550-6439 peter.widhalm@ait.ac.at
QUANTIFICATION OF THE NATURAL VARIATION IN TRAFFIC FLOW ON SELECTED NATIONAL ROADS IN SOUTH AFRICA
 QUANTIFICATION OF THE NATURAL VARIATION IN TRAFFIC FLOW ON SELECTED NATIONAL ROADS IN SOUTH AFRICA F DE JONGH and M BRUWER* AECOM, Waterside Place, Tygerwaterfront, Carl Cronje Drive, Cape Town, South
CE351 Transportation Systems: Planning and Design
 CE351 Transportation Systems: Planning and Design TOPIC: Level of Service (LOS) at Traffic Signals 1 Course Outline Introduction to Transportation Highway Users and their Performance Geometric Design Pavement
Snow and Ice Control POLICY NO. P-01/2015. CITY OF AIRDRIE Snow and Ice Control Policy
 Page 1 CITY OF AIRDRIE Snow and Ice Control Effective Date: Approved By: Approved On: March 17, 2015 City Council March 16, 2015 Revision Date: Resolution #: ------ PURPOSE: The City of Airdrie is responsible
accessibility instruments in planning practice
 accessibility instruments in planning practice Spatial Network Analysis for Multi-Modal Transport Systems (SNAMUTS): Helsinki Prof Carey Curtis, Dr Jan Scheurer, Curtin University, Perth - RMIT University,
TRANSPORTATION AND TRAFFIC ANALYSIS REPORT
 Square One Drive Extension Municipal Class Environmental Assessment Environmental Study Report Appendix B Transportation and Traffic Analysis Report TRANSPORTATION AND TRAFFIC ANALYSIS REPORT FINAL DRAFT
Market Street PDP. Nassau County, Florida. Transportation Impact Analysis. VHB/Vanasse Hangen Brustlin, Inc. Nassau County Growth Management
 Transportation Impact Analysis Market Street PDP Nassau County, Florida Submitted to Nassau County Growth Management Prepared for TerraPointe Services, Inc. Prepared by VHB/Vanasse Hangen Brustlin, Inc.
Transit Time Shed Analyzing Accessibility to Employment and Services
 Transit Time Shed Analyzing Accessibility to Employment and Services presented by Ammar Naji, Liz Thompson and Abdulnaser Arafat Shimberg Center for Housing Studies at the University of Florida www.shimberg.ufl.edu
A Hybrid Approach for Determining Traffic Demand in Large Development Areas
 A Hybrid Approach for Determining Traffic Demand in Large Development Areas Xudong Chai Department of Civil, Construction, and Environmental Engineering Iowa State University 394 Town Engineering Ames,
Traffic Impact Study
 Traffic Impact Study Statham DRI One University Parkway Prepared for: Barrow County Prepared by: October 2012 Table of Contents Executive Summary i Section 1. Introduction 1 Project Description 1 Methodology
TRAFFIC IMPACT STUDY. Platte Canyon Villas Arapahoe County, Colorado (Arapahoe County Case Number: Z16-001) For
 For") TRAFFIC IMPACT STUDY For Platte Canyon Villas Arapahoe County, Colorado (Arapahoe County Case Number: Z16-001) February 2015 Revised: August 2015 April 2016 July 2016 September 2016 Prepared for: KB Home
TRAFFIC IMPACT STUDY For Platte Canyon Villas Arapahoe County, Colorado (Arapahoe County Case Number: Z16-001) February 2015 Revised: August 2015 April 2016 July 2016 September 2016 Prepared for: KB Home
CORRIDORS OF FREEDOM Access Management (Ability) Herman Pienaar: Director City Transformation and Spatial Planning
 Herman Pienaar: Director City Transformation and Spatial Planning") CORRIDORS OF FREEDOM Access Management (Ability) 2016 Herman Pienaar: Director City Transformation and Spatial Planning PLANNING DEVELOPMENT PROCESS RATHER THAN A PLAN CAPITAL INVESTMENT DEVELOPMENT FACILITATION
CORRIDORS OF FREEDOM Access Management (Ability) 2016 Herman Pienaar: Director City Transformation and Spatial Planning PLANNING DEVELOPMENT PROCESS RATHER THAN A PLAN CAPITAL INVESTMENT DEVELOPMENT FACILITATION
Estimating Transportation Demand, Part 2
 Transportation Decision-making Principles of Project Evaluation and Programming Estimating Transportation Demand, Part 2 K. C. Sinha and S. Labi Purdue University School of Civil Engineering 1 Estimating
Financing Urban Transport. UNESCAP-SUTI Event
 Financing Urban Transport UNESCAP-SUTI Event October 2017 Urban Transport in Context 2 The spiky urban economy of global cities 3 Mass transit networks converge towards a characteristic structure with
FHWA Peer Exchange Meeting on Transportation Systems Management during Inclement Weather
 Travel Demand Modeling & Simulation at GBNRTC Matt Grabau Kimberly Smith Mike Davis Why Model? Travel modeling is a tool for transportation planners and policy makers, to observe impacts of a transportation
GIS ANALYSIS METHODOLOGY
 GIS ANALYSIS METHODOLOGY No longer the exclusive domain of cartographers, computer-assisted drawing technicians, mainframes, and workstations, geographic information system (GIS) mapping has migrated to
TRAVEL TIME RELIABILITY ON EXPRESSWAY NETWORK UNDER UNCERTAIN ENVIRONMENT OF SNOWFALL AND TRAFFIC REGULATION
 TRAVEL TIME RELIABILITY ON EXPRESSWAY NETWORK UNDER UNCERTAIN ENVIRONMENT OF SNOWFALL AND TRAFFIC REGULATION Hiroshi Wakabayashi Faculty of Urban Science, Meijo University, 4-3-3, Nijigaoka, Kani-City,
Chao Liu, Ting Ma, and Sevgi Erdogan National Center for Smart Growth Research & Education (NCSG) University of Maryland, College Park
 University of Maryland, College Park") Chao Liu, Ting Ma, and Sevgi Erdogan National Center for Smart Growth Research & Education (NCSG) University of Maryland, College Park 2015 GIS in Transit, September 1-3, 2015 Shared-use Vehicle Services
Chao Liu, Ting Ma, and Sevgi Erdogan National Center for Smart Growth Research & Education (NCSG) University of Maryland, College Park 2015 GIS in Transit, September 1-3, 2015 Shared-use Vehicle Services
Transport Planning in Large Scale Housing Developments. David Knight
 Transport Planning in Large Scale Housing Developments David Knight Large Scale Housing Developments No longer creating great urban spaces in the UK (Hall 2014) Transport Planning Transport planning processes
MEZZO: OPEN SOURCE MESOSCOPIC. Centre for Traffic Research Royal Institute of Technology, Stockholm, Sweden
 MEZZO: OPEN SOURCE MESOSCOPIC SIMULATION Centre for Traffic Research Royal Institute of Technology, Stockholm, Sweden http://www.ctr.kth.se/mezzo 1 Introduction Mesoscopic models fill the gap between static
Trip Generation Study: A 7-Eleven Gas Station with a Convenience Store Land Use Code: 945
 Trip Generation Study: A 7-Eleven Gas Station with a Convenience Store Land Use Code: 945 Introduction The Brigham Young University Institute of Transportation Engineers student chapter (BYU ITE) completed
SBCAG Travel Model Upgrade Project 3rd Model TAC Meeting. Jim Lam, Stewart Berry, Srini Sundaram, Caliper Corporation December.
 SBCAG Travel Model Upgrade Project 3rd Model TAC Meeting Jim Lam, Stewart Berry, Srini Sundaram, Caliper Corporation December. 7, 2011 1 Outline Model TAZs Highway and Transit Networks Land Use Database
Sensitivity of estimates of travel distance and travel time to street network data quality
 Sensitivity of estimates of travel distance and travel time to street network data quality Paul Zandbergen Department of Geography University of New Mexico Outline Street network quality Approaches to
Empirical Relation between Stochastic Capacities and Capacities Obtained from the Speed-Flow Diagram
 Empirical Relation between Stochastic Capacities and Capacities Obtained from the Speed-Flow Diagram Dr.-Ing. Justin Geistefeldt Institute for Transportation and Traffic Engineering Ruhr-University Bochum
Visitor Flows Model for Queensland a new approach
 Visitor Flows Model for Queensland a new approach Jason. van Paassen 1, Mark. Olsen 2 1 Parsons Brinckerhoff Australia Pty Ltd, Brisbane, QLD, Australia 2 Tourism Queensland, Brisbane, QLD, Australia 1
Travel behavior of low-income residents: Studying two contrasting locations in the city of Chennai, India
 Travel behavior of low-income residents: Studying two contrasting locations in the city of Chennai, India Sumeeta Srinivasan Peter Rogers TRB Annual Meet, Washington D.C. January 2003 Environmental Systems,
Lecture 8 Network Optimization Algorithms
 Advanced Algorithms Floriano Zini Free University of Bozen-Bolzano Faculty of Computer Science Academic Year 2013-2014 Lecture 8 Network Optimization Algorithms 1 21/01/14 Introduction Network models have
Douglas County/Carson City Travel Demand Model
 Douglas County/Carson City Travel Demand Model FINAL REPORT Nevada Department of Transportation Douglas County Prepared by Parsons May 2007 May 2007 CONTENTS 1. INTRODUCTION... 1 2. DEMOGRAPHIC INFORMATION...
Urban development. The compact city concept was seen as an approach that could end the evil of urban sprawl
 The compact city Outline 1. The Compact City i. Concept ii. Advantages and the paradox of the compact city iii. Key factor travel behavior 2. Urban sustainability i. Definition ii. Evaluating the compact
Effects of a non-motorized transport infrastructure development in the Bucharest metropolitan area
 The Sustainable City IV: Urban Regeneration and Sustainability 589 Effects of a non-motorized transport infrastructure development in the Bucharest metropolitan area M. Popa, S. Raicu, D. Costescu & F.
SPACE-TIME ACCESSIBILITY MEASURES FOR EVALUATING MOBILITY-RELATED SOCIAL EXCLUSION OF THE ELDERLY
 SPACE-TIME ACCESSIBILITY MEASURES FOR EVALUATING MOBILITY-RELATED SOCIAL EXCLUSION OF THE ELDERLY Izumiyama, Hiroshi Institute of Environmental Studies, The University of Tokyo, Tokyo, Japan Email: izumiyama@ut.t.u-tokyo.ac.jp
Mapping Accessibility Over Time
 Journal of Maps, 2006, 76-87 Mapping Accessibility Over Time AHMED EL-GENEIDY and DAVID LEVINSON University of Minnesota, 500 Pillsbury Drive S.E., Minneapolis, MN 55455, USA; geneidy@umn.edu (Received