Basic Land Navigation
|
|
|
- Edwin Young
- 5 years ago
- Views:
Transcription


1 A Publication of the National Wildfire Coordinating Group National Interagency Incident Management System Basic Land Navigation PMS 475 June 2007 NFES 2865
2 JUNE 2007 NFES 2865 Sponsored for NWCG publication by the NWCG Training Working Team. The use of trade, firm, or corporation names in this publication is for the information and convenience of the reader and does not constitute an endorsement by the National Wildfire Coordinating Group of any product or service to the exclusion of others that may be suitable. Comments regarding the content of this publication should be directed to: National Interagency Fire Center, Fire Training, 3833 S. Development Ave., Boise, Idaho This publication is available for download at It may also be ordered from National Interagency Fire Center, ATTN: Great Basin Cache Supply Office, 3833 S. Development Ave., Boise, Idaho Order NFES 2865.
3 PREFACE Basic Land Navigation is pre-course work for several courses in the National Wildfire Coordinating Group (NWCG) wildland fire curriculum. It is primarily designed for students to complete in a nonclassroom environment; however, it is often used as a student workbook for navigation courses. The 2007 version was developed by an interagency group of experts with direction and guidance from the National Interagency Fire Center (NIFC) Fire Training Group under authority of the NWCG. The primary participants in this development effort were: U.S.D.A. FOREST SERVICE San Bernardino National Forest Mary Bogens U.S. FISH AND WILDLIFE SERVICE New Jersey Michael Durfee STATE OF NEW HAMPSHIRE Lee Gardner BUREAU OF INDIAN AFFAIRS Oklahoma Richard Streeper NATIONAL INTERAGENCY FIRE CENTER, FIRE TRAINING NWCG appreciates the efforts of these personnel and all those who have contributed to the development of this training product. i
4 ii
5 CONTENTS Preface... i Introduction... v Chapter 1 Overview of Maps Key Points When Working with Maps General Types of Maps Incident Specific Maps Map Legend and Symbols Map Sources Checking Your Understanding Chapter 2 Reading Topographic Maps and Making Calculations Reading the Margins Interpreting Contour Lines Estimating Slope Estimating Aspect Estimating Acreage Estimating Distances Estimating Percent Contained Checking Your Understanding Chapter 3 Geographic Location Systems Latitude and Longitude Universal Transverse Mercator U.S. Public Land Survey Other Geographic Location Systems Checking Your Understanding Chapter 4 Using a Compass and Clinometer Parts of a Compass Tips on Getting Accurate Compass Readings Adjusting a Compass for Magnetic Declination Orienting a Compass Taking Bearings (Direct and Back) Following Bearings Estimating Slope with a Clinometer Checking Your Understanding iii
6 Chapter 5 Global Positioning System How the Global Positioning System Works Using a GPS Receiver Checking Your Understanding Chapter 6 Navigation and Field Mapping Orienting Maps Measuring a Bearing on a Map Plotting Points on a Map using Latitude/Longitude Plotting Points on a Map using UTM Estimating Your Own Position Location Estimating Unknown Position Locations Estimating Distance on the Ground Field Mapping Taking Notes Checking Your Understanding Appendixes Appendix A Glossary Appendix B Answers to Exercises Appendix C Tools and Resources iv
7 INTRODUCTION Navigating with a compass and map is an essential skill for many incident positions. Even with new technology, such as Global Positioning System (GPS) receivers, map and compass skills are still needed. Confidence with navigation skills comes with practice and proficiency. This confidence level often impacts how a person performs during a crisis which can result in life or death decisions. Basic Land Navigation is an introduction to land navigation. It begins with a general overview of maps. Then it specifically addresses how to read topographic maps. Next it covers various types of geographic location systems, such as latitude/longitude and Universal Transverse Mercator (UTM). This is followed by basic instructions on using a compass and clinometer. Then a general overview of the Global Positioning System is presented. The last chapter builds on skills learned in the previous chapters and adds new skills for navigation and field mapping. The three appendixes glossary, answers to exercise, and tools/resources include additional information as a reference. Each chapter starts with a bulleted list of what you will learn. This is followed by a general overview of the chapter and how the information can be used. The technical content is then presented with several illustrations to facilitate understanding the concepts. Each chapter ends with the section Checking Your Understanding, which consists of several questions. The answers to those questions are in Appendix B. Map scales may have changed during the printing of this publication; this may cause the correct answers to be slightly different than the given answers. As you read through the chapters it will be helpful to have a U.S. Geological Survey (USGS) color topographic map to use as a reference. To complete the exercises you will need the following materials: Compass with adjustment for magnetic declination Clinometer Calculator Engineer s ruler (see Appendix C) Protractor (see Appendix C) Dot grid (see Appendix C) UTM grid reader (see Appendix C) v
8 vi
9 Chapter 1 Overview of Maps In this chapter you will learn about: Key points when working with maps General types of maps Incident specific maps Map legend and symbols Map sources A map is a navigational aid that represents a specific area, such as part of the earth s surface. Conventional symbols are used to identify objects and features on a map. Maps are critical communication tools for incident planning and operations, and are used for a variety of purposes, for example: To assist with navigation. To determine the location of a specific point or area (e.g., water sources, threatened resources). To calculate distance. To determine size of an area. To determine terrain and vegetative cover. To determine routes of travel. To determine names of streets, rivers, mountains, and other features. To visualize a specific area. This chapter starts with some key points about maps. Then it discusses types of maps and incident specific maps. Additional information is provided on map legends and symbols. Finally, it describes different places to obtain maps. Page 1.1
10 Key Points When Working With Maps When working with maps there are some key points to remember, especially when using the map in conjunction with a compass and GPS receiver. Datum Most maps are made based on a datum (horizontal and vertical), which is the origin or reference point from which all points on a map are measured. Several different datums have been used to develop maps; however, commonly used datum includes: North American Datum of 1927 (NAD27), North American Datum of 1983 (NAD83), and the World Geodetic System of 1984 (WGS84). The datum is important for Geographic Information Systems (GIS) and GPS applications to ensure consistency of map data. When using a GPS receiver the datum must be set to match the horizontal datum on the map. If the datum does not match there will be errors when plotting data on a map. Geographic North Maps are usually based on the geographic North Pole (geographic north or true north). This is important to remember because a compass is based on magnetic north, which is different than geographic north. Magnetic north changes over time, while geographic north does not change over time. When using a compass and map together an adjustment has to be made to the compass to account for this difference. The difference is referred to as the magnetic declination, which is discussed in Chapter 4, Using a Compass and Clinometer. Maps Are Not Perfect For a map to be considered reliable and accurate, a point or symbol marked on a map must be in proper relation to known landmarks or positions located on the ground. In 1947, the United States National Map Accuracy Standards were established as the standards of accuracy for published maps and are currently in effect. The standards require a stringent percent of accuracy within centimeters of both location and elevation points tested. However, even with these standards, maps are not absolutely accurate because: Maps represent a curved and uneven surface that is drawn on a flat piece of paper, which results in a distorted picture. There is a margin of error (human error and inadequate survey procedures) in surveys that were used to create maps. Also, there are factual matters (errors such as names, symbols of features, and the classifications of roads or woodlands); sometimes the information is wrong and names and features change. On incidents, if a map has been photocopied, it most likely is not to scale. It is important to watch out for this and learn how to make adjustments. Page 1.2

11 Maps Can Be Outdated Maps are outdated from the day they are made, including USGS topographic maps (for example, new roads may not be on a map). When working on an incident try to obtain the most up-to-date map. USGS topographic maps have the revision date in the margin. General Types of Maps This section discusses general types of maps: planimetric, topographic, and orthophoto. Planimetric Maps Planimetric maps show the positions of features without showing their relationship to the hills and valleys of the land. Examples of features on planimetric maps include rivers, lakes, roads, and boundaries. Planimetric maps include: Common road maps road atlas and city maps (Figure 1-1). Specific area maps preplan maps, floor plan maps, storm drain maps, sewer and water system maps. Schematic maps agency maps and aviation maps. Figure 1-1. City map. Page 1.3

12 Topographic Maps Topographic maps are different from planimetric maps because they show both the horizontal and vertical (relief) positions of features. The datum used for most currently available USGS 7.5 minute series topographical maps is the NAD27. A new datum, NAD83, is now being used and others are being developed. Most of the topographic maps used on incidents are produced by the USGS or USDA Forest Service. These maps are often used as the base map to develop incident specific maps, such as the Situation Unit map and Incident Action Plan map. Two types of topographic maps include: Contour maps Contour maps are the most common way to show the shape and elevation of the land (Figure 1-2). A contour is an imaginary line, where all points on the line are at the same elevation (above or below a specific reference elevation, usually sea level). Contour lines reveal the location of slopes, depressions, ridges, cliffs, and other topographical features. Figure 1-2. Topographic map showing contours. Page 1.4

13 Shaded-relief maps Shaded-relief maps use a shadow effect color to simulate the terrain (Figure 1-3). Different color shades are used to accentuate the shape of the physical features. The darker the shading the steeper the slope. Figure 1-3. Shaded-relief map. Page 1.5


14 Orthophoto Maps An orthophoto map is an aerial color-enhanced photograph of the land depicting terrain and other features (Figure 1-4). Some orthophoto maps are overlain with contour lines and other features commonly associated with topographic maps. These maps are corrected for scale and are the same size as USGS topographic quadrangle maps. Figure 1-4. Orthophoto map. Incident Specific Maps There are several different types of maps used on an incident and they each have their own specific purpose. Situation Unit Map The Situation Unit map is the most current map of the incident because it is continuously updated (Figure 1-5). It is the master map and other incident maps are often derived from this map. The Situation Unit map is a large topographic map that is computer generated or hand drawn. Figure 1-5. Situation Unit map. Page 1.6

. It contains the same information that is on the Situation Unit map. Figure 1-6a. Incident Action Plan map (hand-drawn).")
15 Incident Action Plan (IAP) Map The Incident Action Plan map is the primary map that operations personnel use to accomplish the incident mission. It represents a snapshot in time and is published daily in the IAP. It is a small, black and white topographic map (typically 8½" x 11" or 11" x 17") that is hand-drawn or computer generated (Figures 1-6a and 1-6b). It contains the same information that is on the Situation Unit map. Figure 1-6a. Incident Action Plan map (hand-drawn). Figure 1-6b. Incident Action Plan map (computer generated). Page 1.7
. Figure 1-7. Operational Briefing map. Page 1.8")
16 Operational Briefing Map The Operational Briefing map is used during briefings to discuss work assignments and other details for the upcoming operational period (Figure 1-7). Figure 1-7. Operational Briefing map. Page 1.8

17 Progression Map The Progression map shows how the incident has grown over the landscape according to a time scale and is used to track the incident s progression (Figure 1-8). It is a topographic or shaded-relief map that illustrates the changing perimeter, which is distinguishable by color or text. The size of the Progression map varies. Figure 1-8. Progression map. Page 1.9
.")
18 Facilities Map The Facilities map is used to orient incident staff to the layout of the incident command post and camp (Figure 1-9). It is typically on one page, 8½" x 11", and included in the IAP. Figure 1-9. Facilities map. Figure Transportation map. Transportation Map This map shows travel routes and overall access to the incident (Figure 1-10). It is used to facilitate the safe delivery of equipment, supplies, and personnel to and from the incident location. It is typically 8½" x 11" and included in the IAP. Page 1.10

19 Infrared Map Infrared maps display heat sources and hot spots on a fire incident (Figure 1-11). Infrared Interpreters (IRIN) translate information from infrared imagery to the topographic maps. Several shades of black and white are used to depict heat sources. Black represents the hottest spots while white shows the cooler areas. Structure Protection Map Figure Infrared map. This map displays locations of improvements (e.g., structures) in relationship to the incident. Air Operations Map This is a topographic or shaded-relief map with symbology that pertains to air operations. It may include temporary flight restrictions and flight hazards. Public Information Map This map is used to keep the public informed and does not show tactical details. It shows incident location in relationship to communities and other points of interest. Fire History Map The fire history map displays fire perimeter in relationship to previously burned areas. Ownership Map This map displays land ownership within and adjacent to the incident perimeter. Rehabilitation Map The rehabilitation map displays incident activities that may cause environmental impacts. This map also charts progress of rehabilitation activities. Fuels/Vegetation Map This map displays fuels and/or vegetation within and adjacent to the incident perimeter. Page 1.11
20 Map Legend and Symbols Most maps have a legend that is used to interpret symbols on the map such as what color line delineates a road or land ownership boundary, or what symbol represents a building, stream, or heliport (Figure 1-12). The symbols used vary with every map, depending upon the purpose of the map. The legend may also include the map scale and other important information. Figure Example of a map legend. Page 1.12
21 Symbol Colors Map symbols are usually printed in colors with each color representing a class of features. The colors and features used on incident maps include: Blue facilities, water Red fire features, origin, roads Black roads, control lines, drop points Orange fire spread prediction Green vegetation Brown contours, cuts and fills, other relief features Purple revised information Grey developed areas Other colors may be used for special purposes. Page 1.13
22 Types of Symbols Incident Command System (ICS) has a standardized, color-coded symbol set that was developed specifically for the Incident Command System (Figure 1-13). The ICS symbols are also in the Fireline Handbook. Additional symbols can be created for incident maps, but they must be defined in the legend. Figure Incident Command System symbology. Page 1.14
23 Map Sources There are several different places to obtain maps. Federal Agencies Local, Regional, and National Offices The local, regional, and national offices for federal agencies often have maps for their specific jurisdiction. Local/State Agency Offices Local and state agency offices (forestry, fire, police, emergency management) will have maps of the local area. Local Business Offices Local business offices (real estate, contractors, utility companies, Chamber of Commerce) may also have maps of the local area. Internet Several agencies have statewide data sets available online. Mapping Software Mapping software is now available that offers a variety of features, such as printing maps, plotting points, determining acreage, and downloading GPS information (tracks, waypoints, routes). Geographic Information System is the major software system that is used for mapping data; however, there are other software products available. Page 1.15
24 Page 1.16
25 Checking Your Understanding Answers to Checking Your Understanding can be found in Appendix B. 1. List three examples of how you may use a map on an incident. 2. Describe two key points to remember when using a map with a compass or GPS receiver. 3. Indicate the type of map that would be most appropriate for these activities: A. Locate hot spots on an incident B. Determine slope of a specific area C. Identify travel route D. Determine current perimeter location E. Identify perimeter location when the incident started 4. What publication can you use to learn the ICS symbols? 5. List three sources of where you can obtain maps. Page 1.17
26 Page 1.18
27 Chapter 2 Reading Topographic Maps and Making Calculations In this chapter you will learn about: Reading the margins Interpreting contour lines Estimating slope Estimating aspect Estimating acreage Estimating distances Estimating percent contained A nice reference to have while reading this chapter is a USGS color topographic map. A topographic map is printed on a flat piece of paper yet it provides a picture of the terrain and manmade features through the use of contour lines, colors and symbols. Contour lines represent the shape and elevation of the land, such as ridges, valleys, and hills. Colors and symbols are used to represent other features on the land, such as water, vegetation, roads, boundaries, urban areas and structures. The USGS produces a series of topographic maps that are extremely accurate. The United States was systematically divided into precise quadrangles based on latitude and longitude lines and these maps are commonly referred to as quads. This chapter starts with tips on how to read the margins of a topographic map. Then it describes how to interpret contour lines. Finally, it covers how to estimate slope, aspect, acreage, distances, and percent contained using a topographic map. Page 2.1

28 Reading the Margins This section addresses how to read the information that is in the margins of a USGS topographic map. It starts with the upper left corner of the map and moves clockwise around the map. Agency or Author Who Created Map (upper left corner of map) In Figure 2-1, the United States Department of the Interior Geological Survey is the agency that created the map. This same information can also be found in the bottom left corner. Figure 2-1. Agency or author who created map. Page 2.2

29 Map Title (upper right corner of map) This corner section provides the name of quadrangle, state (and sometimes the county) where the quadrangle is located, and map series. Quadrangles are often named after a prominent town or feature that is in the quadrangle. In Figure 2-2, the name of the quadrangle is Lucky Peak which is located in Idaho. The map series indicates how much land area is on the map; for example, in Figure 2-2 the Lucky Peak quadrangle is a 7.5 minute series which indicates it covers a four sided area of 7.5 minutes of latitude and 7.5 minutes of longitude. Figure 2-2. Map title. Page 2.3
30 Road Classification (bottom right corner of map) Road and trail symbols may be found in this legend (Figure 2-3). Revision Date (bottom right corner of map) Some maps have a revision date, which is when the map was last updated. If the map is old, it may not be accurate. In Figure 2-3 the revision date is Refer to the Map Production Information block in the bottom left corner for additional information on map dates. Quadrangle Location (bottom right corner of map) The location of the quadrangle is pinpointed on a map of the state (Figure 2-3). Adjoining Quadrangle Legend (corners of map) Names of adjoining quadrangles are frequently indicated in the corner margins of USGS topographical maps; Mayfield is the joining quadrangle in Figure 2-3. Figure 2-3. Road classification, revision date, quadrangle location and adjoining maps. Page 2.4
 The map scale indicates the ratio or proportion of the horizontal distance on the map to the corresponding horizontal distance on the ground (Figure 2-5). Figure 2-5.")
31 Some topographic maps will have an adjoining quadrangle legend (Figure 2-4). Figure 2-4. Example of an adjoining quadrangle legend. Map Scale (bottom center of map) The map scale indicates the ratio or proportion of the horizontal distance on the map to the corresponding horizontal distance on the ground (Figure 2-5). Figure 2-5. Map scale (fractional scale and bar scale) and contour interval. Page 2.5
32 There are two types of scales on the topographic map: Fractional Scale The fractional scale expresses the ratio of the map distance to the ground distance in like units of measurements. It is usually written as a fraction or ratio. For example, the map in Figure 2-5 has a map scale of 1:24,000 which means one inch on the map is 24,000 inches on the ground. Typically, USGS produces maps using the 1:24,000 scale, but will also produce maps using 1:62,500 and 1:250,000 scale. The 1:24,000 scale provides larger and clearer details than the 1:250,000, but it does not cover as large an area. The maps produced at a 1:24,000 scale (1 inch represents 24,000 inches or 2000 feet) are commonly known as 7.5-minute quadrangle maps; each map covers 7.5 minutes of latitude and 7.5 minutes of longitude, which is approximately 8 miles (north/south) and 6 miles (east/west). The primary scale used in Alaska topographic maps is 1:63,360 (1 inch represents 1 mile) due to the size of the state. The Alaska quadrangle map covers 15 minutes of latitude and varies from minutes of longitude. Bar or Graphic Scale A graphic scale or comparison scale is entirely different from the representative fraction scale. It usually compares map distances to the ground distance in different units of measurements. Usually a graphic scale is a line marked off on a map indicating so many inches or millimeters equal to so many feet, kilometers, chains, or miles on the ground. A comparison scale of 1 inch to 2000 feet means that 1 inch on the map is proportioned to 2000 feet on the ground. We are comparing inches and feet which are different units of measurement. Contour Interval (bottom center of the map) Contour interval is the difference in elevation between two adjacent contour lines. In Figure 2-5, the contour interval is 40 feet. On USGS maps, contour intervals are usually 1, 5, 10, 20, 40, and 80 feet. If the contour interval is not printed on the map, it can be calculated (which is discussed later in this chapter). Page 2.6
33 North Arrow, Declination, and Map Production Information (bottom left corner of map) It is common practice for maps to be oriented with true north at the top. Most USGS maps have a symbol of arrows pointing to the geographic North Pole (shown by a star), magnetic north (MN) and grid north (GN). Grid north shows the difference between geographic north (latitude/longitude) and the UTM grid. In Figure 2-6, the magnetic north is 18.5 degrees east. The difference between the geographic North Pole and magnetic north is the magnetic declination for that map. Figure 2-6. North arrow and magnetic declination. Page 2.7

34 If the declination is not indicated on the arrow diagram, it can be found in the Map Production Information which is in the lower left corner of the map (Figure 2-7). The map production information section provides additional information on how and when the map was created. Sometimes the magnetic declination is printed here. Figure 2-7. Map production information block often includes revision dates, datum, and UTM zone. Datum and UTM Zone The datum and UTM zone, which are extremely important when using a GPS receiver, can also be found in this block (Figure 2-7). Vertical and horizontal datums may be listed on the map; however, if the map lists only one datum then the vertical and the horizontal datum are the same. Page 2.8
, minutes (') and seconds (\").")
35 Latitude and Longitude (edges of map) Latitude and longitude lines are indicated with fine black tick marks along the edges of the map (Figure 2-8). Topographic maps do not show the latitude/longitude lines just the tick marks. The numbers next to the tick marks indicate degrees ( ), minutes (') and seconds ("). On 1:24,000 scale maps, latitude and longitude tick marks are indicated every 2.5 minutes. Longitude tick marks are on the top and bottom edges of the map and latitude tick marks are on the right and left edges. Note that the degrees may be left off (as an abbreviation) and you may only see the minute and/or second designations. Reference coordinates for latitude and longitude (degrees, minutes, and seconds) are black and located on the four corners of the map. The intersection of latitude and longitude lines are noted by cross-marks (+). When reading latitude/longitude, pay close attention to the units (degrees, minutes, seconds) because it is easy to misread them. Refer to Chapters 3 and 6 for additional information on latitude and longitude. Figure 2-8. Longitude tick marks (50'), latitude tick marks (35'), reference coordinates (118 52' 30" and 37 37' 30"), and cross-mark (+) in bottom right corner. Page 2.9
 on the map and the coordinate values are in the margin. On USGS topographic maps, 7.")
36 Universal Transverse Mercator (UTM) (edges of map) Prior to 1978, USGS topographic maps used blue tick marks along the edge of the map to illustrate where the UTM grid lines were located. Since 1978, USGS topographic maps actually show UTM grid lines (black) on the map and the coordinate values are in the margin. On USGS topographic maps, 7.5 quadrangle, the UTM grid lines are marked at 1,000 meter increments (Figure 2-9). Abbreviated easting values, for example 3 36, are located on the top and bottom edges of the map. Abbreviated northing values, for example 41 64, are located on the right and left edges of the map. Reference coordinates for UTM are located near the southeast and northwest corners of the map. Notice that the large bold numbers increase as you go north and east. Refer to Chapters 3 and 6 for additional information on UTM. Figure 2-9. Easting ( 3 36, 3 37, 3 38) and northing ( 41 64, 41 63, 41 62, 41 61) value tick marks and reference coordinates ( m E. and m N.). Page 2.10

37 Section, Township, and Range (edges of map) Section, township, and range numbers are red. Section numbers may be printed along the edge, but they are typically printed in the center of the section. In Figure 2-10, some of the section numbers include 15, 16, 17, 18, 19. Township numbers are printed along the right and left edge of the map. In Figure 2-10, the township numbers are T.2S and T.3S. Range numbers are printed on the top and bottom edge of the map. In Figure 2-10, the range numbers are R.1E and R.2E. Refer to Chapter 3 for additional information on section, township, and range. Figure Sections, townships, and range. Page 2.11

38 Interpreting Contour Lines Contour lines on a map show topography or changes in elevation. They reveal the location of slopes, depressions, ridges, cliffs, height of mountains and hills, and other topographical features. A contour line is a brown line on a map that connects all points of the same elevation. They tend to parallel each other, each approximately the shape of the one above it and the one below it. In Figure 2-11, compare the topographic map with the landscape perspective. Figure A contour map and what it looks like from a landscape perspective. Note that contour lines are far apart for level land and almost touch for cliffs. Page 2.12
39 Contour Characteristics Contours have general characteristics; some of which are illustrated in Figures 2-12 and Concentric circles of contour lines indicate a hill. Evenly spaced contours indicate uniform slope. Widely spaced contours indicate a gentle slope. Widely spaced contours at the top of a hill indicate flat hilltop. Close together contours indicate steep slope, wall, or cliff. Close together contours at the top of a hill indicate a pointed hilltop. Crossing or touching contours indicate overhanging cliff. Figure Evenly and widely spaced contours indicate type of slope and shape of hilltop. Page 2.13

40 Jagged, rough contours indicate large outcrops of rocks, cliffs, and fractured areas. V shape contours indicate stream beds and narrow valleys with the point of the V pointing uphill or upstream. U shape contours indicate ridges with the bottom of the U pointing down the ridge. A saddle is a ridge between two hills or summits. M or W shape contours indicate upstream from stream junctions. Circles with hachures or hatch lines (short lines extending from the contour line at right angles) indicate a depression, pit, or sinkhole. Spot elevations (height of identifiable features) such as mountain summits, road intersections, and surfaces of lakes may also be shown on the map. Figure Contour lines and topographic features. Page 2.14
41 Contour Interval Contour interval is the difference in elevation between two adjacent contour lines. On USGS maps, contour intervals are usually 1, 5, 10, 20, 40, and 80 feet. Occasionally you will find a map with a 25 foot contour interval or metric units, but not often. To make the contours easier to read, every fifth one is the index contour which is printed darker and has the elevation in feet from mean sea level marked on the line (Figure 2-14). The thinner or lighter colored contour lines are called intermediate contours. Figure Topographic map showing elevation of two index contours (700 and 800). Page 2.15


42 The contour interval is typically printed at the bottom of the map; however, if the contour interval is unknown, there is a way it can be calculated. Follow the steps in Table 2-1 to calculate the contour interval of the topographic map below. Table 2-1. Calculating the contour interval. Page 2.16
43 Estimating Slope Slope is used by the operations section in several different ways: to estimate the amount of time it takes to construct a fireline; to determine whether or not a dozer, engine, or hand crew can work in a specific area; to calculate pump pressure needed to reach a location; and to calculate fire behavior characteristics, such as rate of spread. On incidents, slope is the degree of inclination or steepness and it is usually expressed in percent. A one percent slope indicates a rise or drop of one unit over a distance of 100 horizontal units. For example, a one percent slope rise would indicate a one foot rise over a 100 foot horizontal distance. Slope can be calculated using a topographic map or it can be determined in the field with a clinometer (see Chapter 4, Using a Compass and Clinometer). To calculate slope using a topographic map, you will need to determine the following: Vertical Distance (also referred to as Rise) This is the difference in elevation between two points; it is calculated by subtracting the elevation of one point from the elevation of the other point. Horizontal Distance (also referred to as Run) This is the distance from one point to the other and is calculated by measuring distance with a ruler and applying the map scale. For example, if the map scale is 1:24,000 and the distance between the two points when measured with a ruler is ½ inch, the horizontal distance would be 12,000 inches or 1,000 feet. Slope can then be calculated using the slope formula: Vertical Distance x 100 = % Slope Horizontal Distance Another way to write the slope formula is: Rise Run x 100 = % Slope There are a number of slope calculation aids in the form of tables that show the relationship between map scale and contour interval. Be careful when using slope calculation aids because they are tailored to specific map scales and contour intervals. Page 2.17


44 Follow the steps in Table 2-2 to estimate the percent of slope between the two points on the topographic map below. Table 2-2. Steps to estimate slope between two points. Page 2.18
 and")

45 Estimating Aspect Aspect is the compass direction that the slope is facing. On a topographic map, use index contour lines (they will tell you the difference in elevation) and the north arrow to determine which direction the slope is facing. Follow the steps in Table 2-3 to estimate aspect of the slope between the two points on the topographic map below. Table 2-3. Steps to estimate aspect Page 2.19
46 Estimating Acreage Area can be expressed in square miles, acres, blocks, square feet, or any other square unit of linear measurement. This section discusses different methods for estimating acreage (area formula, dot grid, planimeter, comparison, and GPS receiver). Refer to the Fireline Handbook (PMS 410-1), Appendix A for additional information on estimating acreage. Area Formula The most common method for calculating area is using the formula: length x width = area. Area is always calculated in square measure, and the answer will be in square units (square feet, square yards, square chains). When calculating area, typical units of measurements include: Linear units of measurement 12 inches = 1 foot 3 feet = 1 yard 5280 feet = 1 mile 66 feet = 1 chain 80 chains = 1 mile feet = 1 meter Area units of measurement 1 acre = 208 feet x 208 feet 1 acre = 43,560 square feet 1 acre = 10 square chains 640 acres = 1 square mile 1 section = 1 square mile* 1/2 section = 320 acres* 1/4 section = 160 acres* 1 hectare = 2.4 acres *Generally the size, but may vary due to surveying deviations. Page 2.20

47 Following are three examples of how to estimate acreage using the area formula: 1. What is the acreage if the length is 2,640 feet and width is 1,320 feet? Remember that 43,560 square feet equals one acre. Table 2-4. Estimate acreage using feet. 2. What is the acreage if the length is 5 chains and width is 10 chains? Remember that 10 square chains equals one acre. Table 2-5. Estimate acreage using chains. Page 2.21


48 3. What is the acreage for an odd shaped area that is 32 chains wide at one end, 16 chains wide at the other end, and 48 chains in length? Table 2-6. Estimate acreage for an odd shaped area. Page 2.22


49 Dot Grid A dot grid is an inexpensive and readily available tool that is used to estimate acreage (Figure 2-15). There are many different types of dot grids. Each dot represents a specific number of acres depending upon the map scale. For example, if you are using the dot grid in Figure 2-16 on a 7.5 minute quad map, each dot represents acres, while on a 15 minute quad map, each dot represents 9.73 acres. Figure A dot grid is used to estimate acreage. Figure This is one example of a dot grid (not to scale). Page 2.23
50 If a dot grid has no scale or you are working with a map where the scale is questionable, it will be necessary to calibrate the dot grid which means you need to determine how many acres each dot represents. Table 2-7 describes how to calibrate a dot grid. Table 2-7. Steps for calibrating a dot grid. Page 2.24


51 Table 2-8 describes how to use a dot grid to estimate the acreage of the fire illustrated below. Table 2-8. Steps for estimating acreage using a dot grid. Page 2.25

52 Planimeter A planimeter is a tool that can be used to measure acreage on a map (Figure 2-17). Use the planimeter to trace around the perimeter a number of times to obtain an average acreage. Figure Planimeter Comparison Another way to estimate the size of an area is by comparing it to areas of a known size. For example, if the area is entirely within a single section then it can be safe to assume it isn t more than 640 acres; if it is the size of a football field the estimate would be one acre. Global Positioning System (GPS) Receiver Several models of GPS receivers have the ability to calculate area (acreage). Page 2.26


53 Estimating Distances Refer to the map scale for measuring distances on the map. On 7.5 minute quad topographic maps the engineer s 20 scale ruler is a nice tool because 20 graduations on the ruler equals 1 inch which equals 2,000 feet. To calculate distances you will need a map wheel (Figure 2-18), string, paper with tick marks, or other measuring tool. A map wheel has a toothed wheel and as it moves it measures distances on maps. Set the map wheel s scale to match the map s scale and then roll the wheel along the route to be measured. Table 2-9 describes the steps to estimate distances using a map wheel. Figure There are different types of map wheels. Table 2-9. Steps for estimating distances using a map wheel. Estimating Percent Contained To estimate percent contained, use this formula: Completed line distance x 100 = Percent contained Perimeter distance Page 2.27
54 Page 2.28

55 Checking Your Understanding Answers to Checking Your Understanding can be found in Appendix B. 1. What is the fractional scale and declination of this map? If you are using a GPS receiver, what datum would you use? Fractional scale: Declination: Datum: Page 2.29

56 2. List the reference coordinates for latitude/longitude and UTM. Reference coordinates latitude: Reference coordinates longitude: Reference coordinates UTM: Page 2.30

57 3. Calculate the contour interval for this map. Contour interval: Page 2.31
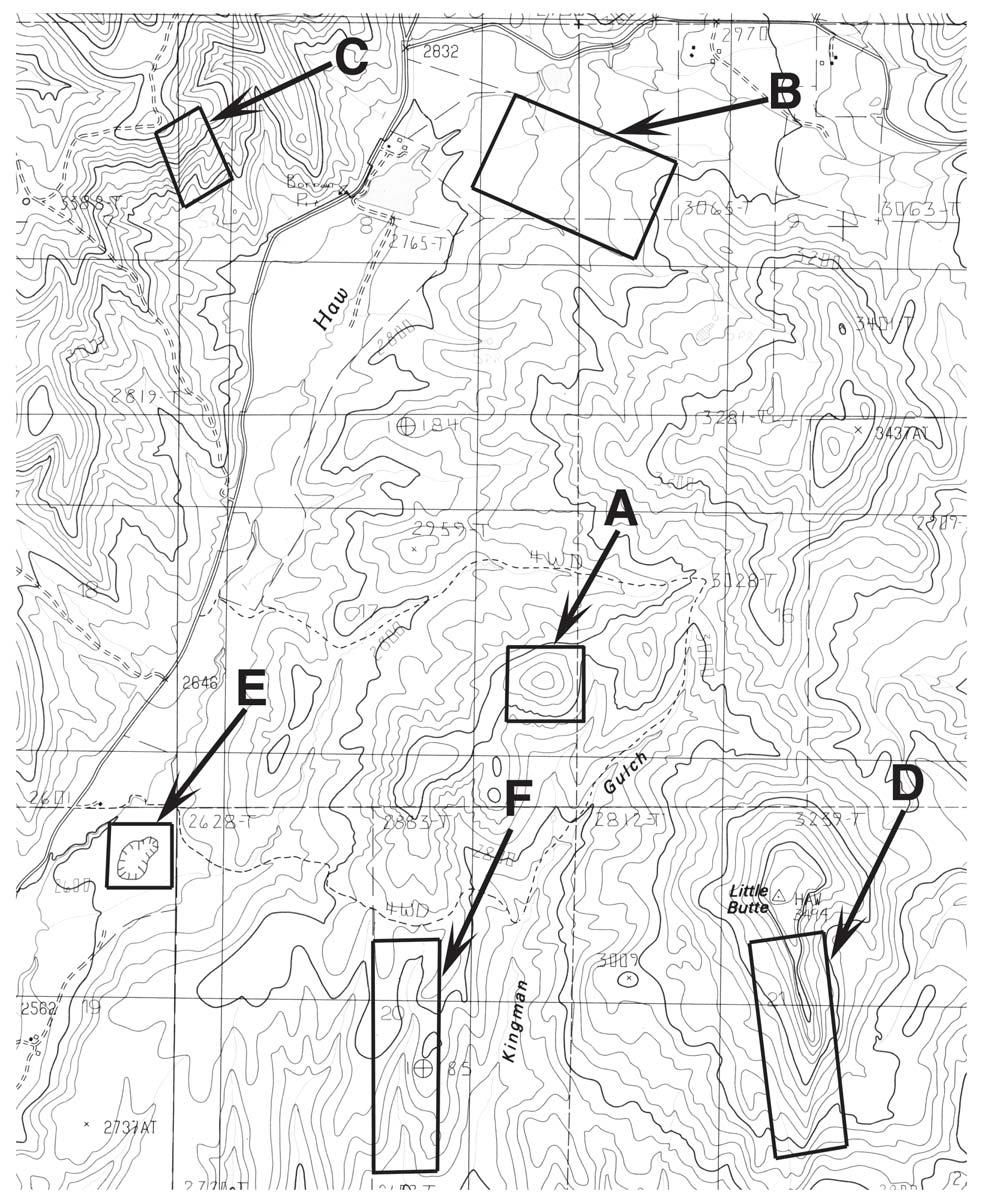
58 4. Draw a profile (similar to a line graph) of the land from point a to point b. Elevation lines are marked in 100-foot increments. Hint: The elevation rises from the 100-foot contour line. 5. Use the map on the next page to identify the topographic feature inside the rectangles lettered A - F with one of these characteristics: stream, hilltop, steep terrain, ridge, depression, and flat terrain. A. B. C. D. E. F. Page 2.32
59 Page 2.33

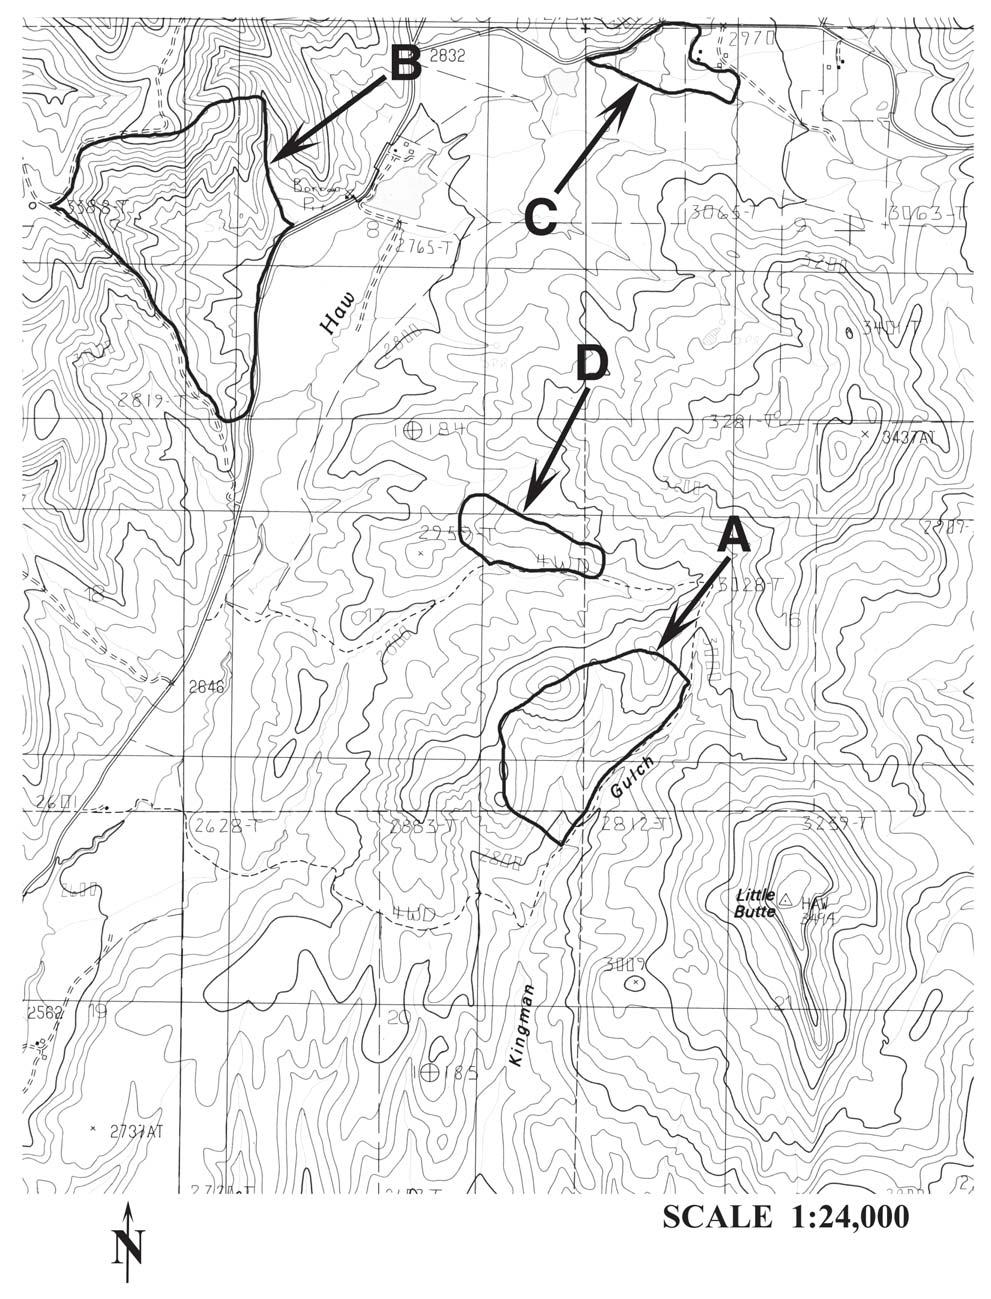
60 6. Estimate the percent slope between A and B. What is the aspect of the slope between A and B? The scale is 1:24,000 (1 inch = 2000 feet). Slope: Aspect: 7. Determine the equivalent unit of measurement for the following: A. 2.5 miles = chains B. 1.5 chains = yards C. 29,040 feet = miles D. 3 chains x 20 chains = acres E. 1/8 of a section = acres 8. Use the map on the next page to estimate the acreage (in acres) within 10% accuracy (+ or -) of fires A - D. A. B. C. D. Page 2.34
61 Page 2.35
62 Page 2.36
63 Chapter 3 Geographic Location Systems In this chapter you will learn about: Latitude and longitude Universal Transverse Mercator (UTM) U.S. Public Land Survey Other geographic location systems Geographic location systems or coordinate systems were developed as a tool to describe specific geographic locations and are used for navigation and mapping. Generally, they consist of a grid of imaginary intersecting lines which are used to describe a position on a map. Most of these systems use coordinate values, which are expressed as numeric or alphanumeric characters, to define geographic locations. Coordinate systems are based on reference points from which position measurements are made. For example, the reference points for latitude and longitude are the prime meridian and equator. This chapter discusses two types of global geographic location systems commonly used in the United States latitude/longitude and UTM. Then, it describes the U.S. Public Land Survey (section, township, and range) and other types of geographic location systems. Refer to Chapter 6, Navigation and Field Mapping, for information on how to plot and map points using geographic location systems. Page 3.1
. Figure 3-1. Latitude and longitude lines. Latitude Latitude lines circle the world parallel with the equator, running in an easterly and westerly direction.")
.")
64 Latitude/Longitude Latitude/longitude is a global system which precisely identifies locations using the equator as a reference point for latitude and the prime meridian as a reference point for longitude (Figure 3-1). Figure 3-1. Latitude and longitude lines. Latitude Latitude lines circle the world parallel with the equator, running in an easterly and westerly direction. These lines are identified by their position either north or south of the equator. The equator is 0 latitude and the North Pole (90 N) and South Pole (90 S) are both 90 latitude. All other points on earth have latitudes ranging between 0 to 90 north or 0 to 90 south. When stating the position coordinates, latitude is always said first (Figure 3-2). Longitude Longitude lines run true north to true south North Pole to South Pole. Longitude is the distance east or west of the prime meridian (Greenwich, England). The prime meridian is 0 longitude. All other points on earth have longitudes ranging between 0 to 180 east and 0 to 180 west. Lines of longitude are not parallel; the closer they are to the poles, the shorter the distance between them. Principal meridian lines run in the same direction as the lines of longitude. Figure 3-2. The coordinates for the point where latitude and longitude meet are described as 30 N, 50 W. Page 3.2
65 Latitude and Longitude Coordinates There are three primary ways of describing locations using latitude and longitude coordinates: 1. Degrees Minutes Seconds (ddd mm' ss.s") This is the most common format that is used on maps: 43 23' 45" 71 8' 36" (Latitude) (Longitude) 2. Degrees Decimal Minutes (ddd mm.mmm') This format is used by aircraft guidance systems: ' Latitude ' Longitude On incidents, this system should be used by personnel to establish common terminology between incident personnel and air operations. 3. Decimal Degrees (ddd.dddd ) This is used by National Weather Service and other agencies, as well as some computer based mapping systems: Latitude Longitude Page 3.3
66 Counting and Converting Minutes and Seconds When working with latitude and longitude, it is essential to know how to count minutes and seconds and be familiar with conversions. Counting minutes and seconds for latitude/longitude is the same as counting time on a clock. When the seconds count reaches 60, carry over and add 1 minute to the minute number in the coordinate, and start counting seconds again from 0. When the minute count reaches 60, carry 1 degree over and add it to the degrees number and start counting minutes again from 0. If the point lies in the western hemisphere, count degrees, minutes and seconds from right to left (east to west). Common conversions include: 60 seconds (60") = one minute (1') 60 minutes (60') = one degree (1 ) 7.5 minutes = 1/8 of 60 minutes = 1/8 of a degree 15 minutes = ¼ of 60 minutes = ¼ of a degree 15 seconds = 0.25 minutes 30 seconds = 0.5 minutes 45 seconds =.75 minutes To convert from degrees minutes seconds to degrees decimal minutes divide the seconds by 60 to get the decimal minutes, for example: 48 20' 30" 30" 60 =.5' ' To convert degrees decimal minutes to degrees minutes seconds multiply the decimal (e.g.,.5) by 60, for example: '.5 x 60 = 30" 48 20' 30" Page 3.4

67 Universal Transverse Mercator (UTM) Universal Transverse Mercator is a global coordinate system that is defined in meters rather than degrees-minutes-seconds. UTM is a very precise method of defining geographic locations; therefore, it is commonly used in GPS and GIS mapping. When using the UTM coordinate system, a location can be identified within a meter. UTM Grid Zones The UTM grid divides the world into 60 north-south zones; the zones are numbered 1-60 (Figure 3-3). Each zone is 6 degrees wide in longitude. The contiguous 48 states has 10 zones. Within each zone is superimposed a square grid, and although the zone lines converge toward the poles, the grid lines do not. Therefore, as one travels north from the equator, the grid becomes smaller, although the grid squares remain the same. Figure 3-3. Universal Transverse Mercator zones. Page 3.5
68 UTM Coordinates UTM uses two coordinates easting and northing to determine a location. Locations within a zone are measured in meters east and west from the central meridian, and north and south from the equator (Figure 3-4). Figure 3-4. Numbering system for UTM coordinates within a zone. Easting coordinate The central meridian is an arbitrary line drawn down the center of each zone, and given a false easting value of 500,000 meters so that only positive eastings are measured anywhere in the zone. Eastings increase eastward and decrease westward from the central meridian. Each zone at its widest point cannot exceed 999,999 meters. As you move north and south from the equator, the zones become narrower, just like meridians of longitude, so, depending on where you are in relation to the equator, the east edge of each zone will end at different distances from the central meridian. Northing coordinate Northing is the distance in meters north and south of the equator (measured along a zone line). If the point lies north of the equator, coordinates always increase from south to north (bottom of map to the top) of the equator, with the equator given a value of 0 meters. For locations south of the equator, the equator is given a false value of 10,000,000 meters and values decrease from north to south. Page 3.6
69 A UTM coordinate includes the zone, easting coordinate, and northing coordinate; this coordinate describes a specific location using meters (Figure 3-5). Figure 3-5. UTM coordinate. There are different ways that UTM coordinates are written, for example: E N mE mN m E m N UTM coordinates are also abbreviated to the extent of accuracy desired; for example, possible abbreviations for UTM E N include: UTM Coordinate Area Covered m by 1000 m square m by 100 m square m by 10 m square m by 1 m square Example: This coordinate E N describes a location in New Hampshire. The coordinate E represents an east-west measurement and is the easting. This coordinate is located meters west of the 19 th zone s central meridian line. This number meters was calculated by subtracting the value of from the false value for the central meridian, which is designated as The location of this coordinate is 202 thousand, 520 meters west of the 19 th zones central meridian line and 4 million, 834 thousand, 360 meters north of the equator. The coordinate N represents a north-south measurement and is the northing. The location of this coordinate is 4,834,360 meters north of the equator in zone 19. Page 3.7
70 U.S. Public Land Survey The U.S. Public Land Survey System is another system that is used to describe locations; however, it is not as precise as latitude/longitude or UTM and it is not a global system. It has been used in several states for over 200 years, with only minor modifications. Similar systems are used in parts of Canada, Australia, and a few other areas of the world. The Public Land Survey System consists of several separate surveys that were used to develop grids for each state. The grid is based on two reference points: a principal meridian running north-south, and a base line running east-west (Figure 3-6). Each grid square represents approximately 36 square miles and is identified as being north or south of a particular base line (township) and east or west of a particular principal meridian (range). Page 3.8
 did not participate in the U.S. Public Land Survey. Page 3.")
71 Figure 3-6. Principal meridians and base lines. There are 34 principal meridians and each one has its own name. Most states on the east coast and Texas (white areas) did not participate in the U.S. Public Land Survey. Page 3.9

72 Townships Township lines, which run east/west and are parallel to the base line, are 6 miles apart (Figure 3-7). Each township is 6 miles square and are numbered based on their location from the principal meridian and base line. For example, the first township line north of the base line is identified as Township 1 North; the second township line north of the base line is identified as Township 2 North, and so on. The township lines south of the base line are numbered the same (Township 1 South, etc.). Ranges Range lines, which run north/south and are parallel to the principal meridian, are 6 miles apart and are numbered much the same as the Township areas (Figure 3-7). For example, the first range line east of the principal meridian is identified as Range 1 East; the second range line east of the principal meridian is identified as Range 2 East, and so on. The range lines west of the principal meridian are numbered the same (Range 1 West, etc.). Figure 3-7. Example of township and range numbering system. Page 3.10
73 Sections Within each township are 36 sections, each one mile square. Each section contains 640 acres. The sections are numbered starting in the northeast corner of the township with section 1 and ending in the southeast corner with section 36 (Figure 3-7). If you remember that the northeast corner is always number 1, and that the numbers go sequentially back and forth to the bottom, you will be able to locate section numbers as necessary. A typical section of 640 acres may be broken down into smaller areas; for example, a half section contains 320 acres, a quarter-section contains 160 acres, half of a quarter contains 80 acres, a quarter of a quarter contains 40 acres, and so on (Figure 3-8). Typically, 2½ acre parcels is the smallest area of a section. Figure 3-8. This 640 acre section is divided into smaller areas. Areas A and B in the bottom row represent 2½ acre parcels. Page 3.11

74 Each area of a section has a unique location description of its own. Below are examples of location descriptions for ½ and ¼ sections within Section 22, Township 5 North, Range 7 West: Area A W½, Sec. 22, T. 5 N., R. 7 W. Area B E½, Sec. 22, T. 5 N., R. 7 W. Area C N½, Sec. 22, T. 5 N., R. 7 W. Area D S½, Sec. 22, T. 5 N., R. 7 W. Area A NW¼, Sec. 22, T. 5 N., R. 7 W. Area B NE¼, Sec. 22, T. 5 N., R. 7 W. Area C SW¼, Sec. 22, T. 5 N., R. 7 W. Area D SE¼, Sec. 22, T. 5 N., R. 7 W. Location description for two separate portions of a section (use and in the description): Area A N½ and SW¼ SE¼, Sec. 22, T. 5 N., R. 7 W. Page 3.12
75 Proper descriptions of locations have the section written first followed by the township and range. Descriptions start with the smallest area and end with the largest area. Sometimes, the easiest way to interpret location descriptions is to read them backwards. For example, this is a location description in Leon County, Florida: SE ¼, Sec.8, T.2N, R.3E, Florida, Tallahassee Meridian or Southeast ¼ of section 8, township 2 north and range 3 east, Florida, Tallahassee Meridian Other Geographic Location Systems Military Grid Reference System (MGRS) The Military Grid Reference System is an extension of the UTM system. It is a global reference system used by the U.S. Armed Forces and North Atlantic Treaty Organization (NATO) to locate points on earth. The coordinates are 2 to 10 digits which represent a precision range of 10 kilometers to 1 meter. Spanish Land Grants In the southwestern United States, a township frequently will be occupied partially by a Spanish Grant. United States Government Surveys do not cover areas under these grants the survey stops at the grant boundary. For field references you can just continue known township and range lines into the grant and use the Township/Range description. Metes and Bounds Metes and Bounds is a regional system that is a common method of land division in the eastern United States. Metes and bounds is a system of establishing boundaries of tracts of land by reference to natural or artificial monuments along it, as distinguished from those established by beginning at a fixed starting point. State Land Coordinate Systems Established in several western states, these systems were developed to measure and record boundary lines, monuments, and other features. Page 3.13
76 Page 3.14
77 Checking Your Understanding Answers to Checking Your Understanding can be found in Appendix B. 1. What are two common global coordinate systems used in the United States? 2. Latitude is a measure of how far or a point is from the. Longitude is a measure of how far or a point is from the. 3. On USGS topographic maps, UTM grid lines are marked every meters. 4. This is an abbreviated UTM coordinate: 5 66E and 51 96N. How else could it be written? 5. Given this UTM position in Montana E N the easting is located meters east of the 12th zone central meridian and the northing is located meters north of the 12th zone equator. Page 3.15
78 6. Write the acreage and location description (section, township and range) for each of the lettered areas. A. Acres: Location Description: B. Acres: Location Description: C. Acres: Location Description: D. Acres: Location Description: E. Acres: Location Description: F. Acres: Location Description: G. Acres: Location Description: H. Acres: Location Description: I. Acres: Location Description: J. Acres: Location Description: 7. Name two other Geographic Location Systems besides latitude/longitude, UTM, and U.S. Public Land Survey. Page 3.16
79 Chapter 4 Using a Compass and Clinometer In this chapter you will learn about: Parts of a compass Tips on getting accurate compass readings Adjusting a compass for magnetic declination Orienting a compass Taking bearings (direct and back) Following bearings Estimating slope with a clinometer A compass is an instrument that is used for navigation and mapping because it measures the geographic direction between two points. It is a fairly simple instrument that uses a magnet, mounted on a pivot that turns in response to the earth s magnetic field, to determine direction (but not position). The magnetic needle points to the magnetic North Pole, which is different from geographic North Pole. A compass bearing, which is typically expressed as an angle (degrees), refers to the horizontal direction to or from any point. In this publication, the term bearing is used interchangeably with the term azimuth. A compass is used for several different purposes including: Determine direction to a destination or landmark. Stay on a straight course to a destination or landmark, even if you lose sight of it. Avoid obstacles in the path to the destination or landmark. Return to your starting point. Pinpoint locations on a map and in the field. Identify what you are looking at in the field or on a map. Orient a map. Plot points on a map. Plot route of travel on a map. There are a variety of different types and models of compasses, such as baseplate, sighting, prismatic, and electronic. This chapter focuses on using a baseplate compass because it is a common, inexpensive, and easy to use compass that does not require batteries. This chapter starts with discussing the parts of a compass and tips on getting accurate readings. Then it describes adjusting a compass for magnetic declination. Finally it provides step by step instructions on orienting a compass, taking bearings (direct and back bearings), following bearings, and estimating slope with a clinometer. Refer to Chapter 6, Navigation and Field Mapping, for information on using a compass with a map. Chapter 6 also discusses how to use the compass as a protractor to take a bearing from a map. Page 4.1
80 Parts of a Compass The basic parts of a base-plate compass are described below and illustrated in Figure 4-1. Magnetic needle. The magnetic needle typically has a red end that points to magnetic north, as long as the compass is being used properly and there is no local magnetic attraction. Housing with cardinal points and degrees. The housing includes a revolving dial that shows the cardinal points (at least north, east, south, and west) and degrees (0 360) (Figure 4-2). The housing is rotated to line up the compass needle with the orienting arrow when taking a bearing. Orienting arrow. The north-south orienting arrow (red or black outline of an arrow) is used to align the magnetic needle when taking a bearing. It is also what is adjusted to set the compass for magnetic declination. Orienting lines. The north-south orienting lines parallel the orienting arrow and can be used to line up the compass dial with grid lines on a map. When the declination is set on a compass with an adjustment screw, the orienting lines no longer parallel the orienting arrow. Index line. Marked on the front sight of the compass base plate, the index line is where you read the indicated bearing. Direction of travel arrow. The direction of travel arrow or sighting line is used for sighting and following bearings. The arrow should be pointed in the direction of the destination or landmark. Base plate. The transparent plate (everything is attached to the baseplate) can be used as a ruler to measure map distances. The direction of travel arrow is also located on the baseplate. Some compasses will have a protractor on the baseplate that can be used to determine bearings from a map. Magnifying lens. Useful for reading tiny map symbols and features. Declination adjustment screw. Some compasses have a screw that can be turned to set compass for proper declination. Some compasses have an internal adjustment that automatically corrects for declination. Clinometer. Some compasses have a clinometer that can be used to estimate slope. Sighting mirror. Some compasses have a flip up mirror that can improve accuracy when reading bearings. Read the bearing in the dial s reflection where the mirror line crosses it. It can also be used for signaling. Page 4.2

81 Figure 4-1. Parts of a compass. Figure 4-2. Cardinal points and degrees. Page 4.3
82 Tips on Getting Accurate Compass Readings A small error when using a compass can result in a significant error in measurement on the ground. To obtain accurate readings when using a compass: Hold the compass level and steady so the needle swings freely. Hold the compass about waist high in front of the body, except when using a compass with a sighting mirror or a sighting type compass. Raise and lower eyes when taking a bearing, do not move your head. Always use the same eye when taking bearings. Directly face object that is being measured. Magnetic fields will give incorrect compass readings. Avoid taking readings near magnetic fields such as steel, iron (ferrous metals), vehicles, rebar, and clipboards. Even belt buckles, glasses, and rings can interfere with the compass reading. Take bearing twice. Adjust for magnetic declination as appropriate. Follow the direction of travel arrow, not the compass needle, when walking a bearing. Always follow the line indicated by the compass rather than relying on judgment as to the direction. Use back bearings to ensure you are on track when navigating. Page 4.4

83 Adjusting a Compass for Magnetic Declination The compass needle always points toward magnetic north; however, topographic maps are drawn in reference to true north (North Pole). The difference between magnetic north and true north is called the angle of magnetic declination, or simply, the declination. Therefore, when using a map and compass together, an adjustment has to be made for declination. Magnetic declination not only changes with geographic location, but also changes slightly over time. In the contiguous U.S., the magnetic declination generally varies between zero and twenty degrees (Figure 4-3). Only along the zero declination line are true north and magnetic north the same, and therefore, no adjustment has to be made for declination (this is the dark, heavy line labeled as 0 in Figure 4-3). Figure 4-3. Declination chart of United States. Page 4.5
84 When someone is using their compass in a location that is east of the zero declination line (for example Maine), the needle will point in a direction that is west of true north this is referred to as westerly declination. When someone is using a compass in a location that is west of the zero declination line (for example Nevada), the needle will point in a direction that is east of true north this is referred to as easterly declination. Magnetic Declination on Topographic Maps Magnetic declination is printed in the lower left hand corner on USGS topographic maps in the arrow diagram or in the information block. Since declination does slightly change over time, topographic maps of the same area can have different declinations if the maps were published on different dates. There are web sites that will provide declination when a zip code is entered. Adjusting a Compass Making an adjustment for declination is essential when using a map and compass together. Either the map or the compass needs to be adjusted for declination. It is generally easier to adjust the compass for declination, rather than the map. When the compass is adjusted then geographic north is the reference point for both the compass and the map. The process for adjusting declination on a compass depends upon the type of compass; therefore, refer to the owner s manual for specific instructions. Some compasses have a declination screw that can be turned which rotates the orienting arrow. Others require the rotation of the center of the case so the orienting arrow is offset by declination. Some compasses are automatically adjusted. It is important to be accurate when setting declination because 1 degree off can result in 920 feet off course in 10 miles. Page 4.6


85 Orienting a Compass There are two different ways to orient a compass to magnetic north or geographic north. The purpose of orienting a compass is so you know your location in relation to north. Orienting a compass to north is also called boxing the needle because it refers to aligning the north seeking end of the magnetic needle over the orienting arrow. Orient to Magnetic North One method for orienting the compass to magnetic north is described in Table 4-1 and illustrated in Figure 4-4. Table 4-1. Steps to orient a compass. Figure 4-4. Orient a compass. Page 4.7
86 Orient to Geographic North If you are going to use your compass with a map, then orient the compass to geographic north. Adjust the compass for magnetic declination and then follow the steps in Table 4-1. Taking Bearings (Direct and Back) Taking a bearing refers to measuring the direction from one point to another, either in the field or on a map. A bearing is the measurement of direction between two points and it is typically expressed as an angle, for example 30 degrees. Bearings taken with a compass that has not been adjusted for magnetic declination are called magnetic bearings. Whereas bearings taken with a compass that has been adjusted for magnet declination are called true bearings. This section focuses on taking a direct and back bearing in the field and Chapter 6, Navigation and Field Mapping, addresses how to take a bearing on a map. Taking a Direct Bearing A direct bearing is measured from your position towards an object. It tells you the direction from you to the object, destination or landmark. One method for taking a direct bearing is described in Table 4-2 and illustrated in Figure 4-5. Page 4.8

87 Table 4-2. How to take a direct bearing. Figure 4-5. Taking a direct bearing. Page 4.9
88 Taking a Back Bearing A back bearing, which is sometimes called backsighting, is the exact opposite of a bearing it is measured from the object to your position. The back bearing differs by 180 or the opposite direction from the direct bearing (Figure 4-6). Figure 4-6. Direct and back bearing. Two common methods for determining a back bearing include: Using a compass similar process to taking a direct bearing, but instead take a back bearing by aligning the south end of the needle with the orienting arrow. Using addition and subtraction. If the direct bearing is between zero and 180 add 180 to find the back bearing. For example, if the direct bearing is 60 the back bearing is 240. If the direct bearing is between 180 and 360 subtract 180 to find the back bearing. Back bearings are important because they can be used to communicate your position to someone else, for example, I am located 145 from the cell tower. They are also used when navigating to help ensure you are on course. Page 4.10

89 Following Bearings One of the main reasons for using a compass is to help you follow a straight course to a destination. A bearing can help you stay on course even if you lose sight of your destination due to terrain, vegetation, fog, smoke or other conditions. Following a bearing refers to setting a bearing on the compass and then following that bearing along a line to the destination. If the final destination is a long distance from starting point or if it is visually obstructed (due to vegetation, terrain, weather, or other condition) look for an intermediate destination (boulder, landmark, identifiable tree) that is on that same bearing. If there are no visible intermediate destinations, another person can serve as the intermediate destination. One method for following bearings is described in Table 4-3 and illustrated in Figure 4-7. Table 4-3. How to follow a bearing. Page 4.11
90 Figure 4-7. Following a bearing. Page 4.12


91 Estimating Slope with a Clinometer A clinometer is an instrument that measures the angle of a slope. It can also be used to measure elevation or height. There are different types of clinometers and they have different scales. Table 4-4 outlines one method to estimate slope using a clinometer, which is illustrated in Figure 4-8. Table 4-4. Steps to estimate slope using a clinometer. Figure 4-8. Estimating slope with a clinometer. Page 4.13
92 Some compasses have a built-in clinometer; however, when using the clinometer on a compass, the slope is reported in degrees, not percent. Figure 4-9 illustrates a general relationship between percent slope and degree slope. Refer to the compass owner s manual for instructions on estimating slope using the built-in clinometer and conversion information. Figure 4-9. General relationship between percent slope and degree slope. Page 4.14

93 Checking Your Understanding Answers to Checking Your Understanding can be found in Appendix B. 1. List three examples of how you may use a compass on an incident. 2. Label the seven parts of a compass. Page 4.15
94 3. List five tips on how to obtain accurate compass readings. 4. How do you adjust your compass for declination? How do you know what the declination is for the area where you are working? 5. What are the two different ways to orient a compass? 6. The following exercises will improve your performance. Practice taking direct bearings and back bearings of various objects. Take a compass bearing of a distant object. Mark your starting location, walk to your object. Now take a back bearing and follow that bearing. How far off were you from your starting point? Practice estimating slope using a clinometer. Page 4.16
95 Chapter 5 Global Positioning System In this chapter you will learn about: How the Global Positioning System works Using a GPS receiver The Global Positioning System (GPS) is a satellite based navigation system that can be used to locate positions anywhere on earth. Designed and operated by the U.S. Department of Defense, it consists of satellites, control and monitor stations, and receivers. GPS receivers take information transmitted from the satellites and uses triangulation to calculate a user s exact location. GPS is used on incidents in a variety of ways, such as: To determine position locations; for example, you need to radio a helicopter pilot the coordinates of your position location so the pilot can pick you up. To navigate from one location to another; for example, you need to travel from a lookout to the fire perimeter. To create digitized maps; for example, you are assigned to plot the fire perimeter and hot spots. To determine distance between two points or how far you are from another location. The purpose of this chapter is to give a general overview of the Global Positioning System, not to teach proficiency in the use of a GPS receiver. To become proficient with a specific GPS receiver, study the owner s manual and practice using the receiver. The chapter starts with a general introduction on how the global positioning system works. Then it discusses some basics on using a GPS receiver. Page 5.1
96 How the Global Positioning System Works The basis of the GPS is a constellation of satellites that are continuously orbiting the earth. These satellites, which are equipped with atomic clocks, transmit radio signals that contain their exact location, time, and other information. The radio signals from the satellites, which are monitored and corrected by control stations, are picked up by the GPS receiver. A GPS receiver needs only three satellites to plot a rough, 2D position, which will not be very accurate. Ideally, four or more satellites are needed to plot a 3D position, which is much more accurate. Three Segments of GPS The three segments of GPS are the space, control, and user (Figure 5-1). Figure 5-1. Three segments of GPS. Page 5.2
97 Space Segment Satellites orbiting the earth The space segment consists of 29 satellites circling the earth every 12 hours at 12,000 miles in altitude. This high altitude allows the signals to cover a greater area. The satellites are arranged in their orbits so a GPS receiver on earth can receive a signal from at least four satellites at any given time. Each satellite contains several atomic clocks. The satellites transmit low radio signals with a unique code on different frequencies, allowing the GPS receiver to identify the signals. The main purpose of these coded signals is to allow the GPS receiver to calculate travel time of the radio signal from the satellite to the receiver. The travel time multiplied by the speed of light equals the distance from the satellite to the GPS receiver. Control Segment The control and monitoring stations The control segment tracks the satellites and then provides them with corrected orbital and time information. The control segment consists of five unmanned monitor stations and one Master Control Station. The five unmanned stations monitor GPS satellite signals and then send that information to the Master Control Station where anomalies are corrected and sent back to the GPS satellites through ground antennas. User Segment The GPS receivers owned by civilians and military The user segment consists of the users and their GPS receivers. The number of simultaneous users is limitless. How GPS Determines a Position The GPS receiver uses the following information to determine a position. Precise location of satellites When a GPS receiver is first turned on, it downloads orbit information from all the satellites called an almanac. This process, the first time, can take as long as 12 minutes; but once this information is downloaded, it is stored in the receiver s memory for future use. Distance from each satellite The GPS receiver calculates the distance from each satellite to the receiver by using the distance formula: distance = velocity x time. The receiver already knows the velocity, which is the speed of a radio wave or 186,000 miles per second (the speed of light). To determine the time part of the formula, the receiver times how long it takes for a signal from the satellite to arrive at the receiver. The GPS receiver multiplies the velocity of the transmitted signal by the time it takes the signal to reach the receiver to determine distance. Page 5.3
98 Triangulation to determine position The receiver determines position by using triangulation. When it receives signals from at least three satellites the receiver should be able to calculate its approximate position (a 2D position). The receiver needs at least four or more satellites to calculate a more accurate 3D position. The position can be reported in latitude/longitude, UTM, or other coordinate system. Sources of Errors The GPS is not a perfect system. There are several different types of errors that can occur when using a GPS receiver, for example: User mistakes User mistakes account for most GPS errors; and a GPS receiver has no way to identify and correct these mistakes. Common examples of user mistakes include: Inputting incorrect information into a GPS receiver, such as the datum, and when creating a waypoint. Unknowingly relying on a 2D position instead of a 3D position for determining position coordinates. This mistake can result in distance errors in excess of a mile. The signal from the satellite may be blocked by buildings, terrain, electronic interference, and sometimes dense foliage. A GPS receiver needs a fairly clear view of the sky to operate. The human body can cause signal interference. Holding a GPS receiver close to the body can block some satellite signals and hinder accurate positioning. If a GPS receiver must be hand held without benefit of an external antenna, facing to the south can help to alleviate signal blockage caused by the body because the majority of GPS satellites are oriented more in the earth s southern hemisphere. Multipath interference Multipath interference is caused by the satellite signal reflecting off of vehicles, buildings, power lines, water and other interfering objects (Figure 5-2). Multipath is difficult to detect and sometimes impossible for the user to avoid or for the receiver to correct. When using a GPS receiver in a vehicle place the external antenna on the roof of the vehicle to eliminate most signal interference caused by the vehicle. If the GPS receiver is placed on the dashboard there will always be some multipath interference. Page 5.4
99 Figure 5-2. Sources of signal interference. Satellite and receiver clock errors These can be slight discrepancies in the satellite s atomic clocks which may cause slight position errors in the GPS receiver. Errors are monitored and corrected by the Master Control Station. Orbit errors Satellite orbit pertains to the altitude, position, and speed of the satellite. Satellite orbits vary due to gravitational pull and solar pressure fluctuations. Orbit errors are also monitored and corrected by the Master Control Station. Satellite geometry The location of GPS satellites in relation to a GPS receiver on the ground can impact the receiver s ability to triangulate a 3D position. The quality of a receiver s triangulated position improves the further apart GPS satellites are located from each other in the sky above the receiver. The quality decreases if the satellites are grouped close together in the sky above the receiver. Atmospheric interference The atmosphere can slow or speed up the satellite signal. Fortunately, error caused by atmospheric conditions (ionized air, humidity, temperature, pressure) has been reduced with the implementation of the Wide Area Augmentation System (WAAS), which is discussed later in this chapter. Page 5.5
100 Selective Availability Selective Availability is the intentional degradation (limits accuracy of satellite signals) of the GPS system by the U.S. Department of Defense for security reasons. At this time there is no Selective Availability in force; however, it can be reactivated without notice to GPS users. Correction systems Correction systems have been designed to reduce some of the sources of error with GPS. Real-time Differential GPS Real-time Differential GPS (DGPS) employs a second, stationary GPS receiver at a precisely measured spot, usually established through traditional survey methods (Figure 5-3). This receiver corrects or reduces errors found in the GPS signals, including atmospheric distortion, orbital anomalies, Selective Availability (when it existed), and other errors. A DGPS station is able to do this because its computer already knows its precise location, and can easily determine the amount of error provided by the GPS signals. DGPS cannot correct for GPS receiver noise in the user s receiver, multipath interference, and user mistakes. In order for DGPS to work properly, both the user s receiver and the DGPS station receiver must be accessing the same satellite signals at the same time. Figure 5-3. Real-Time Differential GPS. Page 5.6
101 Wide Area Augmentation System The Wide Area Augmentation System (WAAS) is an experimental system designed to enhance and improve aircraft flight approaches using GPS and WAAS satellites. The WAAS can be considered an advanced real-time differential GPS. It uses its own geo-stationary satellites positioned over the equator to transmit corrected GPS signals to receivers capable of receiving these signals. Problems with WAAS include poor signal reception under dense tree canopy and in canyons, as well as decreased capability in northerly latitudes. Many GPS receivers are now capable of receiving the WAAS signal. However, WAAS should not be considered a consistently reliable source for improving the accuracy of GPS until the technology improves. Using a GPS Receiver There are several different models and types of GPS receivers. Refer to the owner s manual for your GPS receiver and practice using it to become proficient. When working on an incident with a GPS receiver it is important to: Always have a compass and a map. Have a GPS download cable. Have extra batteries. Know memory capacity of the GPS receiver to prevent loss of data, decrease in accuracy of data, or other problems. Use an external antennae whenever possible, especially under tree canopy, in canyons, or while flying or driving. Set up GPS receiver according to incident or agency standard regulation; coordinate system. Take notes that describe what you are saving in the receiver. Page 5.7
102 Inputs Each time you use a GPS receiver, you will need to input information such as: Position format units (example: UTM 11T m E m N). This input determines the way positions are displayed on the receiver screen. For example, sometimes you may want to use latitude/longitude coordinates and other times it may be better to use UTM coordinates. Map datum (example: WGS 84, NAD 27 and NAD 83). This input ensures that your GPS receiver and map are both using the same datum, which is extremely important for accuracy. Distance units (feet, miles, meters). Elevation units (feet or meters). North reference (true, magnetic, or grid). Time format (12 or 24 hour) and time zone. Waypoints A waypoint is a position based on geographic coordinate values, such as latitude/longitude and UTM, stored in the GPS receiver s memory. They are sometimes referred to as landmarks. Once the waypoint is saved it remains static in the GPS receiver s memory until edited or deleted. How Waypoints are Determined A waypoint can either be a saved position fix or can be created by manually entering coordinates into the receiver. To turn a position location into a waypoint is simply a matter of saving the receiver s current position as a waypoint. The receiver will give the position coordinates an alpha-numeric name or the user can designate a name. Once a position fix is saved, it becomes a waypoint with static coordinates saved in the receiver s memory. Users can enter waypoints into the GPS receiver. For example, coordinates on a map or coordinates radioed in from a remote location can be entered into a GPS receiver. Page 5.8
103 Naming Waypoints The GPS receiver will automatically name waypoints with an alpha-numeric name; however, it is best if you designate a unique name for each waypoint so you will know exactly what the waypoint is referring to. Use short descriptive designations because long names can be hard to read when they are downloaded. You can make up your own names as long as you know what they are. Some possible designations include: D1, D2, D3 for different dozer lines HL1, HL2, HL3 for different handlines DP1, DP2, DP3 for different drop points H1, H2, H3 for different helispots A1, A2, A3 for different access points Record a description of each waypoint in your notes, otherwise it will be difficult to remember. Routes Routes are just a sequence of waypoints (Figure 5-4). When navigating a route, the GPS receiver will automatically change the destination waypoint to the next waypoint on the list as it reaches each waypoint. Once one waypoint is passed, the GPS receiver will navigate to the next waypoint. When a route is first activated, the GPS receiver will assume that the first leg is A to B. B is the waypoint being navigated to and A is the anchor point that defines the first leg of the route. Figure 5-4. Example of a route that is displayed on a GPS receiver screen. Page 5.9
104 Terminology There is a lot of terminology associated with using a GPS receiver. Some of the common terms are defined below and illustrated in Figure 5-5. Figure 5-5. GPS navigation terminology. Active from Waypoint This is the starting waypoint or the receiver s last waypoint in an active route. Active GOTO Waypoint This is the designated destination in the receiver, whether in an active route or as a single waypoint. Active Leg Active leg is always a straight line between the last waypoint and the GOTO waypoint. A GPS receiver always plots the most efficient, straight-line course of travel between two points the active leg. If the receiver is following a route, the active leg will be the desired track between the last waypoint in the route, and the next waypoint in the route. If the receiver has deviated from the route, the receiver selects the closest leg to its position and makes it the active leg in the route (the next waypoint in the route list becomes the GOTO destination waypoint). Page 5.10
105 Bearing (BRG)/Desired Track (DTK) In GPS the term bearing is used instead of azimuth. As used in GPS, bearing is the compass direction (expressed in degrees) from the present position to desired destination waypoint or the compass direction between any two waypoints. Course Deviation Indicator (CDI) This graphically shows the amount and direction of Crosstrack Error. Course Made Good (CMG) or Course Over Ground (COG) This is the present direction of travel expressed in degrees from north. It is not necessarily the most direct path. Crosstrack Error (XTE) This is the distance off the desired track (active leg) on either side of the active leg. It s the linear difference between the Desired Track (DTK) and your actual Course Made Good (CMG). Desired Track (DTK) This is a function of GOTO. It is shown in degrees from north. DTK is measured along the active leg (a straight line between two waypoints in a route) or from your current position to a designated GOTO waypoint, when not navigating a route. Estimated Position Error (EPE) A measurement of horizontal position error in feet or meters based upon a variety of factors including dilution of precision (DOP) and satellite signal quality. Estimated Time En Route (ETE) The time left to destination based upon present speed and course. Estimated Time of Arrival (ETA) Fix The time of day of arrival at a destination A single position with latitude, longitude (or grid position), altitude, time, and date. Page 5.11
106 GOTO Function The GOTO function gives GPS receivers the capability of leading a person to any specified place. Simply enter the coordinate of desired destination into the GPS receiver as a waypoint and then, by using the GOTO function, tell the receiver to guide to destination. The receiver guides to destination using a steering screen. There are several different versions of a steering screen, but they all point in the direction needed to travel to from present position to the waypoint selected. GOTO Waypoint If traveling from one waypoint to another (using GOTO), then XTE will show the distance of deviation of your actual route from the active leg (a straight line) between those waypoints. Speed Over Ground (SOG) This is the velocity you are traveling. Tracking (TRK)/ Heading (HDG) This is the direction you are actually traveling or heading, expressed in degrees from north. Track Log A track log is the GPS unit s record of travel or where you have been. As you move along, your every movement is being stored. Receivers with a TracBack feature will allow you to reverse your route taking you back the same way you originally traveled. As you move along, most GPS receivers show your track on a map screen. Velocity Made Good (VMG) Velocity made good is the speed at which the destination is approached. If you are directly on course, VMG is the same value as SOG, but if you stray from course, VMG decreases and is less than SOG. Page 5.12
107 Checking Your Understanding Answers to Checking Your Understanding can be found in Appendix B. 1. Practice storing and naming waypoints and tracks using a GPS receiver. 2. Determine how many waypoints your GPS receiver can store in the memory. 3. List three ways you can prevent making user mistakes when using a GPS receiver. 4. List three things that are important to do when you are taking a GPS receiver with you on an incident. 5. How should you name waypoints? Page 5.13
108 Page 5.14
109 Chapter 6 Navigation and Field Mapping In this chapter you will learn about: Orienting maps Measuring a bearing on a map Plotting points on a map using latitude/longitude Plotting points on a map using UTM Estimating your own position location Estimating unknown position locations Estimating distance on the ground Field mapping Taking notes Navigation and field mapping skills will help you know where you are, where you are going, how you are going to get there, how long it will take, and when you will get back. Even in rough terrain and poor visibility these skills can help you get to your destination by choosing the best route with the least resistance. Always have a compass and map when navigating, do not rely only on a GPS receiver. Field mapping is also important because operational decisions are made based on the information on the field maps. This chapter builds on what you learned in all the other chapters. It starts with how to orient a map. Then it outlines the steps on how to measure a bearing on a map, plot points using latitude/longitude and UTM coordinates, estimate your own position location, and estimate unknown position locations. Next it discusses the different methods for estimating distance on the ground, such as pacing. Finally, it addresses field mapping and note taking. To complete the Checking Your Understanding section in this chapter you will need the following tools: Compass Protractor Engineer s 20 scale ruler UTM grid reader Appendix C, Tools and Resources, has a copy of a protractor, engineer s 20 scale ruler, and UTM grid reader that can be photocopied on a clear plastic sheet. After photocopying, check to make sure the scale has not changed. The methods described in this chapter are based on geographic north (not magnetic north) being the point of reference. In other words, the compass is adjusted for declination not the map. Page 6.1


110 Orienting Maps Orienting the map to true north is key to navigating successfully. Orienting a map also gives you a general idea of your own location on the map. This section describes two methods to orient a map: topographical orientation and compass orientation. Orienting a Map with Topographical Features Table 6-1 describes how to orient a map with topographic features and is illustrated in Figure 6-1. Table 6-1. Steps to orient a map using topographical features. Figure 6-1. Orient a map using topographical features. Page 6.2


111 Orienting a Map with a Compass If there are limited topographical features for orienting a map, then orient the map with a compass. However, adjust the compass for declination before using it with a map. One method for orienting a map with a compass is described in Table 6-2 and illustrated in Figure 6-2. Table 6-2. Steps to orient a map using a compass. Figure 6-2. Orienting a map with compass. Page 6.3
112 Measuring a Bearing on a Map The main reason for measuring a bearing on a map is to help with navigation, for example: You know where you are on the map and you want to go towards the Incident Command Post (ICP), which is on the map, but it is several miles away over hilly terrain. You know where you are on the map and you want to go to a higher elevation for a better view of a potential safety zone, but you can t get there directly because of a wetland. You know where you are on the map and you want to go to the lookout, but you can t see it because of morning fog. A protractor or compass can be used to measure a map bearing; a protractor is easier to use and more accurate than a compass. There are different types of protractors, but a common one is made out of flat clear plastic and is in the shape of a semi-circle with degree marks. Page 6.4


113 Using a Protractor to Measure a Bearing on a Map Table 6-3 describes one method of how to measure a bearing using a protractor and is illustrated in Figure 6-3. Table 6-3. Steps to measure a bearing on a map using a protractor. Figure 6-3. Measuring a bearing with a protractor. Page 6.5


114 Using a Compass to Measure a Bearing on a Map A compass can also be used to measure a bearing on a map. One way to measure a magnetic bearing is described in Table 6-4 and illustrated in Figure 6-4. Table 6-5 describes one way to measure a true bearing. Table 6-4. Steps to measuring a magnetic bearing on a map using a compass. Figure 6-4. Measuring a bearing with a compass where the edge of the base plate touches both the start point (unimproved road) and destination point (lake that is east of spillway elevation 3008 point). Page 6.6

115 Table 6-5. Steps to measuring a true bearing on a map using a compass. Plotting Points on a Map using Latitude/Longitude There are many ways to plot points on a map using latitude/longitude; this section describes one method. The grid system of intersecting lines that is used in the latitude/longitude coordinate system makes it easier to plot a point. Once you know how to plot points you can use the same method to determine the coordinates of a point. Examples of when you may need to plot a point on a map or determine the coordinates of a point include: To map the location of a safety hazard that is near the fire perimeter. To communicate the location of a potential drop site or water source. To map the location of a hot spot. To assist with navigation. When working with latitude/longitude coordinates, it is very important to clearly communicate (verbally or written) the coordinates to other incident personnel. It is extremely easy to say the wrong latitude or longitude. The method described in this section is used only for points located in the northern hemisphere; if the point is in the southern hemisphere there is a different process. Page 6.7
116 Rulers Two types of rulers, engineer s ruler and latitude/longitude ruler, are often used to measure latitude and longitude of a point or to plot coordinates. Graduation marks on the ruler may be in seconds, tenths of a minute, or other unit. With either type of ruler, latitude needs to be measured with the ruler oriented north and south; whereas for measuring longitude the ruler needs to be placed diagonally (since the distance between longitude lines is not constant). The engineer s ruler or scale needs to have 20 graduations per inch. The primary function of the engineer s ruler is to measure distance: 1 inch equals 2000 feet on a 1:24,000 scale topographic map. An engineer s ruler or scale, with 20 graduations per inch (Figure 6-5), can be used for measuring latitude/longitude on a 1:24,000 scale topographic map where each graduation is equal to 1 second. Figure 6-5. Engineer s 20 scale ruler (not to scale). The latitude/longitude ruler usually has minutes and seconds on one edge and decimal minutes on the other edge (Figure 6-6). These rulers are specifically made for different map scales and they come in different increments. Make sure the scale on the ruler matches the map scale. Figure 6-6. Latitude/longitude ruler (not to scale). Page 6.8

117 Plotting Latitude and Longitude When plotting latitude/longitude, it may be helpful to draw the latitude/longitude lines on the map as illustrated in Figure 6-7. You can use these lines as a reference when plotting points. Figure 6-7. Draw the latitude/longitude lines on the map for reference when plotting points. Page 6.9
 is used in the illustrations. Table 6-6.")
118 Tables 6-6 and 6-7 illustrate the steps for plotting the coordinate 43-23'-45" latitude and 71º-08'-36" longitude. An engineer s ruler (each graduation equals one second) is used in the illustrations. Table 6-6. Steps for plotting the latitude coordinate 43-23'-45" On this map there are two latitude lines identified with tick marks. Page 6.10


119 The first latitude line south of the given latitude coordinate is 43 22' 30". It is 1'15" or 75" from the given coordinate. Page 6.11


120 Measure the difference (1'15" or 75") on the ruler and plot the point. Page 6.12

121 The latitude coordinate 43 23' 45" is marked with the dashed line. Page 6.13
122 Table 6-7. Steps for plotting the longitude coordinate 71-08'-36" On this map there are two longitude lines identified with tick marks. Page 6.14


123 The first longitude line east of the given longitude coordinate is 71º-07'-30". The first longitude line west of the given longitude coordinate is 71º-10'-00". Page 6.15


124 The longitude coordinate 71º-08'-36" is 1' 6" or 66" from the eastern longitude line. The point represents the coordinate: 43º-23'-45" 71º-08'-36" Page 6.16
125 Plotting Points on a Map using UTM When working with UTM coordinates it is essential to have a UTM grid reader. There are many different types of UTM readers and they all work differently; one example is illustrated in Figure 6-8. A grid reader is usually printed on a transparent plastic sheet. Appendix C has a grid reader that you can photocopy on a transparent plastic sheet. When using a grid reader to plot points on a map, the scale on the grid reader must match the scale of the map. Figure 6-8. This is a UTM grid reader for 1:24,000 map scale (not to scale). The 1 represents 100 meters, 2 represents 200 meters, and so on. The numbers on the right are used to determine the northing coordinate location and the numbers on the top are used to determine the easting coordinate location. The point is plotted in the top right corner. Page 6.17

126 Table 6-8 illustrates the steps for plotting the UTM coordinates E and N. Table 6-8. Steps for plotting UTM coordinates. Page 6.18
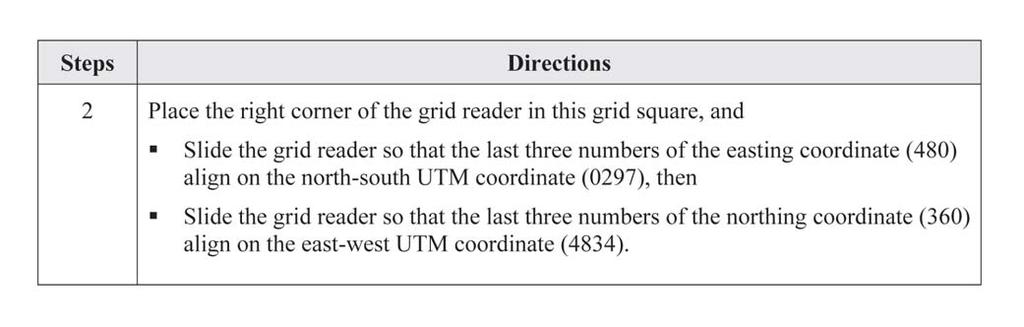
127 Page 6.19
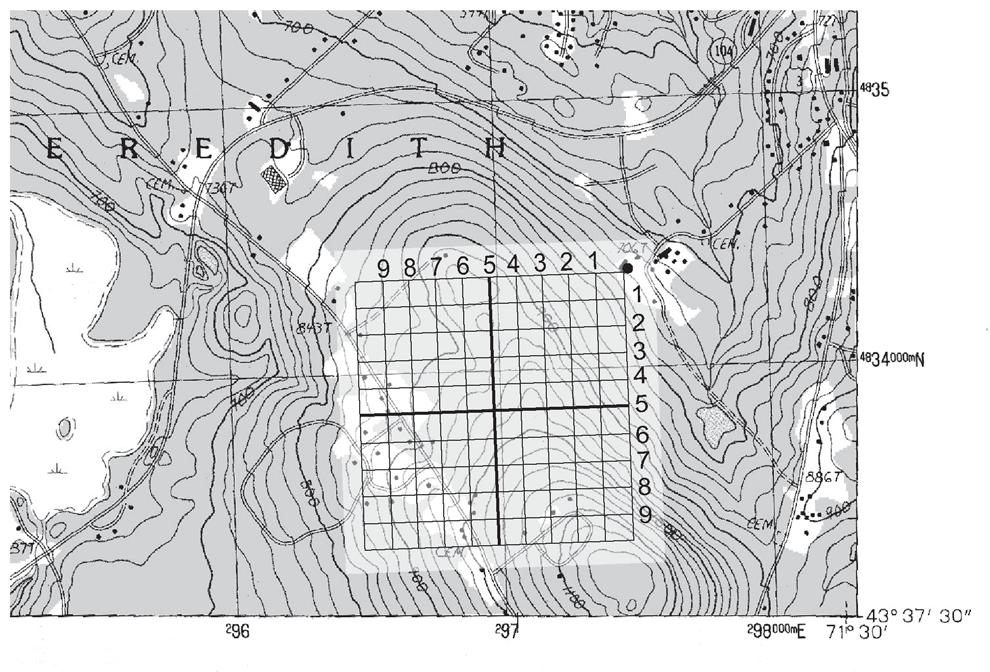
128 Page 6.20

129 Estimating Your Own Position Location There may be times in the field when you do not know where you are on the map or you may need to communicate your position location to the Operations Section or Situation Unit. One method to estimate your own position is called triangulation. It involves sighting on two known landmarks (you know where they are on the map) and where those lines of position intersect is where your position is located. Table 6-9 outlines one method to determine your own position using triangulation and is illustrated in Figure 6-9. Table 6-9. Steps to determine your own position using triangulation. Figure 6-9. Estimate your own position by taking bearings and drawing lines of position on a map; where they intersect is your position location. Page 6.21

130 Estimating Unknown Position Locations Triangulation is also used to estimate the location of an unknown position. For example, two field observers spot smoke. The field observers know their own position locations but they don t know the position of the smoke. They can determine the location of the smoke by taking a bearing and plotting it on the map. The intersection of the two lines is the location of the smoke. Table 6-10 outlines one method for estimating unknown positions and is illustrated in Figure Table Steps to estimate an unknown position. Figure Estimating an unknown position. Page 6.22
.")
131 Estimating Distance on the Ground Being able to estimate distance on the ground is important for both navigation and field mapping. Maps measure the distance between two points as the crow flies. This means they measure horizontal distances, not slope distances (Figure 6-11). When navigating, if the land is flat this causes no problems, but when there are hills and mountains, distances measured on maps are going to be way off. Figure Map distances can under-estimate the actual ground distance. There are various methods of determining distance along the ground. Since it is not usually practical to measure long distances on uneven terrain with a measuring tape, other methods such as pacing must be used. This section focuses on estimating distance using pacing and briefly mentions other methods for estimating distance on the ground. Pacing Pacing is one way to keep track of your distance when in the field. A pace is defined as the average length of two natural steps (a count is made each time the same foot touches the ground). Everyone has a different pace. Estimate your own average length of a pace by following the steps in Table Table Steps to determine your own pace. Page 6.23
132 To estimate the distance between two points on the ground, count the number of paces as you walk between the two points. Then multiply the number of paces by the length of your average pace. It is a good idea to have a system to record your pace count, especially over long distances. Pacing is not exact and one has to compensate for the following: Pace can change based on steepness of slope; typically, pace lengthens down slope and shortens upslope. Walking into strong winds causes the pace to shorten; walking with a tail wind causes it to lengthen. Soft surfaces such as sand and gravel tend to shorten the pace. In wet, rainy, or icy conditions, the pace tends to shorten. A paced distance may vary from a map distance because land surveys are based on horizontal distances, not slope distances, especially in uneven or rough topography. Other Methods to Estimate Distance There are other methods to estimate distance such as using your vehicle odometer and visual comparison. The odometer works great if you need to measure distances where roads are located. Occasionally you will encounter a stream too deep to wade or a slope too steep to cross, and the distance must be estimated. One way to do this is visually compare it to a known distance, such as the length of a football field. Page 6.24
133 Field Mapping Field maps are usually drawn on topographic maps but they can also be drawn on other types of maps or on plain paper. Ideally, you will have a standard USGS topographic map with the margins and scales; however, there will be times when you have just a portion of a map without the margins or scale. Field maps are also produced with the information collected in a GPS receiver. The GPS data is downloaded into Geographic Information System program for producing digitized maps. Field maps are used to prepare the Situation Unit map, Incident Action map, and other incident maps. It is extremely important that the information on field maps is as accurate as possible because life and death decisions are made based on this information. This section discusses how to draw a field map and use a GPS receiver for mapping. When drawing field maps it is important to follow standards, locate your start point, and draw features and plot points following recommended procedures. Follow Standards Standards help ensure that maps are of consistent quality and meet the needs of those who use them. S.T.A.N.D.D. This standard helps ensure that all maps have scale, title, author, north arrow, date and time, and datum recorded either in the map legend or somewhere else on the map. Scale. Draw the scale at bottom of the map. If map is not to scale then write that on map. Map scale may change with the copying process. Title. Write the title at top of map. Record incident name and number as appropriate. This includes state, unit identifier, and number (example: ID-BOF-0095). Author. Record your name or initials in lower right corner of map. North arrow. Draw north arrow. Date. Record date and time information gathered. Datum. Record datum of the map used. Page 6.25
134 Symbology Standard This standard helps ensure that maps are consistent and readable. Symbols must be defined in the legend. Use Incident Command System (ICS) symbology, which was discussed in Chapter 1, Overview of Maps. The Fireline Handbook also has a copy of ICS symbology. Additional symbols can be created as needed, but must be defined in the legend. Accuracy Standard The accuracy standard helps ensure information on the map is accurate. Current and up-to-date information. Features are drawn in the right location and have accurate shape and proportion. Utility Standard The utility standard helps ensure that the field maps serve the needs of the Situation Unit, Operations, Command and General Staff, and other incident personnel. Complete Readable Submitted on time Locate Your Start Point Locate your start point on the map by measuring from a known point that is on the map, measuring between two points or using a GPS receiver. Page 6.26
135 Draw Features and Plot Points on Map The features drawn on a field map will vary with each incident; however, common features include: Fireline Roads and trails Hotspots Contingency lines Water sources Facilities/improvements Division breaks Spot fires Structures Access Fuel types Potential safety zones/escape routes Helispots Escape routes, safety zones Plot points as appropriate Hazards Natural barriers Other features Use ICS symbology to draw these features on the map and check to make sure that scale, title, author, north arrow, date and datum (S.T.A.N.D.D.) are recorded. Use a Global Positioning System Receiver for Mapping The data entered into a GPS receiver can be downloaded into Geographic Information System software to produce digitized maps. However, do not rely on the GPS receiver alone always have a map and compass. Refer to the GPS receiver owner s manual for specific instructions. Some basic tips on using the GPS receiver for mapping include: Determine Memory Capacity of GPS Receiver Find out what the memory capacity is for your GPS receiver. Also, determine how many track points the GPS receiver is capable of storing. If you run out of memory while you are collecting data it can result in a loss of data, decrease in accuracy of data, and other problems. Clear Track Log Clear the track log before you start recording data so old data does not get mixed up with new data. Page 6.27
136 Set the Record Mode Set interval to distance or time. The Record Mode needs to be set to a specific distance or time interval this tells the GPS how often it should record. For example, if the record mode is set to record by distance, every 0.01 miles, the GPS will record a track point every 53 feet. Be careful about the interval you set up because you can quickly run out of memory, for example, if the distance interval is 0.01 mile and there is 3 miles of line to track the GPS may run out of memory. Distance is the recommended setting. If you set it to record distance at too high of an interval, such as 0.25 miles, you may miss bends or other important features. The GPS can also be set to record at time intervals, for example every 20 seconds. However, whenever you stop, the GPS will continue to record and the points will pile up on each other. Do not set the Record Mode to wrap. If the Record Mode is set to wrap and the GPS memory is at 100% it will start to overwrite points that were recorded at the beginning of the track. When you are ready to record and at your starting point, set the Record Mode to Fill. If you need to back track, veer off course, take a break, etc., turn Record Mode to off. Do not turn GPS receiver unit off. Start a new track log for different areas, as appropriate. Setting the record mode to Fill tells the receiver to use the last bit of memory and then stop recording. Newer GPS receivers have the ability to convert track logs to a route. A route is permanent and will not be overwritten. Name and Save Track Log Name and save track log after recording. Keep the name short and write down the name with a description of what it is in your notes. Refer to Chapter 5, Global Positioning System, for information on how to name tracks. Name and Save Waypoints Keep notes on names and descriptions of waypoints. Refer to Chapter 5, Global Positioning System, for information on how to name waypoints. Check Datum Make sure the datum set in the GPS unit matches the datum of the map you are using. Page 6.28
137 Taking Notes It is extremely important to take good notes when recording observations, drawing a field map, or using the GPS receiver. The notes provide further clarification of what is on the maps and other observations. Don t wait until the end of the day to write your notes because it is too hard to remember what you did. The notes should include: Designations/names used on the map and in the GPS receiver (examples: Access #1, A1, DP#1, DP1). Description of items mapped, such as capabilities and limitations of water sources. General observations Fuel types Spread rates Safety/hazards Fire weather Distances Other information, as appropriate Name of person who collected data and when it was collected (date and hours). Writing down the start and stop time when recording track data can help GIS personnel identify track data once it is downloaded. Digital photos can also accompany notes. When writing notes, try to keep them organized and legible, not only so you can read them but others as well. There is no specific format for writing notes; however, Appendix C has a copy of a form that you can use or you can develop your own form. Page 6.29
138 Checking Your Understanding Answers to Checking Your Understanding can be found in Appendix B. 1. Practice orienting a map with topographic features and with a compass. Refer to the map on page 6.31 to answer questions Using a protractor or compass, what is the bearing between point A and B? 3. What is the latitude/longitude coordinate of point C? Latitude Longitude 4. What is the UTM coordinate of point C? The UTM zone is 11. Easting Northing 5. Plot the following latitude/longitude coordinate on the map: Latitude 46 53' 47" Longitude ' 33" 6. Plot the following UTM coordinate on the map: Zone 11 Easting Northing Page 6.30
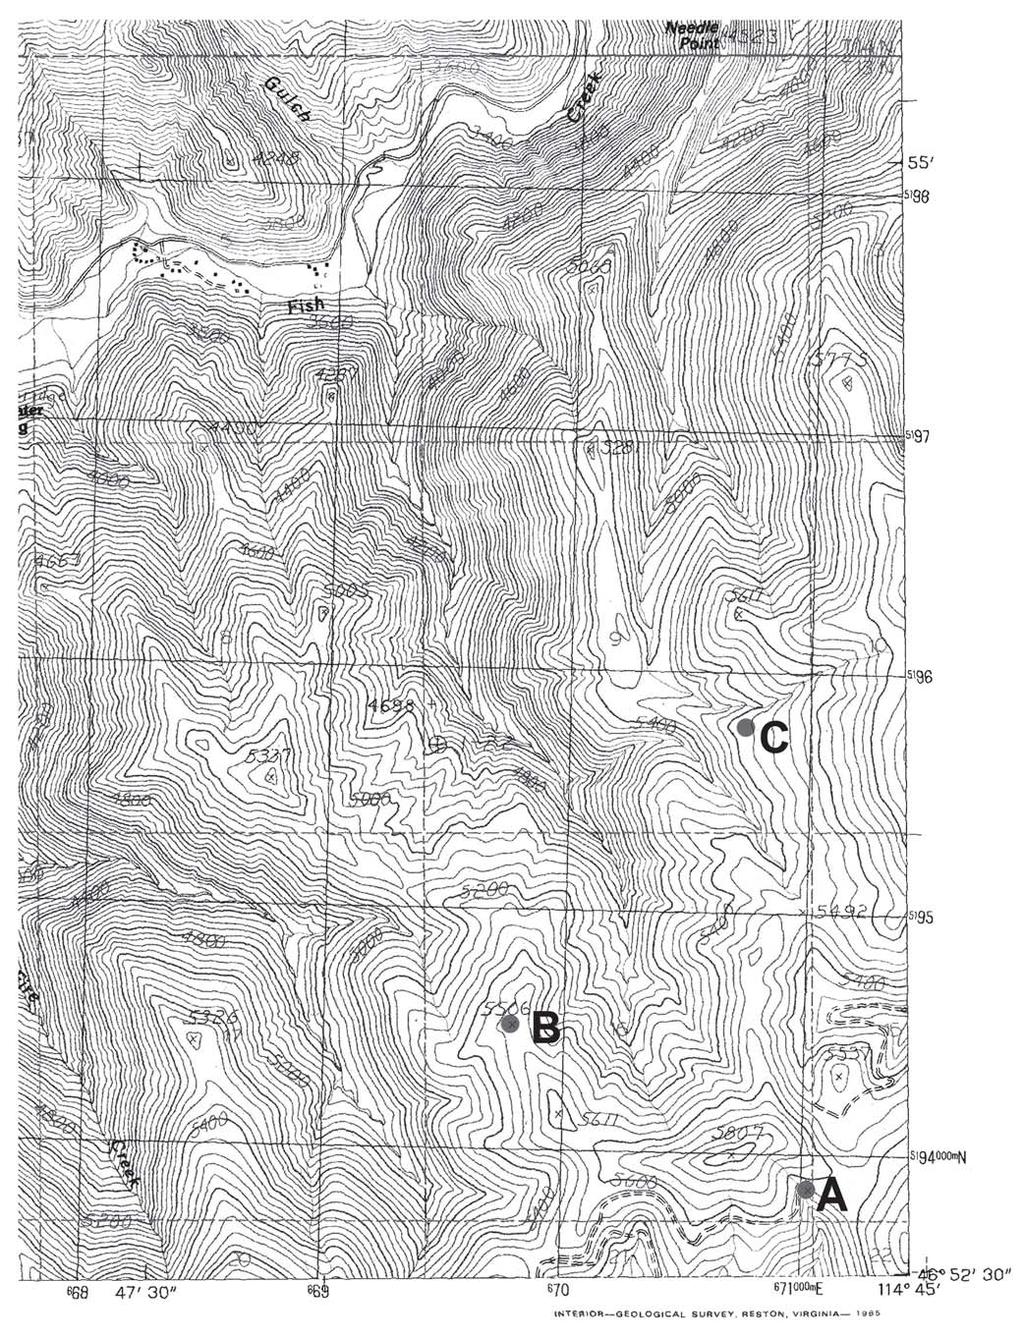
139 Page 6.31
140 7. When estimating your own position using triangulation, can you take bearings of a tree and large rock for drawing lines of position? 8. You are a field observer on an incident. You see a potential hot spot several miles away and you need to radio in the location but you do not know the hot spot s location. How can you find out the location of the hot spot using a compass? 9. Follow the directions in this chapter and determine your pace on level and sloping ground. 10. If your average pace is 5½ feet and you walk 1700 paces on level ground, how many feet did you travel? 11. In general, list three situations that could lengthen or shorten your pace. 12. What are the four standards that you should incorporate when preparing field maps? 13. Why is determining the memory capacity of your GPS receiver important? 14. What information should be in your field notes? Page 6.32
141 APPENDIX A GLOSSARY Appendix A.1
142 Appendix A.2 Basic Land Navigation
143 Back Bearing A back bearing is measured from the object to your position. It is the exact opposite of a direct bearing. Base Line An imaginary line on the ground running east-west (horizontal) measured with special accuracy to provide a base for surveying. Cardinal Positions/Directions North, south, east, west; used for giving directions and information from the ground or air in describing the fire. Compass An instrument used for showing direction, consisting of a magnetic needle swinging freely on a pivot and pointing to magnetic north. Contour Line A line on a map or chart indicating elevation in feet, and connects all points of the same height above sea level. Declination Declination is the difference in degrees between true north and magnetic north. Degree A unit of angular measurement equal to one-360th part of the circumference of a circle. The entire globe contains 360 degrees, each degree contains 60 minutes, and each minute contains 60 seconds. Graphic Scale (G.S.) A graphic scale is a line marked off on a map which compares map distances to the ground distance in different units of measurements. Landmark A feature in the landscape which can be readily recognized; anything from a prominent tree or rock, to a church or a lake. Latitude Angular distance, measured in degrees, creating imaginary lines circling the earth s globe. The lines extend in an easterly and westerly direction, parallel with the equator, which is 0 degrees latitude. The degrees of latitude increase as one proceeds from the equator toward either north or south poles where the latitude is 90 degrees. Legend A key accompanying a map which shows information needed to interpret that map. Each type of map has information represented in a different way relating to its subject matter. The legend can explain map scales, symbols and color. Appendix A.3
144 Longitude Angular distance, measured in degrees, creating imaginary lines extending from north pole to the south pole which identify geographical positions on the earth s globe. The lines are based from the Prime Meridian of 0 degree longitude which runs through Greenwich, England, extending 180 degrees westward and eastward. Magnetic Bearing Bearing by magnetic north rather than true north. Magnetic North The direction toward which a magnetic needle of a compass points. Map A line drawing, to some scale, of an area of the earth s surface. It shows objects and features by conventional signs. Map Scale Indicates the ratio or proportion of the horizontal distance on the map to the corresponding horizontal distance on the ground. Pace A pace is defined as the average length of two natural steps (a count is made each time the same foot touches the ground). Planimetric Map A map that shows the positions of features without showing the elevations of all hills and valleys of the land. It can include rivers, lakes, roads, boundaries, or other human-made symbolic features. Principal Meridian An imaginary line on the ground running north-south which is accurately laid out to serve as the reference meridian in land surveys. Representative Fraction (R.F.) A scale that expresses the ratio of the map distance to the ground distance in SAME units of measurements. It is usually written as a fraction or ratio. Section An area of land one mile square and containing 640 acres, more or less, which is one of 36 parts of a township. Slope (percent) The ratio between the amount of vertical rise of a slope and horizontal distance, expressed in percent. One hundred feet of rise in 100 feet of horizontal distance equals 100 percent. Appendix A.4
145 Topographic Map A map that shows the positions of features and also represents their vertical position in a measurable form. Topographic Terms Depression: Hachures: Hill: Mesa: Ridge: Saddle: Valley: A low place in the ground having no outlet for surface drainage. A series of short, nearly parallel lines used in map making to represent a sloping surface. Representing a depression or pit, the contour line is joined forming a circle with the hachures on the inside of the circle. A naturally occurring mass of earth material whose crest or summit is at a lower elevation than a mountain. A flat-topped mountain with steep sides. A long narrow elevation of land; a steep slope or a similar range of hills or mountains. A depression or pass in a ridgeline. A stretch of low land lying between hills or mountains which are sometimes occupied by a stream. Township An area of land divided by township lines and range lines which is approximately 36 miles square. Each township is divided into 36 parts, each approximately one mile square, called sections. Township lines, which are 6 miles apart, run east and west parallel to the Base Line (and also parallel to lines of latitude). Triangulation A method of determining the location of an unknown point by using the laws of plane trigonometry. True Bearing Bearing by true north rather than magnetic north. True North A line from any position on the earth s surface to the geographic north pole. In a declination diagram of a map true north is symbolized by a line with a star at the apex. U.S.G.S. United States Geological Survey of the Department of the Interior, an organization established by Congress which is engaged in topographic and geologic mapping and in collection of information about the public lands. Appendix A.5
146 Appendix A.6 Basic Land Navigation
147 APPENDIX B CHECKING YOUR UNDERSTANDING ANSWERS TO EXERCISES Appendix B.1
148 Appendix B.2 Basic Land Navigation
149 Chapter 1 1. List three examples of how you may use a map on an incident. Possible answers: To assist with navigation. To determine the location of a specific point or area (water sources, threatened resources). To calculate distance. To determine size of an area. To determine terrain and vegetative cover. To determine routes of travel. To determine names of streets, rivers, mountains, and other features. To visualize a specific area. 2. Describe two key points to remember when using a map with a compass or GPS receiver. When using a compass with a map, an adjustment often has to be made for magnetic declination. When using a GPS receiver with a map, the datum for the map must be entered into the GPS receiver. Appendix B.3
150 3. Indicate the type of map that would be most appropriate for these activities: A. Locate hot spots on an incident Infrared map B. Determine slope of a specific area Topographic map C. Identify travel route Transportation map D. Determine current perimeter location Situation Unit map E. Identify perimeter location when the incident started Progression map 4. What publication can you use to learn the ICS symbols? Fireline Handbook 5. List three sources of where you can obtain maps. Possible sources: Federal agencies - local, regional, and national Local/State agency offices Local business offices Internet Mapping software Appendix B.4
151 Chapter 2 1. What is the fractional scale and declination of this map? If you are using a GPS receiver, what datum would you use? Fraction scale: 1:24,000 Declination: Datum: 16.5 degrees East 1927 North American Datum 2. List the reference coordinates for latitude/longitude and UTM. Latitude: 43 52' 30" Longitude: ' 30" UTM: m. E. and m. N. 3. Calculate the contour interval for this map. Step 1: Step 2: Step 3: Two index contours are 9000 feet and 9100 feet. The difference between the two index contours: 9100 feet 9000 feet = 100 feet. There are 5 lines. Step 4: Contour interval is 20 (100 divided by 5). Appendix B.5
152 4. Draw a profile (similar to a line graph) of the land from point a to point b. Elevation lines are marked in 100-foot increments. Hint: The elevation rises from the 100-foot contour line. 5. Identify the topographic feature inside the rectangles lettered A- F with one of these characteristics: stream, hilltop, steep terrain, ridge, depression, and flat terrain. A. Hilltop B. Flat terrain C. Steep terrain D. Ridge E. Depression F. Stream or drainage 6. Estimate the percent slope between A and B. What is the aspect of the slope between A and B? The scale is 1:24,000 (1 inch = 2000 feet). Slope: 12% Aspect: SW Step 1: The elevation of point A is 9400 and point B is 9160 Step 2: Vertical (rise) distance is 240 feet Step 3: Horizontal (run) distance is approximately 2000 feet Step 4: Slope is 12% (240 ft / 2000 ft =.12) Appendix B.6
153 7. Determine the equivalent unit of measurement for the following: A. 2.5 miles = 200 chains B. 1.5 chains = 33 yards C. 29,040 feet = 5.5 miles D. 3 chains x 20 chains = 6 acres E. 1/8 of a section = 80 acres 8. Estimate the acreage (in acres) within 10% accuracy (+ or -) of fires A - D. A. 80 B. 165 C. 25 D. 27 Appendix B.7
154 Appendix B.8 Basic Land Navigation
155 Chapter 3 1. What are two common global coordinate systems used in the United States? Latitude/Longitude Universal Transverse Mercator 2. Latitude is a measure of how far north or south a point is from the equator. Longitude is a measure of how far east or west a point is from the prime meridian Greenwich England. 3. On USGS topographic maps, UTM grid lines are marked every 1000 meters. 4. This is an abbreviated UTM coordinate: 5 66E and 51 96N. How else could it be written? mE and mN or E and N 5. Given this UTM position in Montana E N the easting is located 183,456 meters east of the 12th zone central meridian and the northing is located 5,346,782 meters north of the 12th zone equator. Appendix B.9
156 6. Write the acreage and location description (section, township and range) for each of the lettered areas. A. 160 NW 1/4, Sec. 3, T.2S., R.4E. B. 80 E1/2 NE ¼, Sec.3, T.2S., R.4E. C. 40 NW1/4 SW1/4, Sec.3, T.2S., R.4E. D. 20 W1/2 NW1/4 SE1/4, Sec.3, T.2S., R.4E. E. 20 S1/2 NE1/4 SE1/4, Sec.3, T.2S., R.4E. F. 30 N1/2 and SW1/4 SE1/4 SW1/4, Sec.3, T.2S., R.4E. OR W1/2 and NE1/4 SE1/4 SW1/4, Sec.3, T.2S., R.4E. G. 10 SW1/4 SE1/4 SE1/4, Sec.3,T.2S., R.4E. H. 5 E1/2 NE1/4 SW1/4 SE1/4, Sec.3, T.2S., R.4E. I. 5 N1/2 NW1/4 SW1/4 SE1/4, Sec.3, T.2S., R.4E. J. 2½ NE1/4 SW1/4 SW1/4 SE1/4, Sec.3, T.2S., R.4E. 7. Name two other Geographic Location Systems besides latitude/longitude, UTM, and U.S. Public Land Survey. Possible answers: Military Grid Reference System Spanish Land Grants Metes and Bounds State Land Coordinate System Appendix B.10

157 Chapter 4 1. List three examples of how you may use a compass on an incident. Possible answers: Determine direction to a destination or landmark. Stay on a straight course to a destination or landmark, even if you lose sight of the destination or landmark. Avoid obstacles in the path to the destination or landmark. Return to your starting point. Pinpoint locations on a map and in the field. Identify what you are looking at in the field or on a map. Orient a map. Plot points on a map. Plot route of travel on a map. 2. Label the seven parts of a compass. Appendix B.11
158 3. List five tips on how to obtain accurate compass readings. Possible answers: Hold the compass level and steady so the needle swings freely. Hold the compass about waist high in front of the body, except when using a compass with a sighting mirror or a sighting type compass. Raise and lower eyes when taking a bearing, do not move your head. Always use the same eye when taking bearings. Directly face object that is being measured. Magnetic fields will give incorrect compass readings. Avoid taking readings near magnetic fields such as steel, iron (ferrous metals), vehicles, rebar, and clipboards. Even belt buckles and rings can interfere with the compass reading. Take bearing twice. Adjust for magnetic declination as appropriate. Follow the direction of travel arrow, not the compass needle, when walking a bearing. Always follow the line indicated by the compass rather than relying on judgment as to the direction. Use back bearings to ensure you are on track when navigating. 4. How do you adjust your compass for declination? How do you know what the declination is for the area where you are working? Refer to the owner s manual for instructions on adjusting a compass for declination. Look at the bottom left hand corner of a USGS topographic map for the magnetic declination information. 5. What are the two different ways to orient a compass? Orient to magnetic north or geographic north. Appendix B.12
159 6. The following exercises will improve your performance. Practice taking direct and back bearings of various objects. No answer just practice. Take a compass bearing of a distant object. Mark your starting location, walk to your object. Now take a back bearing and follow that bearing. How far off were you from your starting point? You should be close to or at your starting point. Practice estimating slope using a clinometer. No answer just practice. Appendix B.13
160 Appendix B.14 Basic Land Navigation
161 Chapter 5 1. Practice storing and naming waypoints and tracks using a GPS receiver. No answer just practice. 2. Determine how many waypoints your GPS receiver can store in the memory. Answer will vary depending upon type of GPS receiver. 3. List three ways you can prevent making user mistakes when using a GPS receiver. Be extremely careful when entering information into the receiver. Verify that the receiver has locked on to four satellites. Don t hold the GPS receiver close to the body and use the antenna as appropriate. Sometimes facing the south can alleviate signal problems caused by the body. 4. List three things that are important to do when you are taking a GPS receiver with you on an incident. Always bring a compass and map. Have a GPS download cable. Have extra batteries. Know memory capacity of the GPS receiver to prevent loss of data, decrease in accuracy of data or other problems. Bring the GPS external antennae for use while driving or flying. Take notes that describe what you are saving in the receiver. 5. How should you name waypoints? Use short descriptive names, such as D1, HL1, DP1, H1, A1. Appendix B.15
162 Appendix B.16 Basic Land Navigation
163 Chapter 6 1. Practice orienting a map with topographic features and with a compass. Keep practicing until you feel comfortable. It is much easier to practice in terrain that you are familiar with before trying to do it in unfamiliar terrain. 2. Using a protractor or compass, what is the bearing between point A and B? 299 degrees 3. What is the latitude/longitude coordinate of point C? Latitude 46 53' 45" Longitude ' 31" 4. What is the UTM coordinate of point C? UTM zone is 11. Zone 11 Easting Northing Plot the following latitude/longitude coordinate on the map: Latitude 46-53' - 47" Longitude ' - 33" See map on page B-20 for answer. 6. Plot the following UTM coordinate on the map: Zone 11 Easting Northing See map on page B-20 for answer. 7. When estimating your own position using triangulation, can you take bearings of a tree and large rock for drawing lines of position? No, you need to use landmarks that can be found on a map. 8. You are a field observer on an incident. You see a potential hot spot several miles away and you need to radio in the location but you do not know the hot spot s location. How can you find out the location of the hot spot using a compass? One option is to find out if anyone else is nearby who can also see the hot spot. If so, then both of you can take a bearing and you can draw lines of intersection to determine location of the hot spot. Appendix B.17
164 9. Follow the directions in this chapter and determine your pace on level and sloping ground. 10. If your average pace is 5½ feet and you walk 1700 paces on level ground, how many feet did you travel? 9,350 feet 11. In general, list three situations that could lengthen or shorten your pace. Steepness of slope Strong winds Soft surfaces such as sand and gravel. Wet, rainy, or icy conditions. 12. What are the four standards that you should incorporate when preparing field maps? S. T. A. N. D. D. Symbology Standard Accuracy Standard Utility Standard 13. Why is determining the memory capacity of your GPS receiver important? If you run out of memory while you are collecting data it can result in a loss of data. Appendix B.18
165 14. What information should be in your field notes? Designations/names used on map and in GPS receiver (Access #1, A1, DP#1, DP1) Description of items mapped (capabilities and limitations of water sources) General observations Fuel types Spread rates Safety/hazards Fire weather Distances Other information, as appropriate Name of person who collected data and when it was collected (date and hours). Writing down the start and stop time when recording track data can help GIS personnel identify track data once it is downloaded. Digital photos can also accompany notes. Appendix B.19

166 Appendix B.20 Basic Land Navigation
Chapter 1 Overview of Maps
 Chapter 1 Overview of Maps In this chapter you will learn about: Key points when working with maps General types of maps Incident specific maps Map legend and symbols Map sources A map is a navigational
Basic Land Navigation
 A Publication of the National Wildfire Coordinating Group National Interagency Incident Management System Basic Land Navigation PMS 475 June 2007 NFES 2865 Basic Land Navigation JUNE 2007 NFES 2865 Sponsored
Chapter 3 Geographic Location Systems
 Chapter 3 Geographic Location Systems In this chapter you will learn about: Latitude and longitude Universal Transverse Mercator (UTM) U.S. Public Land Survey Other geographic location systems Geographic
Butte County Fire Department
 Butte County Fire Department Basic Land Navigation Verification Sheet I verify that Print Supervisor s name has completed the Print Employee s name Basic Land Navigation self study guide on. Date Attached
APPENDIX F PRE-COURSE WORK
 APPENDIX F PRE-COURSE WORK F-1 Pre-Course Work F-2 Pre-Course Work Intermediate Wildland Fire Behavior, S-290 Pre-Course Work The pre-course work is designed to ensure that students come to class with
APPENDIX A GLOSSARY. Appendix A.1
 APPENDIX A GLOSSARY Appendix A.1 Appendix A.2 Back Bearing A back bearing is measured from the object to your position. It is the exact opposite of a direct bearing. Base Line An imaginary line on the
Using Map and Compass Together
 Using Map and Compass Together In situations where you foresee a potential evacuation on foot, where there are no roads, and no indication as to the direction of travel (i.e., road signs), it is recommended
King County Explorer Search and Rescue. Course B Map & Compass
 King County Explorer Search and Rescue Course B Map & Compass Disclaimer The intent of this presentation is to provide a basic overview of maps, compasses, and location finding. It is not meant to be a
Butte County Fire Department
 Butte County Fire Department Basic Land Navigation Verification Sheet I verify that Print Supervisor's name Print Employee's name has completed the Basic Land Navigation self study guide on Date Attached
Topographic Map Series:
 DEFINITION OF A MAP A MAP IS A GEOGRAPHIC PREPRESENTATION OF A PORTION OF THE EARTH S SURFACE DRAWN TO SCALE, AS SEEN FROM ABOVE. IT S USES COLORS, SYMBOLS AND LABELS TO REPRESENT FEATURES FOUND ON THE
B. Topographic maps are also called. contour maps
 Topographic Maps Introduction A. Topographic maps are essential tools in geologic and engineering studies because they show the configuration of Earth's surface in remarkable detail and permit one to measure
Compass Basics. Quick Map Basics Review For Compass Use
 Compass Basics Quick Map Basics Review For Compass Use A topographic map tells you where things are and how to get to them, whether you're hiking, biking, hunting, fishing, or just interested in the world
What is a map? A Map is a two or three-dimensional model or representation of the Earth s surface. 2-Dimensional map
 What is a map? A Map is a two or three-dimensional model or representation of the Earth s surface. 2-Dimensional map What is a Map Projection? Planar Projection Projection A Projection is a mathematical
Chapter 3 Models of the Earth. 3.1 Finding Locations on the Earth. 3.1 Objectives
 Chapter 3 Models of the Earth 3.1 Finding Locations on the Earth 3.1 Objectives Explain latitude and longitude. How can latitude and longitude be used to find locations on Earth? How can a magnetic compass
Topographic Maps and Landforms Geology Lab
 Topographic Maps and Landforms Geology Lab Ray Rector: Instructor Today s Lab Activities 1) Discussion of Last Week s Lab 2) Lecture on Topo Maps and Elevation Contours 3) Construct Topographic Maps and
Lab Topographic Maps. Name: Partner: Purpose. Background Information
 Lab Topographic Maps Name: Partner: Purpose The purpose of this lab is to familiarize you with graphic representations of the Earth s surface primarily maps. Simple line maps show the spatial relationship
Laboratory Exercise #2 Introduction to Quadrangle Maps
 page - Laboratory Exercise #2 Introduction to Quadrangle Maps A. Introduction to Quadrangle Maps The United States Geological Survey has developed a nationwide series of quadrangle maps that cover small
Navigating with Map & Compass. Nevada County Sheriff s Search & Rescue
 Navigating with Map & Compass Nevada County Sheriff s Search & Rescue Objectives Very Practical Teach you how to go from point A to point B Go from the wilderness (real world) to a map and visa versa Agenda
USING THE MILITARY LENSATIC COMPASS
 USING THE MILITARY LENSATIC COMPASS WARNING This presentation is intended as a quick summary, and not a comprehensive resource. If you want to learn Land Navigation in detail, either buy a book; or get
Map Reading & Compass Use
 Spring 2013 Kestrel Land Trust Page 2 / 10 Contents Map Basics... 3 Map Types... 3 Terrain Association... 4 Estimating Distance: Pacing... 4 Contour Lines... 5 Navigating with a Compass... 6 Compass Types...
Laboratory Exercise #2 Introduction to Quadrangle Maps
 page - 1 Laboratory Exercise #2 Introduction to Quadrangle Maps A. Introduction to Quadrangle Maps The United States Geological Survey has developed a nationwide series of quadrangle maps that cover small
Basic Map Skills for the Outdoors
 Geography 80-20 80% of what there is to know, for 20% of the sweat Basic Map Skills for the Outdoors Map Scale Map source: US Geological Survey Four ways to indicate map scale: Representative fraction
56H. This system allows definition of points on the Earth s surface to within 100 meters. Page 20. Navigation Systems Basics of Maps
 Grid References Many maps are provided with the standard grid overlaying them. This provides a simple and accurate method for finding features on the map. It is a network of intersecting parallel lines
AS 410 Land Navigation. Chpt 4-1
 AS 410 Land Navigation Chpt 4-1 Overview Types of Maps Map Legends / Scales Latitude and Longitude Orienteering Why? Why important to learn how to read a compass and map? No cell phone coverage Mountain
LAND NAVIGATION 2-1. DEFINITION
 LAND NAVIGATION MAPS Cartography is the art and science of expressing the known physical features of the earth graphically by maps and charts. No one knows who drew, molded, laced together, or scratched
Topographic Maps Self-Instruction Lab (2016 edition) Geology 100 David Harbor s Section. 12 inches x 1 mile
 Geology 100 David Harbor s Section. 12 inches x 1 mile") Topographic Maps Name Self-Instruction Lab (2016 edition) Geology 100 David Harbor s Section Topographic maps are an important aid for a geologist, but maps are also useful for hikers, bicyclists, and
Topographic Maps Name Self-Instruction Lab (2016 edition) Geology 100 David Harbor s Section Topographic maps are an important aid for a geologist, but maps are also useful for hikers, bicyclists, and
Mapping Earth. How are Earth s surface features measured and modeled?
 Name Mapping Earth How are Earth s surface features measured and modeled? Before You Read Before you read the chapter, think about what you know about maps Record your thoughts in the first column Pair
UNIT 1C. USING TOPOGRAPHIC MAPS WHERE IN THE WORLD... ARE YOU?
 UNIT 1C. USING TOPOGRAPHIC MAPS WHERE IN THE WORLD... ARE YOU? TIME 60-90 minutes LEVEL All BENCHMARKS Next Generation Science Standards MS-LS1.D Science & Engineering Practices Developing and Using Models
Geology 101 Lab Worksheet: Topographic Maps
 Geology 101 Lab Worksheet: Topographic Maps Name: Refer to the Topographic Maps Lab for the information you need to complete this worksheet (http://commons.wvc.edu/rdawes/g101ocl/labs/topomapslab.html).
Orienteering Maps & Map Reading Latitude and Longitude Scale
 Orienteering Maps & Map Reading A map is a two-dimensional representation of the three-dimensional world you'll be hiking in. All maps will have some basic features in common and map reading is all about
From Science Olympiad Student Center
 1 of 10 3/5/13 8:18 AM Forums Wiki Test Exchange Image Gallery Score Tracker Road Scholar From Science Olympiad Student Center In Road Scholar, Forum Threads Tests There are no images available for this
Activities: Map and Compass
 Activities: Map and Compass Determining General Directions Modified with permission from Outdoor Living Skills Series: Map and Compass, Missouri Department of Conservation Overview: Students use the sun
Latitude and Longitude
 U n i t 3 M a p p i n g P a g e 1 Latitude and Longitude Note: These coordinates are always expressed LATITUDE/LONGITUDE!!! Coordinate System: Using and to find your position on Earth. LATITUDE LATITUDE
Test Bank Chapter 2: Representations of Earth
 Multiple Choice Test Bank Chapter 2: Representations of Earth 1. A rhumb line on a Mercator projection is a line of. a. true size b. true shape c. true compass bearing d. true location 2. Maximum longitude
Chapter 3 SECTION 1 OBJECTIVES
 Chapter 3 SECTION 1 OBJECTIVES Distinguish between latitude and longitude and locate coordinates on maps. Explain how latitude and longitude can be used to locate places on Earth s surface. Explain the
Topographic Maps. Take Notes as you view the slides
 Topographic Maps Take Notes as you view the slides Lesson Objectives Define a topographic map and state its uses. Describe how contour lines show the elevations, shape, and slope of the land. Identify
USING THE MILITARY LENSATIC COMPASS
 USING THE MILITARY LENSATIC COMPASS WARNING This presentation is intended as a quick summary, and not a comprehensive resource. If you want to learn Land Navigation in detail, either buy a book; or get
Chapter 02 Maps. Multiple Choice Questions
 Chapter 02 Maps Multiple Choice Questions 1. Every projection has some degree of distortion because A. a curved surface cannot be represented on a flat surface without distortion. B. parallels and meridians
The Tacoma Mountaineers Wilderness Navigation
 The Tacoma Mountaineers Wilderness Navigation Navigation Fundamentals Navigation in mountainous terrain and wilderness areas requires a set of skills, of which using a map and compass is only one part.
CHAPTER EXIT CHAPTER. Models of Earth. 3.1 Modeling the Planet. 3.2 Mapmaking and Technology. 3.3 Topographic Maps CHAPTER OUTLINE
 EXIT CHAPTER.1 Modeling the Planet.2 Mapmaking and Technology. Topographic Maps CHAPTER OUTLINE CHAPTER.1 Modeling the Planet A flat of Earth is a convenient tool, but it can distort the shape, distance,
LESSON 2: INTRODUCTION TO TOPOGRAPHICAL MAPS
 LESSON 2: INTRODUCTION TO TOPOGRAPHICAL MAPS Finding your way if you become separated from a group. PURPOSE This lesson presents an overview of topographic maps. It describes their characteristics and
The ABC's of Compass and Map STUDENT WORKBOOK
 The ABC's of Compass and Map STUDENT WORKBOOK 1 EXERCISE 1: Compass Part Identification Directions: Match the terms below with the correct parts on the compass diagram. NOTES: A. Azimuth Ring B. Compass
California Cadet Corps Curriculum on Maps and Navigation. Map Reading LEADERS KNOW THE WAY
 California Cadet Corps Curriculum on Maps and Navigation Map Reading LEADERS KNOW THE WAY 5/22/2017 Map Reading Agenda A1. Introduction to Maps A2. Topographical Map Basics A3. Elevation and Terrain Features
Chapter 6 Mapping and Online Tools
 Chapter 6 Mapping and Online Tools The stream site you monitor is just part of a much larger system. When analyzing stream health, it is important to take a holistic view by considering the entire watershed.
Trail Life USA High Adventure Training Land Navigation Module. Dennis Conte
 Trail Life USA High Adventure Training Land Navigation Module Dennis Conte Navigating With GPS and a MAP Let s Talk about your GPS Hand Held Tool. Is a GPS Hand Held the magic bullet? Can it solve all
FIND PLACES ON GLOBES USING LATITUDE
 GLOBES, MAPS & GRAPHS FIND PLACES ON GLOBES USING LATITUDE AND LONGITUDE LINES FIND PLACES ON MAPS USING A GRID SYSTEM NAME SEVERAL TYPES OF MAP PROJECTIONS AND EXPLAIN THEIR BENEFITS AND SHORTCOMINGS
Georeferencing, Map Projections, Cartographic Concepts. -Coordinate Systems -Datum
 Georeferencing, Map Projections, Cartographic Concepts -Map Projections -Coordinate Systems -Datum Map projection is "the process of systematically transforming positions on the Earth's spherical surface
Mapping Earth. Technology and Mapmaking
 CHAPTER 1 LESSON 2 Mapping Earth Technology and Mapmaking Key Concepts What can a topographic map tell you about the shape of Earth s surface? What can you learn from geologic maps about the rocks near
Coach Answers Part 2 Zombie 17 COACH ANSWERS (Questions and answers with explanations) Part 2
 Part 2") Zombie 17 COACH ANSWERS (Questions and answers with explanations) Part 2 44. The Brain Building looks fairly new. Based on the map, what is the most recent year in which it could have been constructed?
Zombie 17 COACH ANSWERS (Questions and answers with explanations) Part 2 44. The Brain Building looks fairly new. Based on the map, what is the most recent year in which it could have been constructed?
Earth Science Regents Reading Topographic Maps
 Earth Science Regents Reading Topographic Maps Name Period Quick Tutorial on Degrees, Minutes, and Seconds of Latitude and Longitude A degree of latitude on the surface of the earth is about 70 miles long.
MAPS AND THEIR CLASSIFICATION
 MAPPING MAPS AND THEIR CLASSIFICATION WHAT IS A MAP? A map is representation of the Earth's surface, showing how things are related to each other by distance, direction, and size. Maps are a way of showing
What Do You See? FOR 274: Forest Measurements and Inventory. Area Determination: Frequency and Cover
 What Do You See? Message of the Day: Many options exist to determine the size, area, or extent of a feature on a landscape FOR 274: Forest Measurements and Inventory Lecture 7: Measures of Land Area Frequency
Lecture 9: Reference Maps & Aerial Photography
 Lecture 9: Reference Maps & Aerial Photography I. Overview of Reference and Topographic Maps There are two basic types of maps? Reference Maps - General purpose maps & Thematic Maps - maps made for a specific
Military Map Reading 201
 Military Map Reading 201 This information paper is designed to resolve the confusion between the Universal Transverse Mercator (UTM) and the Military Grid Reference System (MGRS) coordinates. The two systems
Date: UNI. world. *Dedicated to
 Name: Date: UNI IT THREE 2D and 3D model s of the natural world *Dedicated to Name: Date: ABSTRACT T AND RATIONALE A topographic map is a type of map that depicts the detail and quantitative representation
Notes and Summary pages:
 Topographic Mapping 8.9C Interpret topographical maps and satellite views to identify land and erosional features and predict how these shapes may be reshaped by weathering ATL Skills: Communication taking
Name Class Date. For each pair of terms, explain how the meanings of the terms differ.
 Skills Worksheet Chapter Review USING KEY TERMS For each pair of terms, explain how the meanings of the terms differ. 1. true north and magnetic north 2. latitude and longitude 3. equator and prime meridian
Navigating for Scouts A Self-teaching Guide to Navigation with Map and Compass
 Don Burgess, November 2003 Materials topographic maps Navigating for Scouts A Self-teaching Guide to Navigation with Map and Compass metric ruler orienteering compass 30 M/5 Hamilton-Burlington 41 I/13
What is a map? Understanding your map needs
 What is a map? A map is simply a drawing or picture of a landscape or location. Maps usually show the landscape as it would be seen from above, looking directly down. As well as showing the landscape of
Map reading notes. It is a very useful kind of map that shows the topography of an area, i.e whether it is flat, undulating, rugged or mountainous
 Introduction Map reading notes In the course of 2 or 3 years course, Candidates will be exposed to topographical maps from tropical countries such as Mauritius, Tanzania, Zimbabwe and Jamaica. Many of
Topographic Maps: Background
 Topographic Maps: Background Introduction From Dr. Terry Swanson, University of Washington, ESS 101 Lab, Geologic Techniques, and Dr. David Kendrick, Hobart and William Smith Colleges, Geneva, NY Geoscientists
Background Information
 Oceanography LAB #1: Marine Charts and Navigation Background Information Latitude and Longitude A coordinate is an address a means of designating location. Most coordinate systems involve a network of
NR402 GIS Applications in Natural Resources Lesson 4 Map Projections
 NR402 GIS Applications in Natural Resources Lesson 4 Map Projections From http://www.or.blm.gov/gis/ 1 Geographic coordinates Coordinates are expressed as Latitude and Longitude in Degrees, Minutes, Seconds
BUSH NAV BUSH NAV DAY Navigation for Bush Navigation Day. November. WhitehorseD AY. Section 1 Registration, Maps & Checkpoints
 BUSH DAY Navigation for Bush Navigation Day Robert Kirwan, Nunawading SES W NW N NE E If you have little or no bush navigation experience then you will have been teamed up with members that have that experience
REVISION: MAPWORK 18 SEPTEMBER 2014
 REVISION: MAPWORK 18 SEPTEMBER 2014 Lesson Description In this lesson we revise: Various mapwork calculations Summary Relative Position Bearing is the angular (angle) distance between two points True Bearing
Introduction to Cartography Part I
 Introduction to Cartography Part I Introduction to Cartography Maps vs. Globes General Types of Maps Standard Map Features Maps versus Globes Map: a representation of the world, or part of it, in two dimensions
FM Map Reading and Land Navigation
 FM 3-25.26 Map Reading and Land Navigation CHAPTER 4 GRIDS This chapter covers how to determine and report positions on the ground in terms of their locations on a map. Knowing where you are (position
What Is a Globe? Hemispheres. Main Idea Globes and maps provide different ways of showing features of the earth. Terms to Know
 r Main Idea Globes and maps provide different ways of showing features of the earth. Terms to Know hemisphere latitude longitude scale bar scale relief elevation contour line What Is a Globe? A globe is
1. Identify the Earth motion that provides the basis for our system of local time and time zones.
 Base your answers to questions 1 through 4 on the map below and on your knowledge of Earth science. The map shows the four time zones and some latitude and longitude lines across the continental United
Wayne E. Sirmon GEO 301 World Regional Geography
 Wayne E. Sirmon GEO 301 Geography 301 Geography 301 MAP: A graphic representation of a portion of the earth s surface dawn to scale, as seen from above. Types of Maps Climate maps give general information
1/28/16. EGM101 Skills Toolbox. Map types. Political Physical Topographic Climate Resource Road. Thematic maps (use one of the above as backdrop)
") EGM101 Skills Toolbox Map types Political Physical Topographic Climate Resource Road Thematic maps (use one of the above as backdrop) Map Types Deriving information from maps Hydrographic Geological Soils
EGM101 Skills Toolbox Map types Political Physical Topographic Climate Resource Road Thematic maps (use one of the above as backdrop) Map Types Deriving information from maps Hydrographic Geological Soils
page - 1 Laboratory Exercise #1 - Introduction to Latitude and Longitude Northern Hemisphere Southern Hemisphere
 page - 1 Laboratory Exercise #1 - Introduction to Latitude and Longitude A. Introduction There are many methods that can be used to locate ones position on the surface of the earth. A common method for
EROSIONAL FEATURES. reflect
 reflect Have you ever looked at the land around you and wondered what processes shaped what you see? Perhaps you see mountains, valleys, rivers, or canyons. Do you know how long these geologic features
ch02.pdf chap2.pdf chap02.pdf
 Introduction to Geographic Information Systems 8th Edition Karl Solutions Manual Full Download: http://testbanklive.com/download/introduction-to-geographic-information-systems-8th-edition-karl-solutions-manu
Map Skills Unit. Note taking unit
 Map Skills Unit Note taking unit Introduction To learn about the Earth, we are going to learn about two geographic tools you can use.globes and maps. Globe A globe is a round model of the planet Earth
Coordinate Systems & Land Division
 Name Physical Geography Lab Activity #06 Due date Coordinate Systems & Land Division COR Objective 1, SLO 1,3 6.1. Introduction Latitude and longitude are great for sailing around the world, but can be
Advanced Vectors. Table of Contents
 Advanced Vectors Table of Contents I. Location and Distance on Earth 2 Introduction Determining Latitude Latitude and the North Star Determining Longitude Longitude and Time Using Earth's Grid System Google
Earth and Space: Topographic Maps Satellite Images
 Earth and Space: Topographic Maps Satellite Images Earth and Space: Formative Assessment Activities for Earth and Space Topographic Maps Satellite Images Teacher Pages Purpose The purpose of this station
MAP STUDY: INTERPRETATION OF SURVEY MAPS
 MAP STUDY: INTERPRETATION OF SURVEY MAPS Types and Elements of Maps Maps are drawn to represent the Earth on a piece of paper. Maps are used widely to represent the Earth. Maps use signs and symbols in
Regents Earth Science Unit 1 Earth Dimensions
 Regents Earth Science Unit 1 Earth Dimensions www. BarnesWeb.org 2014-15 edition Name: Name: OBJECTIVES Correctly define: isolines, gradient, topographic map, contour interval, hachured lines, profile,
Land Navigation Table of Contents
 Land Navigation Table of Contents Preparatory Notes to Instructor... 1 Session Notes... 5 Learning Activity: Grid Reference Four Figure... 7 Learning Activity: Grid Reference Six Figure... 8 Learning Activity:
Practice Packet Topic 2: Measuring Earth
 Practice Packet Topic 2: Measuring Earth Vocabulary: Lesson 1: Lesson 2: Name: Lesson 3: Mini Lesson: Latitude Longitude Pre-Test 1. To locate exact places on the earth, one must look at a. The intersecting
Notes on Projections Part II - Common Projections James R. Clynch February 2006
 Notes on Projections Part II - Common Projections James R. Clynch February 2006 I. Common Projections There are several areas where maps are commonly used and a few projections dominate these fields. An
Basic Land Navigation. Clark County Sheriff Core Comp Rev. # Land Navigation
 Basic Land Navigation Clark County Sheriff Core Comp Rev. # 2018 1 Land Navigation Requirement Through written evaluation the applicant will demonstrate knowledge of land navigation involved in Search
HWA CHONG INSTITUTION NATIONAL POLICE CADET CORPS TOPOGRAPHY AND ORIENTEERING. Topography and Orienteering
 Topography and Orienteering 1. Introduction Orienteering is about using a topographic map and compass to find points in the landscape. It is fun and challenging, as one would need to take reference to
Erosional Features. What processes shaped this landscape?
 Have you ever looked at the land around you and wondered what processes shaped what you see? Perhaps you see mountains, valleys, rivers, or canyons. Do you know how long these geologic features have been
MAPPING THE EARTH HOW DO YOU FIND A LOCATION ON THE EARTH?
 MAPPING THE EARTH HOW DO YOU FIND A LOCATION ON THE EARTH? UNIT TOPICS TOPIC 1: LATITUDE & LONGITUDE TOPIC 2: FIELD MAPS TOPIC 3: TOPOGRAPHIC MAPS TOPIC 4: NYS LANDSCAPES TOPIC 1: LATITUDE & LONGITUDE
Introduction to Contour Maps
 Your web browser (Safari 7) is out of date. For more security, comfort and Activityengage the best experience on this site: Update your browser Ignore Introduction to Contour Maps What information does
Overview. GIS Data Output Methods
 Overview GIS Output Formats ENV208/ENV508 Applied GIS Week 2: Making maps, data visualisation, and GIS output GIS Output Map Making Types of Maps Key Elements Table Graph Statistics Maps Map Making Maps
STAAR Science Tutorial 40 TEK 8.9C: Topographic Maps & Erosional Landforms
 Name: Teacher: Pd. Date: STAAR Science Tutorial 40 TEK 8.9C: Topographic Maps & Erosional Landforms TEK 8.9C: Interpret topographic maps and satellite views to identify land and erosional features and
ENV208/ENV508 Applied GIS. Week 2: Making maps, data visualisation, and GIS output
 ENV208/ENV508 Applied GIS Week 2: Making maps, data visualisation, and GIS output Overview GIS Output Map Making Types of Maps Key Elements GIS Output Formats Table Graph Statistics Maps Map Making Maps
CONTOUR MAPS This Enrichment4You e-guide provides a brief overview of contour maps In this e-guide you will: Sample file
 GEOLOGY CONTOUR MAPS CONTOUR MAPS This Enrichment4You e-guide provides a brief overview of contour maps In this e-guide you will: *Learn Basic Facts About Contour Maps *Make a 3-D Contour Map Geology Contour
Map Skills Lesson 1. Materials: maps, pencils, Lesson 1 Worksheet, strips of paper, grid paper
 Map Skills Lesson 1 Use cardinal directions, map grids, scales, and titles to locate places on a map. Interpret a map using information from its title, compass rose, scale, and legend. Vocabulary: map,
Relative and Absolute Directions
 Relative and Absolute Directions Purpose Learning about latitude and longitude Developing math skills Overview Students begin by asking the simple question: Where Am I? Then they learn about the magnetic
AP Human Geography Chapter 1: Thinking Geographically Key Issue 1: How do Geographers describe where things are?
 AP Human Geography Chapter 1: Thinking Geographically Key Issue 1: How do Geographers describe where things are? Studying Human Geography Physical Geography Physical geography deals with Earth s natural
2. What does the map scale tell the map reader? a ratio between the actual distance on the ground and the length given to that distance on a map
 AP Human Geography - Damon Name Unit 1 - Intro to Human Geography Hour Map and Globe Skills Review Note: All links in this packet are found on our Wikispace under Map and Globe Skills Review First, read
EN5302. US ARMY ENGINEER SCHOOL CARTOGRAPHY II Grid Construction, Plotting and Projection Graticules
 SUBCOURSE EN5302 EDITION 6 US ARMY ENGINEER SCHOOL CARTOGRAPHY II Grid Construction, Plotting and Projection Graticules TABLE OF CONTENTS PAGE INTRODUCTION... iii GRADING AND CERTIFICATION INSTRUCTIONS...
Unit 1: Mapping and Astronomy
 Unit 1: Mapping and Astronomy 1 Do Now In your notebook, write your thoughts on the following: -What do you know about the beginning location and trajectory of the most recent hurricanes (Harvey or Irma)?
11. ALPINE GLACIAL LANDFORMS
 Geomorphology 11. Alpine Glacial Landforms 11. ALPINE GLACIAL LANDFORMS 40 Points One objective of this exercise is for you be able to identify alpine glacial landforms and measure their characteristics.
ORIENTEERING. The challenge is to use the map to decide the best route to complete the course in the quickest time. Orienteering Map. Compass.
 ORIENTEERING Orienteering is similar to a cross-country race but you navigate using a map instead of following a set course. It is an outdoor sport where competitors navigate their own way, you can run,