Watershed Sciences 4930 & 6920 Advanced GIS
|
|
|
- Shon Flynn
- 5 years ago
- Views:
Transcription
1 Slides by Wheaton et al. ( ) are licensed under a Creative Commons Attribution-NonCommercial-ShareAlike 3.0 Unported License Watershed Sciences 4930 & 6920 Advanced GIS WEEK TWO Lecture 3 Data Types Joe Wheaton Some slides in this lecture adapted from content from Matt Baker & Paul Bolstad


2 HOUSEKEEPING Labs? IGNORE URL submission form on Lab page Submit URL on CANVAS! Are they going okay? How long did you spend on Lab 1? Learning anything? Do you know how to get help? Do you know where to turn it in? Quiz 1 Who has a good map/bad map they d like to share?
3 TODAY S PLAN I. Basics of GIS Data I. Attribute Data and Types II. Vector Data Models I. Topology III. Raster Data Models IV. Comparison of Raster vs. Vector Data V. Data & File Structures
 geeky sort of")
4 SNOOZER OF A TOPIC But fundamental knowledge for building appropriate GIS fit for purpose You need to know what type of data your dealing with to determine what you can do with it Actually interesting in an (admittedly) geeky sort of way


5 WHAT SHOULD GIS REPRESENT? If the world is infinitely complex, but computer systems are finite All GIS applications require clear attention to the questions of: WHAT should be represented? HOW should it be represented? Spatial Location: X: Y: Associated Data: Attributes (non-spatial) Type Color LastFix FlowRate Repair Fire Hydrant Red 6/23/03 200gpm No


6 CHOICES FOR DIGITAL REPRESENTATION Throw away or ignore nonessential information Lose detail BUT, cover broader areas Discrete Objects vs. Continuous fields? or


7 REPRESENTING THE REAL WORLD Two most common spatial models for storing geographic data: vector data model geographic data is stored as coordinates raster data model a matrix of square cells represents geographic information


8 DUMB IMAGES & SMART GIS DATA Smart Vector Pavement polygons Smart Raster 5 feet grids What makes data smart?
9 TODAY S PLAN I. Basics of GIS Data I. Attribute Data and Types II. Vector Data Models I. Topology II. Attributes III. Raster Data Models IV. Comparison of Raster vs. Vector Data V. Data & File Structures
10 ATTRIBUTES Non-spatial properties or characteristics Attribute tables store Different attributes in columns Different objects in rows From Bolstad (2008) Figure 2-9

11 VECTOR ATTRIBUTES Power of discrete vector data is in attributing it In ArcGIS, the attribute table is where you can view, search, query, sort and edit attribute data.


12 SELECT BY ATTRIBUTES Very powerful query methods for selection

13 RASTER ATTRIBUTES If rasters are categorical, as opposed to continuous they will be integers Categorical rasters, can have or be linked to attribute tables
14 TODAY S PLAN I. Basics of GIS Data I. Attribute Data and Types II. Vector Data Models I. Topology II. Attributes III. Raster Data Models IV. Comparison of Raster vs. Vector Data V. Data & File Structures


15 VECTOR DATA TYPES Point Line A single x,y coordinate that represents a geographic feature too small to be displayed as a line or area at that scale A shape having length and direction but no area, connecting at least two x,y, coordinates Polygon A two-dimensional closed figure with at least three sides that represents an area.
16 ACCURACY AND PRECISION OF VECTORS? PRECISE ACCURATE Repeatability Potentially biased Closeness to a true or target value

17 VECTORS IN ARC Referred to as features.. Feature Class Feature Dataset Shapefile
18 TODAY S PLAN I. Basics of GIS Data I. Attribute Data and Types II. Vector Data Models I. Topology III. Raster Data Models IV. Comparison of Raster vs. Vector Data V. Data & File Structures


19 SPATIAL RELATIONSHIPS Adjacency Manage Overlap Intersection or Over/Underpass? Containment Proximity 100 meters
 However, one area may have multiple attributes Every place must be exactly within one area, or on a")
20 PLANAR ENFORCEMENT Objects used to describe spatial variation must obey several rules: All space on a map must be filled Two areas CANNOT overlap (must be in single plane) However, one area may have multiple attributes Every place must be exactly within one area, or on a boundary
21 NON-TOPOLOGICAL PROPERTIES If a map is stretched and distorted, some properties change: Distances Angles Relative proximities
22 TOPOLOGY What does that mean to us? A GIS topology is a set of rules and behaviors that model how points, lines, and polygons share geometry. Topology allows us to: Manage shared geometry Define and enforce data integrity rules Parcel A Parcel B Shared Edge Support sophisticated editing tools that enforce the topological constraints of the data model Support sophisticated query tools Poly A F D = = Polygon A CONTAINS points F and D but NOT C C

23 TOPOLOGICAL PROPERTIES Other properties (topological properties) remain constant after distortion: Adjacency Containment Connectivity Areas remain areas, lines remain lines, points remain points


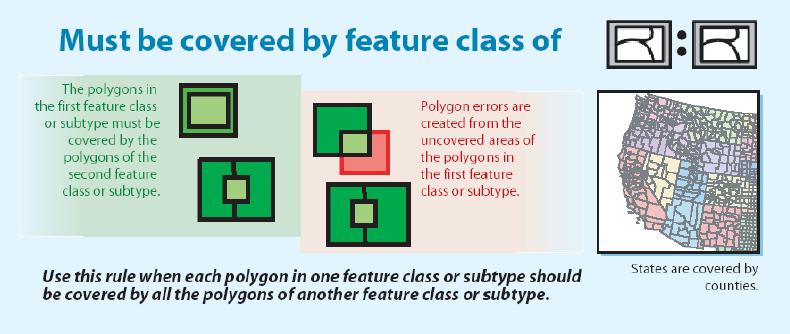
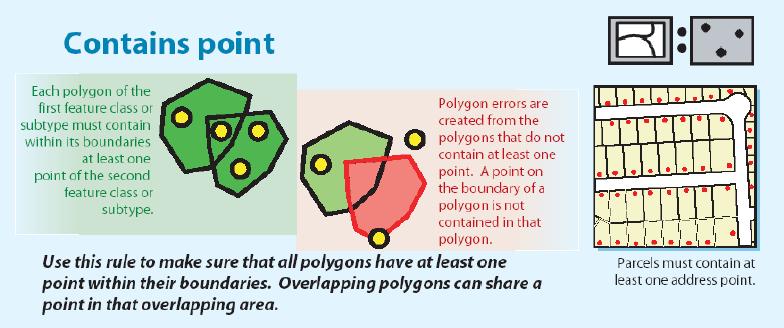
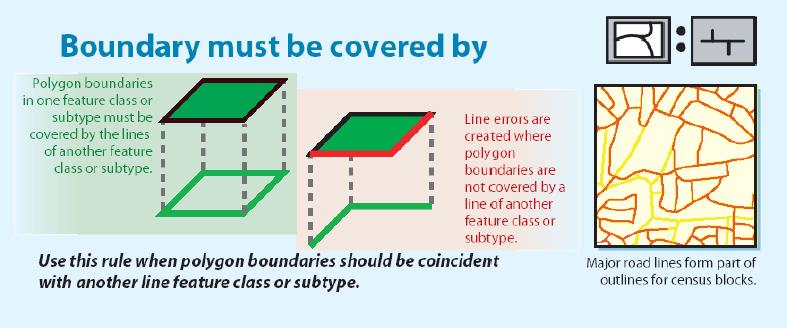
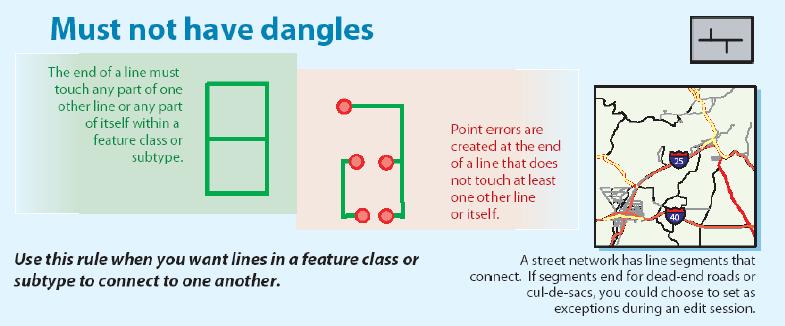
24 (SOME) TOPOLOGY RULES
25 NETWORKS AND TOPOLOGY FROM Topological relationships allow us to manage networks such as roads, tracks, electrical lines, delivery lines, and streams d If a spill occurs in the b 2 lower section of segment a c 4 3, what other segments 1 will be impacted? Topology allows us to understand FROM and TO nodes. f 5 3 e Segments: 3, 6, 7 Nodes: e, g, h 6 g What nodes will be impacted? 7 h TO
 See for more info: http://help.arcgis.com/en/arcgisdesktop/10.0/help/index.html# /An_overview_of_topology_in_ArcGIS/006200000001000000/")
26 NO TOPOLOGY PLANS FOR NOW For now we don t have any topology lab exercises planned. However, this could be something you want to teach yourself for your projects ( 6&Product_ID=793) See for more info: /An_overview_of_topology_in_ArcGIS/ /
27 TODAY S PLAN I. Basics of GIS Data I. Coordinate Data II. Attribute Data and Types II. Vector Data Models I. Topology III. Raster Data Models IV. Comparison of Raster vs. Vector Data V. Data & File Structures
28 RASTER DATA MODEL Each location represented by a cell (pixel) Cells organized as a matrix of rows and columns called a grid Each grid cells contains numeric values that represent some kind of geographic phenomenon


29 RASTER DATA May represent either: spatially continuous data with integer or decimal values (DEM) discrete features with categorical values (classes)

30 RASTER DATA Because the raster data model is a regular grid, spatial relationships are implicit No need to store spatial relationships, simple data structure, many-to-one Every cell has a value, so size a function of extent and resolution

31 RASTER LIMITATIONS Raster data generalizes the real world.
32 RASTERS: NOT PRECISELY REAL Rasters are generalizations of reality impossible to sample every location in a landscape to measure values (e.g., elevation, rainfall, images) An alternative is to sample at fewer locations, and then interpolate (estimate between) or generalize values for the rest of the surface every raster generalizes across each cell some generalize across many cells according to specific rules (e.g., Inverse Distance Weighting, Spline, Kriging)


33 RASTERS: THE MIXED PIXEL PROBLEM

34 RASTER RESOLUTION & THE N 2 PROBLEM

35 RESOLUTION TRADEOFFS Coarser resolution = loss of data Larger cells results in more aggregation, faster analyses Saves storage space, but compromises detail Finer resolution = more accurate information Smaller cells are more accurate, capture detail Takes up more storage space, slower analyses

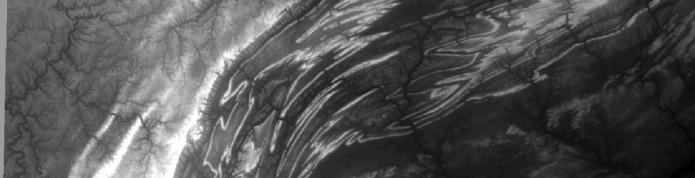
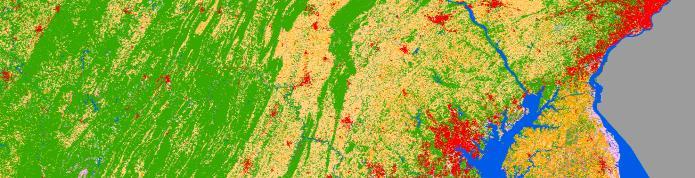
36 A 100 m DEM 36

37 100m DEM? 37


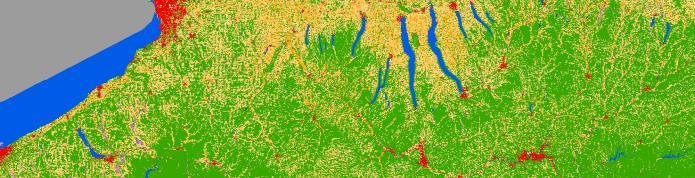
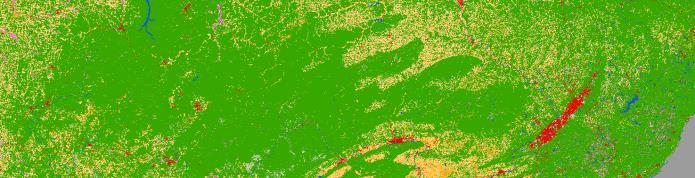
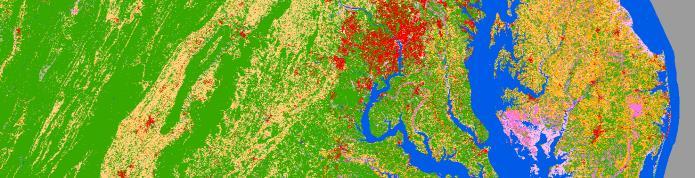
38 10 m vs. 100 m DEM 38

")
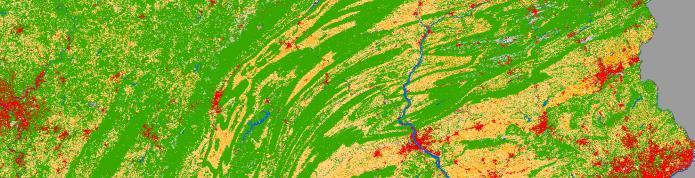
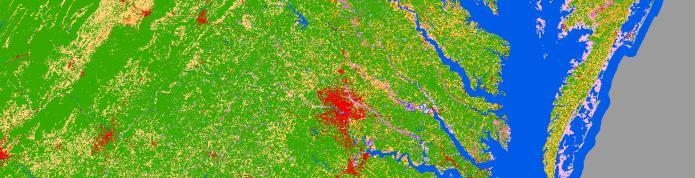
39 10 m DEM vs. 1 m DEM (LiDAR) 39
 Lower left coordinates (x,y) or Top, Bottom, Right & Left coordinates (i.e. extents) From which the following secondary properties can be derived: Width & Height")
40 RASTER TERMINOLOGY All rasters have the following primary properties Number of columns & rows (must be integers) Cell resolution (grid size) Type (integer, floating point precision) Lower left coordinates (x,y) or Top, Bottom, Right & Left coordinates (i.e. extents) From which the following secondary properties can be derived: Width & Height
41 ORTHOGONALITY Orthogonal rasters must: Share exact same grid resolution Share the exact same grid centers (i.e. aligned in both easting and northing)
42 Left Right CONCURRENCY Grids are orthogonal and: Share exact same extents Top Bottom


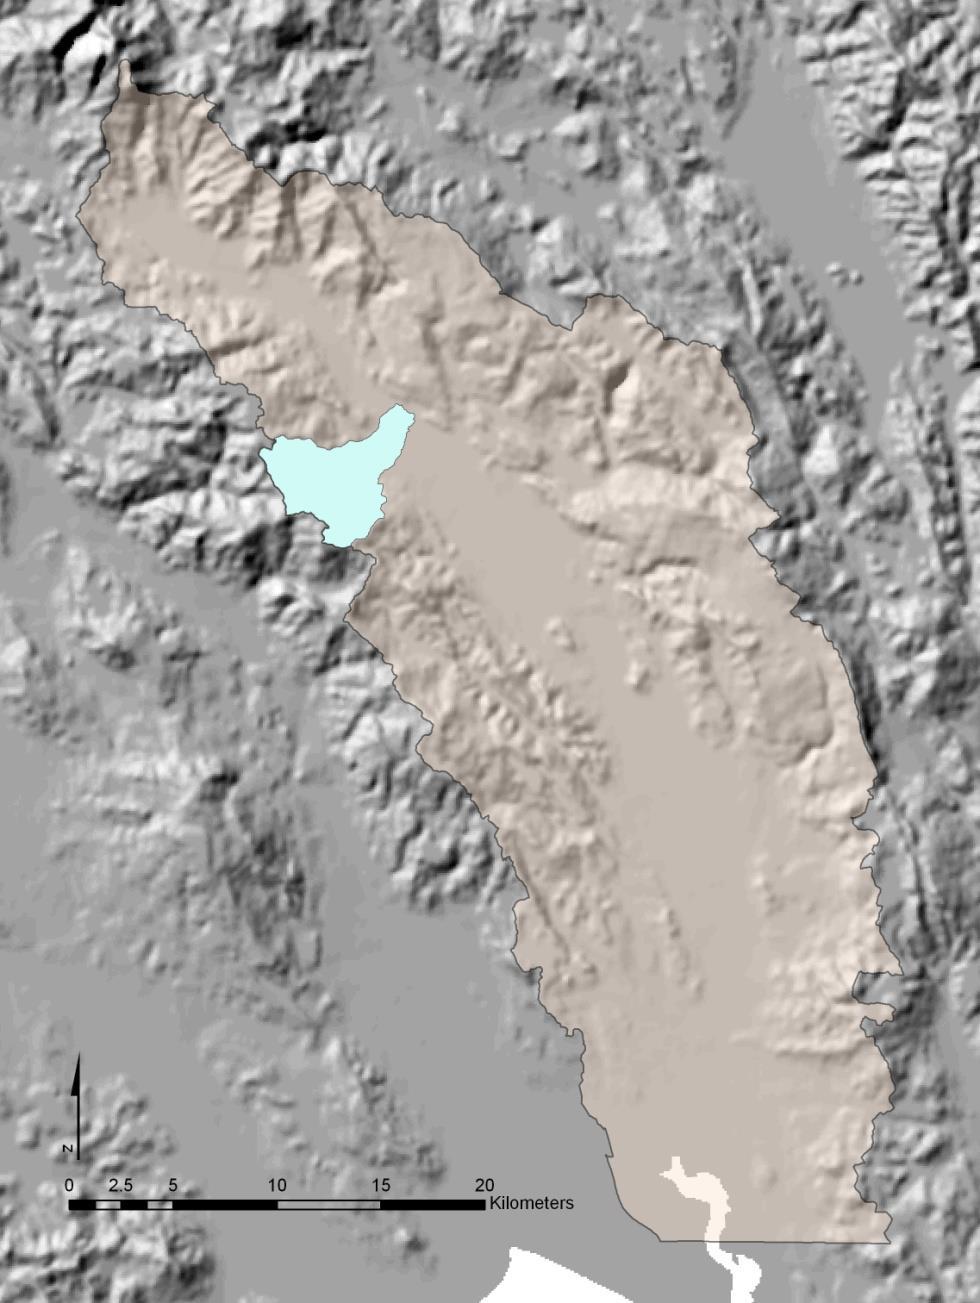
43 MASKED EXTENTS Rasters that have the same masked extents, simply have the same nodata cells The mask can be derived from a polygon or a raster A concurrent raster mask is the most accurate! NoData Cells allow sparse rasters From:

")

44 TO DO MAP ALGEBRA, RASTERS NEED TO BE COMPATIBLE (i.e. Concurrent) Compatibility defined by orientation, origin and resolution
45 SAME NUMBERS & ROWS, BUT Same resolution, different orientation, different origin & extents (but same width & height) Same resolution, same orientation, different origin & extents NOT CONCURRENT Different resolution, same orientation, same origin

46 EVER SEEN SOMETHING LIKE THIS? The consistent horizontal and vertical bands are systematic errors! They are minor enough, most people ignore them, but they are unnecessary They are artifacts of resampling a raster to extents that were not orthogonal to the original raster


47 ARC HIDES USER FROM THIS UGLINESS If you give ArcGIS two overlapping but non-orthogonal rasters, it just lets you do the raster algebra It does this by a combination of using Environment settings to select extents and a grid resolution; & Resampling to make concurrent grids so raster algebra can be done The result is the geoprocessing tool usually works and the user has no idea what it did behind the scenes
48 RASTERS: SUMMARY Grid provides inherent location information Features lose spatial identity as aggregations All features treated same way Often not very precise, depends on cell size Simple computations Usually many-to-one cell to attribute table Areas of inadequate info receive NODATA Accuracy depends upon representative sampling Are overlapping rasters orthogonal or concurrent?
49 TODAY S PLAN I. Basics of GIS Data I. Coordinate Data II. Attribute Data and Types II. Vector Data Models I. Topology III. Raster Data Models IV. Comparison of Raster vs. Vector Data V. Data & File Structures

50 REPRESENTING GEOGRAPHIC FEATURES The raster data model can represent discrete features but A linear feature as a series of connected cells A point feature is represented as a single cell An area feature as a group of connected cells Uniformity facilitates mergers
51 VECTORS VS RASTERS Best for Objects Can do surfaces (TIN) Complex Structure Efficient Storage Slow Processing Precise at all scales Best for Surfaces Can represent objects Simple Structure Large (compression) Rapid Processing Precision depends on cell size relative to features

52 MORE COMPARISON (FROM BOOK) Characteristic Vector Raster Data Structure Usually complex Usually simple Storage Requirements Coordinate Conversion Analysis Positional Precision Small for most data sets Simple Preferred for network analyses, many other spatial operations more complex Limited only by positional measurements Large for most data sets w/o compression May be slow due to data volumes and requires resampling Easy for continuous data, simple for many layer combinations Floor set by cell size Accessibility Often complex Easy to modify or program, due to simple data structure Display & Output Map-like, with continuous curves, poor for images Good for images, but discrete features may show stairstep edges
53 TODAY S PLAN I. Basics of GIS Data I. Attribute Data and Types II. Vector Data Models I. Topology III. Raster Data Models IV. Comparison of Raster vs. Vector Data V. Data & File Structures
, tab or comma deliminated (*.csv), excell (*.xls), or shape files (*.shp and *.shx).")
54 VECTORIZED DATA A collection of points with attrributes: Point Number, Easting (x), Northing (y), Elevation (z), Description, etc. Variety of acceptable formats: Ascii text (*.txt or *.asc or *.dat), tab or comma deliminated (*.csv), excell (*.xls), or shape files (*.shp and *.shx). Important to have a header & know units Y (northing) X (easting) Irregularly distributed point data 54


55 RASTER DATA SOURCES (DERIVED) Elevation data on a pre-specified uniform grid From the header information, you have all the necessary information. Why raster? Smaller file sizes, easier computationally. Arc Ascii Grid is a simple example that you can read: 55
56 COMMON FILE TYPES (Beyond ASCII) Type & Source Extension Characteristics (R=Raster, V=Vector, A=Attribute, I=image) DLG, USGS *.opt, *.ddf, *.dbf Digital Line graph Data (V,A) DXY, AutoDesk *.dxf Drawing exchange file, an ASCII or binary file for exchanging spatial data (V) DWG, AutoDesk *.dwg Native binary file used by AutoDesk to store drawings in AutoCAD (V) Interchange, ESRI *.e00 ASCII text file for vector and identify attribute data (V) Shapefile, ESRI *.shp, *.shx, *.dbf, *.prj, etc. Three or more binary files that include the vector coordinate, attribute, and other info (V) VPF, US DoD various Vector Products Format, Defense Mapping Agency Distribution Specification TIGER, US Census Tgrxxyyy, stfzz Set of files by US census areas, xx is a state code, yyy an area code, zz numbers for different file types MIF/MID, MapInfo *.mif, *.mid Map Interchange File, vector and raster data transport from MapInfo (V,R) SDTS, US Gov none Spatial Data Transfer Standard, specifies spatial objects, attributes, reference system, data dictionary, and other info (R, V, A) GeoTIFF, Workgroup *.tif, *.tiff An extension for geo-referencing Aldus-Adobe public domain TIFF format (R) DEM, U.S.G.S. *.dem ASCII text format used ot distribute elevation data (R) Imagine, ERDAS *.img Multiband-cpabale image format (R)
57 TODAY S PLAN I. Basics of GIS Data I. Attribute Data and Types II. Vector Data Models I. Topology III. Raster Data Models IV. Comparison of Raster vs. Vector Data V. Data & File Structures
58 QUIZ! QUIZ 2 DUE ON Thursday (ON Canvas)
59 IN LAB NEXT WEEK 1. Do I know the difference between a geographic and a projected coordinate system? 2. Do I know the difference between Cartesian, polar and cylindrical coordinate systems? 3. What is an assumed coordinate system? 4. When is it necessary to transform my data from one coordinate system to another? 5. What is the appropriate transformation method to use? 6. When I download data, how do I know what coordinate system it is in? 7. How do know if my data are in the right place?


60 LAB 2 COORDINATE DATA, PROJECTIONS & TRANSFORMATIONS

61 LAB 2 COORDINATE DATA, PROJECTIONS & TRANSFORMATIONS Raw TS Data: Local, Assumed, Cartesian Coordinate System Transformed TS Data: Projected in UTM Zone 12N, real world coordinate system

62 LAB 2 COORDINATE DATA, PROJECTIONS & TRANSFORMATIONS

63 READING FOR TODAY
Applied Cartography and Introduction to GIS GEOG 2017 EL. Lecture-2 Chapters 3 and 4
 Applied Cartography and Introduction to GIS GEOG 2017 EL Lecture-2 Chapters 3 and 4 Vector Data Modeling To prepare spatial data for computer processing: Use x,y coordinates to represent spatial features
FNRM 3131 Introduction to GIS in Natural Resource Management
 FNRM 3131 Introduction to GIS in Natural Resource Management Instructors: Andrew C Jenks 215 Green Hall ajenks@umnedu, @acjenks Paul V Bolstad 301H Green Hall pbolstad@umnedu Course Topics Motivation:
Introduction-Overview. Why use a GIS? What can a GIS do? Spatial (coordinate) data model Relational (tabular) data model
 data model Relational (tabular) data model") Introduction-Overview Why use a GIS? What can a GIS do? How does a GIS work? GIS definitions Spatial (coordinate) data model Relational (tabular) data model intro_gis.ppt 1 Why use a GIS? An extension
Introduction-Overview Why use a GIS? What can a GIS do? How does a GIS work? GIS definitions Spatial (coordinate) data model Relational (tabular) data model intro_gis.ppt 1 Why use a GIS? An extension
Welcome to NR502 GIS Applications in Natural Resources. You can take this course for 1 or 2 credits. There is also an option for 3 credits.
 Welcome to NR502 GIS Applications in Natural Resources. You can take this course for 1 or 2 credits. There is also an option for 3 credits. The 1st credit consists of a series of readings, demonstration,
NR402 GIS Applications in Natural Resources
 NR402 GIS Applications in Natural Resources Lesson 1 Introduction to GIS Eva Strand, University of Idaho Map of the Pacific Northwest from http://www.or.blm.gov/gis/ Welcome to NR402 GIS Applications in
Introduction INTRODUCTION TO GIS GIS - GIS GIS 1/12/2015. New York Association of Professional Land Surveyors January 22, 2015
 New York Association of Professional Land Surveyors January 22, 2015 INTRODUCTION TO GIS Introduction GIS - GIS GIS 1 2 What is a GIS Geographic of or relating to geography the study of the physical features
Geographic Information Systems. Introduction to Data and Data Sources
 Geographic Information Systems Introduction to Data and Data Sources Presented by John Showler, NJDA-SSCC NJ SCD GIS Training Session December 10, 209 The Objectives of this session are 3-fold: 1. Introduce
Terms GIS GPS Vector Data Model Raster Data Model Feature Attribute Table Point Line Polygon Pixel RGB Overlay Function
 FINAL REVIEW FOR GIS (2016) PRACTICAL COMPONENT The first 40 mins of the exam will be open book and will require you to make a map using all the techniques learned over the semester. This map will be e-mailed
GIS Lecture 5: Spatial Data
 GIS Lecture 5: Spatial Data GIS 1 Outline Vector Data Formats Raster Data Formats Map Projections Coordinate Systems US Census geographic files US Census data files GIS Data Sources GIS 2 Vector Data Formats
ArcMap - EXPLORING THE DATABASE Part I. SPATIAL DATA FORMATS Part II
 Week 5 ArcMap - EXPLORING THE DATABASE Part I SPATIAL DATA FORMATS Part II topics of the week Exploring the Database More on the Table of Contents Exploration tools Identify, Find, Measure, Map tips, Hyperlink,
Popular Mechanics, 1954
 Introduction to GIS Popular Mechanics, 1954 1986 $2,599 1 MB of RAM 2017, $750, 128 GB memory, 2 GB of RAM Computing power has increased exponentially over the past 30 years, Allowing the existence of
Dr. ABOLGHASEM AKBARI Faculty of Civil Engineering & Earth Resources, University Malaysia Pahang (UMP)
") Workshop on : Dr. ABOLGHASEM AKBARI Faculty of Civil Engineering & Earth Resources, University Malaysia Pahang (UMP) 14-15 April 2016 Venue: Tehran, Iran GIS definitions GIS: A simplified view of the real
Workshop on : Dr. ABOLGHASEM AKBARI Faculty of Civil Engineering & Earth Resources, University Malaysia Pahang (UMP) 14-15 April 2016 Venue: Tehran, Iran GIS definitions GIS: A simplified view of the real
Lecture 6 - Raster Data Model & GIS File Organization
 Lecture 6 - Raster Data Model & GIS File Organization I. Overview of Raster Data Model Raster data models define objects in a fixed manner see Figure 1. Each grid cell has fixed size (resolution). The
Geography 38/42:376 GIS II. Topic 1: Spatial Data Representation and an Introduction to Geodatabases. The Nature of Geographic Data
 Geography 38/42:376 GIS II Topic 1: Spatial Data Representation and an Introduction to Geodatabases Chapters 3 & 4: Chang (Chapter 4: DeMers) The Nature of Geographic Data Features or phenomena occur as
Geographers Perspectives on the World
 What is Geography? Geography is not just about city and country names Geography is not just about population and growth Geography is not just about rivers and mountains Geography is a broad field that
WORKING WITH DMTI DIGITAL ELEVATION MODELS (DEM)
") WORKING WITH DMTI DIGITAL ELEVATION MODELS (DEM) Contents (Ctrl-Click to jump to a specific page) Manipulating the DEM Step 1: Finding the DEM Tiles You Need... 2 Step 2: Importing the DEM Tiles into ArcMap...
WORKING WITH DMTI DIGITAL ELEVATION MODELS (DEM) Contents (Ctrl-Click to jump to a specific page) Manipulating the DEM Step 1: Finding the DEM Tiles You Need... 2 Step 2: Importing the DEM Tiles into ArcMap...
Display data in a map-like format so that geographic patterns and interrelationships are visible
 Vilmaliz Rodríguez Guzmán M.S. Student, Department of Geology University of Puerto Rico at Mayagüez Remote Sensing and Geographic Information Systems (GIS) Reference: James B. Campbell. Introduction to
EnvSci 360 Computer and Analytical Cartography
 EnvSci 360 Computer and Analytical Cartography Lecture 7 Mapping Images, Surfaces, and 3-D Data Brief Overview of Imagery What is Imagery? A spatial data model that defines space as an array of equally
Outline. Chapter 1. A history of products. What is ArcGIS? What is GIS? Some GIS applications Introducing the ArcGIS products How does GIS work?
 Outline Chapter 1 Introducing ArcGIS What is GIS? Some GIS applications Introducing the ArcGIS products How does GIS work? Basic data formats The ArcCatalog interface 1-1 1-2 A history of products Arc/Info
An Introduction to Geographic Information System
 An Introduction to Geographic Information System PROF. Dr. Yuji MURAYAMA Khun Kyaw Aung Hein 1 July 21,2010 GIS: A Formal Definition A system for capturing, storing, checking, Integrating, manipulating,
Lecture 9: Geocoding & Network Analysis
 Massachusetts Institute of Technology - Department of Urban Studies and Planning 11.520: A Workshop on Geographic Information Systems 11.188: Urban Planning and Social Science Laboratory Lecture 9: Geocoding
Handling Raster Data for Hydrologic Applications
 Handling Raster Data for Hydrologic Applications Prepared by Venkatesh Merwade Lyles School of Civil Engineering, Purdue University vmerwade@purdue.edu January 2018 Objective The objective of this exercise
Lecture 1 Intro to GIS and GIS Vector and Raster Data Models
 Lecture 1 Intro to GIS and GIS Vector and Raster Data Models Tomislav Sapic GIS Technologist Faculty of Natural Resources Management Lakehead University Object GIS layer Use Hydro Pole utilities utility
Introduction to Geographic Information Systems
 Introduction to Geographic Information Systems Lynn_Carlson@brown.edu 401-863-9917 The Environmental And Remote TecHnologies Lab MacMillan Hall, Room 105 http://www.brown.edu/research/earthlab/ Outline
Exercise 6: Working with Raster Data in ArcGIS 9.3
 Exercise 6: Working with Raster Data in ArcGIS 9.3 Why Spatial Analyst? Grid query Grid algebra Grid statistics Summary by zone Proximity mapping Reclassification Histograms Surface analysis Slope, aspect,
DATA SOURCES AND INPUT IN GIS. By Prof. A. Balasubramanian Centre for Advanced Studies in Earth Science, University of Mysore, Mysore
 DATA SOURCES AND INPUT IN GIS By Prof. A. Balasubramanian Centre for Advanced Studies in Earth Science, University of Mysore, Mysore 1 1. GIS stands for 'Geographic Information System'. It is a computer-based
MERGING (MERGE / MOSAIC) GEOSPATIAL DATA
 GEOSPATIAL DATA") This help guide describes how to merge two or more feature classes (vector) or rasters into one single feature class or raster dataset. The Merge Tool The Merge Tool combines input features from input
This help guide describes how to merge two or more feature classes (vector) or rasters into one single feature class or raster dataset. The Merge Tool The Merge Tool combines input features from input
In this exercise we will learn how to use the analysis tools in ArcGIS with vector and raster data to further examine potential building sites.
 GIS Level 2 In the Introduction to GIS workshop we filtered data and visually examined it to determine where to potentially build a new mixed use facility. In order to get a low interest loan, the building
GIS Lecture 4: Data. GIS Tutorial, Third Edition GIS 1
 GIS Lecture 4: Data GIS 1 Outline Data Types, Tables, and Formats Geodatabase Tabular Joins Spatial Joins Field Calculator ArcCatalog Functions GIS 2 Data Types, Tables, Formats GIS 3 Directly Loadable
Working with Digital Elevation Models and Digital Terrain Models in ArcMap 9
 Working with Digital Elevation Models and Digital Terrain Models in ArcMap 9 1 TABLE OF CONTENTS INTRODUCTION...3 WORKING WITH DIGITAL TERRAIN MODEL (DTM) DATA FROM NRVIS, CITY OF KITCHENER, AND CITY OF
Introducing GIS analysis
 1 Introducing GIS analysis GIS analysis lets you see patterns and relationships in your geographic data. The results of your analysis will give you insight into a place, help you focus your actions, or
Geospatial Products V8i (SELECTseries 1)
") Geospatial Products V8i (SELECTseries 1) Keith Raymond Product Manager Geospatial Desktop Products Presentation Overview What are the various products? Why would you need them? Demonstrations 2 WWW.BENTLEY.COM
Geospatial Products V8i (SELECTseries 1) Keith Raymond Product Manager Geospatial Desktop Products Presentation Overview What are the various products? Why would you need them? Demonstrations 2 WWW.BENTLEY.COM
SRJC Applied Technology 54A Introduction to GIS
 SRJC Applied Technology 54A Introduction to GIS Overview Lecture of Geographic Information Systems Fall 2004 Santa Rosa Junior College Presented By: Tim Pudoff, GIS Coordinator, County of Sonoma, Information
caused displacement of ocean water resulting in a massive tsunami. II. Purpose
 I. Introduction The Great Sumatra Earthquake event took place on December 26, 2004, and was one of the most notable and devastating natural disasters of the decade. The event consisted of a major initial
Introduction to GIS - 2
 Introduction to GIS - 2 Outline Using GIS Representation of spatial objects in GIS Prof. D. Nagesh Kumar Department of Civil Engineering Indian Institute of Science Bangalore 560 012, India http://www.civil.iisc.ernet.in/~nagesh
Introduction to Geographic Information Systems (GIS): Environmental Science Focus
: Environmental Science Focus") Introduction to Geographic Information Systems (GIS): Environmental Science Focus September 9, 2013 We will begin at 9:10 AM. Login info: Username:!cnrguest Password: gocal_bears Instructor: Domain: CAMPUS
Introduction to Geographic Information Systems (GIS): Environmental Science Focus September 9, 2013 We will begin at 9:10 AM. Login info: Username:!cnrguest Password: gocal_bears Instructor: Domain: CAMPUS
Projections and Coordinate Systems
 Projections and Coordinate Systems Overview Projections Examples of different projections Coordinate systems Datums Projections Overview Projections and Coordinate Systems GIS must accurately represent
GIS = Geographic Information Systems;
 What is GIS GIS = Geographic Information Systems; What Information are we talking about? Information about anything that has a place (e.g. locations of features, address of people) on Earth s surface,
Watershed Sciences 4930 & 6920 GEOGRAPHIC INFORMATION SYSTEMS
 PROJECTS Watershed Sciences 4930 & 6920 GEOGRAPHIC INFORMATION SYSTEMS WEEK THREE Lecture 5 PROJECT DATA/IDEAS, PROJECTIONS (Cont.) & LAB REVIEW Joe Wheaton GUEST LECTURE HOUSEKEEPING: LAB 01 GRADES This
How to Create Stream Networks using DEM and TauDEM
 How to Create Stream Networks using DEM and TauDEM Take note: These procedures do not describe all steps. Knowledge of ArcGIS, DEMs, and TauDEM is required. TauDEM software ( http://hydrology.neng.usu.edu/taudem/
Overview key concepts and terms (based on the textbook Chang 2006 and the practical manual)
") Introduction Geo-information Science (GRS-10306) Overview key concepts and terms (based on the textbook 2006 and the practical manual) Introduction Chapter 1 Geographic information system (GIS) Geographically
Introduction Geo-information Science (GRS-10306) Overview key concepts and terms (based on the textbook 2006 and the practical manual) Introduction Chapter 1 Geographic information system (GIS) Geographically
What are the five components of a GIS? A typically GIS consists of five elements: - Hardware, Software, Data, People and Procedures (Work Flows)
") LECTURE 1 - INTRODUCTION TO GIS Section I - GIS versus GPS What is a geographic information system (GIS)? GIS can be defined as a computerized application that combines an interactive map with a database
LECTURE 1 - INTRODUCTION TO GIS Section I - GIS versus GPS What is a geographic information system (GIS)? GIS can be defined as a computerized application that combines an interactive map with a database
 www.goldensoftware.com Why Create a Thematic Map? A thematic map visually represents the geographic distribution of data. MapViewer will help you to: understand demographics define sales or insurance territories
2. GETTING STARTED WITH GIS
 2. GETTING STARTED WITH GIS What are geographic information systems and what are they used for? ArcGIS: ArcMap, ArcCatalog and ArcToolbox Vector data vs. raster data vs. attribute tables Polygons, polylines,
Course overview. Grading and Evaluation. Final project. Where and When? Welcome to REM402 Applied Spatial Analysis in Natural Resources.
 Welcome to REM402 Applied Spatial Analysis in Natural Resources Eva Strand, University of Idaho Map of the Pacific Northwest from http://www.or.blm.gov/gis/ Where and When? Lectures Monday & Wednesday
Working with Digital Elevation Models and Spot Heights in ArcMap
 Working with Digital Elevation Models and Spot Heights in ArcMap 10.3.1 1 TABLE OF CONTENTS INTRODUCTION... 3 WORKING WITH SPOT HEIGHTS FROM NRVIS, CITY OF KITCHENER, AND CITY OF TORONTO...4 WORKING WITH
Data Structures & Database Queries in GIS
 Data Structures & Database Queries in GIS Objective In this lab we will show you how to use ArcGIS for analysis of digital elevation models (DEM s), in relationship to Rocky Mountain bighorn sheep (Ovis
Today: GEOL 452/552 - GIS for Geoscientists I. Lecture 3 - Chapter 1. GIS vector Data (review) Let s annotate this layer (draw on paper)
 Let s annotate this layer (draw on paper)") Today: GEOL 452/552 - GIS for Geoscientists I Lecture 3 - Chapter 1 GIS vector data - review raster data history: ArcView/ArcINFO - ArcGIS types of GIS data files Lab: finish Ch. 1 tutorial and HW1 Please
Today: GEOL 452/552 - GIS for Geoscientists I Lecture 3 - Chapter 1 GIS vector data - review raster data history: ArcView/ArcINFO - ArcGIS types of GIS data files Lab: finish Ch. 1 tutorial and HW1 Please
Raster Data Model. Examples of raster data Remotely sensed imagery (BV, DN) DEM (elevation) DRG (color) Raster Database
 DEM (elevation) DRG (color) Raster Database") Raster Data Model Why use a raster data model? Raster data representations Cell value Measurement, average, majority, significance Cell-based vs. point-based Raster data components Cells, Pixels, Grid
Raster Data Model Why use a raster data model? Raster data representations Cell value Measurement, average, majority, significance Cell-based vs. point-based Raster data components Cells, Pixels, Grid
Introduction to GIS I
 Introduction to GIS Introduction How to answer geographical questions such as follows: What is the population of a particular city? What are the characteristics of the soils in a particular land parcel?
Among various open-source GIS programs, QGIS can be the best suitable option which can be used across partners for reasons outlined below.
 Comparison of Geographic Information Systems (GIS) software As of January 2018, WHO has reached an agreement with ESRI (an international supplier of GIS software) for an unlimited use of ArcGIS Desktop
ESRI Object Models and Data Capture 2/1/2018
 Number 123 124 125 ESRI* Object Models; Data Capture Feature Class (spatial table) Age_Ma 142 136 1_sigma 1.5 2.0 Rx_Type B_schist G_schist Object Class (nonspatial table) Size_kg 3.4 1.3 Y Control Point
Providing Electronic Information on Waste Water Discharge Locations
 Providing Electronic Information on Waste Water Discharge Locations Application Guidance Notes Environmental Protection Agency PO Box 3000, Johnstown Castle Estate, Co. Wexford Lo Call: 1890 335599 Telephone:
GIS CONCEPTS ARCGIS METHODS AND. 3 rd Edition, July David M. Theobald, Ph.D. Warner College of Natural Resources Colorado State University
 GIS CONCEPTS AND ARCGIS METHODS 3 rd Edition, July 2007 David M. Theobald, Ph.D. Warner College of Natural Resources Colorado State University Copyright Copyright 2007 by David M. Theobald. All rights
Tutorial 8 Raster Data Analysis
 Objectives Tutorial 8 Raster Data Analysis This tutorial is designed to introduce you to a basic set of raster-based analyses including: 1. Displaying Digital Elevation Model (DEM) 2. Slope calculations
Lab 1: Importing Data, Rectification, Datums, Projections, and Coordinate Systems
 Lab 1: Importing Data, Rectification, Datums, Projections, and Coordinate Systems Topics covered in this lab: i. Importing spatial data to TAS ii. Rectification iii. Conversion from latitude/longitude
EEOS 381 -Spatial Databases and GIS Applications
 EEOS 381 -Spatial Databases and GIS Applications Lecture 5 Geodatabases What is a Geodatabase? Geographic Database ESRI-coined term A standard RDBMS that stores and manages geographic data A modern object-relational
ESRI* Object Models; Data Capture
 ESRI* Object Models; Data Capture * Environmental Systems Research Institute Feature Class (spatial table) Number Age_Ma 1_sigma Rx_Type Size_kg 123 124 125 142 1.5 B_schist 136 2.0 G_schist Object Class
Copyright The McGraw-Hill Companies, Inc. Permission required for reproduction or display.
 CHAPTER 5 GIS DATA Acquisition 5.1 Existing GIS Data 5.1.1 Federal Geographic Data Committee 5.1.2 Geospatial One-Stop Box 5.1 Clearinghouse and Portal 5.1.3 U.S. Geological Survey 5.1.4 U.S. Census Bureau
FlexiCadastre User Conference 2013 GIS Data Verification & Challenges
 FlexiCadastre User Conference 2013 GIS Data Verification & Challenges May 7, 2013 Amanda Blackmore GIS Specialist OVERVIEW GIS Definitions & Terminology Spatial Data Common Issues or Concerns Data Verification
ENV208/ENV508 Applied GIS. Week 1: What is GIS?
 ENV208/ENV508 Applied GIS Week 1: What is GIS? 1 WHAT IS GIS? A GIS integrates hardware, software, and data for capturing, managing, analyzing, and displaying all forms of geographically referenced information.
Trail Flow: Analysis of Drainage Patterns Affecting a Mountain Bike Trail
 Andy Belcher BAE 590 Professor Huffman 12.9.11 Location Trail Flow: Analysis of Drainage Patterns Affecting a Mountain Bike Trail The location of the project area rests in the Cary area of Wake County,
ESRI Object Models and Data Capture 9/18/ /18/2014 M. Helper GEO327G/386G, UT Austin 2. ESRI Arc/Info ArcView ArcGIS
 ESRI Object Models; Data Capture Conceptual Models Conceptual Models Characterized all features or phenomena as: Feature Class (spatial table) Number Age_Ma 1_sigma Rx_Type 123 142 1.5 B_schist 124 136
ESRI* Object Models; Data Capture
 ESRI* Object Models; Data Capture * Environmental Systems Research Institute Feature Class (spatial table) Number Age_Ma 1_sigma Rx_Type Size_kg 123 124 125 142 1.5 B_schist 136 2.0 G_schist Object Class
When Map Quality Matters
 When Map Quality Matters 50% 25% Powerful geospatial mapping tools for Adobe Creative Cloud and offline map solutions for mobile devices 20% When Map Quality Matters 10% We re focused on creating powerful
Susan Cutter et al. Aug, 2002, The Professional Geographer, 54(3): David Tenenbaum GEOG 070 UNC-CH Spring 2005
: David Tenenbaum GEOG 070 UNC-CH Spring 2005") What is Geography? Geography is not just about city and country names Geography is not just about population and growth Geography is not just about rivers and mountains Geography is a broad field that
What is Geography? Geography is not just about city and country names Geography is not just about population and growth Geography is not just about rivers and mountains Geography is a broad field that
Geodatabase An Introduction
 2013 Esri International User Conference July 8 12, 2013 San Diego, California Technical Workshop Geodatabase An Introduction David Crawford and Jonathan Murphy Session Path The Geodatabase What is it?
Understanding Projections for GIS
 Presented by John Schaeffer Juniper GIS Services, Inc. This PowerPoint is available at JuniperGIS.com Presentation Objectives To understand basic concepts on projections and coordinate systems for the
Introduction to Spatial Data Resources and Analysis for research in Urban Design and Planning
 Introduction to Spatial Data Resources and Analysis for research in Urban Design and Planning 2-day workshop notes 27-28 September 2004 Introductions please put on a name tag to help me know who you are
GIS Boot Camp for Education June th, 2011 Day 1. Instructor: Sabah Jabbouri Phone: (253) x 4854 Office: TC 136
 x 4854 Office: TC 136") GIS Boot Camp for Education June 27-30 th, 2011 Day 1 Instructor: Sabah Jabbouri Phone: (253) 833-9111 x 4854 Office: TC 136 Email: sjabbouri@greenriver.edu http://www.instruction.greenriver.edu/gis/ Summer
GIS Boot Camp for Education June 27-30 th, 2011 Day 1 Instructor: Sabah Jabbouri Phone: (253) 833-9111 x 4854 Office: TC 136 Email: sjabbouri@greenriver.edu http://www.instruction.greenriver.edu/gis/ Summer
PC ARC/INFO and Data Automation Kit GIS Tools for Your PC
 ESRI PC ARC/INFO and Data Automation Kit GIS Tools for Your PC PC ARC/INFO High-quality digitizing and data entry Powerful topology building Cartographic design and query Spatial database query and analysis
+ = Spatial Analysis of Raster Data. 2 =Fault in shale 3 = Fault in limestone 4 = no Fault, shale 5 = no Fault, limestone. 2 = fault 4 = no fault
 Spatial Analysis of Raster Data 0 0 1 1 0 0 1 1 1 0 1 1 1 1 1 1 2 4 4 4 2 4 4 2 4 4 4 2 4 4 2 4 4 3 4 4 4 2 3 + = 0 = shale 1 = limestone 2 = fault 4 = no fault 2 =Fault in shale 3 = Fault in limestone
GEO-DATA INPUT AND CONVERSION. Christos G. Karydas,, Dr. Lab of Remote Sensing and GIS Director: Prof. N. Silleos
 Christos G. Karydas,, Dr. xkarydas@agro.auth.gr http://users.auth.gr/xkarydas Lab of Remote Sensing and GIS Director: Prof. N. Silleos School of Agriculture Aristotle University of Thessaloniki, GR 1 0.
GIS Resources for Local Governments
 ISSUE PAPER SERIES GIS Resources for Local Governments February 2018 NEW YORK STATE TUG HILL COMMISSION DULLES STATE OFFICE BUILDING 317 WASHINGTON STREET WATERTOWN, NY 13601 (315) 785-2380 WWW.TUGHILL.ORG
The Geodatabase Working with Spatial Analyst. Calculating Elevation and Slope Values for Forested Roads, Streams, and Stands.
 GIS LAB 7 The Geodatabase Working with Spatial Analyst. Calculating Elevation and Slope Values for Forested Roads, Streams, and Stands. This lab will ask you to work with the Spatial Analyst extension.
Introduction to the 176A labs and ArcGIS
 Introduction to the 176A labs and ArcGIS Acknowledgement: Slides by David Maidment, U Texas-Austin and Francisco Olivera (TAMU) Purpose of the labs Hands-on experience with one software pakage Introduction
Key Questions and Issues. What is GIS? GIS is to geographic analysis as: What is GIS? 9/3/2013. GEO 327G/386G, UT Austin 1
 What is GIS? Key Questions and Issues Geology Elevation Transportation Hydrography Imagery What is GIS? What are the applications of GIS? How is the real world represented in GIS? What analyses can GIS
YYT-C3002 Application Programming in Engineering GIS I. Anas Altartouri Otaniemi
 YYT-C3002 Application Programming in Engineering GIS I Otaniemi Overview: GIS lectures & exercise We will deal with GIS application development in two lectures. Because of the versatility of GIS data models
Lab 1: Landuse and Hydrology, learning ArcGIS II. MANIPULATING DATA
 Lab 1: Landuse and Hydrology, learning ArcGIS II. MANIPULATING DATA As you experienced in the first lab session when you created a hillshade, high resolution data can be unwieldy if you are trying to perform
Intro to GIS Fall 2010 Georeferencing & Map Projections
 Intro to GIS Fall 2010 Georeferencing & Map Projections SHAPE OF THE EARTH Earth's Shape Geoid: shape of earth minus topographic features (irregular due to local variations in gravity) Ellipsoid: elongated
Export Basemap Imagery from GIS to CAD
 Export Basemap Imagery from GIS to CAD This tutorial illustrates how to add high resolution imagery as a basemap into an existing CAD drawing using ArcGIS and AutoCAD. Through this method, the imagery
Data Space and Web. A Geospatial Journey
 Data Space and Web A Geospatial Journey Geographical Information Systems (GIS) (definitions) Geographic information system, a system for storing and manipulating geographical information on computer (Merriam
GIS CONCEPTS ARCGIS METHODS AND. 2 nd Edition, July David M. Theobald, Ph.D. Natural Resource Ecology Laboratory Colorado State University
 GIS CONCEPTS AND ARCGIS METHODS 2 nd Edition, July 2005 David M. Theobald, Ph.D. Natural Resource Ecology Laboratory Colorado State University Copyright Copyright 2005 by David M. Theobald. All rights
INTRODUCTION TO GIS. Dr. Ori Gudes
 INTRODUCTION TO GIS Dr. Ori Gudes Outline of the Presentation What is GIS? What s the rational for using GIS, and how GIS can be used to solve problems? Explore a GIS map and get information about map
Projections & GIS Data Collection: An Overview
 Projections & GIS Data Collection: An Overview Projections Primary data capture Secondary data capture Data transfer Capturing attribute data Managing a data capture project Geodesy Basics for Geospatial
Geoprocessing Tools at ArcGIS 9.2 Desktop
 Geoprocessing Tools at ArcGIS 9.2 Desktop Analysis Tools Analysis Tools \ Extract Clip Analysis Tools \ Extract Select Analysis Tools \ Extract Split Analysis Tools \ Extract Table Select Analysis Tools
Theory, Concepts and Terminology
 GIS Workshop: Theory, Concepts and Terminology 1 Theory, Concepts and Terminology Suggestion: Have Maptitude with a map open on computer so that we can refer to it for specific menu and interface items.
Spatial Analysis of Raster Data
 Spatial Analysis of Raster Data 0 0 1 1 0 0 1 1 1 0 1 1 1 1 1 1 2 4 4 4 2 4 5 5 4 2 4 4 4 2 5 5 4 4 2 4 5 4 3 5 4 4 4 2 5 5 5 3 + = 0 = shale 1 = limestone 2 = fault 4 = no fault 2 =Fault in shale 3 =
GIS Semester Project Working With Water Well Data in Irion County, Texas
 GIS Semester Project Working With Water Well Data in Irion County, Texas Grant Hawkins Question for the Project Upon picking a random point in Irion county, Texas, to what depth would I have to drill a
Exercise 4. Watershed and Stream Network Delineation
 Exercise 4. Watershed and Stream Network Delineation GIS in Water Resources, Fall 2018 Prepared by David G Tarboton and David R. Maidment Revised 9 October, 2018 Purpose The purpose of this exercise is
Delineation of Watersheds
 Delineation of Watersheds Adirondack Park, New York by Introduction Problem Watershed boundaries are increasingly being used in land and water management, separating the direction of water flow such that
Geographical Information Systems
 Geographical Information Systems Geographical Information Systems (GIS) is a relatively new technology that is now prominent in the ecological sciences. This tool allows users to map geographic features
Digital Elevation Models (DEM)
") Digital Elevation Models (DEM) Digital representation of the terrain surface enable 2.5 / 3D views Rule #1: they are models, not reality Rule #2: they always include some errors (subject to scale and data
Digital Elevation Models (DEM) Digital representation of the terrain surface enable 2.5 / 3D views Rule #1: they are models, not reality Rule #2: they always include some errors (subject to scale and data
Lab 1: Importing Data, Rectification, Datums, Projections, and Output (Mapping)
") Lab 1: Importing Data, Rectification, Datums, Projections, and Output (Mapping) Topics covered in this lab: i. Importing spatial data to TAS ii. Rectification iii. Conversion from latitude/longitude to
Lab 1: Importing Data, Rectification, Datums, Projections, and Output (Mapping) Topics covered in this lab: i. Importing spatial data to TAS ii. Rectification iii. Conversion from latitude/longitude to
Lecture 1 Introduction to GIS. Dr. Zhang Spring, 2017
 Lecture 1 Introduction to GIS Dr. Zhang Spring, 2017 Topics of the course Using and making maps Navigating GIS Map design Working with spatial data Geoprocessing Spatial data infrastructure Digitizing
ArcGIS Data Models: Raster Data Models. Jason Willison, Simon Woo, Qian Liu (Team Raster, ESRI Software Products)
") ArcGIS Data Models: Raster Data Models Jason Willison, Simon Woo, Qian Liu (Team Raster, ESRI Software Products) Overview of Session Raster Data Model Context Example Raster Data Models Important Raster
ArcGIS Data Models: Raster Data Models Jason Willison, Simon Woo, Qian Liu (Team Raster, ESRI Software Products) Overview of Session Raster Data Model Context Example Raster Data Models Important Raster
GIS in Water Resources Fall 2018 Homework #1
 GIS in Water Resources Fall 2018 Homework #1 Goal The goal of this homework is to reinforce the lecture material on Geodesy, Map Projections and Coordinate Systems by having you identify attributes and
Steve Pietersen Office Telephone No
 Steve Pietersen Steve.Pieterson@durban.gov.za Office Telephone No. 031 311 8655 Overview Why geography matters The power of GIS EWS GIS water stats EWS GIS sanitation stats How to build a GIS system EWS
Working with Map Projections
 Working with Map Projections Rachel Applebaum and Margaret M. Maher Author of Lining Up Data in ArcGIS: a guide to map projections Second edition Some common problems that prevent data from aligning correctly
Geodatabase An Overview
 Federal GIS Conference February 9 10, 2015 Washington, DC Geodatabase An Overview Ralph Denkenberger - esri Session Path The Geodatabase - What is it? - Why use it? - What types are there? Inside the Geodatabase