Introduction to Spatial Data Resources and Analysis for research in Urban Design and Planning
|
|
|
- Arnold Arnold
- 5 years ago
- Views:
Transcription
1 Introduction to Spatial Data Resources and Analysis for research in Urban Design and Planning 2-day workshop notes September 2004 Introductions please put on a name tag to help me know who you are Background and Objectives: 1. What is your experience with computers? 2. What is your experience with GIS? 3. What are you expectations for this workshop? 4. What do you hope to be able to do by tomorrow afternoon? Workshop Outline Monday (8-4 with 1 hr break for lunch) 8-9: Lecture introduction to GIS 9-11: Introduction to ArcGIS 9.0 GIS software and Exploring ArcCatalog and ArcMap example 11-12: Representing the geometry of spatial phenomena (lecture) 12-1: Lunch break, questions 1-3: ArcTutorial example: basics of geoprocessing 3-4: Questions and ideas for day 2 Tuesday: (9-3:30 with 1 hr break for lunch) 9-10: Web resources, Downloading and understanding data 10-11: Vector Analysis types of analyses 11-12: Hands-on example : Lunch Break 1-3: Hands-on example 2 or 3 or user suggestion
2 I. Introduction to Geographic Information Systems and spatial analysis (8-9 am) A. What is spatial analysis? Definitions Process for looking at spatial patterns in your data and relationships between features. The actual methods used can be simple (making a map) or complex, involving multiple processing steps and combining may data layers to mimic the real world. What is GIS? Three parts: 1. Database attribute data 2. Map or spatial information 3. A way to link 1 and 2 A GIS is a toolbox a set of tools for analyzing spatial data GIS is a powerful set of tools for storing and retrieving at will, transforming and displaying spatial data from the real world for a particular set of purposes (Burrough 1986, p. 6) toolbox definition GIS are automated systems for the capture, storage, retrieval, analysis, and display of spatial data (Clarke 1995, p. 13) process definition GIS is a special case of information systems where the database consists of observations on spatially distributed features, activities or events, which are definable in space as points, lines, or areas. A geographic information system manipulates data about these points, lines, and areas to retrieve data for ad hoc queries and analyses (Dueker 1979, p 106) information system definition Examples of spatial analysis relevant to Urban Ecology and Planning
3 1. Determining the frequency of patches of remnant forest at various distances from downtown Seattle 2. Determining the change in human density at different distances from major town centers 3. Calculating the amount of water that flows through a drainage basin 4. Identifying parcels that are within a specified distance from parks 5. Calculating the total length of streams in a watershed 6. Others? Several examples of analyses that are not necessarily spatial 1. Calculating the number of parcels with more than 200 people in them 2. Calculating the density of people in census blocks (provided you know the area of each census block) 3. Others? What is "Image Processing" or "Remote Sensing" and how is it different from GIS? B. Introduction to ArcGIS 9.0 software to do GIS ArcGIS 9: (Getting Started with ArcGIS workbook: Chapter 1) 1. ArcMap - mapping, basic spatial analysis commands, similar to ArcView 2. ArcCatalog - similar to Windows Explorer, but the difference is IMPORTANT 3. ArcToolBox - access to vector commands, topology tools, database tools 4. ArcInfo / command line - access to ALL the commands for analysis Example differences in viewing directories and files with Windows Explorer and with ArcCatalog
 drive under the workspace directory 2.")

4 DEMO: Exploring ArcCatalog and ArcMap Note: For the following demo, you will need to first do the following steps: 1. Copy the tutorial data to your local drive for use today copy the entire udp-gis-intro directory to your local (c: or d: ) drive under the workspace directory 2. Demo: Running through parts of Chapter 2 in Getting Started with ArcGIS workbook: pages in workbook (pg 23 in the pdf file) open the pdf file and substitute the root directory that you just copied when told to access data in the workbook. 3. After doing the demo, Compare for yourself the difference in views that Windows Explorer and ArcCatalog give of the Tongass Directory (under D:\udp-gis-intro\ArcTutor\Toolbox\Data\Tongass\) II. Representing the geometry of spatial phenomena (10-11 lecture) A. Abstracting real-world entities: representing the geometry of spatial phenomena
5 Coordinate systems and Projections (Notes and Images taken from "Understanding Map Projections" by ESRI) Geographic coordinate system - uses a 3-D spherical surface to define locations on the earth. Each point on the earth has a longitude and latitude which are angles measured from the earth's center to the point on the earth's surface. Sphere and Spheroids - the shape and size of a geographic coordinate system's surface is defined by the sphere or spheroid used to represent it. In general, the data we will be using will use speroids (ellipseoids) to represent the shape of the earth. Datums - the datum defines the position of the spheroid relative to the center of the earth, providing a frame of reference for measuring locations on the surface of the earth. Data present you will download will likely be in WGS 1984, NAD 1927, or NAD 1983 Datums. The NAD (North American Datum) datums are usually preferred for spatial data of North America. While the generally preferred datum is NAD 1983 (with the GRS 1980 spheroid) because of its accuracy, many datasets will be in NAD 1927 and require reprojection into NAD Some data may be in State Plane Coordinate System (SPCS) which divides each state in a series of numbered sections.

6 Raw GPS data is reported in the WGS 1984 coordinate system, but because of the similarity of WGS 1984 and NAD 1983, the data are directly comparable. Projected Coordinate Systems - are defined on a flat, 2-D surface, and therefore has constant lengths, angles, and areas across the two dimensions. A projected coordinate system is always based on a geographic coordinate system that is based on a sphere or spheroid. Locations are identified by x,y coordinate pairs on a grid. To translate a 3-D surface to a 2-D plane, you must transform the 3-D surface (= map projection). Representing the earth's surface in 2-D causes distortions of shape, area, distance, or direction of the data. Different projections cause different types of distortions. Conformal Projections - maintain local shape Equal area projections - maintain area of local features Equidistant projections - preserve distances between certain points True-direction projections (azimuthal) - direction/asmuths are correct
7 Creating a projection starts by creating a point of contact with the 3-D object called a point or line of tangency. Projections can be Conic, Cylindrical, or Planar The most commonly used map projection for our purposes is the Universal Transverse Mercator (UTM). It is a conformal projection (shapes accurate) that does not maintain true directions, based on a cylindar tangent to a meridian where the globe has been divided into 60 zones, each spanning 6 degrees of longitude. Specific properties - accurate representation of small shapes, minimal distortion of large shapes at edges of zones, minimal distortion of area within zone, local angles are true, minor distortion of lateral distance. Things to remember: a. All data layers used MUST BE in the same map projection and coordinate system so that features in each layer will be comparable spatially to do any spatial analysis that involves more than one layer. b. Programs we will be using may allow DISPLAY of data in different projections/coordinate systems, but on-the-fly reprojection for analysis is NOT recommended. c. Data from several sources need to be checked to be sure they are all in a common projection and coordinate system and reprojected to a common system before analysis proceeds. Examples: opening files, determining metadata, projection, etc.
 Raster or Grid The raster model represents features as a matrix of cells in continuous space Each cell (or pixel) is")

8 B. Ways of representing spatial data: Raster and Vector (Also refer to Chapter 3 in Getting Started with ArcGIS) (11:00 noon) Raster or Grid The raster model represents features as a matrix of cells in continuous space Each cell (or pixel) is a square that represents a specific portion of an area All cells in a raster must be the same size Cells are arranged in rows and columns, producing an x,y Cartesian plane, with each cell having a unique x,y value All locations are covered by the matrix

 Both integer and floating-point values are supported -")


9 Each layer represents one attribute - attributes are tied to each cell rather than to an area Cells with the same value belong to the same zone which do not have to be spatially contiguous (as with most vector features) Both integer and floating-point values are supported - continuous data can be represented as either types; categorical data as integer only Rasters can represent continuous values such as Elevation Rasters can also represent discrete values such as buildings, parking lots, and roads, or soil types. Categorical rasters can also store additional attribute data

10 Most analysis occurs by combining the layers to create new layers with new cell values The cell size used for analysis with affect the results of the analysis Potential Uses: Inherent Limitations: Types of raster data 1. satellite imagery 2. scanned aerial photographs 3. digital orthophotos 4. grids - ArcGIS raster files
 and polygons (areas) Points represent single locations and are Lines")

 a vector data storage format for storing the location, shape, and attributes of geographic features, stored in a set of related files and")
11 Vector (Vector data are stored in Coverages, Geodatabases, and Shapefiles in ArcGIS) Types of Vector data (data models): The vector model represents features as x,y locations points These locations are connected together to make arcs (lines) and polygons (areas) Points represent single locations and are Lines (arcs) represent a series of coordinate pairs Areas are represented as closed polygons Coverage the traditional (ArcInfo, ArcGIS) format for complex geoprocessing, building high-quality geographic datasets, and sophisticated spatial analysis. Primary features are label points, arcs, and polygons. Composite features (Routes - complex lines and Regions - overlapping polygons) are built from primary feature types. Shapefile (ArcView) a vector data storage format for storing the location, shape, and attributes of geographic features, stored in a set of related files and contains one feature class, topology is not inherently stored.

12 Geodatabases a geographic data model that represents real-world geographic features as objects in an object-relational database, features are stored as rows in a table, geometry is stored in a shape field. Objects may have custom behavior. Potential Uses of Vector Data 1. Representing linear objects - roads, streams, fault lines 2. Representing area - lakes, cities, census blocks 3. Representing overlapping areas - the overlapping habitat within the home range of multiple crows ("Regions") 4. Networks - transportation networks ("Routes")
13 Advantages 1. can more accurately represent some spatial objects (e.g., stream lines, roads) Inherent Limitations 1. slower processing than raster database 2. difficult to represent "soft" or gradual edges Topology - The branch of geometry that deals with the properties of a figure that remain unchanged even when the figure is bent, stretched, or otherwise distorted. - Defines the spatial relationship between geographic features - Topological relationships: Adjacency - implies whether two polygon features are adjacent to one another Containment - indicates whether a single feature is contained within the boundaries of a polygon Connectivity - indicates whether two line segments are connected GISs are used for spatial analysis because they can integrate all three elements of spatial information in a logically consistent manner Tabular: Tabular manipulation of attribute data Working with data tables is an important part of GIS analysis. RDBMS: relational database management system a type of database in which the data is organized across several tables. Tables are associated with each other through common fields. Data items can be recombined from different files. 1. These tables can contain the attribute data of the features, or derived summary statistics.
14 2. Tabular data can be generated within a GIS and then exported and opened in a spreadsheet (Excel) or statistics software package (SPSS) for further non-spatial analyses Data types Types of features 1. Discrete a. For discrete locations and lines, the actual location can be pinpointed b. At any given spot the feature is present or it is not present c. Streams, tree locations, bear dens 2. Continuous a. Continuous phenomena can be found or measured anywhere, there are no gaps b. A value can be determined at any given location c. Precipitation, temperature, elevation, slope, water depth 3. Features summarized by area a. Summarized data represents counts or density of individual features within area boundaries b. Density of trees in a stand, population size within a region, number of businesses within a Zip Code a. The density measure applies to the entire summarized area, even if the individual (trees, people) are clustered in certain subsections of the area c. GIS allows you find the spatial coincidence of areas with features to perform summaries b. Unless these are standardized to a density per unit area, features summarized by area cannot be directly compared to other features summarized by a different area (e.g., it does not make sense to compare the density of people in Seattle with the average income of people in all of King County to make a statement about the relationsh ip between density and income for all of King county) Representation of geographic features 1. Discrete features (e.g., points and lines) and data summarized by area are usually represented by
15 vectors, but can be converted to raster when combined with other raster layers. 2. Continuous categories (categorical) are represented by either vectors (e.g., Isopleth maps) or rasters. 3. Continuous numeric values (e.g., elevation) are represented by rasters. Hands-on Example: Chapters 5 and 6 (Assembling the database and Preparing data for analysis) from Getting Started with ArcGIS (1-3). Review of Objectives and ideas for Tuesday s session
16 Tuesday, September 28th 9 am 4 pm I. Planning a project and Data Available on the Web (9:00-10:00) Planning a Spatial Analysis When performing an analysis you go through 5 major steps: ii. 1. Framing the question 1. How will the results be used 2. Who will use the results 3. Understanding your data 4. What type of data, features, and attributes are available iii. 2. What will need to be generated iv. 3. Choosing a method(s) 1. Many different methods exist 2. Some methods are more approximate than others v. 4. Processing the data 1. Many steps required for most analyses 2. A flow chart of the steps required and the expected results from each step is helpful in organizing an analysis vi. 5. Examining the results 1. Results can be displayed as a map, a table, or a chart. 2. Looking at the results is important to determine if the information is valid or useful 3. Often the analysis will need to be rerun with slightly different methods to achieve the desired results Web sites Sites containing spatial data - The GIS Guide to Good Practice - advice on conducting GIS analysis
17 WAGDA - Washington State Geospatial Data Archive Washington State Geospatial Clearinghouse King County GIS Center County Natural Resource Maps</a></p> <p><a href=" County Assessors Office</a></p> <p><a href=" Department of Ecology GIS data</a></p> <p><a href=" Urban Nature Project</a></p> <p><a href=" NatureMapping</a></p> <p><a href=" Department of Natural Resources</a></p> How to connect to the data Examples: Understanding data when it comes to you Metadata: information about the content, quality, condition, and other characteristics of data. Metadata consists of properties and documentation properties are derived from the data while documentation is entered by a person (keywords, description of attributes). Subject matter: how, when, where, and by whom the data was collected Type Projection Scale Accuracy Appropriateness Availability Reliability What it looks like with Microsoft Explorer and why NOT to use Explorer to move GIS data around
18 How the data are organized II. Methods and Examples of spatial analysis - Part 1 (10:00-11:00) Vector Analysis Three major types of analysis: 1. Drawing - visual analysis, mapping where things are 2. Selecting - selects features and attributes, but generally does not create a new spatial dataset 3. Overlaying - generates new spatial datasets by combining two or more input datasets Notes from "The ESRI Guide to GIS Anlaysis, Volume 1" Two major objectives: 1. Finding what's inside 2. Finding what's nearby Finding what s inside selecting, summarizing, calculating Do you need a list, count, or summary? Find out whether an individual feature is inside an area Get a list of all the features inside an area Find out the number of features inside an area Get a summary of what s inside an area, or each of several areas, based on a feature attribute Do you need to see the features that are completely or partially inside the area?
19 o Choose to include only features that fall completely inside o Features that fall inside but extend beyond the boundary o Include only the portion of the features that falls inside the area boundary Three ways of finding what s inside 1. Drawing the areas and features create a map showing the boundary of the area and the features for viewing What it s good for: seeing whether one of a few features are inside or outside an area and for checking the output of analysis What you need: two datasets: boundary and features 2. Selecting features inside the area specify the area and the layer containing the features, and the GIS selects a subset of the features inside the area What it s good for: getting a list or summary of features inside a single area, or a group of areas you re treating as one, finding what s within a give distance of a feature What you need: dataset containing the areas and a dataset with the features, including any attributes you want to summarize 3. Overlaying the areas and features GIS combines the area and the features to create a new layer with the attributes of both, or compares the two layers to calculate summary statistics for each on the fly What it s good for: finding which features are in each of several areas, or finding out how much of something is in one or more areas What you need: data containing the areas and a dataset with the features, including any attributes you want to summarize Choosing a method 1. Use a map if you have a single area and only need to see which features are inside 2. Select features inside the areas if you have a single area and need a list or summary of discrete features fully or partially inside
20 3. Overlay the areas and features if: a. Multiple areas and need a summary of what s inside each b. Single area and need a list or summary of discrete features, including only the portion of the features inside the area c. Single area and need a summary of continuous values Drawing areas and features 1. Making the map drawing only, no analysis Locations and lines Draw individual locations or linear features with a single symbol, or symbolize them by category or quantity Draw the boundary of the area on top in a thinker line With several areas, label them so that map readers can identify each one Discrete areas Shade the outer area with a light color and draw the boundaries of the area features on top emphasizes which features are inside Fill the outer area with a translucent color or pattern on top of the discrete area boundaries this emphasizes the outer area Draw the outer area boundary with a thick line, and the discrete area boundaries with a thin line in a lighter shade or different color use if you re shading the discrete areas by category or class range Continuous features Mapping continuous areas (soils, elevation), draw the areas symbolized by category or quantity (class range), then draw the boundary of the area(s) on top Mapping a single area, you can draw the boundary with a think line, or shade the area with a translucent color or pattern to highlight it o drawing only the boundary emphasizes what s inside o shading emphasizes the area itself 2. Selecting features inside an area selecting only, no creation of new coverages or grids 1. you specify the features and the area


21 2. GIS checks the location of each feature to see if it s inside the area, and flags the ones that are 3. GIS then highlights the selected features on the map and selects the corresponding rows in the feature set s data table


, the layer containing your features, and the distance and the GIS")
22 4. You can then use the data table to get information about the features, such as a list, a count, or a summary of an associated attribute This method does not differentiate which area each feature is in, only that it s in one of them Geographic selection is a quick way to find out which features are within a given distance of another feature specify to location of your source (e.g., an eagle nest), the layer containing your features, and the distance and the GIS selects the features within that distance
, inside the")
23 Data that is already summarized by area can only be summarized using boundaries that fully enclose the area number of eagles by protected area could not then be summarized by township, since many protected areas span town lines Using the results Create a report Count the total number of features inside the area Frequency number of features with a given value (or range of values), inside the area, displayed as a table, bar chart, or pie chart (percentages) A summary of a numeric attribute sum, average, median, standard deviation A map is potentially useful as well
24
 when selecting line or area")
25 2. Finding what s near Selecting features within a distance is similar to creating a buffer you specify the distance from the source and the GIS selects the surrounding features within the distance only a selected set is generated, no new feature dataset is created the selected set can be used to extract those selected features to a new feature dataset (coverage) when selecting line or area features, the GIS selects all features that have any portion within the specified distance Selecting features near several sources requires multiple selections and assignment of unique values to the feature dataset s attribute table to keep track of Ex: selecting features in a conservation database that are within 100 km of Olympic National Park and also within Kitsap county Selecting features within several distance ranges requires separate selections and attribute assignments

26 Feature to feature if you are calculating the distance between each surrounding location and the nearest source, the distance for each location is automatically added to the data table for the surrounding locations, along with an identifier for the nearest source if you are calculating the distance between each location and several sources, you get a new table listing, for each location, an identifier for the source, and the distance to each optionally can specify a maximum distance to reduce potential processing time several options exist for mapping the output 1. map surrounding locations color-coded (color ramp) by distance 2. map surrounding locations color-coded (unique color) by source 3. map by creating a spider diagram which draws a line between each location and its nearest source 4. map source features using graduated point symbols Methods that create derived data (feature datasets/coverages, tabular output) 3. Overlaying areas and features creating new vector or raster datasets Find which discrete features are inside which areas and summarize them

27 Calculate the amount of each continuous category or class inside one or more areas Summarize continuous values inside one or more areas a. Overlaying areas with discrete features GIS tags each feature with a code for the area it falls within, and assigns the area s attribute to each feature = permanently modifies attribute table, creating a new dataset or a new attribute in an existing dataset Output can be a list of features or summary of an attribute value by area Because the attributes are permanently stored in the attribute table, the data is available for further analyses What the GIS does: GIS checks to see which area each feature is in and assigns the area s ID and attributes to the feature s record in the data table If a line or area feature falls within two or more areas, the GIS splits the feature where it crosses the area boundary and builds new areas in a new dataset


28 Each new feature has the attributes of the area it falls within, in addition to its original attributes

29 Using the results For a single area, the analysis is the same as with geographic selection For lines or areas you re now dealing with just the portion of each feature inside the area If you are overlaying several areas on a set of features, you can summarize the features by area Can summarize results by category or value Making a map b. Overlaying areas with continuous categories or classes GIS summarizes the amount of each category or class features falling inside one or more areas Output can be a map, table, or a chart of the results What the GIS does: 1. The vector method GIS splits category or class boundaries where they cross areas and creates a new dataset with the areas that result Each new area has the attributes of both input layers (already described above)


30 Then use the data table for the new layer to summarize the amount of each category in each area

 o Add a new field to the table for each category value, and then calculate the value")
31 If you ve done a vector overlay, you will need to summarize the category values for each area o Calculate a frequency which will give you a list of each combination and the amount of land represented by that combination o Then convert this output to a file that has one row for each area and a column for each category value Using a spreadsheet program Selecting all the rows having a specific category value, create a new table, and join it to the data table for the areas (for each category value) Once you have a summary table, you may also want to calculate the percentage of each category for each area, so you can map and compare the areas based on relative amounts (to account for differences in area) o Add a new field to the table for each category value, and then calculate the value for the field by dividing the area of each category by the total areal extent of the containing area o Pie charts and stacked bar charts calculate and display the percentage for you, but having the calculated percentages will let you map each area by its percentage for a particular category
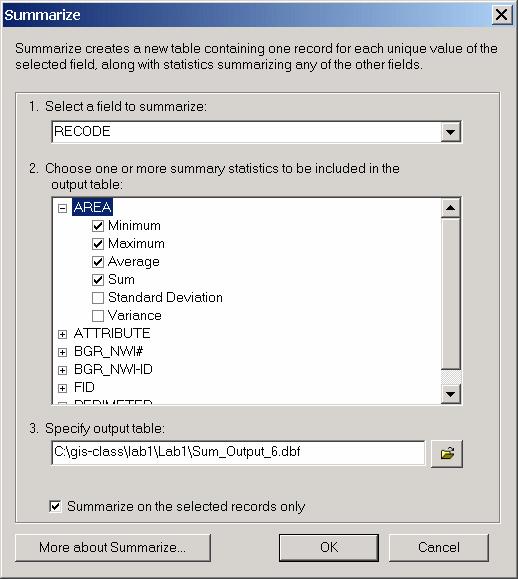
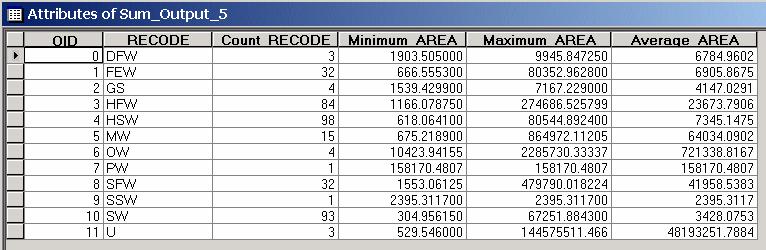
32 The information in the table can be displayed using charts or joined to the data table containing the areas to create maps Tabular Analysis Three common operations performed on features and values within tables are selecting, calculating, and summarizing. 1. Selecting a. Selected to work on a subset or assign a new attribute value to a subset b. For example, assigning a specific rank to several different categories c. Done by value or by spatial location d. Rows in the data layer s attribute table that pertain to your selected features are selected e. Value-based selection is usually done in the form of a logical expression: Select attribute = value f. Logical operators used: equals (=), greater than (>), less than (<), contains (cn), g. Several expressions can be strung together using AND (exclusive) or OR (inclusive): Select attribute = 2 or attribute = 3 2. Calculating a. Used to calculate attribute values to assign new values to features in the data table b. If the new values will be assigned to a new attribute, this new attribute must first be added to the table c. Values can be assigned directly or derived from other attributes (such as ratios) d. For example, a land cover classification with 25 forest type classes might need to be simplified into 4 classes 3. Summarizing a. Used to summarize values for specific attributes into summary statistics (e.g., mean, max)
33 b. Often we want a unique listing of an attribute and the number of times it occurs (plus additional statistics) this is a frequency Hands-on Example: Chapter 7 (Performing the Analysis) from Getting Started with ArcGIS (1-3). Hands-on Example 2: Chapter 8 (Presenting the Results) from Getting Started with ArcGIS (1-3). Advanced Hands-on Example 3: Chapter 2 (Quick-start tutorial) from Geoprocessing in ArcGIS (1-3).
Introducing GIS analysis
 1 Introducing GIS analysis GIS analysis lets you see patterns and relationships in your geographic data. The results of your analysis will give you insight into a place, help you focus your actions, or
Lecture 2. A Review: Geographic Information Systems & ArcGIS Basics
 Lecture 2 A Review: Geographic Information Systems & ArcGIS Basics GIS Overview Types of Maps Symbolization & Classification Map Elements GIS Data Models Coordinate Systems and Projections Scale Geodatabases
Overview key concepts and terms (based on the textbook Chang 2006 and the practical manual)
") Introduction Geo-information Science (GRS-10306) Overview key concepts and terms (based on the textbook 2006 and the practical manual) Introduction Chapter 1 Geographic information system (GIS) Geographically
Introduction Geo-information Science (GRS-10306) Overview key concepts and terms (based on the textbook 2006 and the practical manual) Introduction Chapter 1 Geographic information system (GIS) Geographically
NR402 GIS Applications in Natural Resources
 NR402 GIS Applications in Natural Resources Lesson 1 Introduction to GIS Eva Strand, University of Idaho Map of the Pacific Northwest from http://www.or.blm.gov/gis/ Welcome to NR402 GIS Applications in
2. GETTING STARTED WITH GIS
 2. GETTING STARTED WITH GIS What are geographic information systems and what are they used for? ArcGIS: ArcMap, ArcCatalog and ArcToolbox Vector data vs. raster data vs. attribute tables Polygons, polylines,
The Geodatabase Working with Spatial Analyst. Calculating Elevation and Slope Values for Forested Roads, Streams, and Stands.
 GIS LAB 7 The Geodatabase Working with Spatial Analyst. Calculating Elevation and Slope Values for Forested Roads, Streams, and Stands. This lab will ask you to work with the Spatial Analyst extension.
Outline. Chapter 1. A history of products. What is ArcGIS? What is GIS? Some GIS applications Introducing the ArcGIS products How does GIS work?
 Outline Chapter 1 Introducing ArcGIS What is GIS? Some GIS applications Introducing the ArcGIS products How does GIS work? Basic data formats The ArcCatalog interface 1-1 1-2 A history of products Arc/Info
GIS CONCEPTS ARCGIS METHODS AND. 3 rd Edition, July David M. Theobald, Ph.D. Warner College of Natural Resources Colorado State University
 GIS CONCEPTS AND ARCGIS METHODS 3 rd Edition, July 2007 David M. Theobald, Ph.D. Warner College of Natural Resources Colorado State University Copyright Copyright 2007 by David M. Theobald. All rights
Projections and Coordinate Systems
 Projections and Coordinate Systems Overview Projections Examples of different projections Coordinate systems Datums Projections Overview Projections and Coordinate Systems GIS must accurately represent
Tutorial 8 Raster Data Analysis
 Objectives Tutorial 8 Raster Data Analysis This tutorial is designed to introduce you to a basic set of raster-based analyses including: 1. Displaying Digital Elevation Model (DEM) 2. Slope calculations
Display data in a map-like format so that geographic patterns and interrelationships are visible
 Vilmaliz Rodríguez Guzmán M.S. Student, Department of Geology University of Puerto Rico at Mayagüez Remote Sensing and Geographic Information Systems (GIS) Reference: James B. Campbell. Introduction to
Welcome to NR502 GIS Applications in Natural Resources. You can take this course for 1 or 2 credits. There is also an option for 3 credits.
 Welcome to NR502 GIS Applications in Natural Resources. You can take this course for 1 or 2 credits. There is also an option for 3 credits. The 1st credit consists of a series of readings, demonstration,
Introduction to GIS I
 Introduction to GIS Introduction How to answer geographical questions such as follows: What is the population of a particular city? What are the characteristics of the soils in a particular land parcel?
Introduction to Geographic Information Systems
 Introduction to Geographic Information Systems Lynn_Carlson@brown.edu 401-863-9917 The Environmental And Remote TecHnologies Lab MacMillan Hall, Room 105 http://www.brown.edu/research/earthlab/ Outline
Delineation of Watersheds
 Delineation of Watersheds Adirondack Park, New York by Introduction Problem Watershed boundaries are increasingly being used in land and water management, separating the direction of water flow such that
Introduction-Overview. Why use a GIS? What can a GIS do? Spatial (coordinate) data model Relational (tabular) data model
 data model Relational (tabular) data model") Introduction-Overview Why use a GIS? What can a GIS do? How does a GIS work? GIS definitions Spatial (coordinate) data model Relational (tabular) data model intro_gis.ppt 1 Why use a GIS? An extension
Introduction-Overview Why use a GIS? What can a GIS do? How does a GIS work? GIS definitions Spatial (coordinate) data model Relational (tabular) data model intro_gis.ppt 1 Why use a GIS? An extension
Lecture 2. Introduction to ESRI s ArcGIS Desktop and ArcMap
 Lecture 2 Introduction to ESRI s ArcGIS Desktop and ArcMap Outline ESRI What is ArcGIS? ArcGIS Desktop ArcMap Overview Views Layers Attribute Tables Help! Scale Tips and Tricks ESRI Environmental Systems
Lab #3 Map Projections.
 Lab #3 Map Projections http://visual.merriam-webster.com/images/earth/geography/cartography/map-projections.jpg Map Projections Projection: a systematic arrangement of parallels and meridians on a plane
Data Structures & Database Queries in GIS
 Data Structures & Database Queries in GIS Objective In this lab we will show you how to use ArcGIS for analysis of digital elevation models (DEM s), in relationship to Rocky Mountain bighorn sheep (Ovis
What are the five components of a GIS? A typically GIS consists of five elements: - Hardware, Software, Data, People and Procedures (Work Flows)
") LECTURE 1 - INTRODUCTION TO GIS Section I - GIS versus GPS What is a geographic information system (GIS)? GIS can be defined as a computerized application that combines an interactive map with a database
LECTURE 1 - INTRODUCTION TO GIS Section I - GIS versus GPS What is a geographic information system (GIS)? GIS can be defined as a computerized application that combines an interactive map with a database
GIS CONCEPTS ARCGIS METHODS AND. 2 nd Edition, July David M. Theobald, Ph.D. Natural Resource Ecology Laboratory Colorado State University
 GIS CONCEPTS AND ARCGIS METHODS 2 nd Edition, July 2005 David M. Theobald, Ph.D. Natural Resource Ecology Laboratory Colorado State University Copyright Copyright 2005 by David M. Theobald. All rights
GIS Software. Evolution of GIS Software
 GIS Software The geoprocessing engines of GIS Major functions Collect, store, mange, query, analyze and present Key terms Program collections of instructions to manipulate data Package integrated collection
Acknowledgments xiii Preface xv. GIS Tutorial 1 Introducing GIS and health applications 1. What is GIS? 2
 Acknowledgments xiii Preface xv GIS Tutorial 1 Introducing GIS and health applications 1 What is GIS? 2 Spatial data 2 Digital map infrastructure 4 Unique capabilities of GIS 5 Installing ArcView and the
Popular Mechanics, 1954
 Introduction to GIS Popular Mechanics, 1954 1986 $2,599 1 MB of RAM 2017, $750, 128 GB memory, 2 GB of RAM Computing power has increased exponentially over the past 30 years, Allowing the existence of
Geographic Information Systems. Introduction to Data and Data Sources
 Geographic Information Systems Introduction to Data and Data Sources Presented by John Showler, NJDA-SSCC NJ SCD GIS Training Session December 10, 209 The Objectives of this session are 3-fold: 1. Introduce
Task 1: Start ArcMap and add the county boundary data from your downloaded dataset to the data frame.
 Exercise 6 Coordinate Systems and Map Projections The following steps describe the general process that you will follow to complete the exercise. Specific steps will be provided later in the step-by-step
Version 1.1 GIS Syllabus
 GEOGRAPHIC INFORMATION SYSTEMS CERTIFICATION Version 1.1 GIS Syllabus Endorsed 1 Version 1 January 2007 GIS Certification Programme 1. Target The GIS certification is aimed at: Those who wish to demonstrate
EEOS 381 -Spatial Databases and GIS Applications
 EEOS 381 -Spatial Databases and GIS Applications Lecture 5 Geodatabases What is a Geodatabase? Geographic Database ESRI-coined term A standard RDBMS that stores and manages geographic data A modern object-relational
This week s topics. Week 6. FE 257. GIS and Forest Engineering Applications. Week 6
 FE 257. GIS and Forest Engineering Applications Week 6 Week 6 Last week Chapter 8 Combining and splitting landscape features and merging GIS databases Chapter 11 Overlay processes Questions? Next week
Applied Cartography and Introduction to GIS GEOG 2017 EL. Lecture-1 Chapters 1 and 2
 Applied Cartography and Introduction to GIS GEOG 2017 EL Lecture-1 Chapters 1 and 2 What is GIS? A Geographic Information System (GIS) is a computer system for capturing, storing, querying, analyzing and
Course overview. Grading and Evaluation. Final project. Where and When? Welcome to REM402 Applied Spatial Analysis in Natural Resources.
 Welcome to REM402 Applied Spatial Analysis in Natural Resources Eva Strand, University of Idaho Map of the Pacific Northwest from http://www.or.blm.gov/gis/ Where and When? Lectures Monday & Wednesday
In this exercise we will learn how to use the analysis tools in ArcGIS with vector and raster data to further examine potential building sites.
 GIS Level 2 In the Introduction to GIS workshop we filtered data and visually examined it to determine where to potentially build a new mixed use facility. In order to get a low interest loan, the building
Geographers Perspectives on the World
 What is Geography? Geography is not just about city and country names Geography is not just about population and growth Geography is not just about rivers and mountains Geography is a broad field that
Shape e o f f the e Earth
 1 Coordinate Systems & Projections Coordinate Systems Two map layers are not going to register spatially unless they are based on the same coordinate system. 2 Contents Shape of the earth Datum Projections
Applied Cartography and Introduction to GIS GEOG 2017 EL. Lecture-2 Chapters 3 and 4
 Applied Cartography and Introduction to GIS GEOG 2017 EL Lecture-2 Chapters 3 and 4 Vector Data Modeling To prepare spatial data for computer processing: Use x,y coordinates to represent spatial features
Dr. ABOLGHASEM AKBARI Faculty of Civil Engineering & Earth Resources, University Malaysia Pahang (UMP)
") Workshop on : Dr. ABOLGHASEM AKBARI Faculty of Civil Engineering & Earth Resources, University Malaysia Pahang (UMP) 14-15 April 2016 Venue: Tehran, Iran GIS definitions GIS: A simplified view of the real
Workshop on : Dr. ABOLGHASEM AKBARI Faculty of Civil Engineering & Earth Resources, University Malaysia Pahang (UMP) 14-15 April 2016 Venue: Tehran, Iran GIS definitions GIS: A simplified view of the real
Teaching GIS for Land Surveying
 Teaching GIS for Land Surveying Zhanjing (John) Yu Evergreen Valley College, San Jose, California James Crossfield California State University at Fresno, Fresno California 7/13/2006 1 Outline of the Presentation
Terms GIS GPS Vector Data Model Raster Data Model Feature Attribute Table Point Line Polygon Pixel RGB Overlay Function
 FINAL REVIEW FOR GIS (2016) PRACTICAL COMPONENT The first 40 mins of the exam will be open book and will require you to make a map using all the techniques learned over the semester. This map will be e-mailed
MERGING (MERGE / MOSAIC) GEOSPATIAL DATA
 GEOSPATIAL DATA") This help guide describes how to merge two or more feature classes (vector) or rasters into one single feature class or raster dataset. The Merge Tool The Merge Tool combines input features from input
This help guide describes how to merge two or more feature classes (vector) or rasters into one single feature class or raster dataset. The Merge Tool The Merge Tool combines input features from input
Welcome to Lesson 4. It is important for a GIS analyst to have a thorough understanding of map projections and coordinate systems.
 Welcome to Lesson 4. It is important for a GIS analyst to have a thorough understanding of map projections and coordinate systems. A GIS without coordinates would simply be a database like Microsoft Excel
ArcGIS Pro: Essential Workflows STUDENT EDITION
 ArcGIS Pro: Essential Workflows STUDENT EDITION Copyright 2018 Esri All rights reserved. Course version 6.0. Version release date August 2018. Printed in the United States of America. The information contained
Introduction to the 176A labs and ArcGIS
 Introduction to the 176A labs and ArcGIS Acknowledgement: Slides by David Maidment, U Texas-Austin and Francisco Olivera (TAMU) Purpose of the labs Hands-on experience with one software pakage Introduction
An ESRI Technical Paper June 2007 Understanding Coordinate Management in the Geodatabase
 An ESRI Technical Paper June 2007 Understanding Coordinate Management in the Geodatabase ESRI 380 New York St., Redlands, CA 92373-8100 USA TEL 909-793-2853 FAX 909-793-5953 E-MAIL info@esri.com WEB www.esri.com
GEOREFERENCING, PROJECTIONS Part I. PRESENTING DATA Part II
 Week 7 GEOREFERENCING, PROJECTIONS Part I PRESENTING DATA Part II topics of the week Georeferencing Coordinate systems Map Projections ArcMap and Projections Geo-referencing Geo-referencing is the process
Week 7 Last week: This week s topics. GIS and Forest Engineering Applications. FE 257. GIS and Forest Engineering Applications.
 FE 257. GIS and Forest Engineering Applications Week 7 Week 7 Last week: Spatial Projections Questions? Next week- read: Chapter 10: Updating GIS Databases Chapter 12: Synthesis of Techniques Applied to
REFERENCING COORDINATE SYSTEMS MAP PROJECTIONS GEOREFERENCING
 GIS in Ecology SPATIAL REFERENCING COORDINATE SYSTEMS MAP PROJECTIONS GEOREFERENCING : :1 Where on earth? Early mapmakers recognized the need for a system that could locate features on the earth's surface.
Fundamentals of ArcGIS Desktop Pathway
 Fundamentals of ArcGIS Desktop Pathway Table of Contents ArcGIS Desktop I: Getting Started with GIS 3 ArcGIS Desktop II: Tools and Functionality 5 Understanding Geographic Data 8 Understanding Map Projections
GIS Lecture 5: Spatial Data
 GIS Lecture 5: Spatial Data GIS 1 Outline Vector Data Formats Raster Data Formats Map Projections Coordinate Systems US Census geographic files US Census data files GIS Data Sources GIS 2 Vector Data Formats
Today: GEOL 452/552 - GIS for Geoscientists I. Lecture 3 - Chapter 1. GIS vector Data (review) Let s annotate this layer (draw on paper)
 Let s annotate this layer (draw on paper)") Today: GEOL 452/552 - GIS for Geoscientists I Lecture 3 - Chapter 1 GIS vector data - review raster data history: ArcView/ArcINFO - ArcGIS types of GIS data files Lab: finish Ch. 1 tutorial and HW1 Please
Today: GEOL 452/552 - GIS for Geoscientists I Lecture 3 - Chapter 1 GIS vector data - review raster data history: ArcView/ArcINFO - ArcGIS types of GIS data files Lab: finish Ch. 1 tutorial and HW1 Please
GEOL 452/552 - GIS for Geoscientists I. Lecture 15
 GEOL 452/552 - GIS for Geoscientists I Lecture 15 Lecture Plan Midterm Multiple choice part graded (+ solutions) Jump to Ch. 11 for one lecture Coordinate systems Projections, datums, spheroids Unprojected
Exercise 3: GIS data on the World Wide Web
 Exercise 3: GIS data on the World Wide Web These web sites are a few examples of sites that are serving free GIS data. Many other sites exist. Search in Google or other search engine to find GIS data for
Geography 38/42:376 GIS II. Topic 1: Spatial Data Representation and an Introduction to Geodatabases. The Nature of Geographic Data
 Geography 38/42:376 GIS II Topic 1: Spatial Data Representation and an Introduction to Geodatabases Chapters 3 & 4: Chang (Chapter 4: DeMers) The Nature of Geographic Data Features or phenomena occur as
INTRODUCTION TO GEOGRAPHIC INFORMATION SYSTEM By Reshma H. Patil
 INTRODUCTION TO GEOGRAPHIC INFORMATION SYSTEM By Reshma H. Patil ABSTRACT:- The geographical information system (GIS) is Computer system for capturing, storing, querying analyzing, and displaying geospatial
Georeferencing. Place names Postal addresses Postal codes Coordinate systems (lat/long, UTM, etc.)
") Georeferencing Georeferencing Used to describe the act of assigning locations to data or information Certain requirements include that they are: unique, have shared meaning, and are persistent through
Georeferencing Georeferencing Used to describe the act of assigning locations to data or information Certain requirements include that they are: unique, have shared meaning, and are persistent through
Spatial Analysis using Vector GIS THE GOAL: PREPARATION:
 PLAN 512 GIS FOR PLANNERS Department of Urban and Environmental Planning University of Virginia Fall 2006 Prof. David L. Phillips Spatial Analysis using Vector GIS THE GOAL: This tutorial explores some
SCHOOL OF ENGINEERING AND TECHNOLOGY COMPUTER LAB
 PHASE 1_6 TH SESSION ARCGIS TRAINING AT KU GIS LABS: INTRODUCTION TO GIS: EXPLORING ARCCATALOG AND ARCGIS TOOLS 6 TH SESSION REPORT: 3 RD -5 TH SEPTEMBER 2014 SCHOOL OF ENGINEERING AND TECHNOLOGY COMPUTER
Charlene Nielsen, MSc.
 GIS Project Issues Charlene Nielsen, MSc charlene.nielsen@ualberta.ca 492-93979397 B414 BioSci Building www.biology.ualberta.ca/facilities/gis Introduction to GIS in Ecology What a GIS is not What is a
GIS Boot Camp for Education June th, 2011 Day 1. Instructor: Sabah Jabbouri Phone: (253) x 4854 Office: TC 136
 x 4854 Office: TC 136") GIS Boot Camp for Education June 27-30 th, 2011 Day 1 Instructor: Sabah Jabbouri Phone: (253) 833-9111 x 4854 Office: TC 136 Email: sjabbouri@greenriver.edu http://www.instruction.greenriver.edu/gis/ Summer
GIS Boot Camp for Education June 27-30 th, 2011 Day 1 Instructor: Sabah Jabbouri Phone: (253) 833-9111 x 4854 Office: TC 136 Email: sjabbouri@greenriver.edu http://www.instruction.greenriver.edu/gis/ Summer
Hydrology and Floodplain Analysis, Chapter 10
 Hydrology and Floodplain Analysis, Chapter 10 Hydrology and Floodplain Analysis, Chapter 10.1 Introduction to GIS GIS Geographical Information System Spatial Data Data linked with geographical location
Different Displays of Thematic Maps:
 Different Displays of Thematic Maps: There are a number of different ways to display or classify thematic maps, including: Natural Breaks Equal Interval Quantile Standard Deviation What s important to
How does an ellipsoid differ from a sphere in approximating the shape and size of the Earth?
 Chapter 02 Test Bank Worksheet Questions 1. What is a map projection? Topic: Map Projection 2. How does an ellipsoid differ from a sphere in approximating the shape and size of the Earth? Topic: Ellipsoid
Louisiana Transportation Engineering Conference. Monday, February 12, 2007
 Louisiana Transportation Engineering Conference Monday, February 12, 2007 Agenda Project Background Goal of EIS Why Use GIS? What is GIS? How used on this Project Other site selection tools I-69 Corridor
Illustrator: Vector base Each line/point store some sort of information Mapping Representation of the world
 Illustrator: Vector base Each line/point store some sort of information Mapping Representation of the world Photoshop Raster base Images can be overlaid Pixel vector data model: [data models] A representation
DATA SOURCES AND INPUT IN GIS. By Prof. A. Balasubramanian Centre for Advanced Studies in Earth Science, University of Mysore, Mysore
 DATA SOURCES AND INPUT IN GIS By Prof. A. Balasubramanian Centre for Advanced Studies in Earth Science, University of Mysore, Mysore 1 1. GIS stands for 'Geographic Information System'. It is a computer-based
Introduction to Geographic Information Systems (GIS): Environmental Science Focus
: Environmental Science Focus") Introduction to Geographic Information Systems (GIS): Environmental Science Focus September 9, 2013 We will begin at 9:10 AM. Login info: Username:!cnrguest Password: gocal_bears Instructor: Domain: CAMPUS
Introduction to Geographic Information Systems (GIS): Environmental Science Focus September 9, 2013 We will begin at 9:10 AM. Login info: Username:!cnrguest Password: gocal_bears Instructor: Domain: CAMPUS
ch02.pdf chap2.pdf chap02.pdf
 Introduction to Geographic Information Systems 8th Edition Karl Solutions Manual Full Download: http://testbanklive.com/download/introduction-to-geographic-information-systems-8th-edition-karl-solutions-manu
Data Creation and Editing
 11.520:A Workshop on Geographical Information Systems 1.188: Urban Planning and Social Science Laboratory Data Creation and Editing Based in part on notes by Prof. Joseph Ferreira and Michael Flaxman Lulu
An Introduction to Geographic Information System
 An Introduction to Geographic Information System PROF. Dr. Yuji MURAYAMA Khun Kyaw Aung Hein 1 July 21,2010 GIS: A Formal Definition A system for capturing, storing, checking, Integrating, manipulating,
GEOGRAPHIC INFORMATION SYSTEMS (GIS)
") AN INTRODUCTION TO GEOGRAPHIC INFORMATION SYSTEMS (GIS) Joana Magos Brehm 1, Ali Shehadeh 2 1 Botanical Garden, National Museum of Natural History, University of Lisbon (Portugal) 2 Genetic Resources Unit,
AN INTRODUCTION TO GEOGRAPHIC INFORMATION SYSTEMS (GIS) Joana Magos Brehm 1, Ali Shehadeh 2 1 Botanical Garden, National Museum of Natural History, University of Lisbon (Portugal) 2 Genetic Resources Unit,
UNIT 4: USING ArcGIS. Instructor: Emmanuel K. Appiah-Adjei (PhD) Department of Geological Engineering KNUST, Kumasi
 Department of Geological Engineering KNUST, Kumasi") UNIT 4: USING ArcGIS Instructor: Emmanuel K. Appiah-Adjei (PhD) Department of Geological Engineering KNUST, Kumasi Getting to Know ArcGIS ArcGIS is an integrated collection of GIS software products ArcGIS
UNIT 4: USING ArcGIS Instructor: Emmanuel K. Appiah-Adjei (PhD) Department of Geological Engineering KNUST, Kumasi Getting to Know ArcGIS ArcGIS is an integrated collection of GIS software products ArcGIS
Overlay Analysis II: Using Zonal and Extract Tools to Transfer Raster Values in ArcMap
 Overlay Analysis II: Using Zonal and Extract Tools to Transfer Raster Values in ArcMap Created by Patrick Florance and Jonathan Gale, Edited by Catherine Ressijac on March 26, 2018 If you have raster data
Introduction to the 176A labs and ArcGIS Purpose of the labs
 Introduction to the 176A labs and ArcGIS Purpose of the labs Acknowledgement: Slides by David Maidment, U Texas-Austin and Francisco Olivera (TAMU) Hands-on experience with a leading software package Introduction
Geodatabase An Introduction
 2013 Esri International User Conference July 8 12, 2013 San Diego, California Technical Workshop Geodatabase An Introduction David Crawford and Jonathan Murphy Session Path The Geodatabase What is it?
Geographical Information Systems
 Geographical Information Systems Geographical Information Systems (GIS) is a relatively new technology that is now prominent in the ecological sciences. This tool allows users to map geographic features
EnvSci360 Computer and Analytical Cartography
 EnvSci360 Computer and Analytical Cartography Lecture 3 Geodesy Map Projections, Datums, and Coordinate Systems 1 Geodesy The science of measuring and representing the shape and size of the earth, and
Geodatabase Management Pathway
 Geodatabase Management Pathway Table of Contents ArcGIS Desktop II: Tools and Functionality 3 ArcGIS Desktop III: GIS Workflows and Analysis 6 Building Geodatabases 8 Data Management in the Multiuser Geodatabase
4. GIS Implementation of the TxDOT Hydrology Extensions
 4. GIS Implementation of the TxDOT Hydrology Extensions A Geographic Information System (GIS) is a computer-assisted system for the capture, storage, retrieval, analysis and display of spatial data. It
Watershed Delineation
 Watershed Delineation Jessica L. Watkins, University of Georgia 2 April 2009 Updated by KC Love February 25, 2011 PURPOSE For this project, I delineated watersheds for the Coweeta synoptic sampling area
Environmental Systems Research Institute
 Introduction to ArcGIS ESRI Environmental Systems Research Institute Redlands, California 2 ESRI GIS Development Arc/Info (coverage model) Versions 1-7 from 1980 1999 Arc Macro Language (AML) ArcView (shapefile
ArcMap - EXPLORING THE DATABASE Part I. SPATIAL DATA FORMATS Part II
 Week 5 ArcMap - EXPLORING THE DATABASE Part I SPATIAL DATA FORMATS Part II topics of the week Exploring the Database More on the Table of Contents Exploration tools Identify, Find, Measure, Map tips, Hyperlink,
Introduction to GIS. Phil Guertin School of Natural Resources and the Environment GeoSpatial Technologies
 Introduction to GIS Phil Guertin School of Natural Resources and the Environment dguertin@cals.arizona.edu Mapping GeoSpatial Technologies Traditional Survey Global Positioning Systems (GPS) Remote Sensing
Understanding Projections for GIS
 Presented by John Schaeffer Juniper GIS Services, Inc. This PowerPoint is available at JuniperGIS.com Presentation Objectives To understand basic concepts on projections and coordinate systems for the
Lecture 4. Coordinate Systems & Projections
 Lecture 4 Coordinate Systems & Projections Outline Geodesy Geoids Ellipsoids Geographic Coordinate Systems Magnetic North vs. True North Datums Projections Applying Coordinate Systems and Projections Why
Intro to GIS Fall 2010 Georeferencing & Map Projections
 Intro to GIS Fall 2010 Georeferencing & Map Projections SHAPE OF THE EARTH Earth's Shape Geoid: shape of earth minus topographic features (irregular due to local variations in gravity) Ellipsoid: elongated
GEOGRAPHIC INFORMATION SYSTEMS
 GEOGRAPHIC INFORMATION SYSTEMS 4-H Round-Up Community Transitions Workshop Daniel Hanselka June 14, 2011 Goals of the Workshop Answer the question: What is GIS? Uses of GIS. Some of the Common Terminology
GIS in Water Resources Midterm Exam Fall 2008 There are 4 questions on this exam. Please do all 4.
 Page 1 of 8 Name: GIS in Water Resources Midterm Exam Fall 2008 There are 4 questions on this exam. Please do all 4. 1. Basic Concepts [20 points] Find the letter with the best answer for each term: 1.
A Review: Geographic Information Systems & ArcGIS Basics
 A Review: Geographic Information Systems & ArcGIS Basics Geographic Information Systems Geographic Information Science Why is GIS important and what drives it? Applications of GIS ESRI s ArcGIS: A Review
Introduction INTRODUCTION TO GIS GIS - GIS GIS 1/12/2015. New York Association of Professional Land Surveyors January 22, 2015
 New York Association of Professional Land Surveyors January 22, 2015 INTRODUCTION TO GIS Introduction GIS - GIS GIS 1 2 What is a GIS Geographic of or relating to geography the study of the physical features
GIS IN ECOLOGY: ANALYZING RASTER DATA
 GIS IN ECOLOGY: ANALYZING RASTER DATA Contents Introduction... 2 Raster Tools and Functionality... 2 Data Sources... 3 Tasks... 4 Getting Started... 4 Creating Raster Data... 5 Statistics... 8 Surface
Lecture 6 - Raster Data Model & GIS File Organization
 Lecture 6 - Raster Data Model & GIS File Organization I. Overview of Raster Data Model Raster data models define objects in a fixed manner see Figure 1. Each grid cell has fixed size (resolution). The
Projections & GIS Data Collection: An Overview
 Projections & GIS Data Collection: An Overview Projections Primary data capture Secondary data capture Data transfer Capturing attribute data Managing a data capture project Geodesy Basics for Geospatial
NR402 GIS Applications in Natural Resources Lesson 4 Map Projections
 NR402 GIS Applications in Natural Resources Lesson 4 Map Projections From http://www.or.blm.gov/gis/ 1 Geographic coordinates Coordinates are expressed as Latitude and Longitude in Degrees, Minutes, Seconds
10/13/2011. Introduction. Introduction to GPS and GIS Workshop. Schedule. What We Will Cover
 Introduction Introduction to GPS and GIS Workshop Institute for Social and Environmental Research Nepal October 13 October 15, 2011 Alex Zvoleff azvoleff@mail.sdsu.edu http://rohan.sdsu.edu/~zvoleff Instructor:
Importance of Understanding Coordinate Systems and Map Projections.
 Importance of Understanding Coordinate Systems and Map Projections. 1 It is extremely important that you gain an understanding of coordinate systems and map projections. GIS works with spatial data, and,
(THIS IS AN OPTIONAL BUT WORTHWHILE EXERCISE)
") PART 2: Analysis in ArcGIS (THIS IS AN OPTIONAL BUT WORTHWHILE EXERCISE) Step 1: Start ArcCatalog and open a geodatabase If you have a shortcut icon for ArcCatalog on your desktop, double-click it to start
PART 2: Analysis in ArcGIS (THIS IS AN OPTIONAL BUT WORTHWHILE EXERCISE) Step 1: Start ArcCatalog and open a geodatabase If you have a shortcut icon for ArcCatalog on your desktop, double-click it to start
Vector Analysis: Farm Land Suitability Analysis in Groton, MA
 Vector Analysis: Farm Land Suitability Analysis in Groton, MA Written by Adrienne Goldsberry, revised by Carolyn Talmadge 10/9/2018 Introduction In this assignment, you will help to identify potentially
CAD: Introduction to using CAD Data in ArcGIS. Kyle Williams & Jeff Reinhart
 CAD: Introduction to using CAD Data in ArcGIS Kyle Williams & Jeff Reinhart What we will accomplish today Overview of ArcGIS CAD Support Georeferencing CAD data for ArcGIS How Mapping Specification for
GIS: Definition, Software. IAI Summer Institute 19 July 2000
 GIS: Definition, Software IAI Summer Institute 19 July 2000 What is a GIS? Geographic Information System Definitions DeMers (1997): Tools that allow for the processing of spatial data into information,
Learning ArcGIS: Introduction to ArcCatalog 10.1
 Learning ArcGIS: Introduction to ArcCatalog 10.1 Estimated Time: 1 Hour Information systems help us to manage what we know by making it easier to organize, access, manipulate, and apply knowledge to the
ISU GIS CENTER S ARCSDE USER'S GUIDE AND DATA CATALOG
 ISU GIS CENTER S ARCSDE USER'S GUIDE AND DATA CATALOG 2 TABLE OF CONTENTS 1) INTRODUCTION TO ARCSDE............. 3 2) CONNECTING TO ARCSDE.............. 5 3) ARCSDE LAYERS...................... 9 4) LAYER