presents challenges related to utility infrastructure planning. Many of these challenges
|
|
|
- Dwayne Brown
- 5 years ago
- Views:
Transcription
1 1
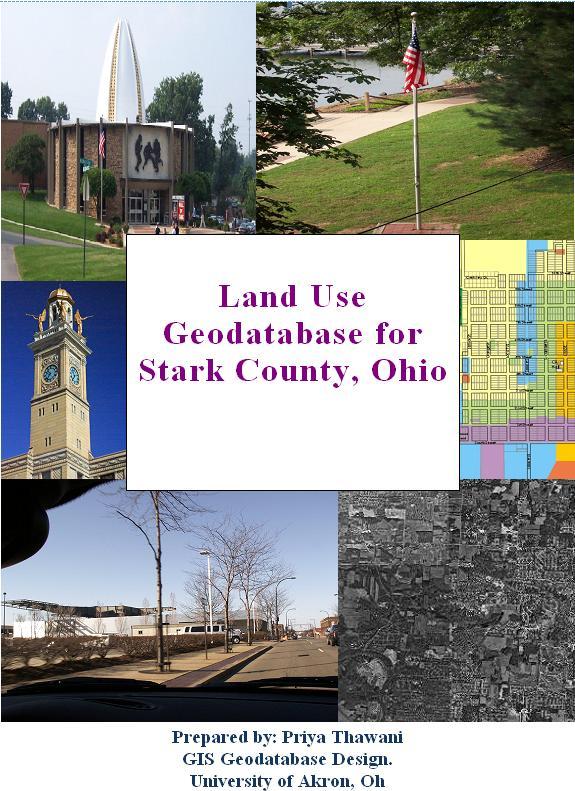
2 Introduction: - a. Purpose According to U.S. Census Bureau the population of stark county was 367,585 in 1990, and in 2000 it was increase to 378,098. Thus County is experiencing a growth that presents challenges related to utility infrastructure planning. Many of these challenges are related to water supply, water delivery, wastewater collection, changing source water qualities, and maintenance, travel behavior, traffic congestion and air quality. A land use database will enable the accurate monitoring of shifts in land use and help in the debates on land availability, urban expansion and protection of the countryside. The principal purpose of this geodatabase is to store and document data for departments of planning. b. Scope The Geodatabase focuses on Stark County which is located in the Ohio State. The goal of this project is to present Geodatabase for Stark County Land use. This Land use Data Model is designed as an essential data model that provides a context within a GIS that can quickly and easily accept the input that from a wide range of users need in order to accomplish their Land use goals. It allows us to examine the current Land use framework and issues within the framework. Considering the rapid and fast growth of the county, the project will enable us to solve issues within its structure to provide better solutions such as reducing congestion and pollution, expanded transportation infrastructure, accessibility to emergency service etc. 2

3 c. Background The Stark County is located in Northeast quadrant of Ohio; it is situated approximately 20 miles south of Akron, 53 miles south of Cleveland, 125 miles northwest of Pittsburgh and 386 miles east of Chicago. Northeast Ohio is also important due to its strategic location at the crossroads of the Midwestern and Eastern U.S. markets. As such, Northeast Ohio provides first-class infrastructure and Logistical support with a wellestablished transportation network connecting several Modes of transportation: including rail, air, water and highways. According to the U.S. Census Bureau, the county has a total area of 581 square miles (1,505 km²).576 square miles (1,492 km²) of it is land and 5 square miles (12 km²) of it (0.82%) is water, with the population was 378,098. 3
4 Conceptual Data Model A Conceptual Data Model covers one Subject Area from the Enterprise Data Model. The five logical groups in ArcGIS are Stark_Block_Demographics, Stark_Land use, Stark_Hydrology, Stark_Transportation and Stark_Zoning. Concepts: 1. Stark_Block_Demographics: This dataset have the four feature classes showing demographics, Census Tracts, block group and the Stark_Block_Demographics Block_groups Blocks_Demogroup Census_Tracts Parcel Parcels of the Stark County. This dataset contain the information of census 2000 of demographics of the County. 2. Stark_Land use: The logical group contains all the information for the particular class in Land use dataset. Thirteen feature classes are added to this dataset. As to know the particular location of schools, parks, libraries, cemeteries etc and also the use of land in county. 3. Stark_Hydrology: This dataset contain all the water bodies with there cover area in county and location. In the hydrology section it all depends the Stark_Hydrology Lake Well_Fields WaterShed Water_Storage Commerical_WaterTreatment 4 Rivers_Streams
5 type of research that it is intended to do. Some of the most important attributes are the description of a river or a stream. Other types of attributes important for a planning point of view are the extent of the watersheds and lakes. The depth of water bodies is also very important for developing an area. 4. Stark_Transportation: Transportation dataset has the facilities which are available for transportations in stark county. This dataset include three feature classes of Air fields, Main Roads Stark_Transportation Airfields Main_Roads Rail_Roads and Rail Roads to know the accessibility for the desire destination and the mode of transportation. For e.g.:- Getting people to and from their homes, businesses and community facilities is quite important. Without proper planning for current traffic and parking, as well as future growth, an area can be negatively impacted and result in no growth or shrinkage in population. 5. Stark_Zoning: Stark_Zoning Zoning includes the Land use. A county, in developing a plan for growth, would first need to determine the accepted uses for the land, in what proportions for each use and Commercial Industrial Residential rules for implementation of the plan. Depending on the area, this would include using land for residential, commercial and industrial. 5
6 6. Stark_AerialPhoto: Aerial photo includes the Raster image of Stark County. This can be use for Land use location. As the database is about the Land use of Stark County so it will be helpful in planning. Attributes and Relationship 1. Stark_Block_Demographics: In this section we have a diverse data about the specific demographic of Stark County. This feature class has a relationship with a table inside the geodatabase.this is more specific about the Demographics; the relationship is one to one between the Census_tract and Tract_demographics. 2. Stark_Landuse: Land use dataset has thirteen feature classes. In this section one to one relationship is shown between the Cemeteries and Parcel number feature class. 3. Stark_Hydrology: In the hydrology section it all depends the type of research that it is intended to do. Some of the most important attributes are the description of a river or a stream. Other types of attributes important for a planning point of view are the extent of the watersheds, waterstorage and lakes. In the River_stream feature class subtypes are created for easy use. 6
7 4. Stark_Transportation: In the transportation section we have the most attributes possible because it is very important to develop around or near the roads. This section contains the locations by county of almost all of its feature classes. The Main_roads section contains a subtype of the type of road in terms of state, county, Interstate etc. This feature class also contains two range domains one of them is number of lanes and the other one is speed limit. These values are very important because it will give us more detailed information about any street in Stark County. 5. Stark_Zoning: In this section there are three feature classes, this section include topology rule. Logical Data model Logical data models, properly designed, is based on the structures identified in the conceptual data model. Logical models depict the true relationships of attributes as they are grouped into entities, relating attributes to attributes and entities to entities. Logical models are not concerned with implementation, storage mechanisms, and redundancy of data. Logical models are usually normalized. Normalized means that every attribute is independent, that is, not dependent on any other attributes. In this section the true relationship is shown between the Tract_demographics and census Tracts. The other relationship is done between the Parcel_number and Cemeteries. 7
8 Data source The most important aspect of this data knows where it came from and who edited or processed this data. All of these factors can be found in the metadata. The Source of this all data is from the SCRPC (Stark County Regional Planning Commission).The most of data came in the same Coordinates. Mostly all data was in shape file format and then converted to a geodatabase. Documentation and Schema The Schema of this file geodatabase was design to serve a planning consultation. Some of the data was process in order to set priority hierarchy to more important features when starting a plan. The dataset Stark_Block_Demographics contains the general information about the Stark County. Another dataset Stark_Hydrology contains the information of the water bodies in the Study area. Third is Stark_Transportaion that have types of transportation available in County. Fourth is Stark_Zoning which includes the three main zoning sections, as it is very help full to know the land use. Fifth is stark_landuse in this dataset there are thirteen feature classes to show the location and use of land for various utilizes in the county. There is one Stark_Aerialphoto that is the raster dataset to show the aerial photo of the County. 8
9 Arc Diagrammer 9
10 Physical Data Model The logical model was implemented in the physical data model by following the same schema diagram. The physical model was implemented using the most important reference features from a Planning point of view. This file geodatabase was divided into five feature dataset: Stark_Block_Demographics, Stark_Hydrology, Stark_Transportation, Stark_Landuse, and Stark_Zoning beside this one Raster dataset. The logical model was developed by taking under consideration the major steps in study area. The Planners have to look for the data that it is stored in this geodatabase in order to have knowledge of what they are looking for in regards of the attributes. In this case there was only a production of a few subtypes because of the time frame but in further applications other types of subtypes and domains can be created for more feature classes. The creation of subtypes and domains are very important when you have a feature class with a lot of attributes. In this database the feature class River_streams in which according to the feature subtypes is created. For creating the Geodatabase the File Geodatabase is used as the database created is for the Land use of the Stark County. So, it is for the Planning purpose, it means that multiple people are going to use this database and edit it for there particular interest. After taking the planner s major concerns towards the storage of the data the best selection for the geodatabase is the file geodatabase. 10

11 Feature Dataset by Feature Classes: Stark_Block_Demographics: The first Feature dataset is the Block_Demographics and it contains four feature classes. This section also contains one relationship class of the Census tract 2000, with the table at the last of the geodatabase called Tract_demographics. The section has four feature classes where all four are polygon feature. Stark_LandUse: In this dataset there are thirteen features Classes out which twelve are point and one is polygon that is Parks. 11

12 Stark_Hydrology: In this dataset there are six feature classes. In which two classes are polygons and three points and two are line. Also include the subtypes in the Feature class River_Streams, subtypes are created on the basis of the features. The Subtypes were given the particular number 1 = Creek, 2 = Pond and 3 = River. 12


13 Stark_Transportation: This dataset include three classes out of which two are line and one is point. In this dataset the class name Main Roads the subtypes have been created on the basis of the Road types. In which 1 = County Roads, 2 = Interstate Roads and 3 = State Roads. In this feature class Domains are also created, one of them was the Speed Limit and the other one was number of lanes. This was created so that it will be easier to classify in more specific manner the streets in Stark County. 13


14 Stark_Zoning: In this section there are three features set and all three are polygon feature set. In this section topology rule is created between the Commercial and Industries classes with must not overlap rule. In Catalog tree it is name as Stark_Zoning_Topology. Validate Topology: 14
15 Summary of the File Geodatabase Build Process a. Loading data: The loading data process was done in different approach and different ways. In this section we will describe some of this process and the value of them to our data. Most of the data was in shape file format with different projections such as StatePlane_Ohio_North_FIPS_3401_Feet.I didn t change the coordinate system of any shape file as for mostly all the shape file it was the same as mention above. After creating the file geodatabase the next step was to select in the geodatabase to import and selecting the multiple feature class. For this I used a tool Import to multiple and then feature class was created to make the organized geodatabase.the loading time for each feature classes varies as the size of the file. The time for biggest time shape file took me around 8 minutes 12 seconds and the smallest shape file just took me 18 seconds. The biggest data which I had was the Aerial photo of Stark County which I loaded using Raster Catalog as Unmanaged Raster type then too it took me around 49 minutes and 3 seconds, and I did not tried the managed Raster type because it would have taken me more than 10 hours. 15
16 G e o d a t a b a s e B u i l d P r o c e s s Feature Dataset Feature Class Subtype Domains Topology Relationship Stark_Block_Demogrpahics Block_Group Block_Demogroup Census_Tract Parcels Census Tract to Block Demographics Stark_Landuse Stark_Hydrology Stark_Transportation Stark_Zoning Stark_AerialPhoto Cemeteries Church Firestation Govt.Facilities Historical Landmark Hospital Libraries Mines Monuments Parks Police station Post office School Commerical_wt._TreatmentPlant Lake River_Stream Water_Storage Well_Fields Air_Fields Main Roads Rail_roads Commercial Industries Residential AerialPhoto Creek Pond River State County Interstate Lane SpeeLimit Commercial Industries Must not Overlap Parcel to Cemeteries b. Documentation of loading time: Name of Layer Original File File to FGDB Loading Time Entire layers* Shape file Feature Classes 58 minutes Unmanaged images Tiff Raster Catalog 49min - 3sec Managed images Tiff Raster Catalog Not done Rivers_streams(biggest) Shape file Feature Class 8min 12 sec Hospitals Shape file Feature Class 18 seconds 16

17 C. Model for loading data This model is only a representative of the actual database created but it can be used for any file-geodatabase that needs to be developed. Depending on the quantity of feature classes and raster images imported into the database the time for the development of the geodatabase will vary. 17

18 Deployment and Assessing Usability In this particular case we are going to use our file geodatabase in order to proof that it is faster. It is no secret that regional land-use plans are not regarded as likely to have any real impact on developer decision-making activities in the United States. The geodatabase can be used for the creating a land use map of whole Stark County or for each township of County. Land use involves all the factors that are Natural subsystem and the Human subsystem. Natural like River, Streams, Lake, Topography and Human includes the infrastructure. As increase in population require more residential, commercial, transportation facilities etc. For planning all this land use is very important. For e.g.: Transportation is part of Land use, so data can be used to show the network of roads, railways, bus stops etc. 1. SARTA: Bus Routes in Stark County. 18


19 2. Zoning Map of Different Township in Stark County. Nimishillen Township Zoning Map of East Canton Village 19
20 References: The United States Census Bureau Web Site: Stark County Regional Planning. Web Site:
Geodatabase for Sustainable Urban Development. Presented By Rhonda Maronn Maurice Johns Daniel Ashney Jack Anliker
 Geodatabase for Sustainable Urban Development Presented By Rhonda Maronn Maurice Johns Daniel Ashney Jack Anliker Objective Build a Geodatabase that will enable urban planners to create and assess the
IMPERIAL COUNTY PLANNING AND DEVELOPMENT
 IMPERIAL COUNTY PLANNING AND DEVELOPMENT GEODATABASE USER MANUAL FOR COUNTY BUSINESS DEVELOPMENT GIS June 2010 Prepared for: Prepared by: County of Imperial Planning and Development 801 Main Street El
Updating the Urban Boundary and Functional Classification of New Jersey Roadways using 2010 Census data
 Updating the Urban Boundary and Functional Classification of New Jersey Roadways using 2010 Census data By: Glenn Locke, GISP, PMP 1 GIS-T May, 2013 Presentation Overview Purpose of Project Methodology
Techniques for Science Teachers: Using GIS in Science Classrooms.
 Techniques for Science Teachers: Using GIS in Science Classrooms. After ESRI, 2008 GIS A Geographic Information System A collection of computer hardware, software, and geographic data used together for
High Speed / Commuter Rail Suitability Analysis For Central And Southern Arizona
 High Speed / Commuter Rail Suitability Analysis For Central And Southern Arizona Item Type Reports (Electronic) Authors Deveney, Matthew R. Publisher The University of Arizona. Rights Copyright is held
GIS Level 2. MIT GIS Services
 GIS Level 2 MIT GIS Services http://libraries.mit.edu/gis Email: gishelp@mit.edu TOOLS IN THIS WORKSHOP - Definition Queries - Create a new field in the attribute table - Field Calculator - Add XY Data
Neighborhood Locations and Amenities
 University of Maryland School of Architecture, Planning and Preservation Fall, 2014 Neighborhood Locations and Amenities Authors: Cole Greene Jacob Johnson Maha Tariq Under the Supervision of: Dr. Chao
CENSUS MAPPING WITH GIS IN NAMIBIA. BY Mrs. Ottilie Mwazi Central Bureau of Statistics Tel: October 2007
 CENSUS MAPPING WITH GIS IN NAMIBIA BY Mrs. Ottilie Mwazi Central Bureau of Statistics E-mail: omwazi@npc.gov.na Tel: + 264 61 283 4060 October 2007 Content of Presentation HISTORICAL BACKGROUND OF CENSUS
GIS Lecture 5: Spatial Data
 GIS Lecture 5: Spatial Data GIS 1 Outline Vector Data Formats Raster Data Formats Map Projections Coordinate Systems US Census geographic files US Census data files GIS Data Sources GIS 2 Vector Data Formats
GIS ANALYSIS METHODOLOGY
 GIS ANALYSIS METHODOLOGY No longer the exclusive domain of cartographers, computer-assisted drawing technicians, mainframes, and workstations, geographic information system (GIS) mapping has migrated to
Designing GIS Databases to Support Mapping and Map Production Charlie Frye, ESRI Redlands Aileen Buckley, ESRI Redlands
 Designing GIS Databases to Support Mapping and Map Production Charlie Frye, ESRI Redlands Aileen Buckley, ESRI Redlands 1 Designing GIS Databases to Support Mapping and Map Production Charlie Frye, ESRI
Great California Delta Trail Blueprint for Contra Costa and Solano Counties GIS AND MAPPING MEMORANDUM JULY 2010
 Great California Delta Trail Blueprint for Contra Costa and Solano Counties GIS AND MAPPING MEMORANDUM JULY 2010 {DRAFT} July 2010 Introduction Geographic Information Systems (GIS) are computer-based
INDIANAMAP VIEWING APPLICATION
 INDIANAMAP VIEWING APPLICATION (VERSION 1.0 ) Based on the 2005 Developed for the Indiana Department of Homeland Security by: IndianaMap Viewing Application Introduction The IndianaMap Viewing Application
Introduction-Overview. Why use a GIS? What can a GIS do? Spatial (coordinate) data model Relational (tabular) data model
 data model Relational (tabular) data model") Introduction-Overview Why use a GIS? What can a GIS do? How does a GIS work? GIS definitions Spatial (coordinate) data model Relational (tabular) data model intro_gis.ppt 1 Why use a GIS? An extension
Introduction-Overview Why use a GIS? What can a GIS do? How does a GIS work? GIS definitions Spatial (coordinate) data model Relational (tabular) data model intro_gis.ppt 1 Why use a GIS? An extension
Application of GIS in Public Transportation Case-study: Almada, Portugal
 Case-study: Almada, Portugal Doutor Jorge Ferreira 1 FSCH/UNL Av Berna 26 C 1069-061 Lisboa, Portugal +351 21 7908300 jr.ferreira@fcsh.unl.pt 2 FSCH/UNL Dra. FCSH/UNL +351 914693843, leite.ines@gmail.com
GIS Geographical Information Systems. GIS Management
 GIS Geographical Information Systems GIS Management Difficulties on establishing a GIS Funding GIS Determining Project Standards Data Gathering Map Development Recruiting GIS Professionals Educating Staff
McHenry County Property Search Sources of Information
 Disclaimer: The information in this system may contain inaccuracies or typographical errors. The information in this system is a digital representation of information derived from original documents; as
GIS = Geographic Information Systems;
 What is GIS GIS = Geographic Information Systems; What Information are we talking about? Information about anything that has a place (e.g. locations of features, address of people) on Earth s surface,
USGS Community Engagement and its Role in Improving The National Map
 USGS Community Engagement and its Role in Improving The National Map ESRI User Conference, 2014 Bob Davis Carol Ostergren Drew Decker USGS Strategic Direction Provides a sharpened focus on our topographic
software, just as word processors or databases are. GIS was originally developed and cartographic capabilities have been augmented by analysis tools.
 1. INTRODUCTION 1.1Background A GIS is a Geographic Information System, a software package for creating, viewing, and analyzing geographic information or spatial data. GIS is a class of software, just
An Introduction to the Community Maps Information Model
 Esri International User Conference July 23 27 San Diego Convention Center An Introduction to the Community Maps Information Model Seth Sarakaitis Agenda Overview of Community Maps Program Information Models
GIS Monroe Geographic Information System March 14, 2018
 GIS Monroe Geographic Information System March 14, 2018 Goals Maintain Enterprise/County-wide geo-database Increase spatial accuracy of data Build and acquire more data layers Increase use of GIS; as another
Huron Creek Watershed 2005 Land Use Map
 Huron Creek Watershed 2005 Land Use Map Created By: Linda Kersten, 12/20/06 Created For: MTU Introduction to GIS Class (FW 5550) The Huron Creek Watershed Advisory Committee Michigan Technological University,
Developing a Campus-wide Base Map for Planning, Design and Construction. June 21, 2007
 Developing a Campus-wide Base Map for Planning, Design and Construction June 21, 2007 Presenters Berent Pippert UCR Project Manager Capital and Physical Planning Academic Planning and Budget 951-827-2431
ESRI Survey Summit August Clint Brown Director of ESRI Software Products
 ESRI Survey Summit August 2006 Clint Brown Director of ESRI Software Products Cadastral Fabric How does Cadastral fit with Survey? Surveyors process raw field observations Survey measurements define high-order
GIS and Remote Sensing Support for Evacuation Analysis
 GIS and Remote Sensing Support for Evacuation Analysis Presented to GIS for Transportation Symposium Rapid City, South Dakota March 28-31, 2004 Demin Xiong Oak Ridge National Laboratory 2360 Cherahala
Frayser. A Turning Point. Comprehensive Planning Studio Fall Graduate Program in City and Regional Planning University of Memphis LIST OF MAPS
 Frayser A Turning Point Comprehensive Planning Studio Fall 2006 Graduate Program in City and Regional Planning University of Memphis LIST OF MAPS Map 1. Memphis Region (T. Moreland) Map 2. Frayser (T.
Introduction to GIS. Dr. M.S. Ganesh Prasad
 Introduction to GIS Dr. M.S. Ganesh Prasad Department of Civil Engineering The National Institute of Engineering, MYSORE ganeshprasad.nie@gmail.com 9449153758 Geographic Information System (GIS) Information
NCTCOG GIS File Locations
 Boundaries Area Codes k:\bnd\region\area_codes.shp Area Type k:\bnd\region\areatype.shp Ciry Centroids (World) k:\bnd\usa_world\cities.shp City Centroids (NCTCOG Region) k:\bnd\region\city_point.shp vector.vector.bnd_city_point
Urbanization factors in the Gilleland Creek watershed, Travis County, Texas. Michael Kanarek GEO386G Final Project Dec. 2, 2011
 Urbanization factors in the Gilleland Creek watershed, Travis County, Texas Michael Kanarek GEO386G Final Project Dec. 2, 2011 1 Introduction The watershed of Gilleland Creek, which flows through eastern
A Comprehensive Inventory of the Number of Modified Stream Channels in the State of Minnesota. Data, Information and Knowledge Management.
 A Comprehensive Inventory of the Number of Modified Stream Channels in the State of Minnesota Data, Information and Knowledge Management Glenn Skuta Environmental Analysis and Outcomes Division Minnesota
A GIS TOUR OF DES MOINES PRESENTED BY ANNA WHIPPLE, GIS MANAGER APRIL 20, 2015
 A GIS TOUR OF DES MOINES PRESENTED BY ANNA WHIPPLE, GIS MANAGER APRIL 20, 2015 Welcome to Des Moines! Capital of Iowa Among 100 largest metropolitan areas Insurance, biotech, healthcare, and entertainment
GIS Technology and Tools for Long Range Transportation Planning in the National Park Service
 GIS Technology and Tools for Long Range Transportation Planning in the National Park Service Geospatial Information Systems for Transportation Symposium Loveland, Colorado April 16, 2012 Nell Blodgett
The Road to Data in Baltimore
 Creating a parcel level database from high resolution imagery By Austin Troy and Weiqi Zhou University of Vermont, Rubenstein School of Natural Resources State and local planning agencies are increasingly
Geodatabase An Introduction
 Federal GIS Conference 2014 February 10 11, 2014 Washington DC Geodatabase An Introduction Ralph Denkenberger esri Session Path The Geodatabase - What is it? - Why use it? - What types are there? Inside
McHenry County Property Search Sources of Information
 Disclaimer: The information in this system may contain inaccuracies or typographical errors. The information in this system is a digital representation of information derived from original documents; as
Geography 38/42:376 GIS II. Topic 1: Spatial Data Representation and an Introduction to Geodatabases. The Nature of Geographic Data
 Geography 38/42:376 GIS II Topic 1: Spatial Data Representation and an Introduction to Geodatabases Chapters 3 & 4: Chang (Chapter 4: DeMers) The Nature of Geographic Data Features or phenomena occur as
GIS and Governing Anchorage. GIS Critical for Efficient, Transparent Government How is GIS Program Doing Where can GIS Program Take us
 GIS and Governing Anchorage GIS Critical for Efficient, Transparent Government How is GIS Program Doing Where can GIS Program Take us Municipality of Anchorage Office of Economic And Community Development
GEOGRAPHIC INFORMATION SYSTEMS
 GEOGRAPHIC INFORMATION SYSTEMS 4-H Round-Up Community Transitions Workshop Daniel Hanselka June 14, 2011 Goals of the Workshop Answer the question: What is GIS? Uses of GIS. Some of the Common Terminology
EEOS 381 -Spatial Databases and GIS Applications
 EEOS 381 -Spatial Databases and GIS Applications Lecture 5 Geodatabases What is a Geodatabase? Geographic Database ESRI-coined term A standard RDBMS that stores and manages geographic data A modern object-relational
Technical Memorandum #2 Future Conditions
 Technical Memorandum #2 Future Conditions To: Dan Farnsworth Transportation Planner Fargo-Moorhead Metro Council of Governments From: Rick Gunderson, PE Josh Hinds PE, PTOE Houston Engineering, Inc. Subject:
NR402 GIS Applications in Natural Resources
 NR402 GIS Applications in Natural Resources Lesson 1 Introduction to GIS Eva Strand, University of Idaho Map of the Pacific Northwest from http://www.or.blm.gov/gis/ Welcome to NR402 GIS Applications in
GIS for ChEs Introduction to Geographic Information Systems
 GIS for ChEs Introduction to Geographic Information Systems AIChE Webinar John Cirucci 1 GIS for ChEs Introduction to Geographic Information Systems What is GIS? Tools and Methods Applications Examples
Steve Pietersen Office Telephone No
 Steve Pietersen Steve.Pieterson@durban.gov.za Office Telephone No. 031 311 8655 Overview Why geography matters The power of GIS EWS GIS water stats EWS GIS sanitation stats How to build a GIS system EWS
GIS Needs Assessment. for. The City of East Lansing
 GIS Needs Assessment for The City of East Lansing Prepared by: Jessica Moy and Richard Groop Center for Remote Sensing and GIS, Michigan State University February 24, 2000 Executive Summary At the request
Lab#8: Working With Geodatabases. create a geodatabase with feature datasets, tables, raster datasets, and raster catalogs
 Lab#8: Geodatabase Concepts Page#1 of 25 In this lab, you will learn how to: Lab#8: Working With Geodatabases create a geodatabase with feature datasets, tables, raster datasets, and raster catalogs join
Introducing GIS analysis
 1 Introducing GIS analysis GIS analysis lets you see patterns and relationships in your geographic data. The results of your analysis will give you insight into a place, help you focus your actions, or
The Use of Geographic Information Systems (GIS) by Local Governments. Giving municipal decision-makers the power to make better decisions
 by Local Governments. Giving municipal decision-makers the power to make better decisions") The Use of Geographic Information Systems (GIS) by Local Governments Giving municipal decision-makers the power to make better decisions Case Study: Examples of GIS Usage by Local Governments in North
The Use of Geographic Information Systems (GIS) by Local Governments Giving municipal decision-makers the power to make better decisions Case Study: Examples of GIS Usage by Local Governments in North
Implications for the Sharing Economy
 Locational Big Data and Analytics: Implications for the Sharing Economy AMCIS 2017 SIGGIS Workshop Brian N. Hilton, Ph.D. Associate Professor Director, Advanced GIS Lab Center for Information Systems and
GIS present situation in Japan
 GIS present situation in Japan September 26, 2006 INTERPREVENT 2006 in Niigata University Geographic Information Analysis Research Div. Geography and Crustal Dynamics Research Senter Geographical Survey
If you aren t familiar with Geographical Information Systems (GIS), you. GIS, when combined with a database that stores response information,
, you. GIS, when combined with a database that stores response information,") Geographical Information Systems in EMS By William E. Ott If you aren t familiar with Geographical Information Systems (GIS), you should take a look at what GIS can offer you as an EMS manager. GIS, when
Geographical Information Systems in EMS By William E. Ott If you aren t familiar with Geographical Information Systems (GIS), you should take a look at what GIS can offer you as an EMS manager. GIS, when
Analysis of Change in Land Use around Future Core Transit Corridors: Austin, TX, Eric Porter May 3, 2012
 Analysis of Change in Land Use around Future Core Transit Corridors: Austin, TX, 1990-2006 PROBLEM DEFINITION Eric Porter May 3, 2012 This study examines the change in land use from 1990 to 2006 in the
New Land Cover & Land Use Data for the Chesapeake Bay Watershed
 New Land Cover & Land Use Data for the Chesapeake Bay Watershed Why? The Chesapeake Bay Program (CBP) partnership is in the process of improving and refining the Phase 6 suite of models used to inform
TRAVEL DEMAND MODEL. Chapter 6
 Chapter 6 TRAVEL DEMAND MODEL As a component of the Teller County Transportation Plan development, a computerized travel demand model was developed. The model was utilized for development of the Transportation
Geodatabase An Overview
 Federal GIS Conference February 9 10, 2015 Washington, DC Geodatabase An Overview Ralph Denkenberger - esri Session Path The Geodatabase - What is it? - Why use it? - What types are there? Inside the Geodatabase
Chapter 6. Fundamentals of GIS-Based Data Analysis for Decision Support. Table 6.1. Spatial Data Transformations by Geospatial Data Types
 Chapter 6 Fundamentals of GIS-Based Data Analysis for Decision Support FROM: Points Lines Polygons Fields Table 6.1. Spatial Data Transformations by Geospatial Data Types TO: Points Lines Polygons Fields
Illustrator: Vector base Each line/point store some sort of information Mapping Representation of the world
 Illustrator: Vector base Each line/point store some sort of information Mapping Representation of the world Photoshop Raster base Images can be overlaid Pixel vector data model: [data models] A representation
Local Area Key Issues Paper No. 13: Southern Hinterland townships growth opportunities
 Draft Sunshine Coast Planning Scheme Review of Submissions Local Area Key Issues Paper No. 13: Southern Hinterland townships growth opportunities Key Issue: Growth opportunities for Southern Hinterland
Quality and Coverage of Data Sources
 Quality and Coverage of Data Sources Objectives Selecting an appropriate source for each item of information to be stored in the GIS database is very important for GIS Data Capture. Selection of quality
INDOT Office of Traffic Safety
 Intro to GIS Spatial Analysis INDOT Office of Traffic Safety Intro to GIS Spatial Analysis INDOT Office of Traffic Safety Kevin Knoke Section 130 Program Manager Highway Engineer II Registered Professional
Welcome to NR502 GIS Applications in Natural Resources. You can take this course for 1 or 2 credits. There is also an option for 3 credits.
 Welcome to NR502 GIS Applications in Natural Resources. You can take this course for 1 or 2 credits. There is also an option for 3 credits. The 1st credit consists of a series of readings, demonstration,
HIGH RESOLUTION BASE MAP: A CASE STUDY OF JNTUH-HYDERABAD CAMPUS
 HIGH RESOLUTION BASE MAP: A CASE STUDY OF JNTUH-HYDERABAD CAMPUS K.Manjula Vani, Abhinay Reddy, J. Venkatesh, Ballu Harish and R.S. Dwivedi ABSTRACT The proposed work High Resolution Base map: A Case study
Administering your Enterprise Geodatabase using Python. Jill Penney
 Administering your Enterprise Geodatabase using Python Jill Penney Assumptions Basic knowledge of python Basic knowledge enterprise geodatabases and workflows You want code Please turn off or silence cell
Crow River Plaza - Retail Development South Diamond Lake Rd. Rogers, MN FOR LEASE 1,024 SF Retail Space. Lease Rate: $16.
 FEATURES: - Available in Rogers, MN Lease Rate: $16.00 / psf NNN - Excellent location with freeway signage on I-94! - Near large retailers such as Target, Kohls, & Applebees. Taxes $3.65 / psf Cam $3.20
An Enterprise Geodatabase: Montgomery County, Maryland ESRI 2004 User Conference Paper #1674
 An Enterprise Geodatabase: Montgomery County, Maryland ESRI 2004 User Conference Paper #1674 1.0 ABSTRACT Montgomery County, Maryland has a long history of supporting GIS applications with a SDE/ArcSDE
Vacant Land Identification in the City of Lakeway Texas and Growth potential of the Lakeway Area
 Vacant Land Identification in the City of Lakeway Texas and Growth potential of the Lakeway Area Troy Larsen School of Architecture The University of Texas at Austin December 14, 2007 CRP 386 Introduction
Lecture 9: Geocoding & Network Analysis
 Massachusetts Institute of Technology - Department of Urban Studies and Planning 11.520: A Workshop on Geographic Information Systems 11.188: Urban Planning and Social Science Laboratory Lecture 9: Geocoding
A Temporal Hydrologic Database for Rapidly Changing Landscapes
 A Temporal Hydrologic Database for Rapidly Changing Landscapes Using Mt. St. Helens in Washington as a Pilot Site Adam Mosbrucker Geog 575 BACKGROUND: Client / User U.S. Geological Survey Cascades Volcano
Sensitivity of estimates of travel distance and travel time to street network data quality
 Sensitivity of estimates of travel distance and travel time to street network data quality Paul Zandbergen Department of Geography University of New Mexico Outline Street network quality Approaches to
LandScan Global Population Database
 LandScan Global Population Database The World s Finest Population Distribution Data Uncommon information. Extraordinary places. LandScan Global Population Database East View Cartographic is now offering
British Standard 7666:2006 (parts 0, 1 and 2) its impact & use within local government
 its impact & use within local government") British Standard 7666:2006 (parts 0, 1 and 2) its impact & use within local government geoplace.co.uk Background to British Standard (BS) 7666 BS7666:2006 is one of around 27,000 British Standards. BS7666:2006
British Standard 7666:2006 (parts 0, 1 and 2) its impact & use within local government geoplace.co.uk Background to British Standard (BS) 7666 BS7666:2006 is one of around 27,000 British Standards. BS7666:2006
Learning ArcGIS: Introduction to ArcCatalog 10.1
 Learning ArcGIS: Introduction to ArcCatalog 10.1 Estimated Time: 1 Hour Information systems help us to manage what we know by making it easier to organize, access, manipulate, and apply knowledge to the
East Bay BRT. Planning for Bus Rapid Transit
 East Bay BRT Planning for Bus Rapid Transit Regional Vision Draper Prison The Bottleneck is a State-Level issue, Salt Lake County 2050 Population: 1.5M Draper Prison hopefully with some State-Level funding!
APPENDIX IV MODELLING
 APPENDIX IV MODELLING Kingston Transportation Master Plan Final Report, July 2004 Appendix IV: Modelling i TABLE OF CONTENTS Page 1.0 INTRODUCTION... 1 2.0 OBJECTIVE... 1 3.0 URBAN TRANSPORTATION MODELLING
Travel Time Calculation With GIS in Rail Station Location Optimization
 Travel Time Calculation With GIS in Rail Station Location Optimization Topic Scope: Transit II: Bus and Rail Stop Information and Analysis Paper: # UC8 by Sutapa Samanta Doctoral Student Department of
Acknowledgments xiii Preface xv. GIS Tutorial 1 Introducing GIS and health applications 1. What is GIS? 2
 Acknowledgments xiii Preface xv GIS Tutorial 1 Introducing GIS and health applications 1 What is GIS? 2 Spatial data 2 Digital map infrastructure 4 Unique capabilities of GIS 5 Installing ArcView and the
WELCOME & INTRODUCTIONS
 GIS Monroe Geographic Information System January 31, 2018 WELCOME & INTRODUCTIONS Chip Thomas, Ritter GIS Sarah Schrader, Acct. Mgr., ESRI Chris Beyett, Solutions Engineer, ESRI Colleen Hinzmann, IT Director,
Crow River Plaza - Retail Development South Diamond Lake Rd. Rogers, MN FOR LEASE 2,066 SF Retail Space. Lease Rate: $16.
 FEATURES: - 2,066 SF End Cap Retail Space Available in Rogers, MN - Excellent location with freeway signage on I-94! - Near large retailers such as Target, Kohls, & Applebees. - Convenient location off
KENTUCKY HAZARD MITIGATION PLAN RISK ASSESSMENT
 KENTUCKY HAZARD MITIGATION PLAN RISK ASSESSMENT Presentation Outline Development of the 2013 State Hazard Mitigation Plan Risk Assessment Determining risk assessment scale Census Data Aggregation Levels
Flood Scenario Worksheet
 Flood Scenario Worksheet Scenario adapted from: http://www.epa.gov/watersecurity/tools/trainingcd/simple/source/scenario-8/ssc8-0.pdf Simple Tabletop Exercise, Interdependency Natural Disaster Scenario,
GIS ADMINISTRATOR / WEB DEVELOPER EVANSVILLE-VANDERBURGH COUNTY AREA PLAN COMMISSION
 GIS ADMINISTRATOR / WEB DEVELOPER EVANSVILLE-VANDERBURGH COUNTY AREA PLAN COMMISSION SALARY RANGE INITIATION $43,277 SIX MONTHS $45,367 POSITION GRADE PAT VI The Evansville-Vanderburgh County Area Plan
The File Geodatabase API. Craig Gillgrass Lance Shipman
 The File Geodatabase API Craig Gillgrass Lance Shipman Schedule Cell phones and pagers Please complete the session survey we take your feedback very seriously! Overview File Geodatabase API - Introduction
Geodatabase An Introduction
 2013 Esri International User Conference July 8 12, 2013 San Diego, California Technical Workshop Geodatabase An Introduction David Crawford and Jonathan Murphy Session Path The Geodatabase What is it?
Arcgis Enterprise Performance And Scalability Best Practices
 Arcgis Enterprise Performance And Scalability Best Practices We have made it easy for you to find a PDF Ebooks without any digging. And by having access to our ebooks online or by storing it on your computer,
FSUTMS Framework for Integrating Land Use Modeling
 FSUTMS Framework for Integrating Land Use Modeling presented to MTF Data Committee presented by Wade L. White, Whitehouse Group Walter Anderson, Whitehouse Group March 6, 2012 Agenda Background Previous
Pierce Cedar Creek Institute GIS Development Final Report. Grand Valley State University
 Pierce Cedar Creek Institute GIS Development Final Report Grand Valley State University Major Goals of Project The two primary goals of the project were to provide Matt VanPortfliet, GVSU student, the
Optimized positioning for accommodation centers in GIS using AHP techniques; a case study: Hamedan city
 Journal of Tourism & Hospitality Research Islamic Azad University, Garmsar Branch Vol. 2, No. 2, Autumn 2012, Pp.19-29 Optimized positioning for accommodation in GIS using AHP techniques; a case study:
1.1 What is Site Fingerprinting?
 Site Fingerprinting Utilizing GIS/GPS Technology 1.1 What is Site Fingerprinting? Site fingerprinting is a planning tool used to design communities where protection of natural resources is the primary
Louisiana Transportation Engineering Conference. Monday, February 12, 2007
 Louisiana Transportation Engineering Conference Monday, February 12, 2007 Agenda Project Background Goal of EIS Why Use GIS? What is GIS? How used on this Project Other site selection tools I-69 Corridor
STEREO ANALYST FOR ERDAS IMAGINE Stereo Feature Collection for the GIS Professional
 STEREO ANALYST FOR ERDAS IMAGINE Stereo Feature Collection for the GIS Professional STEREO ANALYST FOR ERDAS IMAGINE Has Your GIS Gone Flat? Hexagon Geospatial takes three-dimensional geographic imaging
Remote Sensing the Urban Landscape
 Remote Sensing the Urban Landscape Urban landscape are composed of a diverse assemblage of materials (concrete, asphalt, metal, plastic, shingles, glass, water, grass, shrubbery, trees, and soil) arranged
Geodatabase Programming with Python John Yaist
 Geodatabase Programming with Python John Yaist DevSummit DC February 26, 2016 Washington, DC Target Audience: Assumptions Basic knowledge of Python Basic knowledge of Enterprise Geodatabase and workflows
A More Comprehensive Vulnerability Assessment: Flood Damage in Virginia Beach
 A More Comprehensive Vulnerability Assessment: Flood Damage in Virginia Beach By Raj Shah GIS in Water Resources Fall 2017 Introduction One of the most obvious effects of flooding events is death. Humans
Geodatabase: Best Practices. Robert LeClair, Senior Instructor
 Geodatabase: Best Practices Robert LeClair, Senior Instructor Agenda Geodatabase Creation Data Ownership Data Model Data Configuration Geodatabase Behaviors Data Validation Extending Performance Geodatabase
ISU GIS CENTER S ARCSDE USER'S GUIDE AND DATA CATALOG
 ISU GIS CENTER S ARCSDE USER'S GUIDE AND DATA CATALOG 2 TABLE OF CONTENTS 1) INTRODUCTION TO ARCSDE............. 3 2) CONNECTING TO ARCSDE.............. 5 3) ARCSDE LAYERS...................... 9 4) LAYER
Innovation. The Push and Pull at ESRI. September Kevin Daugherty Cadastral/Land Records Industry Solutions Manager
 Innovation The Push and Pull at ESRI September 2004 Kevin Daugherty Cadastral/Land Records Industry Solutions Manager The Push and The Pull The Push is the information technology that drives research and
GIS Analysis of Crenshaw/LAX Line
 PDD 631 Geographic Information Systems for Public Policy, Planning & Development GIS Analysis of Crenshaw/LAX Line Biying Zhao 6679361256 Professor Barry Waite and Bonnie Shrewsbury May 12 th, 2015 Introduction
Accessibility analysis of multimodal transport systems using advanced GIS techniques
 Urban Transport XIII: Urban Transport and the Environment in the 21st Century 655 Accessibility analysis of multimodal transport systems using advanced GIS techniques T. Vorraa Citilabs Regional Director,
Urban Planning Word Search Level 1
 Urban Planning Word Search Level 1 B C P U E C O S Y S T E M P A R E U O E U R B A N P L A N N E R T N S T D H E C O U N T Y G E R E R D W R E N I C I T Y C O U N C I L A A A S U G G C I L A G P R I R
Enhancing Parcel Data In Colleton County. February 10, 2009
 Enhancing Parcel Data In Colleton County GIS & CAMA Conference February 10, 2009 Introductions Bruce T. Harper Technology Director Colleton County, SC Bill Wetzel National GIS Account Manager The Sidwell