(918) or (888)
|
|
|
- Jesse Page
- 5 years ago
- Views:
Transcription


")
1 Corporate Headquarters 5634 S. 122nd E. Ave. Ste. F Tulsa, Oklahoma Las Vegas Office 5925 E. Lake Mead Blvd. Las Vegas, Nevada Philadelphia Office 8900 State Road Philadelphia, Pennsylvania Houston Office 1920 Treble Drive Humble, Texas (918) or (888)
2 EMISSION COMPLIANCE TEST FOR THE BIOMASS BOILER STACK OUTLET AND SPRAY DRYER ABSORBER INLET PREPARED FOR FIBROMINN, LLC AT THE FIBROMINN BIOMASS POWER PLANT 900 INDUSTRY DRIVE BENSON, MINNESOTA JULY 2-4, 2007 Prepared and Reviewed by: Thomas K. Graham, PE, Director of Operations Quinn A. Bierman, President
3
4 Table of Contents 1.0 INTRODUCTION TEST PURPOSE AND OBJECTIVES SUMMARY OF TEST PROGRAM Participating Organizations Industry Air Permit Plant Location Equipment Tested Emission Points Pollutants Measured Dates of Emission Test KEY PERSONNEL SUMMARY OF TEST RESULTS PROCESS DESCRIPTION SAMPLING LOCATION SAMPLING AND ANALYTICAL PROCEDURES TEST METHODS INSTRUMENT CONFIGURATION AND OPERATIONS FOR GAS ANALYSIS 6 APPENDICES Appendix A Appendix B Appendix C Appendix D Appendix E Appendix F Appendix G Appendix H Test Results and Calculations Unit Operation Parameters Calibration Gas Certifications Quality Assurance and Quality Control Data Stratification Test Data Fuel Analysis Test Protocol MPCA Approvals and Requested Forms i
5 Emissions Compliance Test Biomass Boiler Stack Outlet and Spray Dryer Absorber Inlet Fibrominn, LLC Fibrominn Biomass Power Plant Benson, Minnesota July 2-4, INTRODUCTION Air Hygiene International, Inc. (Air Hygiene) has completed the emissions testing study for nitrogen oxides (NOx), carbon monoxide (CO), sulfur dioxide (SO 2 ), hydrochloric acid (HCl), particulate matter (PM), opacity, carbon dioxide (CO 2 ), and oxygen (O 2 ) from the Biomass Boiler Stack Outlet and Spray Dryer Absorber Inlet for Fibrominn, LLC at the Fibrominn Biomass Power Plant near Benson, Minnesota. This report details the background, results, process description, and the sampling/analysis methodology of the stack sampling survey conducted on July 2-4, TEST PURPOSE AND OBJECTIVES The purpose of the test was to conduct an initial compliance emission test to document levels of selected pollutants at a maximum test load (greater than 90 percent). The information will be used to confirm compliance with the operating permit issued by the Minnesota Pollution Control Agency (MPCA). The specific objective was to determine the emission concentration of NOx, CO, SO 2, HCl, PM, opacity, CO 2, and O 2 from Fibrominn, LLC s Biomass Boiler Stack Outlet and Spray Dryer Absorber Inlet. 1.2 SUMMARY OF TEST PROGRAM The following list details pertinent information related to this specific project: Participating Organizations Minnesota Pollution Control Agency (MPCA) Fibrominn, LLC SNC - Lavalin Air Hygiene Industry Biomass Fired Electric Utility / Electric Services Air Permit Permit Number: AQ Facility ID No: Plant Location Fibrominn Biomass Power Plant near Benson, Minnesota Equipment Tested Biomass Boiler Stack Outlet and Spray Dryer Absorber Inlet Emission Points Biomass Boiler Stack Outlet and Spray Dryer Absorber Inlet For NOx, CO, SO 2, CO 2, and O 2, 12 sampling points from the Biomass Boiler Stack Outlet and Spray Dryer Absorber Inlet (SO 2 and O 2, only), determined after conducting a stratification test (refer to Appendix E snc-07-benson.mn-comp#1-rpt 1
6 For all HCl testing, one sample point in the Biomass Boiler Stack Outlet and Spray Dryer Absorber Inlet (refer to Appendix B) For all PM testing, twelve sample points in the Biomass Boiler Stack Outlet (refer to Appendix B) For opacity, one sample visual observation point from the exit of the exhaust duct to the atmosphere from the Biomass Boiler Stack Outlet Pollutants Measured NOx CO SO 2 HCl Dates of Emission Test July 2-4, KEY PERSONNEL PM Opacity CO 2 O 2 Fibrominn, LLC: Chuck Wagoner MPCA: Steven Gorg CiSCO: Brad Shibata SNC: Victor Myers Air Hygiene: Thomas Graham SUMMARY OF TEST RESULTS Results from the sampling conducted on Fibrominn, LLC s Biomass Boiler Stack Outlet and Spray Dryer Absorber Inlet located at the Fibrominn Biomass Power Plant on July 2-4, 2007 are summarized in the following tables. TABLE 1.1 BIOMASS BOILER, UNIT #1 SDA INLET DATA SUmmARY Parameter High Load, Run - In-1 High Load, Run - In-2 High Load, Run - In-3 Average Date (mm/dd/yy) 07/03/07 07/03/07 07/03/07 07/03/07 -- Start Time (hh:mm:ss) 17:58:14 19:40:14 21:39:14 17:58:14 -- End Time (hh:mm:ss) 18:57:44 20:39:44 22:38:44 22:38:44 -- Run Duration (min) Bar. Pressure (in. Hg) Amb. Temp. ( F) Rel. Humidity (%) Spec. Humidity (lb water / lb air) SO₂ (ppmvd) SO₂ GeoAvg (ppmvd) HCl (ppm) O₂ (%) Permit Limits snc-07-benson.mn-comp#1-rpt 2
7 TABLE 1.2 BIOMASS BOILER, UNIT #1 STACK OUTLET DATA SUmmARY Parameter High Load, Run - Out-1 High Load, Run - Out-2 High Load, Run - Out-3 Average Permit Limits Date (mm/dd/yy) 07/03/07 07/03/07 07/03/07 07/03/07 -- Start Time (hh:mm:ss) 17:58:14 19:40:14 21:39:14 17:58:14 -- End Time (hh:mm:ss) 18:57:44 20:39:44 22:38:44 22:38:44 -- Run Duration (min) Bar. Pressure (in. Hg) Amb. Temp. ( F) Rel. Humidity (%) Spec. Humidity (lb water / lb air) Stack Flow (M2) (SCFH) 10,257,198 9,847,715 10,305,362 10,136, Stack Moisture (% Method 4) Heat Input (MMBtu/hr) Gross Power Output (gross MW) Steam Rate (lb/hr) 487, , , , Biomass Flow (TPH) Urea Injection (gal/hr) Feedwater Flow (lb/hr) 496, , , , Secondary Air Flow (lb/hr) 354, , , , Primary Air Flow (lb/hr) 249, , , , Dist. Air Flow (lb/hr) 70, , , , SDA Slurry Flow (GPM) SDA Quench Flow (GPM) Sootblower Flow (lb/hr) 4, , , , SH Steam Temp ( F) SH Steam Pres. (psi) 1, , , , NOx (ppmvd) NOx (ppm@7%o₂) NOx (lb/hr) NOx (ton/year) at 8760 hr/year NOx (lb/mmbtu) CO (ppmvd) CO (ppm@7%o₂) CO (lb/hr) CO (ton/year) at 8760 hr/year CO (lb/mmbtu) SO₂ (ppmvd) SO₂ (ppm@7%o₂) SO₂ (lb/hr) SO₂ (ton/year) at 8760 hr/year SO₂ (lb/mmbtu) SO₂ (% reduction) SO₂ GeoAvg (ppmvd) SO₂ GeoAvg (ppm@7%o₂) SO₂ GeoAvg (lb/hr) SO₂ GeoAvg (ton/year) at 8760 hr/year SO₂ GeoAvg (lb/mmbtu) SO₂ GeoAvg (% reduction) HCl (ppm) HCl (ppm@7%o₂) HCl (lb/hr) HCl (ton/year) at 8760 hr/year HCl (lb/mmbtu) HCl (% reduction) Maximum Opacity (%) CO₂ (%) O₂ (%) snc-07-benson.mn-comp#1-rpt 3
8 TABLE 1.3 BIOMASS BOILER, UNIT #1 STACK OUTLET PM DATA SUmmARY Parameter High Load, Run High Load, Run High Load, Run Average Permit Limits Date (mm/dd/yy) 07/03/07 07/04/07 07/04/07 07/03/07 -- Start Time (hh:mm:ss) 23:42 02:44 05:27 23:42 -- End Time (hh:mm:ss) 02:38 05:22 07:58 07:58 -- Sample Time (min) Bar. Pressure (in. Hg) Gross Power Output (gross MW) Steam Rate (lb/hr) 483, , , , Biomass Flow (TPH) Urea Injection (gal/hr) Feedwater Flow (lb/hr) 499, , , , Secondary Air Flow (lb/hr) 358, , , , Primary Air Flow (lb/hr) 262, , , , Dist. Air Flow (lb/hr) 72,757 73,188 73,838 73, SDA Slurry Flow (GPM) SDA Quench Flow (GPM) Sootblower Flow (lb/hr) 9,746 2,493 9,618 7, SH Steam Temp ( F) SH Steam Pres. (psi) 1,500 1,502 1,502 1, Total PM/PM10 (mg) Total PM/PM10 (g/dscf) 2.24E E E E Total PM/PM10 (gr/dscf) 3.46E E E E Total PM/PM10 (kg/hr) Total PM/PM10 (lb/hr) Total PM/PM10 (ton/year) at 8760 hr/year Total PM/PM10 (lb/mmbtu) Front Half PM (mg) Front Half PM (g/dscf) 1.97E E E E Front Half PM (gr/dscf) 3.04E E E E Front Half PM (kg/hr) Front Half PM (lb/hr) Front Half PM (ton/year) at 8760 hr/year Front Half PM (lb/mmbtu) Back Half PM10 (mg) Back Half PM10 (g/dscf) 2.04E E E E Back Half PM10 (gr/dscf) 3.15E E E E Back Half PM10 (kg/hr) Back Half PM10 (lb/hr) Back Half PM10 (ton/year) at 8760 hr/year Back Half PM10 (lb/mmbtu) All measured pollutant concentrations and calculated rates were below the given permit limits with the exception of SO 2 in units of pounds per million British thermal units (lb/mmbtu). Instead, SO 2 passed under a permit limit based on total percent reduction. Also, due to the testing timeframe, based on periods of proper / maximum operation of the source, the third opacity run was performed on the following day, as the sun had set and no light was available for proper opacity readings. All other measurements and calculations were performed as stated and approved in the attached testing protocol (Appendix G) without any real or apparent errors. Unit loads during testing were at or above 90 percent of maximum. snc-07-benson.mn-comp#1-rpt 4
9 3.0 SOURCE OPERATION 3.1 PROCESS DESCRIPTION PowerMinn 9090, LLC (PowerMinn) owns and Fibrominn, LLC (Fibrominn) operates the Fibrominn Biomass Power Plant in Swift County, Benson, Minnesota. The plant consists of one boiler, fueled principally with poultry litter. Vegetative biomass may also be burned. The facility generates a nominal 50 megawatts (MW) of electricity for export and has a peak electrical export capacity of 55 MW with a peak gross electrical generating capacity of 65 MW. Emissions from the boiler are controlled by a spray dryer absorber followed by a fabric filter baghouse to control particulate matter and particulate matter / particulate matter less than 10 microns in diameter (PM/PM 10 ), SO 2, sulfuric acid mist (H 2 SO 4 ), and HCl. Selective non-catalytic reduction (SNCR) is used to control NOx. Good combustion practices are used to control CO and volatile organic compounds (VOCs). 3.2 SAMPLING LOCATION Compliance testing was performed on the unit at the spray dryer absorber (SDA) inlet and the stack outlet. The SDA inlet duct is circular and measures 10.8 feet (ft) (129 inches) in diameter at the test ports which are approximately 120 ft above grade level. The test ports are located approximately ft (1,222 inches) downstream and approximately 29.2 ft (350 inches) upstream from the nearest disturbances. The stack exhaust is circular and measures 9 feet (ft) (108 inches) in diameter at the test ports which are approximately 104 ft above grade level with an exit elevation of approximately 300 ft above grade level. The test ports are located approximately 75.8 ft (910 inches) downstream and approximately ft (2,358 inches) upstream from the nearest disturbances. All samples for NOx, CO, SO 2, CO 2, and O 2 emissions were continuously drawn from the stack exhaust and SDA Inlet (SO 2 and O 2, only) at 12 sample points determined after conducting an initial stratification test (Appendix E). During the stratification test 12 points were traversed from each location. The probe was allowed to remain at each point for two times the systems response time. For PM testing on the stack exhaust, an initial velocity traverse was performed across the stack from 12 total points. All PM sampling occurred from the same 12 points by leaving the probe at each for an equal amount of time in order to draw at least 100 dry standard cubic feet of gas through the sample train. All HCl testing on the stack exhaust and the SDA inlet occurred from single sampling points near the center of each location, per MPCA proposed variation approval. All opacity observations were made by viewing the point where the exhaust system exited to the atmosphere at the top of the exhaust stack. 4.0 SAMPLING AND ANALYTICAL PROCEDURES 4.1 TEST METHODS The emission test on the Biomass Boiler Stack Outlet and Spray Dryer Absorber Inlet at the Fibrominn Biomass Power Plant was performed following United States Environmental Protection Agency (EPA) methods described by the Code of Federal Regulations (CFR). Table 4.1 outlines the specific methods performed on July 2-4, snc-07-benson.mn-comp#1-rpt 5
10 TABLE 4.1 SUMMARY OF SAMPLING METHODS Pollutant or Parameter Sampling Method Analysis Method Sample Point Location EPA Method 1 Equal Area Method Stack Flow Rate EPA Method 2 S-Type Pitot Tube Oxygen EPA Method 3a Paramagnetic Cell Carbon Dioxide EPA Method 3a Nondispersive Infrared Analyzer Stack Moisture Content EPA Method 4 Gravimetric Analysis Particulate Matter EPA Method 5 Front Half Filterables Sulfur Dioxide EPA Method 6c Ultraviolet Nitrogen Oxides EPA Method 7e Chemiluminescent Analyzer Opacity EPA Method 9 Visual Observation Carbon Monoxide EPA Method 10 Nondispersive Infrared Analyzer Fuel Based F-Factor EPA Method 19 CO 2 Based F Factor Hydrochloric Acid EPA Method 26a Chemiluminescent Analyzer Particulate Matter EPA Method 202 Back Half Condensables 4.2 INSTRUMENT CONFIGURATION AND OPERATIONS FOR GAS ANALYSIS The sampling and analysis procedures used during these tests conform with the methods outlined in the Code of Federal Regulations (CFR), Title 40, Part 60, Appendix A, Methods 1, 2, 3a, 4, 5, 6c, 7e, 9, 10, 19, 26a, and 40 CFR 51, Appendix M, 202. Figure 4.1 depicts the sample system used for the NOx, CO, SO 2, CO 2, and O 2 tests. An identical system was used to monitor SO 2 and O 2 at the SDA inlet. A heated stainless steel probe was inserted into the sample ports of the stack exhaust and the SDA inlet to extract gas measurements from the emission stream at twelve points in the stacks determined after conducting an initial stratification test. The gas sample was continuously pulled through the probe and transported via heat-traced Teflon tubing to a stainless steel minimum-contact condenser designed to dry the sample and through Teflon tubing via a stainless steel/teflon diaphragm pump and into the sample manifold within the mobile laboratory. From the manifold, the sample was partitioned to the NOx, CO, SO 2, CO 2, and O 2 analyzers through rotameters that controlled the flow rate of the sample. Figure 4.1 shows that the sample systems were also equipped with a separate path through which a calibration gas could be delivered to the probe and back through the entire sampling systems. This allowed for convenient performance of system bias checks as required by the testing methods. snc-07-benson.mn-comp#1-rpt 6
11 All instruments were housed in an air-conditioned trailer-mounted mobile laboratory. Gaseous calibration standards were provided in aluminum cylinders with the concentrations certified by the vendor. EPA Protocol No. 1 was used to determine the cylinder concentrations where applicable (i.e. NOx calibration gases). Table 4.2 provides a description of the analyzers used for the instrument portion of the tests. All data from the continuous monitoring instruments were recorded on a Logic Beach Portable Data Logging System Hyperlogger which retrieves calibrated electronic data from each instrument every one second and reports an average of the collected data every 30 seconds. Data records can be found in Appendix A and B of this report. Figure 4.2 represent the sample system used for the PM tests. A heated stainless steel probe with an inconel liner and stainless steel nozzle was inserted into the sample ports of the stack to extract gas measurements from the emission stream through a filter and glass impinger train. Flow rates are monitored with oil filled manometers and total sample volumes are measured with a dry gas meter. An identical system was utilized for the HCl testing, however the nozzle and liner were glass and the impinger contents were changed to reflect the requirements of the reference method. Three test runs of approximately 60 minutes each were conducted on the Biomass Boiler Stack Outlet and Spray Dryer Absorber Inlet at the maximum test load simultaneously for NOx, CO, SO 2, HCl, opacity, CO 2, and O 2 on the stack exhaust and SO 2, HCl, and O 2 on the SDA inlet. Three test runs pulling at least 100 dry standard cubic feet of sample were run at at the maximum test load for the PM testing at the stack exhaust. The stack gas analysis for O 2 and CO 2 concentrations was performed in accordance with procedures set forth in EPA Method 3a. The O 2 analyzer uses a paramagnetic cell detector and the CO 2 analyzer uses a continuous nondispersive infrared analyzer. EPA Method 6c was used to determine the concentrations of SO 2. An ultraviolet analyzer was used to determine the sulfur dioxide concentrations in the gas stream. EPA Method 7e was used to determine concentrations of NOx. A chemiluminescence analyzer was used to determine the nitrogen oxides concentration in the gas stream. A NO 2 in nitrogen certified gas cylinder was used to verify at least a 90 percent NO 2 conversion on the day of the test. CO emission concentrations were quantified in accordance with procedures set forth in EPA Method 10. A continuous nondispersive infrared (NDIR) analyzer was used for this purpose. snc-07-benson.mn-comp#1-rpt 7
12 TABLE 4.2 ANALYTICAL INSTRUMENTATION Parameter Model & Manufacturer Max. Ranges Sensitivity Detection Principle NOx CO CO 2 SO 2 O 2 Outlet: THERMO 42C Outlet: THERMO 48C Outlet: SERV 1440 Outlet: THERMO 43C Inlet: Ametek 721M Outlet: SERV 1400 Inlet: M&C PMA 22 User may select up to 5,000 ppm User may select up to 3,000 ppm 0.1 ppm 0.1 ppm Thermal reduction of NO 2 to NO Chemiluminescence of reaction of NO with O 3. Detection by PMT. Inherently linear for listed ranges. Infrared absorption, gas filter correlation detector, microprocessor based linearization. 0-20% 0.1% Nondispersive infrared User may select up to 10,000 ppm 0-25% 0.1% 0.1 ppm Ultraviolet Paramagnetic cell, inherently linear. snc-07-benson.mn-comp#1-rpt 8
13 ##.## ##.## ##.## ##.## ##.## ##.## E:\SHARED\DRAWINGS\ETL SCHEMATIC.PPT 09/17/02 DRAWING: TKG COPYRIGHT 2002 AIR HYGIENE INTERNATIONAL, INC. CO 2 ANALYZER STACK flow bias line THC cal line to vent to NOx to CO to CO 2 /O 2 MANIFOLD CO ANALYZER O 2 ANALYZER HYPER- LOGGER DATA RECORDER NOx ANALYZER heated sample line to THC THC ANALYZER GAS CONDITIONER SO 2 ANALYZER (optional) calibration/bias line VENT CALIBRATION/BIAS GAS BOTTLES Figure 4.1 EMISSIONS TESTING LAB 5634 S. 122 nd East Ave, Suite F Tulsa, Oklahoma (888)
14 E:\SHARED\DRAWINGS\SAMPLING TRAIN GEN3.PPT 02/11/04 DRAWING: TKG View of Probe End (from the bottom) Nozzle Temperature Sensor Temperature Sensor Probe Type S Pitot Tube Stack Wall Liner (glass, stainless steel, or inconel) Probe Housing (heated opt.) Temperature Sensor Impingers COPYRIGHT 2004 AIR HYGIENE INTERNATIONAL, INC. could add more impingers or other components to system Wet Chemistry Assembly (photo) Temperature Sensor Type S Pitot Tube Glass Filter Holder Ice Water Bath Vacuum Line Orifice Temperature Sensor Oil-Filler Manometer Temperature Sensor Hot Box Heated Area Filled with water or other various chemicals to cause capture of condensed liquid or reaction with target compounds Cold Box Vacuum Gauge By-pass Valve Main Valve Dry Gas Meter Figure 4.2 WET CHEMISTRY ASSEMBLY Oil-Filler Manometer Air-Tight Pump 5634 S. 122 nd East Ave, Suite F Tulsa, Oklahoma (888)
15 APPENDIX A TEST RESULTS AND CALCULATIONS
16 TABLE A.1: EMISSIONS TESTING SCHEDULE Unit Load Test Type Run Date Start Stop Time Sync 1 High Stratification Test 1 07/02/07 07:10 07:49 DAHS 1 High Gases 1 07/03/07 17:58 18:57 DAHS 1 High Gases 2 07/03/07 19:40 20:39 DAHS 1 High Gases 3 07/03/07 21:39 22:38 DAHS 1 High HCl 1 07/03/07 17:58 18:57 DAHS 1 High HCl 2 07/03/07 19:40 20:39 DAHS 1 High HCl 3 07/03/07 21:39 22:38 DAHS 1 High PM 1 07/03/07 23:42 02:38 DAHS 1 High PM 2 07/04/07 02:44 05:22 DAHS 1 High PM 3 07/04/07 05:27 07:58 DAHS 1 High Opacity 1 07/03/07 17:58 18:57 DAHS 1 High Opacity 2 07/03/07 19:40 20:39 DAHS 1 High Opacity 3 07/04/07 14:52 15:52 DAHS Note: DAHS Time (CST) snc-07-benson.mn-comp#1-gases
17 TEST RESULTS AND CALCULATIONS NOx, CO, SO 2, CO 2, and O 2 Emissions Data
18 Fuel Data Weather Data Fuel F c factor 1,890 SCF/MMBtu Barometric Pressure in. Hg Fuel Heating Value (HHV) 4,334 Btu/lb Relative Humidity 71 % Ambient Temperature 81 o F Specific Humidity lb H 2 O / lb air Unit Data Gross Unit Load 61.3 gross MW Heat Input 784 MMBtu/hr Steam Rate 487,155 Steam lb/hr Meas. Stack Moisture 25.7 % Stack Exhaust Flow (M2) 10,257,198 SCFH Fibrominn, LLC July 3, 2007 Biomass Boiler, Unit #Outlet Fibrominn Biomass Power Plant High Load, Run - Out-1 Date/Time Elapsed Time O 2 NOx CO CO 2 SO 2 (mm/dd/yy hh:mm:ss) (seconds) (%) (ppmvd) (ppmvd) (%) (ppmvd) 07/03/07 17:58: /03/07 17:58: /03/07 17:59: /03/07 17:59: /03/07 18:00: /03/07 18:00: /03/07 18:01: /03/07 18:01: /03/07 18:02: /03/07 18:02: /03/07 18:03: /03/07 18:03: /03/07 18:04: /03/07 18:04: /03/07 18:05: /03/07 18:05: /03/07 18:06: /03/07 18:06: /03/07 18:07: /03/07 18:07: /03/07 18:08: , /03/07 18:08: /03/07 18:09: /03/07 18:09: /03/07 18:10: /03/07 18:10: /03/07 18:11: /03/07 18:11: /03/07 18:12: /03/07 18:12: /03/07 18:13: /03/07 18:13: /03/07 18:14: /03/07 18:14: /03/07 18:15: /03/07 18:15: /03/07 18:16: /03/07 18:16: /03/07 18:17: /03/07 18:17: /03/07 18:18: , /03/07 18:18: /03/07 18:19: /03/07 18:19: /03/07 18:20: /03/07 18:20: /03/07 18:21: /03/07 18:21: /03/07 18:22: /03/07 18:22: /03/07 18:23: snc-07-benson.mn-comp#1-gases App. B
19 Fuel Data Weather Data Fuel F c factor 1,890 SCF/MMBtu Barometric Pressure in. Hg Fuel Heating Value (HHV) 4,334 Btu/lb Relative Humidity 71 % Ambient Temperature 81 o F Specific Humidity lb H 2 O / lb air Unit Data Gross Unit Load 61.3 gross MW Heat Input 784 MMBtu/hr Steam Rate 487,155 Steam lb/hr Meas. Stack Moisture 25.7 % Stack Exhaust Flow (M2) 10,257,198 SCFH Fibrominn, LLC July 3, 2007 Biomass Boiler, Unit #Outlet Fibrominn Biomass Power Plant High Load, Run - Out-1 Date/Time Elapsed Time O 2 NOx CO CO 2 SO 2 (mm/dd/yy hh:mm:ss) (seconds) (%) (ppmvd) (ppmvd) (%) (ppmvd) 07/03/07 18:23: /03/07 18:24: /03/07 18:24: /03/07 18:25: /03/07 18:25: /03/07 18:26: /03/07 18:26: /03/07 18:27: /03/07 18:27: /03/07 18:28: /03/07 18:28: /03/07 18:29: /03/07 18:29: /03/07 18:30: /03/07 18:30: /03/07 18:31: /03/07 18:31: /03/07 18:32: /03/07 18:32: , /03/07 18:33: , /03/07 18:33: , /03/07 18:34: /03/07 18:34: /03/07 18:35: /03/07 18:35: /03/07 18:36: /03/07 18:36: /03/07 18:37: /03/07 18:37: /03/07 18:38: /03/07 18:38: /03/07 18:39: /03/07 18:39: /03/07 18:40: /03/07 18:40: /03/07 18:41: /03/07 18:41: /03/07 18:42: /03/07 18:42: /03/07 18:43: /03/07 18:43: /03/07 18:44: /03/07 18:44: /03/07 18:45: /03/07 18:45: /03/07 18:46: /03/07 18:46: /03/07 18:47: /03/07 18:47: /03/07 18:48: /03/07 18:48: snc-07-benson.mn-comp#1-gases App. B
20 Fuel Data Weather Data Fuel F c factor 1,890 SCF/MMBtu Barometric Pressure in. Hg Fuel Heating Value (HHV) 4,334 Btu/lb Relative Humidity 71 % Ambient Temperature 81 o F Specific Humidity lb H 2 O / lb air Unit Data Gross Unit Load 61.3 gross MW Heat Input 784 MMBtu/hr Steam Rate 487,155 Steam lb/hr Meas. Stack Moisture 25.7 % Stack Exhaust Flow (M2) 10,257,198 SCFH Fibrominn, LLC July 3, 2007 Biomass Boiler, Unit #Outlet Fibrominn Biomass Power Plant High Load, Run - Out-1 Date/Time Elapsed Time O 2 NOx CO CO 2 SO 2 (mm/dd/yy hh:mm:ss) (seconds) (%) (ppmvd) (ppmvd) (%) (ppmvd) 07/03/07 18:49: /03/07 18:49: /03/07 18:50: /03/07 18:50: /03/07 18:51: /03/07 18:51: /03/07 18:52: /03/07 18:52: /03/07 18:53: /03/07 18:53: /03/07 18:54: /03/07 18:54: /03/07 18:55: /03/07 18:55: /03/07 18:56: /03/07 18:56: /03/07 18:57: /03/07 18:57: RAW AVERAGE Bias O 2 NOx CO CO 2 SO 2 Serial Number: INST INST-NX-0012 INST-CO-0001 INST INST-S (%) (ppmvd) (ppmvd) (%) (ppmvd) Initial Zero Final Zero Avg. Zero Initial UpScale Calcs by Final UpScale Geo Mean Avg. UpScale SO 2 avg Upscale Cal Gas CO 2 avg EMISSIONS DATA Corrected Raw Average (ppm/% dry basis) Concentration (ppm@ 7%O₂) Emission Rate (lb/hr) Emission Rate (tons/year) at 8760 hr/yr Emission Rate (lb/mmbtu) O 2 NOx CO CO 2 SO 2 SO 2 GEO N/A N/A N/A N/A N/A N/A N/A N/A snc-07-benson.mn-comp#1-gases App. B
21 Fuel Data Weather Data Fuel F c factor 1,890 SCF/MMBtu Barometric Pressure in. Hg Fuel Heating Value (HHV) 4,334 Btu/lb Relative Humidity 72 % Ambient Temperature 78 o F Specific Humidity lb H 2 O / lb air Unit Data Gross Unit Load 61.8 gross MW Heat Input 774 MMBtu/hr Steam Rate 487,320 Steam lb/hr Meas. Stack Moisture 26.0 % Stack Exhaust Flow (M2) 9,847,715 SCFH Fibrominn, LLC July 3, 2007 Biomass Boiler, Unit #Outlet Fibrominn Biomass Power Plant High Load, Run - Out-2 Date/Time Elapsed Time O 2 NOx CO CO 2 SO 2 (mm/dd/yy hh:mm:ss) (seconds) (%) (ppmvd) (ppmvd) (%) (ppmvd) 07/03/07 19:40: , /03/07 19:40: /03/07 19:41: /03/07 19:41: /03/07 19:42: /03/07 19:42: /03/07 19:43: /03/07 19:43: /03/07 19:44: /03/07 19:44: /03/07 19:45: /03/07 19:45: /03/07 19:46: /03/07 19:46: /03/07 19:47: /03/07 19:47: /03/07 19:48: /03/07 19:48: /03/07 19:49: /03/07 19:49: /03/07 19:50: /03/07 19:50: /03/07 19:51: /03/07 19:51: /03/07 19:52: /03/07 19:52: /03/07 19:53: /03/07 19:53: /03/07 19:54: /03/07 19:54: /03/07 19:55: /03/07 19:55: /03/07 19:56: /03/07 19:56: /03/07 19:57: /03/07 19:57: /03/07 19:58: /03/07 19:58: /03/07 19:59: /03/07 19:59: /03/07 20:00: /03/07 20:00: /03/07 20:01: , /03/07 20:01: , /03/07 20:02: /03/07 20:02: /03/07 20:03: /03/07 20:03: /03/07 20:04: /03/07 20:04: /03/07 20:05: snc-07-benson.mn-comp#1-gases App. B
22 Fuel Data Weather Data Fuel F c factor 1,890 SCF/MMBtu Barometric Pressure in. Hg Fuel Heating Value (HHV) 4,334 Btu/lb Relative Humidity 72 % Ambient Temperature 78 o F Specific Humidity lb H 2 O / lb air Unit Data Gross Unit Load 61.8 gross MW Heat Input 774 MMBtu/hr Steam Rate 487,320 Steam lb/hr Meas. Stack Moisture 26.0 % Stack Exhaust Flow (M2) 9,847,715 SCFH Fibrominn, LLC July 3, 2007 Biomass Boiler, Unit #Outlet Fibrominn Biomass Power Plant High Load, Run - Out-2 Date/Time Elapsed Time O 2 NOx CO CO 2 SO 2 (mm/dd/yy hh:mm:ss) (seconds) (%) (ppmvd) (ppmvd) (%) (ppmvd) 07/03/07 20:05: /03/07 20:06: /03/07 20:06: /03/07 20:07: /03/07 20:07: /03/07 20:08: /03/07 20:08: /03/07 20:09: /03/07 20:09: /03/07 20:10: /03/07 20:10: /03/07 20:11: /03/07 20:11: /03/07 20:12: /03/07 20:12: /03/07 20:13: /03/07 20:13: /03/07 20:14: /03/07 20:14: /03/07 20:15: /03/07 20:15: , /03/07 20:16: , /03/07 20:16: /03/07 20:17: /03/07 20:17: /03/07 20:18: /03/07 20:18: /03/07 20:19: /03/07 20:19: /03/07 20:20: /03/07 20:20: /03/07 20:21: /03/07 20:21: /03/07 20:22: /03/07 20:22: /03/07 20:23: /03/07 20:23: /03/07 20:24: /03/07 20:24: /03/07 20:25: /03/07 20:25: /03/07 20:26: /03/07 20:26: /03/07 20:27: /03/07 20:27: /03/07 20:28: /03/07 20:28: /03/07 20:29: /03/07 20:29: /03/07 20:30: /03/07 20:30: snc-07-benson.mn-comp#1-gases App. B
23 Fuel Data Weather Data Fuel F c factor 1,890 SCF/MMBtu Barometric Pressure in. Hg Fuel Heating Value (HHV) 4,334 Btu/lb Relative Humidity 72 % Ambient Temperature 78 o F Specific Humidity lb H 2 O / lb air Unit Data Gross Unit Load 61.8 gross MW Heat Input 774 MMBtu/hr Steam Rate 487,320 Steam lb/hr Meas. Stack Moisture 26.0 % Stack Exhaust Flow (M2) 9,847,715 SCFH Fibrominn, LLC July 3, 2007 Biomass Boiler, Unit #Outlet Fibrominn Biomass Power Plant High Load, Run - Out-2 Date/Time Elapsed Time O 2 NOx CO CO 2 SO 2 (mm/dd/yy hh:mm:ss) (seconds) (%) (ppmvd) (ppmvd) (%) (ppmvd) 07/03/07 20:31: /03/07 20:31: /03/07 20:32: /03/07 20:32: /03/07 20:33: /03/07 20:33: /03/07 20:34: /03/07 20:34: /03/07 20:35: /03/07 20:35: /03/07 20:36: /03/07 20:36: /03/07 20:37: /03/07 20:37: /03/07 20:38: /03/07 20:38: /03/07 20:39: /03/07 20:39: RAW AVERAGE Bias O 2 NOx CO CO 2 SO 2 Serial Number: INST INST-NX-0012 INST-CO-0001 INST INST-S (%) (ppmvd) (ppmvd) (%) (ppmvd) Initial Zero Final Zero Avg. Zero Initial UpScale Calcs by Final UpScale Geo Mean Avg. UpScale SO 2 avg Upscale Cal Gas CO 2 avg EMISSIONS DATA Corrected Raw Average (ppm/% dry basis) Concentration (ppm@ 7%O₂) Emission Rate (lb/hr) Emission Rate (tons/year) at 8760 hr/yr Emission Rate (lb/mmbtu) O 2 NOx CO CO 2 SO 2 SO 2 GEO N/A N/A N/A N/A N/A N/A N/A N/A snc-07-benson.mn-comp#1-gases App. B
24 Fuel Data Weather Data Fuel F c factor 1,890 SCF/MMBtu Barometric Pressure in. Hg Fuel Heating Value (HHV) 4,334 Btu/lb Relative Humidity 71 % Ambient Temperature 77 o F Specific Humidity lb H 2 O / lb air Unit Data Gross Unit Load 62.8 gross MW Heat Input 778 MMBtu/hr Steam Rate 490,767 Steam lb/hr Meas. Stack Moisture 24.9 % Stack Exhaust Flow (M2) 10,305,362 SCFH Fibrominn, LLC July 3, 2007 Biomass Boiler, Unit #Outlet Fibrominn Biomass Power Plant High Load, Run - Out-3 Date/Time Elapsed Time O 2 NOx CO CO 2 SO 2 (mm/dd/yy hh:mm:ss) (seconds) (%) (ppmvd) (ppmvd) (%) (ppmvd) 07/03/07 21:39: /03/07 21:39: /03/07 21:40: /03/07 21:40: /03/07 21:41: /03/07 21:41: /03/07 21:42: /03/07 21:42: , /03/07 21:43: , /03/07 21:43: /03/07 21:44: /03/07 21:44: /03/07 21:45: /03/07 21:45: /03/07 21:46: /03/07 21:46: /03/07 21:47: /03/07 21:47: /03/07 21:48: /03/07 21:48: /03/07 21:49: /03/07 21:49: /03/07 21:50: /03/07 21:50: /03/07 21:51: /03/07 21:51: /03/07 21:52: /03/07 21:52: /03/07 21:53: /03/07 21:53: /03/07 21:54: /03/07 21:54: /03/07 21:55: /03/07 21:55: /03/07 21:56: /03/07 21:56: /03/07 21:57: /03/07 21:57: /03/07 21:58: /03/07 21:58: /03/07 21:59: /03/07 21:59: /03/07 22:00: /03/07 22:00: /03/07 22:01: /03/07 22:01: /03/07 22:02: /03/07 22:02: /03/07 22:03: /03/07 22:03: /03/07 22:04: snc-07-benson.mn-comp#1-gases App. B
25 Fuel Data Weather Data Fuel F c factor 1,890 SCF/MMBtu Barometric Pressure in. Hg Fuel Heating Value (HHV) 4,334 Btu/lb Relative Humidity 71 % Ambient Temperature 77 o F Specific Humidity lb H 2 O / lb air Unit Data Gross Unit Load 62.8 gross MW Heat Input 778 MMBtu/hr Steam Rate 490,767 Steam lb/hr Meas. Stack Moisture 24.9 % Stack Exhaust Flow (M2) 10,305,362 SCFH Fibrominn, LLC July 3, 2007 Biomass Boiler, Unit #Outlet Fibrominn Biomass Power Plant High Load, Run - Out-3 Date/Time Elapsed Time O 2 NOx CO CO 2 SO 2 (mm/dd/yy hh:mm:ss) (seconds) (%) (ppmvd) (ppmvd) (%) (ppmvd) 07/03/07 22:04: /03/07 22:05: /03/07 22:05: /03/07 22:06: /03/07 22:06: /03/07 22:07: /03/07 22:07: /03/07 22:08: /03/07 22:08: /03/07 22:09: /03/07 22:09: /03/07 22:10: /03/07 22:10: /03/07 22:11: /03/07 22:11: /03/07 22:12: /03/07 22:12: /03/07 22:13: /03/07 22:13: /03/07 22:14: /03/07 22:14: /03/07 22:15: /03/07 22:15: /03/07 22:16: /03/07 22:16: /03/07 22:17: /03/07 22:17: /03/07 22:18: /03/07 22:18: /03/07 22:19: /03/07 22:19: /03/07 22:20: /03/07 22:20: /03/07 22:21: /03/07 22:21: /03/07 22:22: /03/07 22:22: /03/07 22:23: /03/07 22:23: /03/07 22:24: /03/07 22:24: /03/07 22:25: /03/07 22:25: /03/07 22:26: /03/07 22:26: /03/07 22:27: /03/07 22:27: /03/07 22:28: /03/07 22:28: /03/07 22:29: /03/07 22:29: snc-07-benson.mn-comp#1-gases App. B
26 Fuel Data Weather Data Fuel F c factor 1,890 SCF/MMBtu Barometric Pressure in. Hg Fuel Heating Value (HHV) 4,334 Btu/lb Relative Humidity 71 % Ambient Temperature 77 o F Specific Humidity lb H 2 O / lb air Unit Data Gross Unit Load 62.8 gross MW Heat Input 778 MMBtu/hr Steam Rate 490,767 Steam lb/hr Meas. Stack Moisture 24.9 % Stack Exhaust Flow (M2) 10,305,362 SCFH Fibrominn, LLC July 3, 2007 Biomass Boiler, Unit #Outlet Fibrominn Biomass Power Plant High Load, Run - Out-3 Date/Time Elapsed Time O 2 NOx CO CO 2 SO 2 (mm/dd/yy hh:mm:ss) (seconds) (%) (ppmvd) (ppmvd) (%) (ppmvd) 07/03/07 22:30: /03/07 22:30: /03/07 22:31: /03/07 22:31: /03/07 22:32: /03/07 22:32: /03/07 22:33: /03/07 22:33: /03/07 22:34: /03/07 22:34: /03/07 22:35: /03/07 22:35: /03/07 22:36: /03/07 22:36: /03/07 22:37: /03/07 22:37: /03/07 22:38: /03/07 22:38: RAW AVERAGE Bias O 2 NOx CO CO 2 SO 2 Serial Number: INST INST-NX-0012 INST-CO-0001 INST INST-S (%) (ppmvd) (ppmvd) (%) (ppmvd) Initial Zero Final Zero Avg. Zero Initial UpScale Calcs by Final UpScale Geo Mean Avg. UpScale SO 2 avg Upscale Cal Gas CO 2 avg EMISSIONS DATA Corrected Raw Average (ppm/% dry basis) Concentration (ppm@ 7%O₂) Emission Rate (lb/hr) Emission Rate (tons/year) at 8760 hr/yr Emission Rate (lb/mmbtu) O 2 NOx CO CO 2 SO 2 SO 2 GEO N/A N/A N/A N/A N/A N/A N/A N/A snc-07-benson.mn-comp#1-gases App. B
27 EXAMPLE CALCULATIONS (INFORMATION) Specific Humidity (RH sp ) RH sp lb 7000 gr gr lb ( lb / lb) = Note: RHsp (gr/lb) calculated using temperature, relative humidity, and barometric pressure with psychrometric chart, psychrometric calculator, or built in psychrometric algorithm gr l lb lb H 2 O RH sp = x = lb 7000 gr lb Air EXAMPLE CALCULATIONS (CALIBRATION) Analyzer Calibration Error RM 7E, ( ), 12.2 Analyzer Calibration Error. For non-dilution systems, use Equation 7E-1 to calculate the analyzer calibration error for the low-, mid-, and high-level calibration gases. (calc for NOx analyzer mid gas, if applicable) ACE C = C CS Dir V 100 Eq. 7E-1 ACE = ppm ppm ppm x 100 = % EXAMPLE CALCULATIONS (BIAS, DRIFT, AND CORRECTED RAW AVERAGE) System Bias RM 7E, ( ), 12.3 System Bias. For non-dilution systems, use Equation 7E-2 to calculate the system bias separately for the low-level and upscale calibration gases. (calc for NOx analyzer upscale gas, Run 1 initial bias, if applicable) SB = C S C CS Dir 100 Eq. 7E-2 SB = ppm ppm ppm x 100 = % Drift Assessment RM 7E, ( ), 12.5 Drift Assessment. Use Equation 7E-4 to separately calculate the low-level and upscale drift over each test run. (calc for NOx analyzer upscale drift, Run 1, if applicable) D = SB final SB i Eq. 7E-4 D = % % = 0.72 % Alternative Drift and Bias RM 7E, ( ), 13.2 / 13.3 System Bias and Drift. Alternatively, the results are acceptable if Cs Cdir is 0.5 ppmv or if Cs Cv is 0.5 ppmv (as applicable). (calc for NOx analyzer initial upscale, Run 1, if applicable) SB / D Alt = C S C Dir Eq. Section 13.2 and 13.3 SB / D Alt = ppm ppm = 4.12 ppm Bias Adjusted Average RM 7E, ( ), 12.6 Effluent Gas Concentration. For each test run, calculate Cavg, the arithmetic average of all valid NOx concentration values (e.g., 1-minute averages). Then adjust the value of Cavg for bias, using Equation 7E-5. (calc for NOx analyzer, Run 1, if applicable) C Gas = C MA ( C ) Avg C O C M C O Eq. 7E-5 C Gas = ppm ppm x ppm ppm ppm = ppm Note: Lack of significant figures may cause rounding errors between actual calculations and example calculations. snc-07-benson.mn-comp#1-gases App. A
28 EXAMPLE CALCULATIONS (RUNS) Moisture Correction RM 7E, ( ), RM7E, ( ), Moisture Correction. Use Equation 7E-10 if your measurements need to be corrected to a dry basis. (calc for NOx analyzer, Run 1, if applicable) Note: Calculations may not match as Run 1 results are typically also bias adjusted C = C 1 B C D CW = 1 B WS ppmvw Eq. 7E-10 C D = = ppmvd or inversely, C W = ppmvd x = ppmvw W D ( ) WS Diluent-Corrected Polutant Concentration, O 2 Based RM 20, ( ), Correction of Pollutant Concentration Using O2 Concentration. Calculate the O2 corrected pollutant concentration, as follows: (calc for NOx gas, Run 1, if applicable) C adj = C Gas ( T arg et ) 20.9% 20.9% AdjFactor C Gas ( O 2) Eq C adj = 20.9% % ppm x = ppm@7%o₂ 20.9% % EXAMPLE CALCULATIONS (RUNS) Emissions Rate (lb/hr) Calculation for pound per hour emission rate. Calculate, as follows: (calc for NOx gas Run 1, if applicable) E lb / hr C Gas = 6 10 Q S MW G ppm E lb/hr = ppm/part x 10,257,198 SCFH x lb/lb-mol SCF/lb-mol = hr lb Emissions Rate (ton/year) Calculation for tons per year emission rate based on 8760 hours per year. Calculate, as follows: (calc for NOx gas Run 1, if applicable) E ton / yr E = lb / hr hr 2000 year E ton/yr = lb 8,760 hr ton ton x x = hr year 2000 lb year Emissions Rate (lb/mmbtu) RM 19, ( ), 12.2 Emission Rates of PM, SO2, and NOx. Select from the following sections the applicable procedure to compute the PM, SO2, or NOx emission rate (E) in ng/j (lb/million Btu). (calc for NOx gas Run 1, if applicable) Carbon Dioxide Based Carbon Dioxide-Based F Factor, Dry Basis. When measurements are on a dry basis for both CO 2 (%CO 2 d) and pollutant (Cd) concentrations, use the following equation: E lb / MMBtu C = Gas F Factor Conv c C Gas( CO2) C 100% Eq ppm x 1, SCF/MMBtu x lb/ppm*ft 3 x 100% lb E lb/mmbtu = = % MMBtu Conversion Constant Convc for NOx Conv c = MW 3 ( lb / ppm ft ) G 6 10 Conv c = lb lb mole x 10 6 lb mole SCF lb = ppm-ft 3 Note: Lack of significant figures may cause rounding errors between actual calculations and example calculations. snc-07-benson.mn-comp#1-gases App. A
29 RM 7E, ( ), 12.1 Nomenclature. The terms used in the equations are defined as follows: ACE = Analyzer calibration error, percent of calibration span. B WS = Moisture content of sample gas as measured by Method 4 or other approved method, percent/100. C Avg = Average unadjusted gas concentration indicated by data recorder for the test run. C D = Pollutant concentration adjusted to dry conditions. C Dir = Measured concentration of a calibration gas (low, mid, or high) when introduced in direct calibration mode. C Gas = Average effluent gas concentration adjusted for bias. C M = Average of initial and final system calibration bias (or 2-point system calibration error) check responses for the upscale calibration gas. C MA = Actual concentration of the upscale calibration gas, ppmv. C O = Average of the initial and final system calibration bias (or 2-point system calibration error) check responses from the low-level (or zero) calibration gas. C S = Measured concentration of a calibration gas (low, mid, or high) when introduced in system calibration mode. C SS = Concentration of NOx measured in the spiked sample. C Spike = Concentration of NOx in the undiluted spike gas. C Calc = Calculated concentration of NOx in the spike gas diluted in the sample. C V = Manufacturer certified concentration of a calibration gas (low, mid, or high). C W = Pollutant concentration measured under moist sample conditions, wet basis. CS = Calibration span. D = Drift assessment, percent of calibration span. E p = The predicted response for the low-level and mid-level gases based on a linear response line between the zero and high-level response. Eff NO2 = NO 2 to NO converter efficiency, percent. H = High calibration gas, designator. L = Low calibration gas, designator. M = Mid calibration gas, designator. NOFinal = The average NO concentration observed with the analyzer in the NO mode during the converter efficiency test in Section NOxCorr = The NOx concentration corrected for the converter efficiency. NOxFinal = The final NOx concentration observed during the converter efficiency test in Section NOxPeak = The highest NOx concentration observed during the converter efficiency test in Section Q Spike = Flow rate of spike gas introduced in system calibration mode, L/min. Q Total = Total sample flow rate during the spike test, L/min. R = Spike recovery, percent. SB = System bias, percent of calibration span. SB i = Pre-run system bias, percent of calibration span. SB f = Post-run system bias, percent of calibration span. SB / D Alt = Alternative absolute difference criteria to pass bias and/or drift checks. SCE = System calibration error, percent of calibration span. SCE i = Pre-run system calibration error, percent of calibration span. SCE final = Post-run system calibration error, percent of calibration span. Z = Zero calibration gas, designator. snc-07-benson.mn-comp#1-gases App. A
30 RM 19, ( ), 12.1 Nomenclature. The terms used in the equations are defined as follows: AdjFactor = percent oxygen or carbon dioxide adjustment applied to a target polltant B wa = Moisture fraction of ambient air, percent. Btu = British thermal unit % C = Concentration of carbon from an ultimate analysis of fuel, weight percent. % CO2d,% CO2w = Concentration of carbon dioxide on a dry and wet basis, respectively, percent. CIP / CDP = Combustor inlet pressure / compressor discharge pressure (mm Hg); note, some manufactures reference as PCD. E = Pollutant emission rate, ng/j (lb/million Btu). E a = Average pollutant rate for the specified performance test period, ng/j (lb/million Btu). E ao, E ai = Average pollutant rate of the control device, outlet and inlet, respectively, for the performance test period, ng/j (lb/million Btu). E bi = Pollutant rate from the steam generating unit, ng/j (lb/million Btu). E bo = Pollutant emission rate from the steam generating unit, ng/j (lb/million Btu). E ci = Pollutant rate in combined effluent, ng/j (lb/million Btu). E co = Pollutant emission rate in combined effluent, ng/j (lb/million Btu). E d = Average pollutant rate for each sampling period (e.g.,24-hr Method 6B sample or 24-hr fuel sample) or for each fuel lot (e.g., amount of fuel bunkered), ng/j (lb/million Btu). E di = Average inlet SO 2 rate for each sampling period d, ng/j (lb/million Btu). E g = Pollutant rate from gas turbine, ng/j (lb/million Btu). E ga = Daily geometric average pollutant rate, ng/j (lbs/million Btu) or ppm corrected to 7 percent O 2. E jo,e ji = Matched pair hourly arithmetic average pollutant rate, outlet and inlet, respectively, ng/j (lb/million Btu) or ppm corrected to 7 percent O 2. E h = Hourly average pollutant, ng/j (lb/million Btu). E hj = Hourly arithmetic average pollutant rate for hour "j," ng/j (lb/million Btu) or ppm corrected to 7 percent O 2. EXP = Natural logarithmic base (2.718) raised to the value enclosed by brackets. Fc = Ratio of the volume of carbon dioxide produced to the gross calorific value of the fuel from Method 19 F d, F w, F c = Volumes of combustion components per unit of heat content, scm/j (scf/million Btu). ft 3 = cubic feet G = ideal gas conversion factor ( SCF/lb-mol at 68 deg F & psia) GCM = gross Btu per SCF (constant, compound based) GCV = Gross calorific value of the fuel consistent with the ultimate analysis, kj/kg (Btu/lb). GCV p, GCV r = Gross calorific value for the product and raw fuel lots, respectively, dry basis, kj/kg (Btu/lb). % H = Concentration of hydrogen from an ultimate analysis of fuel, weight percent. H b = Heat input rate to the steam generating unit from fuels fired in the steam generating unit, J/hr (million Btu/hr). H g = Heat input rate to gas turbine from all fuels fired in the gas turbine, J/hr (million Btu/hr). % H2O = Concentration of water from an ultimate analysis of fuel, weight percent. H r = Total numbers of hours in the performance test period (e.g., 720 hours for 30-day performance test period). K = volume of combustion component per pound of component (constant) K = Conversion factor, 10 5 (kj/j)/(%) [10 6 Btu/million Btu]. K c = (9.57 scm/kg)/% [(1.53 scf/lb)/%]. K cc = (2.0 scm/kg)/% [(0.321 scf/lb)/%]. K hd = (22.7 scm/kg)/% [(3.64 scf/lb)/%]. K hw = (34.74 scm/kg)/% [(5.57 scf/lb)/%]. K n = (0.86 scm/kg)/% [(0.14 scf/lb)/%]. K o = (2.85 scm/kg)/% [(0.46 scf/lb)/%]. K s = (3.54 scm/kg)/% [(0.57 scf/lb)/%]. K sulfur = 2x10 4 Btu/wt%-MMBtu K w = (1.30 scm/kg)/% [(0.21 scf/lb)/%]. lb = pound ln = Natural log of indicated value. L p,l r = Weight of the product and raw fuel lots, respectively, metric ton (ton). % N = Concentration of nitrogen from an ultimate analysis of fuel, weight percent. M % = mole percent mol = mole MW = molecular weight (lb/lb-mol) MW AIR = molecular weight of air ( lb/lb-mole) 1 NCM = net Btu per SCF (constant based on compound) % O = Concentration of oxygen from an ultimate analysis of fuel, weight percent. % O2d, % O2w = Concentration of oxygen on a dry and wet basis, respectively, percent. P B = barometirc pressure, in Hg P s = Potential SO2 emissions, percent. % S = Sulfur content of as-fired fuel lot, dry basis, weight percent. S e = Standard deviation of the hourly average pollutant rates for each performance test period, ng/j (lb/million Btu). % Sf = Concentration of sulfur from an ultimate analysis of fuel, weight percent. S(wt%) = weight percent of sulfur, per lab analysis by appropriate ASTM standard S i = Standard deviation of the hourly average inlet pollutant rates for each performance test period, ng/j (lb/million Btu). S o = Standard deviation of the hourly average emission rates for each performance test period, ng/j (lb/million Btu). %S p, %S r = Sulfur content of the product and raw fuel lots respectively, dry basis, weight percent. SCF = standard cubic feet SH = specific humidity, pounds of water per pound of air t 0.95 = Values shown in Table 19-3 for the indicated number of data points n. T amb = ambient temperature, o F W/D Factor = = conv. at psia and 68 deg F (ref. Civil Eng. Ref. Manual, 7th Ed.) X CO2 =CO 2 Correction factor, percent. X k = Fraction of total heat input from each type of fuel k. snc-07-benson.mn-comp#1-gases App. A
31 The following information supports the spreadsheets for this testing project. Given Data: Ideal Gas Conversion Factor = SCF/lb-mol at 68 deg F & psia Fuel Heating Value is based upon Air Hygiene's fuel gas calculation sheet. All calculations are based upon a correction to 68 deg F & psia High Heating Values (HHV) are used for the Fuel Heating Value, F-Factor, and Fuel Flow Data per EPA requirements. ASTM D CFR60, App. A., RM 19, Table 19-1 Molecular Weight of NOx (lb/lb-mole) = Conversion Constant for NOx = Molecular Weight of CO (lb/lb-mole) = Conversion Constant for CO = Molecular Weight of SO2 (lb/lb-mole) = Conversion Constant for SO2 = Molecular Weight of THC (propane) (lb/lb-mole) = Conversion Constant for THC = Molecular Weight of VOC (methane) (lb/lb-mole) = Conversion Constant for VOC (methane) = Molecular Weight of NH3 (lb/lb-mole) = Conversion Constant for NH 3 = Molecular Weight of HCHO (lb/lb-mole) = Conversion Constant for HCHO = NOTE: units are lb/ppm*ft 3 Formulas: 1. Corrected Raw Average (C Gas ), 40CFR60, App. A, RM 7E, Eq. 7E-5 (08/15/06) C Gas = 2. Correction to % O 2, 40CFR60, App. A, RM 20, Eq (11/26/02) C adj = C 3. Emission Rate in lb/hr E Calculations, Formulas, and Constants C MA ( C ) Avg C O C M C O Gas ( T arg et ) C Gas lb / hr = 6 10 Q 20.9% AdjFactor 20.9% C Gas ( O 2) S MW G E lb/ MMBtu E lb / MMBtu 4. Emission Concentration in lb/mmbtu (O 2 based) C = Gas F Factor Conv 20.9% d 20.9% C Gas( O2) 5. Emission Concentration in lb/mmbtu (CO 2 based) C = Gas c C Gas( CO2) C F Factor Conv C 100% snc-07-benson.mn-comp#1-gases App. A
32 Fuel Data Weather Data Fuel F c factor 1,890 SCF/MMBtu Barometric Pressure in. Hg Fuel Heating Value (HHV) 4,334 Btu/lb Relative Humidity 71 % Ambient Temperature 81 o F Specific Humidity lb H 2 O / lb air Unit Data Gross Unit Load 61.3 gross MW Heat Input 784 MMBtu/hr Steam Rate 487,155 Steam lb/hr Meas. Stack Moisture 18.5 % Stack Exhaust Flow (M2) 8,106,276 SCFH Fibrominn, LLC July 3, 2007 Biomass Boiler, Unit #Inlet Fibrominn Biomass Power Plant High Load, Run - In-1 Date/Time Elapsed Time O 2 SO 2 (mm/dd/yy hh:mm:ss) (seconds) (%) (ppmvd) 07/03/07 17:58: /03/07 17:58: /03/07 17:59: /03/07 17:59: /03/07 18:00: /03/07 18:00: /03/07 18:01: /03/07 18:01: /03/07 18:02: /03/07 18:02: /03/07 18:03: /03/07 18:03: /03/07 18:04: /03/07 18:04: /03/07 18:05: /03/07 18:05: /03/07 18:06: /03/07 18:06: /03/07 18:07: /03/07 18:07: /03/07 18:08: /03/07 18:08: /03/07 18:09: /03/07 18:09: /03/07 18:10: /03/07 18:10: /03/07 18:11: /03/07 18:11: /03/07 18:12: /03/07 18:12: /03/07 18:13: /03/07 18:13: /03/07 18:14: /03/07 18:14: /03/07 18:15: /03/07 18:15: /03/07 18:16: /03/07 18:16: /03/07 18:17: /03/07 18:17: /03/07 18:18: /03/07 18:18: /03/07 18:19: /03/07 18:19: /03/07 18:20: /03/07 18:20: /03/07 18:21: /03/07 18:21: /03/07 18:22: /03/07 18:22: /03/07 18:23: snc-07-benson.mn-comp#1-gases App. B
33 Fuel Data Weather Data Fuel F c factor 1,890 SCF/MMBtu Barometric Pressure in. Hg Fuel Heating Value (HHV) 4,334 Btu/lb Relative Humidity 71 % Ambient Temperature 81 o F Specific Humidity lb H 2 O / lb air Unit Data Gross Unit Load 61.3 gross MW Heat Input 784 MMBtu/hr Steam Rate 487,155 Steam lb/hr Meas. Stack Moisture 18.5 % Stack Exhaust Flow (M2) 8,106,276 SCFH Fibrominn, LLC July 3, 2007 Biomass Boiler, Unit #Inlet Fibrominn Biomass Power Plant High Load, Run - In-1 Date/Time Elapsed Time O 2 SO 2 (mm/dd/yy hh:mm:ss) (seconds) (%) (ppmvd) 07/03/07 18:23: /03/07 18:24: /03/07 18:24: /03/07 18:25: /03/07 18:25: /03/07 18:26: /03/07 18:26: /03/07 18:27: /03/07 18:27: /03/07 18:28: /03/07 18:28: /03/07 18:29: /03/07 18:29: /03/07 18:30: /03/07 18:30: /03/07 18:31: /03/07 18:31: /03/07 18:32: /03/07 18:32: /03/07 18:33: /03/07 18:33: /03/07 18:34: /03/07 18:34: /03/07 18:35: /03/07 18:35: /03/07 18:36: /03/07 18:36: /03/07 18:37: /03/07 18:37: /03/07 18:38: /03/07 18:38: /03/07 18:39: /03/07 18:39: /03/07 18:40: /03/07 18:40: /03/07 18:41: /03/07 18:41: /03/07 18:42: /03/07 18:42: /03/07 18:43: /03/07 18:43: /03/07 18:44: /03/07 18:44: /03/07 18:45: /03/07 18:45: /03/07 18:46: /03/07 18:46: /03/07 18:47: /03/07 18:47: /03/07 18:48: /03/07 18:48: snc-07-benson.mn-comp#1-gases App. B
34 Fuel Data Weather Data Fuel F c factor 1,890 SCF/MMBtu Barometric Pressure in. Hg Fuel Heating Value (HHV) 4,334 Btu/lb Relative Humidity 71 % Ambient Temperature 81 o F Specific Humidity lb H 2 O / lb air Unit Data Gross Unit Load 61.3 gross MW Heat Input 784 MMBtu/hr Steam Rate 487,155 Steam lb/hr Meas. Stack Moisture 18.5 % Stack Exhaust Flow (M2) 8,106,276 SCFH Fibrominn, LLC July 3, 2007 Biomass Boiler, Unit #Inlet Fibrominn Biomass Power Plant High Load, Run - In-1 Date/Time Elapsed Time O 2 SO 2 (mm/dd/yy hh:mm:ss) (seconds) (%) (ppmvd) 07/03/07 18:49: /03/07 18:49: /03/07 18:50: /03/07 18:50: /03/07 18:51: /03/07 18:51: /03/07 18:52: /03/07 18:52: /03/07 18:53: /03/07 18:53: /03/07 18:54: /03/07 18:54: /03/07 18:55: /03/07 18:55: /03/07 18:56: /03/07 18:56: /03/07 18:57: Calcs by 07/03/07 18:57: Geo Mean RAW AVERAGE Bias O 2 SO 2 SO 2 Serial Number: INST-O (%) (ppmvd) Initial Zero Final Zero Avg. Zero Initial UpScale Final UpScale Avg. UpScale Upscale Cal Gas EMISSIONS DATA Corrected Raw Average (ppm/% dry basis) O 2 SO 2 SO 2 GEO snc-07-benson.mn-comp#1-gases App. B
35 Fuel Data Weather Data Fuel F c factor 1,890 SCF/MMBtu Barometric Pressure in. Hg Fuel Heating Value (HHV) 4,334 Btu/lb Relative Humidity 72 % Ambient Temperature 78 o F Specific Humidity lb H 2 O / lb air Unit Data Gross Unit Load 61.8 gross MW Heat Input 774 MMBtu/hr Steam Rate 487,320 Steam lb/hr Meas. Stack Moisture 23.0 % Stack Exhaust Flow (M2) 8,438,795 SCFH Fibrominn, LLC July 3, 2007 Biomass Boiler, Unit #Inlet Fibrominn Biomass Power Plant High Load, Run - In-2 Date/Time Elapsed Time O 2 SO 2 (mm/dd/yy hh:mm:ss) (seconds) (%) (ppmvd) 07/03/07 19:40: /03/07 19:40: /03/07 19:41: /03/07 19:41: /03/07 19:42: /03/07 19:42: /03/07 19:43: /03/07 19:43: /03/07 19:44: /03/07 19:44: /03/07 19:45: /03/07 19:45: /03/07 19:46: /03/07 19:46: /03/07 19:47: /03/07 19:47: /03/07 19:48: /03/07 19:48: /03/07 19:49: /03/07 19:49: /03/07 19:50: /03/07 19:50: /03/07 19:51: /03/07 19:51: /03/07 19:52: /03/07 19:52: /03/07 19:53: /03/07 19:53: /03/07 19:54: /03/07 19:54: /03/07 19:55: /03/07 19:55: /03/07 19:56: /03/07 19:56: /03/07 19:57: /03/07 19:57: /03/07 19:58: /03/07 19:58: /03/07 19:59: /03/07 19:59: /03/07 20:00: /03/07 20:00: /03/07 20:01: /03/07 20:01: /03/07 20:02: /03/07 20:02: /03/07 20:03: /03/07 20:03: /03/07 20:04: /03/07 20:04: /03/07 20:05: snc-07-benson.mn-comp#1-gases App. B
36 Fuel Data Weather Data Fuel F c factor 1,890 SCF/MMBtu Barometric Pressure in. Hg Fuel Heating Value (HHV) 4,334 Btu/lb Relative Humidity 72 % Ambient Temperature 78 o F Specific Humidity lb H 2 O / lb air Unit Data Gross Unit Load 61.8 gross MW Heat Input 774 MMBtu/hr Steam Rate 487,320 Steam lb/hr Meas. Stack Moisture 23.0 % Stack Exhaust Flow (M2) 8,438,795 SCFH Fibrominn, LLC July 3, 2007 Biomass Boiler, Unit #Inlet Fibrominn Biomass Power Plant High Load, Run - In-2 Date/Time Elapsed Time O 2 SO 2 (mm/dd/yy hh:mm:ss) (seconds) (%) (ppmvd) 07/03/07 20:05: /03/07 20:06: /03/07 20:06: /03/07 20:07: /03/07 20:07: /03/07 20:08: /03/07 20:08: /03/07 20:09: /03/07 20:09: /03/07 20:10: /03/07 20:10: /03/07 20:11: /03/07 20:11: /03/07 20:12: /03/07 20:12: /03/07 20:13: /03/07 20:13: /03/07 20:14: /03/07 20:14: /03/07 20:15: /03/07 20:15: /03/07 20:16: /03/07 20:16: /03/07 20:17: /03/07 20:17: /03/07 20:18: /03/07 20:18: /03/07 20:19: /03/07 20:19: /03/07 20:20: /03/07 20:20: /03/07 20:21: /03/07 20:21: /03/07 20:22: /03/07 20:22: /03/07 20:23: /03/07 20:23: /03/07 20:24: /03/07 20:24: /03/07 20:25: /03/07 20:25: /03/07 20:26: /03/07 20:26: /03/07 20:27: /03/07 20:27: /03/07 20:28: /03/07 20:28: /03/07 20:29: /03/07 20:29: /03/07 20:30: /03/07 20:30: snc-07-benson.mn-comp#1-gases App. B
37 Fuel Data Weather Data Fuel F c factor 1,890 SCF/MMBtu Barometric Pressure in. Hg Fuel Heating Value (HHV) 4,334 Btu/lb Relative Humidity 72 % Ambient Temperature 78 o F Specific Humidity lb H 2 O / lb air Unit Data Gross Unit Load 61.8 gross MW Heat Input 774 MMBtu/hr Steam Rate 487,320 Steam lb/hr Meas. Stack Moisture 23.0 % Stack Exhaust Flow (M2) 8,438,795 SCFH Fibrominn, LLC July 3, 2007 Biomass Boiler, Unit #Inlet Fibrominn Biomass Power Plant High Load, Run - In-2 Date/Time Elapsed Time O 2 SO 2 (mm/dd/yy hh:mm:ss) (seconds) (%) (ppmvd) 07/03/07 20:31: /03/07 20:31: /03/07 20:32: /03/07 20:32: /03/07 20:33: /03/07 20:33: /03/07 20:34: /03/07 20:34: /03/07 20:35: /03/07 20:35: /03/07 20:36: /03/07 20:36: /03/07 20:37: /03/07 20:37: /03/07 20:38: /03/07 20:38: /03/07 20:39: Calcs by 07/03/07 20:39: Geo Mean RAW AVERAGE Bias O 2 SO 2 SO 2 Serial Number: INST-O (%) (ppmvd) Initial Zero Final Zero Avg. Zero Initial UpScale Final UpScale Avg. UpScale Upscale Cal Gas EMISSIONS DATA Corrected Raw Average (ppm/% dry basis) O 2 SO 2 SO 2 GEO snc-07-benson.mn-comp#1-gases App. B
38 Fuel Data Weather Data Fuel F c factor 1,890 SCF/MMBtu Barometric Pressure in. Hg Fuel Heating Value (HHV) 4,334 Btu/lb Relative Humidity 71 % Ambient Temperature 77 o F Specific Humidity lb H 2 O / lb air Unit Data Gross Unit Load 62.8 gross MW Heat Input 778 MMBtu/hr Steam Rate 490,767 Steam lb/hr Meas. Stack Moisture 9.5 % Stack Exhaust Flow (M2) 10,329,857 SCFH Fibrominn, LLC July 3, 2007 Biomass Boiler, Unit #Inlet Fibrominn Biomass Power Plant High Load, Run - In-3 Date/Time Elapsed Time O 2 SO 2 (mm/dd/yy hh:mm:ss) (seconds) (%) (ppmvd) 07/03/07 21:39: /03/07 21:39: /03/07 21:40: /03/07 21:40: /03/07 21:41: /03/07 21:41: /03/07 21:42: /03/07 21:42: /03/07 21:43: /03/07 21:43: /03/07 21:44: /03/07 21:44: /03/07 21:45: /03/07 21:45: /03/07 21:46: /03/07 21:46: /03/07 21:47: /03/07 21:47: /03/07 21:48: /03/07 21:48: /03/07 21:49: /03/07 21:49: /03/07 21:50: /03/07 21:50: /03/07 21:51: /03/07 21:51: /03/07 21:52: /03/07 21:52: /03/07 21:53: /03/07 21:53: /03/07 21:54: /03/07 21:54: /03/07 21:55: /03/07 21:55: /03/07 21:56: /03/07 21:56: /03/07 21:57: /03/07 21:57: /03/07 21:58: /03/07 21:58: /03/07 21:59: /03/07 21:59: /03/07 22:00: /03/07 22:00: /03/07 22:01: /03/07 22:01: /03/07 22:02: /03/07 22:02: /03/07 22:03: /03/07 22:03: /03/07 22:04: snc-07-benson.mn-comp#1-gases App. B
39 Fuel Data Weather Data Fuel F c factor 1,890 SCF/MMBtu Barometric Pressure in. Hg Fuel Heating Value (HHV) 4,334 Btu/lb Relative Humidity 71 % Ambient Temperature 77 o F Specific Humidity lb H 2 O / lb air Unit Data Gross Unit Load 62.8 gross MW Heat Input 778 MMBtu/hr Steam Rate 490,767 Steam lb/hr Meas. Stack Moisture 9.5 % Stack Exhaust Flow (M2) 10,329,857 SCFH Fibrominn, LLC July 3, 2007 Biomass Boiler, Unit #Inlet Fibrominn Biomass Power Plant High Load, Run - In-3 Date/Time Elapsed Time O 2 SO 2 (mm/dd/yy hh:mm:ss) (seconds) (%) (ppmvd) 07/03/07 22:04: /03/07 22:05: /03/07 22:05: /03/07 22:06: /03/07 22:06: /03/07 22:07: /03/07 22:07: /03/07 22:08: /03/07 22:08: /03/07 22:09: /03/07 22:09: /03/07 22:10: /03/07 22:10: /03/07 22:11: /03/07 22:11: /03/07 22:12: /03/07 22:12: /03/07 22:13: /03/07 22:13: /03/07 22:14: /03/07 22:14: /03/07 22:15: /03/07 22:15: /03/07 22:16: /03/07 22:16: /03/07 22:17: /03/07 22:17: /03/07 22:18: /03/07 22:18: /03/07 22:19: /03/07 22:19: /03/07 22:20: /03/07 22:20: /03/07 22:21: /03/07 22:21: /03/07 22:22: /03/07 22:22: /03/07 22:23: /03/07 22:23: /03/07 22:24: /03/07 22:24: /03/07 22:25: /03/07 22:25: /03/07 22:26: /03/07 22:26: /03/07 22:27: /03/07 22:27: /03/07 22:28: /03/07 22:28: /03/07 22:29: /03/07 22:29: snc-07-benson.mn-comp#1-gases App. B
40 Fuel Data Weather Data Fuel F c factor 1,890 SCF/MMBtu Barometric Pressure in. Hg Fuel Heating Value (HHV) 4,334 Btu/lb Relative Humidity 71 % Ambient Temperature 77 o F Specific Humidity lb H 2 O / lb air Unit Data Gross Unit Load 62.8 gross MW Heat Input 778 MMBtu/hr Steam Rate 490,767 Steam lb/hr Meas. Stack Moisture 9.5 % Stack Exhaust Flow (M2) 10,329,857 SCFH Fibrominn, LLC July 3, 2007 Biomass Boiler, Unit #Inlet Fibrominn Biomass Power Plant High Load, Run - In-3 Date/Time Elapsed Time O 2 SO 2 (mm/dd/yy hh:mm:ss) (seconds) (%) (ppmvd) 07/03/07 22:30: /03/07 22:30: /03/07 22:31: /03/07 22:31: /03/07 22:32: /03/07 22:32: /03/07 22:33: /03/07 22:33: /03/07 22:34: /03/07 22:34: /03/07 22:35: /03/07 22:35: /03/07 22:36: /03/07 22:36: /03/07 22:37: /03/07 22:37: /03/07 22:38: Calcs by 07/03/07 22:38: Geo Mean RAW AVERAGE Bias O 2 SO 2 SO 2 Serial Number: INST-O (%) (ppmvd) Initial Zero Final Zero Avg. Zero Initial UpScale Final UpScale Avg. UpScale Upscale Cal Gas EMISSIONS DATA Corrected Raw Average (ppm/% dry basis) O 2 SO 2 SO 2 GEO snc-07-benson.mn-comp#1-gases App. B
41 TEST RESULTS AND CALCULATIONS HCl Emissions Data
42 HCl ANALYSIS Air Hygiene International, Inc S. 122nd East Ave, Suite F Tulsa, Oklahoma (888) PARAMETER UNITS RUN Sample Number Lab Log Number IN-HCl OUT-HCl1 IN-HCl OUT-HCl2 IN-HCl OUT-HCl3 BLANK Blank OUT-HCl4 Concentration of Sample (S x or B x ) (mg Cl - /L) Sample Volume (V HCl ) (ml) N/A DGM Volume (V m ) dscf (dscf) N/A DGM Volume (V m ) dstdl (L dstd ) N/A Sum of HCl Ion (N) (mg/l) N/A Volume of HCl (V a ) (L) N/A HCl Concentration (C HCl ) (ppmvd) N/A Equations & Constants: Example Using Data from the 1st run DGM Volume (L dstd ) ( V ) ( L ) ( V ) m dstdl dstd = m dscf (V m ) dstdl (L dstd ) = dscf x L/ft 3 = L dstd (V m ) dscf = Volume of gas sample measured by the DGM, corrected to standard conditions. Sum of HCl Ion (mg/l) - modified 40 CFR 60, App A, Eq N ( mg / L) = K S B HCl ( ) x x 16.0 mg mg µg HCl/µg mol mg N (mg/l) = x = L L µg Cl - /µg mol L Total Sample Volume (ml) S ml ) = ΣV ( NH 3 KHCl = Equation 26-4 conversion constant S (ml) = 725 ml MW = molecular weight (ref. ASTM D 3588) Volume of HCl (L) V a N S 22.4 ( L) = 1000 MW 1000 V a (L) = mg 725 ml L 22.4 L ideal gas g-mol HCl g x x x x x = L 1000 ml g-mol substance g 1000 mg L HCl Concentration (ppmvd) Va C HCl ( ppmvd ) = 10 ( V ) C HCl (ppmvd) = L m L dstd dstdl 10 6 parts x = 1 part ppmvd 22.4 = liters of ideal gas per mol of substance at 0 o C and 1 atm (ref. Civil Engineering Reference Manual, 7th ed. - Michael R. Lindeburg)
43 METHOD 26A (HYDROGEN CHLORIDE) - RESULTS Plant Name Fibrominn Biomass Power Plant Sampling Location Stack Outlet Operator TG Date 07/03/07 Project # snc-07-benson.mn-comp#1 Stack Type Circular Run Number Run Start Time Run Stop Time Meter Calibration Factor Pitot Tube Coefficient Average Nozzle Diameter Initial Meter Volume Final Meter Volume Total Meter Volume Total Sampling Time Average Meter Temperature Average Stack Temperature Barometric Pressure Stack Static Pressure Absolute Stack Pressure Average Orifice Pressure Drop Absolute Meter Pressure Avg Square Root Pitot Pressure Impingers 1-3 Water Volume Gain Impinger 4 Silica Gel Weight Gain Total Water Volume Collected Standard Water Vapor Volume Standard Meter Volume Calculated Stack Moisture Saturated Stack Moisture Reported Stack Moisture Content Carbon Dioxide Percentage Oxygen Percentage Carbon Monoxide Percentage Nitrogen Percentage Dry Gas Molecular Weight Wet Stack Gas Molecular Weight Calculated Fuel Factor Fuel F-Factor Percent Excess Air Average Stack Gas Velocity Stack Cross-Sectional Area Actual Stack Flow Rate Wet Standard Stack Flow Rate Dry Standard Stack Flow Rate Percent of Isokinetic Rate Stack HCl Concentration HCl Emission Rate (Pt 75 App F Sect ) Heat Input Historical Data OUT-HCl-1 OUT-HCl-2 OUT-HCl-3 Average 17:58 19:40 21:39 hh:mm 18:58 20:40 22:39 hh:mm (Y) (C p ) (D na ) in Stack Test Data (V m ) i ft3 (V m ) f ft3 (V m ) ft3 (Θ) min (t m ) avg of (t s ) avg of (P b ) in Hg (P static ) in H2O (P s ) in Hg ( H) avg in H2O (P m ) in Hg ( p 1/2 ) avg (in H2O)1/2 Moisture Content Data (V n ) ml (W n ) g (V lc ) ml (V w ) std scf (V m ) std dscf (B ws(calc) ) % (B ws(svp) ) % (B ws ) % Gas Analysis Data (%CO 2 ) % (%O 2 ) % (%CO) % (%N 2 ) % (M d ) lb/lb-mole (M s ) lb/lb-mole (F o ) (F c ) dscf/mmbtu (%EA) % Volumetric Flow Rate Data (v s ) ft/sec (A s ) ft2 (Q aw ) 335, , , ,475 acfm (Q sw ) 13,806 13,304 13,726 13,612 wkscfh (Q sd ) 170, , , ,946 dscfm (I) % HCl Rate Data (c HCl ) ppm (c ' HCl ) ppm@7%o 2 (E HCl ) lbs/hr (E ' HCl ) tons/yr (E '' HCl ) lbs/mmbtu (HI) MMBtu/hr snc-07-benson.mn-comp#1-outlet-hcl
44 METHOD 26A (HYDROGEN CHLORIDE) SOURCE SAMPLING TITLE PAGE Source Information Plant Name Fibrominn Biomass Power Plant Sampling Location Stack Outlet Fuel or Source Type Biomass Fuel F-Factor Test Information Starting Test Date Project # Operator Standard Temperature Standard Pressure Minimum Required Sample Vol. Run Duration Unit Number Load Base Run Number Number of Ports Available Number of Ports Used Port Inside Diameter Circular Stack 07/03/07 snc-07-benson.mn-comp#1 TG 68 of in Hg indust. spec. 35 scf chk Subpart 60 minutes OUT-HCl % or w/db 100% OUT-HCl in TRUE Test Equipment Information Run Meter Box Number from ACS SAMP-CP-0016 SAMP-CP-0016 SAMP-CP-0016 Meter Calibration Factor (Y) Orifice Meter Coefficient ( H@) in H 2 O Pitot Identification from ACS SAMP-HP-0011 SAMP-HP-0011 SAMP-HP-0011 Pitot Tube Coefficient Orsat Identification Nozzle Number Nozzle Diameter Probe Number Probe Length (SS, Glass. ) Liner Material Sample Case / Oven Number Impinger Case Number (C p ) from ACS N/A N/A N/A from ACS A-1 A-1 A-1 (D n ) in from ACS SAMP-HP-0011 SAMP-HP-0011 SAMP-HP in from list glass glass glass from ACS SAMP-BH-0027 SAMP-BH-0027 SAMP-BH-0027 from ACS SAMP-BC-0021 SAMP-BC-0003 SAMP-BC-0021 Company Name Address City, State Country Zip Project Manager Phone Number Fax Number Testing Company Information Air Hygiene International, Inc. (Tulsa, Oklahoma) 5634 S. 122nd East Ave., Suite F Tulsa, Oklahoma Thomas K. Graham (918) (918) snc-07-benson.mn-comp#1-outlet-hcl
45 METHOD 1 - SAMPLE AND VELOCITY TRAVERSES FOR CIRCULAR SOURCES Plant Name Fibrominn Biomass Power Plant Sampling Location Stack Outlet Operator TG Stack Type Circular Stack Size Large Date 07/03/07 Project # snc-07-benson.mn-comp#1 # of Ports Available 2 # of Ports Used 1 Port Inside Diameter 5.00 Circular Stack or Duct Diameter Distance to Far Wall of Stack (L fw ) in Distance to Near Wall of Stack (L nw ) in Diameter of Stack (D) in Area of Stack (A s ) ft2 L fw L nw Distance from Port to Disturbances Distance Upstream (A) in Diameters Upstream (A D ) diameters Distance Downstream (B) in Diameters Downstream (B D ) 8.43 diameters D Number of Traverse Points Required A Diameters to Minimum Number of 1 Flow Disturbance Traverse Points B Down Up Particulate Velocity Stream Stream Points Points >= 8.00 >= or or 12 2 Upstream Spec Number of Traverse Points Used Downstream Spec Ports by 1 Across Traverse Pts Required Pts Used 1 Required 1 Check Minimum Number of Points for the Upstream and Downstream conditions, then use the largest. TRUE Particulate Traverse 2 8 for Circular Stacks 12 to 24 inches Traverse Point Locations 12 for Circular Stacks over 24 inches Fraction Distance Distance Location of Traverse Points in Circular Stacks Traverse Point (Fraction of Stack Dimension from Inside Wall to Traverse Point) Number of Traverse Points Across the Stack Number Traverse of from Including Point Stack Inside Reference Number Diameter Wall Length in in /8 71 4/ snc-07-benson.mn-comp#1-outlet-hcl
46 FALSE PreTest METHOD 2 - DETERMINATION OF STACK GAS VELOCITY AND VOLUMETRIC FLOW RATE Plant Name Fibrominn Biomass Power Plant Sampling Location Stack Outlet Operator TG Stack Type Circular FALSE Pitot Leak Check PostTest Date 06/30/07 Project # snc-07-benson.mn-comp#1 # of Ports Used 1 Pitot Identification samp-hp-0006 Pitot Coefficient (C p ) 0.84 Stack Dimensions Diameter or Length of Stack Width of Stack Area of Stack Barometric Pressure Static Pressure Absolute Stack Pressure Pressures Stack Gas Composition Composition Data: TRUE Carbon Dioxide Concentration Oxygen Concentration Carbon Monoxide Concentration Nitrogen Concentration Stack Moisture Content Stack Dry Molecular Weight Stack Wet Molecular Weight Stack Cross Section Schematic Velocity Traverse Data (D) in Run Number OUT-HCl-V1 (W) in Run Time 12:00 Start 12:10 End (A s ) ft2 Traverse Velocity Null Stack Local Point Head Angle Temp Velocity ( p) (N a ) (t s ) (v s(l) ) (P b ) in Hg in H2O deg of ft/sec (P static ) in H2O A (P s ) in Hg A A A A Actual Composition (%CO 2 ) 14.4 % A (%O 2 ) 4.8 % B (%CO) 0.0 % B (%N 2 ) 80.8 % B (B ws ) % B (M d ) lb/lb-mole B (M s ) lb/lb-mole B Results Avg Stack Gas Velocity (v s ) 72.7 ft/sec Avg Stack Dry Std Flow Rate (Q sd ) 8,192,279 dscf/hr Avg Stack Dry Std Flow Rate (Q sd ) 136,538 dscf/min Avg Stack Wet Flow Rate (Q aw ) 277,654 acf/min Avg Stack Wet Std Flow Rate (Q sw ) 11,703,256 ascf/hr Average = Square roots of p snc-07-benson.mn-comp#1-outlet-hcl
47 FALSE PreTest METHOD 3a - DETERMINATION OF DRY MOLECULAR WEIGHT BY ANALYZER Plant Name Fibrominn Biomass Power Plant Sampling Location Stack Outlet Operator TG Fuel Type Biomass Minimum Fuel Factor FALSE Orsat Leak Check PostTest Date 07/03/07 Project # snc-07-benson.mn-comp#1 # of Ports Used Maximum Fuel Factor Orsat Identification N/A Sample Analysis Time 17:58 Run Stop Time 18:58 (%CO2) (%O2) (ppmco) (%CO 2 ) (%O 2 ) (%CO) (%N 2 ) (M d ) ( M d ) hh:mm percent percent ppm percent percent percent percent lb/lb-mole lb/lb-mole 1: Results Averages Average Calculated Fuel Factor Molecular Wt Deviation < 0.3? (F o ) avg FALSE Average Excess Air Fuel Factor in Handbook Range? (%EA) avg 33.7 percent FALSE Sample Analysis Time 19:40 Run Stop Time 20:40 (%CO2) (%O2) (ppmco) (%CO 2 ) (%O 2 ) (%CO) (%N 2 ) (M d ) ( M d ) hh:mm percent percent ppm percent percent percent percent lb/lb-mole lb/lb-mole 1: Results Averages Average Calculated Fuel Factor Molecular Wt Deviation < 0.3? (F o ) avg FALSE Average Excess Air Fuel Factor in Handbook Range? (%EA) avg 29.9 percent FALSE Sample Analysis Time Gas Analysis Data Run Number OUT-HCl-3 Run Start Time 21:39 Run Stop Time 22:39 (%CO2) (%O2) (ppmco) (%CO 2 ) (%O 2 ) (%CO) (%N 2 ) (M d ) ( M d ) hh:mm percent percent ppm percent percent percent percent lb/lb-mole lb/lb-mole 1: Results Averages Average Calculated Fuel Factor Molecular Wt Deviation < 0.3? (F o ) avg FALSE Average Excess Air Fuel Factor in Handbook Range? (%EA) avg 35.0 percent FALSE Fuel Type Coal, Anthracite Coal, Lignite Coal, Bituminous Oil, Distillate Oil, Residual Gas, Natural Gas, Propane Gas, Butane Biomass Wood Bark Run Number Carbon Dioxide Conc. Run Number Carbon Dioxide Conc. Carbon Dioxide Conc. Oxygen Conc. Oxygen Conc. Oxygen Conc. OUT-HCl-1 OUT-HCl-2 Carbon Monoxide Conc. Fuel Factor Fo Minimum Maximum snc-07-benson.mn-comp#1-outlet-hcl Carbon Monoxide Conc. Carbon Monoxide Conc. Gas Analysis Data Run Start Time Carbon Dioxide Conc. Gas Analysis Data Run Start Time Carbon Dioxide Conc. Carbon Dioxide Conc. Oxygen Conc. Oxygen Conc. Oxygen Conc. Carbon Monoxide Conc. Carbon Monoxide Conc. Carbon Monoxide Conc. Nitrogen Conc. Nitrogen Conc. Nitrogen Conc. Dry Molecular Weight Dry Molecular Weight Dry Molecular Weight Molecular Weight Deviation Molecular Weight Deviation Molecular Weight Deviation
48 FALSE PreTest METHOD 4 - DETERMINATION OF MOISTURE CONTENT IN STACK GASES Plant Name Fibrominn Biomass Power Plant Sampling Location Stack Outlet Operator TG Stack Type Circular FALSE Train Leak Check PostTest Date Project # # of Ports Used Meter Box Number Meter Cal Factor (Y) 07/03/07 snc-07-benson.mn-comp#1 1 SAMP-CP Moisture Content Data Run Number OUT-HCl-1 Run Start Time 17:58 Run Stop Time 18:58 Total Meter Volume (V m ) dcf Barometric Press. (P b ) in Hg Avg Stack Temp (t s ) avg 297 of Stack Static Press. (P static ) in H2O Avg Meter Temp (t m ) avg 79 of Avg Orifice Press. ( H) avg 2.88 in H2O Impinger 1 Impinger 2 Impinger 3 Impinger 4 Impinger 5 Impinger 6 Impinger 7 Impinger 8 g g g g g g g g Contents H2SO4 H2SO4 Sil Gel Final Value (V f ),(W f ) Initial Value (V i ),(W i ) Net Value (V n ),(W n ) Results Total Weight (W t ) g Water Vol Weighed (V wsg(std) ) scf Std Meter Volume (V m(std) ) dscf Sat. Moisture Content (B ws(svp) ) % Calc Moisture Content (B ws(calc) ) 25.7 % Final Moisture Content (B ws ) 25.7 % Moisture Content Data Run Number OUT-HCl-2 Run Start Time 19:40 Run Stop Time 20:40 Total Meter Volume (V m ) dcf Barometric Press. (P b ) in Hg Avg Stack Temp (t s ) avg 293 of Stack Static Press. (P static ) in H2O Avg Meter Temp (t m ) avg 81 of Avg Orifice Press. ( H) avg 2.63 in H2O Impinger 1 Impinger 2 Impinger 3 Impinger 4 Impinger 5 Impinger 6 Impinger 7 Impinger 8 g g g g g g g g Contents H2SO4 H2SO4 Sil Gel Final Value (V f ),(W f ) Initial Value (V i ),(W i ) Net Value (V n ),(W n ) Results Total Weight (W t ) g Water Vol Weighed (V wsg(std) ) scf Std Meter Volume (V m(std) ) dscf Sat. Moisture Content (B ws(svp) ) % Calc Moisture Content (B ws ) 26.0 % Final Moisture Content (B ws ) 26.0 % Moisture Content Data Run Number OUT-HCl-3 Run Start Time 21:39 Run Stop Time 22:39 Total Meter Volume (V m ) dcf Barometric Press. (P b ) in Hg Avg Stack Temp (t s ) avg 299 of Stack Static Press. (P static ) in H2O Avg Meter Temp (t m ) avg 80 of Avg Orifice Press. ( H) avg 2.87 in H2O Impinger 1 Impinger 2 Impinger 3 Impinger 4 Impinger 5 Impinger 6 Impinger 7 Impinger 8 g g g g g g g g Contents H2SO4 H2SO4 Sil Gel Final Value (V f ),(W f ) Initial Value (V i ),(W i ) Net Value (V n ),(W n ) Results Total Weight (W t ) g Water Vol Weighed (V wsg(std) ) scf Std Meter Volume (V m(std) ) dscf Sat. Moisture Content (B ws(svp) ) % Calc Moisture Content (B ws ) 24.9 % Final Moisture Content (B ws ) 24.9 % snc-07-benson.mn-comp#1-outlet-hcl
49 Plant Name Fibrominn Biomass Power Plant METHOD 26A (HYDROGEN CHLORIDE) ISOKINETIC SAMPLING DATA Date Project # 7/3/2007 snc-07-benson.mn-comp#1 Ideal Nozzle Diameter and IsoKinetic Factor Setup Sampling Location Stack Outlet Pitot Tube Coefficient (C p ) 0.84 Operator TG Run # OUT-HCl-1 Avg Stack Temp (t s ) 297 of # of Points Across 1 # of Ports Used 1 Avg Gas Meter Temp (t m ) SCFM ( H@) 1.83 in H2O Leak Checks Sampling Equipment Avg Pitot Tube Diff. Pressure ( p avg ) 1.26 in H2O Train Pre 0 15 in Hg Meter # SAMP-CP-0016 Stack Moisture Content (B ws ) % OK? Post 0 15 in Hg Meterbox Cal. Factor (Y) Stack Dry Molecular Weight (M d ) lb/lb-mole Pitot Pre 3/4 in. H 2 O for 15 sec Nozzle # A-1 Estimated Orifice Flow Rate (Q m ) acfm OK? Post 3/4 in. H 2 O for 15 sec Average Nozzle Diameter (D na ) in DP to DH Isokinetic Factor (K) 1.80 Orsat OK? Rec. Nozzle Diameter (D ni ) in Probe # / Length SAMP-HP-0011 / 60 in Pressures Nozzle Measurements Liner Material glass Barometric Pressure (P b ) in Hg Pre PASS Sample Case / Oven # SAMP-BH-0027 Stack Static Pressure (P static ) in H2O Post PASS Impinger Case # SAMP-BC-0021 Absolute Stack Pressure (P s ) in Hg Absolute Meter Pressure (P m ) in Hg Run Time Weights Imp 1 Imp 2 Imp 3 Imp 4 Imp 5 Imp 6 Imp 7 Imp 8 Start 17:58 End 18:58 Pre Wash H 2 O 50.0 ml Filter # Post Volume MeCl ml M-1922 Dry Gas Desired Actual Impinger Meter Meter Square Local Cumulative Cumulative Est-Run Traverse Sampling Timer Meter Velocity Orifice Orifice Stack Probe Filter Exit Aux Inlet Outlet Pump Root Stack Meter Percent Meter Point # Time Time Reading Head H H Temp Temp Temp Temp Temp Temp Temp Vacuum P Velocity Volume IsoKinetic Volume (Θ) (V m ) ( p) ( H d ) ( H a ) (t s ) (t mi ) (t mo ) ( p 1/2 ) (v s ) l (V m ) std (I) (V m ) std min hh:mm:ss ft3 in H2O in H2O in H2O of of of of of of of in Hg (in H2O)1/2 ft/sec scf % scf A :00: A :05: A :10: A :15: A :20: A :25: A :30: A :35: A :40: A :45: A :50: A :55: Last Pt :00: Final Val :00: Max Vac 5.0 Final Values Average Values snc-07-benson.mn-comp#1-outlet-hcl
50 METHOD 26A (HYDROGEN CHLORIDE) ISOKINETIC SAMPLING DATA Plant Name Fibrominn Biomass Power Plant Date 7/3/2007 Ideal Nozzle Diameter and IsoKinetic Factor Setup Sampling Location Stack Outlet Project # snc-07-benson.mn-comp#1 Pitot Tube Coefficient (C p ) 0.84 Operator TG Run # OUT-HCl-2 Avg Stack Temp (t s ) 293 of # of Points Across 1 # of Ports Used 1 Avg Gas Meter Temp (t m ) SCFM ( H@) 1.83 in H2O Leak Checks Sampling Equipment Avg Pitot Tube Diff. Pressure ( p avg ) 1.21 in H2O Train Pre 0 15 in Hg Meter # SAMP-CP-0016 Stack Moisture Content (B ws ) % OK? Post 0 15 in Hg Meterbox Cal. Factor (Y) Stack Dry Molecular Weight (M d ) lb/lb-mole Pitot Pre 3/4 in. H 2 O for 15 sec Nozzle # A-1 Estimated Orifice Flow Rate (Q m ) acfm OK? Post 3/4 in. H 2 O for 15 sec Average Nozzle Diameter (D na ) in DP to DH Isokinetic Factor (K) 1.80 Orsat OK? Rec. Nozzle Diameter (D ni ) in Probe # / Length SAMP-HP-0011 / 60 in Pressures Nozzle Measurements Liner Material glass Barometric Pressure (P b ) in Hg Pre PASS Sample Case / Oven # SAMP-BH-0027 Stack Static Pressure (P static ) in H2O Post PASS Impinger Case # SAMP-BC-0003 Absolute Stack Pressure (P s ) in Hg Absolute Meter Pressure (P m ) in Hg Run Time Weights Imp 1 Imp 2 Imp 3 Imp 4 Imp 5 Imp 6 Imp 7 Imp 8 Start 19:40 End 20:40 Pre Wash H 2 O 50.0 ml Filter # Post Volume MeCl ml M-1922 Dry Gas Desired Actual Impinger Meter Meter Square Local Cumulative Cumulative Est-Run Traverse Sampling Timer Meter Velocity Orifice Orifice Stack Probe Filter Exit Aux Inlet Outlet Pump Root Stack Meter Percent Meter Point # Time Time Reading Head H H Temp Temp Temp Temp Temp Temp Temp Vacuum P Velocity Volume IsoKinetic Volume (Θ) (V m ) ( p) ( H d ) ( H a ) (t s ) (t mi ) (t mo ) ( p 1/2 ) (v s ) l (V m ) std (I) (V m ) std min hh:mm:ss ft3 in H2O in H2O in H2O of of of of of of of in Hg (in H2O)1/2 ft/sec scf % scf A :00: A :05: A :10: A :15: A :20: A :25: A :30: A :35: A :40: A :45: A :50: A :55: Last Pt :00: Final Val :00: Max Vac 5.0 Final Values Average Values snc-07-benson.mn-comp#1-outlet-hcl
51 METHOD 26A (HYDROGEN CHLORIDE) ISOKINETIC SAMPLING DATA Plant Name Fibrominn Biomass Power Plant Date 7/3/2007 Ideal Nozzle Diameter and IsoKinetic Factor Setup Sampling Location Stack Outlet Project # snc-07-benson.mn-comp#1 Pitot Tube Coefficient (C p ) 0.84 Operator TG Run # OUT-HCl-3 Avg Stack Temp (t s ) 299 of # of Points Across 1 # of Ports Used 1 Avg Gas Meter Temp (t m ) SCFM ( H@) 1.83 in H2O Leak Checks Sampling Equipment Avg Pitot Tube Diff. Pressure ( p avg ) 1.26 in H2O Train Pre 0 15 in Hg Meter # SAMP-CP-0016 Stack Moisture Content (B ws ) % OK? Post 0 15 in Hg Meterbox Cal. Factor (Y) Stack Dry Molecular Weight (M d ) lb/lb-mole Pitot Pre 3/4 in. H 2 O for 15 sec Nozzle # A-1 Estimated Orifice Flow Rate (Q m ) acfm OK? Post 3/4 in. H 2 O for 15 sec Average Nozzle Diameter (D na ) in DP to DH Isokinetic Factor (K) 1.83 Orsat OK? Rec. Nozzle Diameter (D ni ) in Probe # / Length SAMP-HP-0011 / 60 in Pressures Nozzle Measurements Liner Material glass Barometric Pressure (P b ) in Hg Pre PASS Sample Case / Oven # SAMP-BH-0027 Stack Static Pressure (P static ) in H2O Post PASS Impinger Case # SAMP-BC-0021 Absolute Stack Pressure (P s ) in Hg Absolute Meter Pressure (P m ) in Hg Run Time Weights Imp 1 Imp 2 Imp 3 Imp 4 Imp 5 Imp 6 Imp 7 Imp 8 Start 21:39 End 22:39 Pre Wash H 2 O 50.0 ml Filter # Post Volume MeCl ml M-1922 Dry Gas Desired Actual Impinger Meter Meter Square Local Cumulative Cumulative Est-Run Traverse Sampling Timer Meter Velocity Orifice Orifice Stack Probe Filter Exit Aux Inlet Outlet Pump Root Stack Meter Percent Meter Point # Time Time Reading Head H H Temp Temp Temp Temp Temp Temp Temp Vacuum P Velocity Volume IsoKinetic Volume (Θ) (V m ) ( p) ( H d ) ( H a ) (t s ) (t mi ) (t mo ) ( p 1/2 ) (v s ) l (V m ) std (I) (V m ) std min hh:mm:ss ft3 in H2O in H2O in H2O of of of of of of of in Hg (in H2O)1/2 ft/sec scf % scf A :00: A :05: A :10: A :15: A :20: A :25: A :30: A :35: A :40: A :45: A :50: A :55: Last Pt :00: Final Val :00: Max Vac 5.0 Final Values Average Values snc-07-benson.mn-comp#1-outlet-hcl
52 METHOD 26A (HYDROGEN CHLORIDE) - SAMPLE RECOVERY AND INTEGRITY DATA SHEET Plant Name Fibrominn Biomass Power Plant Sampling Location Stack Outlet Operator TG Date 07/03/07 Project # snc-07-benson.mn-comp#1 Acetone Lot Number Run Number Run Start Time Run Stop Time Train Prepared By Train Recovered By Recovery Date Relinquished By Received By Relinquished Date Relinquished Time Final Volume Initial Volume Net Volume Filter Acetone Wash Run History Data OUT-HCl-1 OUT-HCl-2 OUT-HCl-3 17:58 19:40 21:39 (hh:mm) 18:58 20:40 22:39 (hh:mm) KV/SK KV/SK KV/SK KV/SK KV/SK KV/SK 7/3/2007 7/3/2007 7/3/2007 (mm/dd/yy) KV/SK KV/SK KV/SK TG TG TG 7/3/2007 7/3/2007 7/3/2007 (mm/dd/yy) 18:58 20:40 22:39 (hh:mm) Equipment Identification Numbers Silica Gel Impinger Case Sample Box Oven M-1922 M-1922 M-1922 ok ok ok ok ok ok SAMP-BC-0021 SAMP-BC-0003 SAMP-BC-0021 Sample Blank Taken YES SAMP-BH-0027 SAMP-BH-0027 SAMP-BH-0027 ok ok ok Moisture Content Data Impingers 1, 2, 3 and 4 - Liquid Volume (V f ) ml (V i ) ml (V n ) ml Comments Final Weight Initial Weight Net Weight Impinger 5 - Silica Gel Weight (W f ) g (W i ) g (W n ) g Comments Total Volume Total Water Collected (V lc ) ml snc-07-benson.mn-comp#1-outlet-hcl
53 HCl ANALYSIS Air Hygiene International, Inc S. 122nd East Ave, Suite F Tulsa, Oklahoma (888) PARAMETER UNITS RUN Sample Number Lab Log Number IN-HCl IN-HCl1 IN-HCl IN-HCl2 IN-HCl IN-HCl3 BLANK Blank IN-HCl4 Concentration of Sample (S x or B x ) (mg Cl - /L) Sample Volume (V HCl ) (ml) N/A DGM Volume (V m ) dscf (dscf) N/A DGM Volume (V m ) dstdl (L dstd ) N/A Sum of HCl Ion (N) (mg/l) N/A Volume of HCl (V a ) (L) N/A HCl Concentration (C HCl ) (ppmvd) N/A Equations & Constants: Example Using Data from the 1st run DGM Volume (L dstd ) ( V ) ( L ) ( V ) m dstdl dstd = m dscf (V m ) dstdl (L dstd ) = dscf x L/ft 3 = L dstd (V m ) dscf = Volume of gas sample measured by the DGM, corrected to standard conditions. Sum of HCl Ion (mg/l) - modified 40 CFR 60, App A, Eq N ( mg / L) = K S B HCl ( ) x x mg mg µg HCl/µg mol mg N (mg/l) = x = L L µg Cl - /µg mol L Total Sample Volume (ml) S ml ) = ΣV ( NH 3 KHCl = Equation 26-4 conversion constant S (ml) = 455 ml MW = molecular weight (ref. ASTM D 3588) Volume of HCl (L) V a N S 22.4 ( L) = 1000 MW 1000 V a (L) = mg 455 ml L 22.4 L ideal gas g-mol HCl g x x x x x = L 1000 ml g-mol substance g 1000 mg L HCl Concentration (ppmvd) Va C HCl ( ppmvd ) = 10 ( V ) C HCl (ppmvd) = L m L dstd dstdl 10 6 parts x = 1 part ppmvd 22.4 = liters of ideal gas per mol of substance at 0 o C and 1 atm (ref. Civil Engineering Reference Manual, 7th ed. - Michael R. Lindeburg)
54 METHOD 26A (HYDROGEN CHLORIDE) - RESULTS Plant Name Fibrominn Biomass Power Plant Sampling Location SDA Inlet Operator TP Date 07/03/07 Project # snc-07-benson.mn-comp#1 Stack Type Circular Run Number Run Start Time Run Stop Time Meter Calibration Factor Pitot Tube Coefficient Average Nozzle Diameter Initial Meter Volume Final Meter Volume Total Meter Volume Total Sampling Time Average Meter Temperature Average Stack Temperature Barometric Pressure Stack Static Pressure Absolute Stack Pressure Average Orifice Pressure Drop Absolute Meter Pressure Avg Square Root Pitot Pressure Impingers 1-3 Water Volume Gain Impinger 4 Silica Gel Weight Gain Total Water Volume Collected Standard Water Vapor Volume Standard Meter Volume Calculated Stack Moisture Saturated Stack Moisture Reported Stack Moisture Content Carbon Dioxide Percentage Oxygen Percentage Carbon Monoxide Percentage Nitrogen Percentage Dry Gas Molecular Weight Wet Stack Gas Molecular Weight Calculated Fuel Factor Fuel F-Factor Percent Excess Air Average Stack Gas Velocity Stack Cross-Sectional Area Actual Stack Flow Rate Wet Standard Stack Flow Rate Dry Standard Stack Flow Rate Percent of Isokinetic Rate Stack HCl Concentration Historical Data IN-HCl-1 IN-HCl-2 IN-HCl-3 Average 17:58 19:40 21:39 hh:mm 18:58 20:40 22:39 hh:mm (Y) (C p ) (D na ) in Stack Test Data (V m ) i ft3 (V m ) f ft3 (V m ) ft3 (Θ) min (t m ) avg of (t s ) avg of (P b ) in Hg (P static ) in H2O (P s ) in Hg ( H) avg in H2O (P m ) in Hg ( p 1/2 ) avg (in H2O)1/2 Moisture Content Data (V n ) ml (W n ) g (V lc ) ml (V w ) std scf (V m ) std dscf (B ws(calc) ) % (B ws(svp) ) % (B ws ) % Gas Analysis Data (%CO 2 ) % (%O 2 ) % (%CO) % (%N 2 ) % (M d ) lb/lb-mole (M s ) lb/lb-mole (F o ) (F c ) dscf/mmbtu (%EA) % Volumetric Flow Rate Data (v s ) ft/sec (A s ) ft2 (Q aw ) 259, , , ,560 acfm (Q sw ) 9,946 10,965 11,420 10,777 wkscfh (Q sd ) 135, , , ,305 dscfm (I) % HCl Rate Data (c HCl ) ppm snc-07-benson.mn-comp#1-inlet-hcl
55 METHOD 26A (HYDROGEN CHLORIDE) SOURCE SAMPLING TITLE PAGE Source Information Plant Name Fibrominn Biomass Power Plant Sampling Location SDA Inlet Fuel or Source Type Biomass Fuel F-Factor Minimum Required Sample Vol. Run Duration Unit Number Load Base Run Number Number of Ports Available Number of Ports Used Port Inside Diameter Circular Stack TP 68 of in Hg indust. spec. 35 scf chk Subpart 60 minutes IN-HCl % or w/db 100% IN-HCl in TRUE Test Equipment Information Run Meter Box Number from ACS SAMP-CP-0002 SAMP-CP-0002 SAMP-CP-0002 Meter Calibration Factor (Y) Orifice Meter Coefficient ( H@) in H 2 O Pitot Identification from ACS SAMP-HP-0002 SAMP-HP-0002 SAMP-HP-0002 Pitot Tube Coefficient Orsat Identification Nozzle Number Nozzle Diameter Probe Number Probe Length (SS, Glass. ) Liner Material Sample Case / Oven Number Impinger Case Number Test Information Starting Test Date Project # Operator Standard Temperature Standard Pressure 07/03/07 snc-07-benson.mn-comp#1 (C p ) from ACS N/A N/A N/A from ACS B-2 B-2 B-2 (D n ) in from ACS SAMP-HP-0002 SAMP-HP-0002 SAMP-HP in from list glass glass glass from ACS SAMP-BH-0004 SAMP-BH-0004 SAMP-BH-0004 from ACS SAMP-BC-0015 SAMP-BC-0004 SAMP-BC-0015 Company Name Address City, State Country Zip Project Manager Phone Number Fax Number Testing Company Information Air Hygiene International, Inc. (Tulsa, Oklahoma) 5634 S. 122nd East Ave., Suite F Tulsa, Oklahoma Thomas K. Graham (918) (918) snc-07-benson.mn-comp#1-inlet-hcl
56 METHOD 1 - SAMPLE AND VELOCITY TRAVERSES FOR CIRCULAR SOURCES Plant Name Fibrominn Biomass Power Plant Sampling Location SDA Inlet Operator TP Stack Type Circular Stack Size Large Date 07/03/07 Project # snc-07-benson.mn-comp#1 # of Ports Available 2 # of Ports Used 1 Port Inside Diameter 5.00 Circular Stack or Duct Diameter Distance to Far Wall of Stack (L fw ) in Distance to Near Wall of Stack (L nw ) 7.00 in Diameter of Stack (D) in Area of Stack (A s ) ft2 L fw L nw Distance from Port to Disturbances Distance Upstream (A) in Diameters Upstream (A D ) 2.71 diameters Distance Downstream (B) in Diameters Downstream (B D ) 9.47 diameters D Number of Traverse Points Required A Diameters to Minimum Number of 1 Flow Disturbance Traverse Points B Down Up Particulate Velocity Stream Stream Points Points >= 8.00 >= or or 12 2 Upstream Spec Number of Traverse Points Used Downstream Spec Ports by 1 Across Traverse Pts Required Pts Used 1 Required 1 Check Minimum Number of Points for the Upstream and Downstream conditions, then use the largest. TRUE Particulate Traverse 2 8 for Circular Stacks 12 to 24 inches Traverse Point Locations 12 for Circular Stacks over 24 inches Fraction Distance Distance Location of Traverse Points in Circular Stacks Traverse Point (Fraction of Stack Dimension from Inside Wall to Traverse Point) Number of Traverse Points Across the Stack Number Traverse of from Including Point Stack Inside Reference Number Diameter Wall Length in in /8 71 4/ snc-07-benson.mn-comp#1-inlet-hcl
57 FALSE PreTest METHOD 2 - DETERMINATION OF STACK GAS VELOCITY AND VOLUMETRIC FLOW RATE Plant Name Fibrominn Biomass Power Plant Sampling Location SDA Inlet Operator TP Stack Type Circular FALSE Pitot Leak Check PostTest Date 06/30/07 Project # snc-07-benson.mn-comp#1 # of Ports Used 1 Pitot Identification samp-hp-0006 Pitot Coefficient (C p ) 0.84 Stack Dimensions Diameter or Length of Stack Width of Stack Area of Stack Barometric Pressure Static Pressure Absolute Stack Pressure Pressures Stack Gas Composition Composition Data: TRUE Carbon Dioxide Concentration Oxygen Concentration Carbon Monoxide Concentration Nitrogen Concentration Stack Moisture Content Stack Dry Molecular Weight Stack Wet Molecular Weight Stack Cross Section Schematic Velocity Traverse Data (D) in Run Number IN-HCl-V1 (W) in Run Time 12:00 Start 12:10 End (A s ) ft2 Traverse Velocity Null Stack Local Point Head Angle Temp Velocity ( p) (N a ) (t s ) (v s(l) ) (P b ) in Hg in H2O deg of ft/sec (P static ) in H2O A (P s ) in Hg A A A A Actual Composition (%CO 2 ) 14.4 % A (%O 2 ) 4.8 % B (%CO) 0.0 % B (%N 2 ) 80.8 % B (B ws ) % B (M d ) lb/lb-mole B (M s ) lb/lb-mole B Results Avg Stack Gas Velocity (v s ) 95.0 ft/sec Avg Stack Dry Std Flow Rate (Q sd ) 17,231,378 dscf/hr Avg Stack Dry Std Flow Rate (Q sd ) 287,190 dscf/min Avg Stack Wet Flow Rate (Q aw ) 517,452 acf/min Avg Stack Wet Std Flow Rate (Q sw ) 24,616,255 ascf/hr Average = Square roots of p snc-07-benson.mn-comp#1-inlet-hcl
58 FALSE PreTest METHOD 3a - DETERMINATION OF DRY MOLECULAR WEIGHT BY ANALYZER Plant Name Fibrominn Biomass Power Plant Sampling Location SDA Inlet Operator TP Fuel Type Biomass Minimum Fuel Factor FALSE Orsat Leak Check PostTest Date 07/03/07 Project # snc-07-benson.mn-comp#1 # of Ports Used Maximum Fuel Factor Orsat Identification N/A Sample Analysis Time 17:58 Run Stop Time 18:58 (%CO2) (%O2) (ppmco) (%CO 2 ) (%O 2 ) (%CO) (%N 2 ) (M d ) ( M d ) hh:mm percent percent ppm percent percent percent percent lb/lb-mole lb/lb-mole 1: Results Averages Average Calculated Fuel Factor Molecular Wt Deviation < 0.3? (F o ) avg FALSE Average Excess Air Fuel Factor in Handbook Range? (%EA) avg 33.9 percent FALSE Sample Analysis Time 19:40 Run Stop Time 20:40 (%CO2) (%O2) (ppmco) (%CO 2 ) (%O 2 ) (%CO) (%N 2 ) (M d ) ( M d ) hh:mm percent percent ppm percent percent percent percent lb/lb-mole lb/lb-mole 1: Results Averages Average Calculated Fuel Factor Molecular Wt Deviation < 0.3? (F o ) avg FALSE Average Excess Air Fuel Factor in Handbook Range? (%EA) avg 36.1 percent FALSE Sample Analysis Time Run Number Carbon Dioxide Conc. Run Number Carbon Dioxide Conc. Gas Analysis Data Run Number IN-HCl-3 Run Start Time 21:39 Run Stop Time 22:39 Carbon Dioxide Conc. Oxygen Conc. Oxygen Conc. Oxygen Conc. IN-HCl-1 IN-HCl-2 Carbon Monoxide Conc. Carbon Monoxide Conc. Carbon Monoxide Conc. (%CO2) (%O2) (ppmco) (%CO 2 ) (%O 2 ) (%CO) (%N 2 ) (M d ) ( M d ) hh:mm percent percent ppm percent percent percent percent lb/lb-mole lb/lb-mole 1: Results Averages Average Calculated Fuel Factor Molecular Wt Deviation < 0.3? (F o ) avg FALSE Average Excess Air Fuel Factor in Handbook Range? (%EA) avg 30.3 percent FALSE Fuel Type Coal, Anthracite Coal, Lignite Coal, Bituminous Oil, Distillate Oil, Residual Gas, Natural Gas, Propane Gas, Butane Biomass Wood Bark Fuel Factor Fo Minimum Maximum snc-07-benson.mn-comp#1-inlet-hcl Gas Analysis Data Run Start Time Carbon Dioxide Conc. Carbon Dioxide Conc. Carbon Dioxide Conc. Oxygen Conc. Gas Analysis Data Run Start Time Oxygen Conc. Oxygen Conc. Carbon Monoxide Conc. Carbon Monoxide Conc. Carbon Monoxide Conc. Nitrogen Conc. Nitrogen Conc. Nitrogen Conc. Dry Molecular Weight Dry Molecular Weight Dry Molecular Weight Molecular Weight Deviation Molecular Weight Deviation Molecular Weight Deviation
59 FALSE PreTest METHOD 4 - DETERMINATION OF MOISTURE CONTENT IN STACK GASES Plant Name Fibrominn Biomass Power Plant Sampling Location SDA Inlet Operator TP Stack Type Circular FALSE Train Leak Check PostTest Date 07/03/07 Project # snc-07-benson.mn-comp#1 # of Ports Used 1 Meter Box Number SAMP-CP-0002 Meter Cal Factor (Y) Moisture Content Data Run Number IN-HCl-1 Run Start Time 17:58 Run Stop Time 18:58 Total Meter Volume (V m ) dcf Barometric Press. (P b ) in Hg Avg Stack Temp (t s ) avg 350 of Stack Static Press. (P static ) in H2O Avg Meter Temp (t m ) avg 104 of Avg Orifice Press. ( H) avg 0.65 in H2O Impinger 1 Impinger 2 Impinger 3 Impinger 4 Impinger 5 Impinger 6 Impinger 7 Impinger 8 g g g g g g g g Contents H2SO4 H2SO4 Sil Gel Final Value (V f ),(W f ) Initial Value (V i ),(W i ) Net Value (V n ),(W n ) Results Total Weight (W t ) g Water Vol Weighed (V wsg(std) ) scf Std Meter Volume (V m(std) ) dscf Sat. Moisture Content (B ws(svp) ) % Calc Moisture Content (B ws(calc) ) 18.5 % Final Moisture Content (B ws ) 18.5 % Moisture Content Data Run Number IN-HCl-2 Run Start Time 19:40 Run Stop Time 20:40 Total Meter Volume (V m ) dcf Barometric Press. (P b ) in Hg Avg Stack Temp (t s ) avg 344 of Stack Static Press. (P static ) in H2O Avg Meter Temp (t m ) avg 104 of Avg Orifice Press. ( H) avg 0.24 in H2O Impinger 1 Impinger 2 Impinger 3 Impinger 4 Impinger 5 Impinger 6 Impinger 7 Impinger 8 g g g g g g g g Contents H2SO4 H2SO4 Sil Gel Final Value (V f ),(W f ) Initial Value (V i ),(W i ) Net Value (V n ),(W n ) Results Total Weight (W t ) g Water Vol Weighed (V wsg(std) ) scf Std Meter Volume (V m(std) ) dscf Sat. Moisture Content (B ws(svp) ) % Calc Moisture Content (B ws ) 23.0 % Final Moisture Content (B ws ) 23.0 % Moisture Content Data Run Number IN-HCl-3 Run Start Time 21:39 Run Stop Time 22:39 Total Meter Volume (V m ) dcf Barometric Press. (P b ) in Hg Avg Stack Temp (t s ) avg 348 of Stack Static Press. (P static ) in H2O Avg Meter Temp (t m ) avg 102 of Avg Orifice Press. ( H) avg 0.79 in H2O Impinger 1 Impinger 2 Impinger 3 Impinger 4 Impinger 5 Impinger 6 Impinger 7 Impinger 8 g g g g g g g g Contents H2SO4 H2SO4 Sil Gel Final Value (V f ),(W f ) Initial Value (V i ),(W i ) Net Value (V n ),(W n ) Results Total Weight (W t ) g Water Vol Weighed (V wsg(std) ) scf Std Meter Volume (V m(std) ) dscf Sat. Moisture Content (B ws(svp) ) % Calc Moisture Content (B ws ) 9.5 % Final Moisture Content (B ws ) 9.5 % snc-07-benson.mn-comp#1-inlet-hcl
60 Plant Name Sampling Location Fibrominn Biomass Power Plant SDA Inlet METHOD 26A (HYDROGEN CHLORIDE) ISOKINETIC SAMPLING DATA Date Project # 7/3/2007 snc-07-benson.mn-comp#1 Ideal Nozzle Diameter and IsoKinetic Factor Setup Pitot Tube Coefficient (C p ) 0.84 Operator TP Run # IN-HCl-1 Avg Stack Temp (t s ) 352 of # of Points Across 1 # of Ports Used 1 Avg Gas Meter Temp (t m ) SCFM ( H@) 1.67 in H2O Leak Checks Sampling Equipment Avg Pitot Tube Diff. Pressure ( p avg ) 1.45 in H2O Train Pre in Hg Meter # SAMP-CP-0002 Stack Moisture Content (B ws ) % OK? Post 0 15 in Hg Meterbox Cal. Factor (Y) Stack Dry Molecular Weight (M d ) lb/lb-mole Pitot Pre 6.0/5.3 in. H 2 O for 30 sec Nozzle # B-2 Estimated Orifice Flow Rate (Q m ) acfm OK? Post 7.1/5.2 in. H 2 O for 30 sec Average Nozzle Diameter (D na ) in DP to DH Isokinetic Factor (K) 1.36 Orsat OK? Rec. Nozzle Diameter (D ni ) in Probe # / Length SAMP-HP-0002 / 96 in Pressures Nozzle Measurements Liner Material glass Barometric Pressure (P b ) in Hg Pre PASS Sample Case / Oven # SAMP-BH-0004 Stack Static Pressure (P static ) in H2O Post PASS Impinger Case # SAMP-BC-0015 Absolute Stack Pressure (P s ) in Hg Absolute Meter Pressure (P m ) in Hg Run Time Weights Imp 1 Imp 2 Imp 3 Imp 4 Imp 5 Imp 6 Imp 7 Imp 8 Start 17:58 End 18:58 Pre Wash H 2 O 50.0 ml Filter # Post Volume MeCl ml M-1945 Dry Gas Desired Actual Impinger Meter Meter Square Local Cumulative Cumulative Est-Run Traverse Sampling Timer Meter Velocity Orifice Orifice Stack Probe Filter Exit Aux Inlet Outlet Pump Root Stack Meter Percent Meter Point # Time Time Reading Head H H Temp Temp Temp Temp Temp Temp Temp Vacuum P Velocity Volume IsoKinetic Volume (Θ) (V m ) ( p) ( H d ) ( H a ) (t s ) (t mi ) (t mo ) ( p 1/2 ) (v s ) l (V m ) std (I) (V m ) std min hh:mm:ss ft3 in H2O in H2O in H2O of of of of of of of in Hg (in H2O)1/2 ft/sec scf % scf A :00: A :05: A :10: A :15: A :20: A :25: A :30: A :35: A :40: A :45: A :50: A :55: Last Pt :00: Final Val :00: Max Vac 21.5 Final Values Average Values snc-07-benson.mn-comp#1-inlet-hcl
61 Plant Name Sampling Location Operator Fibrominn Biomass Power Plant SDA Inlet METHOD 26A (HYDROGEN CHLORIDE) ISOKINETIC SAMPLING DATA Date Project # Run # # of Ports Used 7/3/2007 Ideal Nozzle Diameter and IsoKinetic Factor Setup snc-07-benson.mn-comp#1 Pitot Tube Coefficient (C p ) 0.84 TP IN-HCl-2 Avg Stack Temp (t s ) 350 of # of Points Across 1 1 Avg Gas Meter Temp (t m ) SCFM ( H@) 1.67 in H2O Leak Checks Sampling Equipment Avg Pitot Tube Diff. Pressure ( p avg ) 0.66 in H2O Train Pre 0 15 in Hg Meter # SAMP-CP-0002 Stack Moisture Content (B ws ) % OK? Post 0 15 in Hg Meterbox Cal. Factor (Y) Stack Dry Molecular Weight (M d ) lb/lb-mole Pitot Pre 5.5/6.8 in. H 2 O for 60 sec Nozzle # B-2 Estimated Orifice Flow Rate (Q m ) acfm OK? Post 6.1/5.1 in. H 2 O for 60 sec Average Nozzle Diameter (D na ) in DP to DH Isokinetic Factor (K) 0.47 Orsat OK? Rec. Nozzle Diameter (D ni ) in Probe # / Length SAMP-HP-0002 / 96 in Pressures Nozzle Measurements Liner Material glass Barometric Pressure (P b ) in Hg Pre PASS Sample Case / Oven # SAMP-BH-0004 Stack Static Pressure (P static ) in H2O Post PASS Impinger Case # SAMP-BC-0004 Absolute Stack Pressure (P s ) in Hg Absolute Meter Pressure (P m ) in Hg Run Time Weights Imp 1 Imp 2 Imp 3 Imp 4 Imp 5 Imp 6 Imp 7 Imp 8 Start 19:40 End 20:40 Pre Wash H 2 O 50.0 ml Filter # Post Volume MeCl ml M-1945 Dry Gas Desired Actual Impinger Meter Meter Square Local Cumulative Cumulative Est-Run Traverse Sampling Timer Meter Velocity Orifice Orifice Stack Probe Filter Exit Aux Inlet Outlet Pump Root Stack Meter Percent Meter Point # Time Time Reading Head H H Temp Temp Temp Temp Temp Temp Temp Vacuum P Velocity Volume IsoKinetic Volume (Θ) (V m ) ( p) ( H d ) ( H a ) (t s ) (t mi ) (t mo ) ( p 1/2 ) (v s ) l (V m ) std (I) (V m ) std min hh:mm:ss ft3 in H2O in H2O in H2O of of of of of of of in Hg (in H2O)1/2 ft/sec scf % scf A :00: A :05: A :10: A :15: A :20: A :25: A :30: A :35: A :40: A :45: A :50: A :55: Last Pt :00: Final Val :00: Max Vac 21.0 Final Values Average Values snc-07-benson.mn-comp#1-inlet-hcl
62 Plant Name Sampling Location Operator Fibrominn Biomass Power Plant SDA Inlet METHOD 26A (HYDROGEN CHLORIDE) ISOKINETIC SAMPLING DATA Date Project # Run # # of Ports Used 7/3/2007 Ideal Nozzle Diameter and IsoKinetic Factor Setup snc-07-benson.mn-comp#1 Pitot Tube Coefficient (C p ) 0.84 TP IN-HCl-3 Avg Stack Temp (t s ) 344 of # of Points Across 1 1 Avg Gas Meter Temp (t m ) SCFM ( H@) 1.67 in H2O Leak Checks Sampling Equipment Avg Pitot Tube Diff. Pressure ( p avg ) 0.72 in H2O Train Pre 0 15 in Hg Meter # SAMP-CP-0002 Stack Moisture Content (B ws ) % OK? Post 0 15 in Hg Meterbox Cal. Factor (Y) Stack Dry Molecular Weight (M d ) lb/lb-mole Pitot Pre 6.3/5.4 in. H 2 O for 60 sec Nozzle # B-2 Estimated Orifice Flow Rate (Q m ) acfm OK? Post 5.5/6.9 in. H 2 O for 60 sec Average Nozzle Diameter (D na ) in DP to DH Isokinetic Factor (K) 1.38 Orsat OK? Rec. Nozzle Diameter (D ni ) in Probe # / Length SAMP-HP-0002 / 96 in Pressures Nozzle Measurements Liner Material glass Barometric Pressure (P b ) in Hg Pre PASS Sample Case / Oven # SAMP-BH-0004 Stack Static Pressure (P static ) in H2O Post PASS Impinger Case # SAMP-BC-0015 Absolute Stack Pressure (P s ) in Hg Absolute Meter Pressure (P m ) in Hg Run Time Weights Imp 1 Imp 2 Imp 3 Imp 4 Imp 5 Imp 6 Imp 7 Imp 8 Start 21:39 End 22:39 Pre Wash H 2 O 50.0 ml Filter # Post Volume MeCl ml M-1945 Dry Gas Desired Actual Impinger Meter Meter Square Local Cumulative Cumulative Est-Run Traverse Sampling Timer Meter Velocity Orifice Orifice Stack Probe Filter Exit Aux Inlet Outlet Pump Root Stack Meter Percent Meter Point # Time Time Reading Head H H Temp Temp Temp Temp Temp Temp Temp Vacuum P Velocity Volume IsoKinetic Volume (Θ) (V m ) ( p) ( H d ) ( H a ) (t s ) (t mi ) (t mo ) ( p 1/2 ) (v s ) l (V m ) std (I) (V m ) std min hh:mm:ss ft3 in H2O in H2O in H2O of of of of of of of in Hg (in H2O)1/2 ft/sec scf % scf A :00: A :05: A :10: A :15: A :20: A :25: A :30: A :35: A :40: A :45: A :50: A :55: Last Pt :00: Final Val :00: Max Vac 15.0 Final Values Average Values snc-07-benson.mn-comp#1-inlet-hcl
63 METHOD 26A (HYDROGEN CHLORIDE) - SAMPLE RECOVERY AND INTEGRITY DATA SHEET Plant Name Fibrominn Biomass Power Plant Sampling Location SDA Inlet Operator TP Date Project # Acetone Lot Number 07/03/07 snc-07-benson.mn-comp#1 Run Number Run Start Time Run Stop Time Train Prepared By Train Recovered By Recovery Date Relinquished By Received By Relinquished Date Relinquished Time Silica Gel Impinger Case Sample Box Oven Run History Data IN-HCl-1 IN-HCl-2 IN-HCl-3 17:58 19:40 21:39 (hh:mm) 18:58 20:40 22:39 (hh:mm) KV/SK KV/SK KV/SK KV/SK KV/SK KV/SK 7/3/2007 7/3/2007 7/3/2007 (mm/dd/yy) KV/SK KV/SK KV/SK TG TG TG 7/3/2007 7/3/2007 7/3/2007 (mm/dd/yy) 18:58 20:40 22:39 (hh:mm) Equipment Identification Numbers Filter Acetone Wash M-1945 M-1945 M-1945 ok ok ok ok ok ok SAMP-BC-0015 SAMP-BC-0004 SAMP-BC-0015 Sample Blank Taken YES SAMP-BH-0004 SAMP-BH-0004 SAMP-BH-0004 ok ok ok Final Volume Initial Volume Net Volume Moisture Content Data Impingers 1, 2, and 3 - Liquid Volume (V f ) ml (V i ) ml (V n ) ml Comments Final Weight Initial Weight Net Weight Impinger 4 - Silica Gel Weight (W f ) g (W i ) g (W n ) g Comments Total Volume Total Water Collected (V lc ) ml snc-07-benson.mn-comp#1-inlet-hcl
64 TEST RESULTS AND CALCULATIONS PM Emissions Data
65 METHOD 5 (FRONTHALF) AND 202 (BACKHALF) - RESULTS Plant Name Fibrominn Biomass Power Plant Sampling Location Stack Outlet Operator TKG Date 07/03/07 Project # snc-07-benson.mn-comp#1 Stack Type Circular Run Number Run Start Time Run Stop Time Meter Calibration Factor Pitot Tube Coefficient Average Nozzle Diameter Initial Meter Volume Final Meter Volume Total Meter Volume Total Sampling Time Average Meter Temperature Average Stack Temperature Barometric Pressure Stack Static Pressure Absolute Stack Pressure Average Orifice Pressure Drop Absolute Meter Pressure Avg Square Root Pitot Pressure Impingers 1-3 Water Volume Gain Impinger 4 Silica Gel Weight Gain Total Water Volume Collected Standard Water Vapor Volume Standard Meter Volume Calculated Stack Moisture Saturated Stack Moisture Reported Stack Moisture Content Carbon Dioxide Percentage Oxygen Percentage Carbon Monoxide Percentage Nitrogen Percentage Dry Gas Molecular Weight Wet Stack Gas Molecular Weight Calculated Fuel Factor Fuel F-Factor Percent Excess Air Average Stack Gas Velocity Stack Cross-Sectional Area Actual Stack Flow Rate Wet Standard Stack Flow Rate Dry Standard Stack Flow Rate Percent of Isokinetic Rate Mass of Particulate on Filter Mass of Particulate in Acetone Mass of Particulate in Imp Content Mass of Particulate in Org Rinse Total Mass of Particulates Stack Particulate Concentration Particulate Emission Rate (Pt 75 App F Sect ) Heat Input Historical Data OUT-PM-1 OUT-PM-2 OUT-PM-3 Average 23:42 2:44 5:27 hh:mm 2:38 5:22 7:58 hh:mm (Y) (C p ) (D na ) in Stack Test Data (V m ) i ft3 (V m ) f ft3 (V m ) ft3 (Θ) min (t m ) avg of (t s ) avg of (P b ) in Hg (P static ) in H2O (P s ) in Hg ( H) avg in H2O (P m ) in Hg ( p 1/2 ) avg (in H2O)1/2 Moisture Content Data (V n ) ml (W n ) g (V lc ) ml (V w ) std scf (V m ) std dscf (B ws(calc) ) % (B ws(svp) ) % (B ws ) % Gas Analysis Data (%CO 2 ) % (%O 2 ) % (%CO) % (%N 2 ) % (M d ) lb/lb-mole (M s ) lb/lb-mole (F o ) (F c ) dscf/mmbtu (%EA) % Volumetric Flow Rate Data (v s ) ft/sec (A s ) ft2 (Q aw ) 320, , , ,574 acfm (Q sw ) 13,293 13,137 14,538 13,656 wkscfh (Q sd ) 176, , , ,019 dscfm (I) % Emission Rate Data (M f ) mg (M a ') mg (M ino ') mg (M org ') mg (M n ) mg (c s ) g/dscf (c ' s ) gr/dscf (E) kg/hr (E ' ) lbs/hr (E '' ) tons/yr (E ''' ) lbs/mmbtu (HI) MMBtu/hr snc-07-benson.mn-comp#1-outlet-pm
66 METHOD 5 (FRONTHALF) AND 202 (BACKHALF) SOURCE SAMPLING TITLE PAGE Source Information Plant Name Fibrominn Biomass Power Plant Sampling Location Stack Outlet Fuel or Source Type Biomass Fuel F-Factor Test Information Starting Test Date Project # Operator Standard Temperature Standard Pressure Minimum Required Sample Vol. Run Duration Unit Number Load Base Run Number Number of Ports Available Number of Ports Used Port Inside Diameter Circular Stack 07/03/07 snc-07-benson.mn-comp#1 TKG 68 of in Hg indust. spec. 100 scf chk Subpart 150 minutes OUT-PM % or w/db 100% OUT-PM in TRUE Test Equipment Information Run Meter Box Number from ACS SAMP-CP-0016 SAMP-CP-0016 SAMP-CP-0016 Meter Calibration Factor (Y) Orifice Meter Coefficient ( H@) in H 2 O Pitot Identification from ACS SAMP-HP-0004 SAMP-HP-0011 SAMP-HP-0004 Pitot Tube Coefficient Orsat Identification Nozzle Number Nozzle Diameter Probe Number Probe Length (SS, Glass. ) Liner Material Sample Case / Oven Number Impinger Case Number Acetone Lot Number (C p ) from ACS N/A N/A N/A from ACS R#8 R#1 R#8 (D n ) in from ACS SAMP-HP-0004 SAMP-HP-0011 SAMP-HP in from list inconel inconel inconel from ACS SAMP-BH-0027 SAMP-BH-0004 SAMP-BH-0028 from ACS SAMP-BC-0004 SAMP-BC-0003 SAMP-BC-0026 from bottle C38B11 C38B11 C38B11 Company Name Address City, State Country Zip Project Manager Phone Number Fax Number Testing Company Information Air Hygiene International, Inc. (Tulsa, Oklahoma) 5634 S. 122nd East Ave., Suite F Tulsa, Oklahoma Thomas K. Graham (918) (918) snc-07-benson.mn-comp#1-outlet-pm
67 METHOD 1 - SAMPLE AND VELOCITY TRAVERSES FOR CIRCULAR SOURCES Plant Name Fibrominn Biomass Power Plant Sampling Location Stack Outlet Operator TKG Stack Type Circular Stack Size Large Date 07/03/07 Project # snc-07-benson.mn-comp#1 # of Ports Available 4 # of Ports Used 4 Port Inside Diameter 5.00 Circular Stack or Duct Diameter Distance to Far Wall of Stack (L fw ) in Distance to Near Wall of Stack (L nw ) in Diameter of Stack (D) in Area of Stack (A s ) ft2 L fw L nw Distance from Port to Disturbances Distance Upstream (A) in Diameters Upstream (A D ) diameters Distance Downstream (B) in Diameters Downstream (B D ) 8.43 diameters D Number of Traverse Points Required A Diameters to Minimum Number of 1 Flow Disturbance Traverse Points B Down Up Particulate Velocity Stream Stream Points Points >= 8.00 >= or or 12 2 Upstream Spec Number of Traverse Points Used Downstream Spec Ports by 3 Across Traverse Pts Required Pts Used 12 Required 1 Check Minimum Number of Points for the Upstream and Downstream conditions, then use the largest. TRUE Particulate Traverse 2 8 for Circular Stacks 12 to 24 inches Traverse Point Locations 12 for Circular Stacks over 24 inches Fraction Distance Distance Location of Traverse Points in Circular Stacks Traverse Point (Fraction of Stack Dimension from Inside Wall to Traverse Point) Number of Traverse Points Across the Stack Number Traverse of from Including Point Stack Inside Reference Number Diameter Wall Length in in /8 25 6/ /8 36 6/ snc-07-benson.mn-comp#1-outlet-pm
68 FALSE PreTest METHOD 2 - DETERMINATION OF STACK GAS VELOCITY AND VOLUMETRIC FLOW RATE Plant Name Fibrominn Biomass Power Plant Sampling Location Stack Outlet Operator TKG Stack Type Circular FALSE Pitot Leak Check PostTest Date 06/30/07 Project # snc-07-benson.mn-comp#1 # of Ports Used 4 Pitot Identification SAMP-HP-0004 Pitot Coefficient (C p ) 0.84 Stack Dimensions Diameter or Length of Stack Width of Stack Area of Stack Barometric Pressure Static Pressure Absolute Stack Pressure Pressures Stack Gas Composition FALSE Composition Data: Carbon Dioxide Concentration Oxygen Concentration Carbon Monoxide Concentration Nitrogen Concentration Stack Moisture Content Stack Dry Molecular Weight Stack Wet Molecular Weight Stack Cross Section Schematic Velocity Traverse Data (D) in Run Number OUT-PM-V1 (W) in Run Time 12:00 Start 12:10 End (A s ) ft2 Traverse Velocity Null Stack Local Point Head Angle Temp Velocity ( p) (N a ) (t s ) (v s(l) ) (P b ) in Hg in H2O deg of ft/sec (P static ) in H2O A (P s ) in Hg A A B Estimated Composition B (%CO 2 ) 14.4 % B (%O 2 ) 4.8 % C (%CO) 0.0 % C (%N 2 ) 80.8 % C (B ws ) % D (M d ) lb/lb-mole D (M s ) lb/lb-mole D Results Avg Stack Gas Velocity (v s ) 72.7 ft/sec Avg Stack Dry Std Flow Rate (Q sd ) 8,192,279 dscf/hr Avg Stack Dry Std Flow Rate (Q sd ) 136,538 dscf/min Avg Stack Wet Flow Rate (Q aw ) 277,654 acf/min Avg Stack Wet Std Flow Rate (Q sw ) 11,703,256 ascf/hr Average = Square roots of p snc-07-benson.mn-comp#1-outlet-pm
69 FALSE PreTest METHOD 3a - DETERMINATION OF DRY MOLECULAR WEIGHT BY ANALYZER Plant Name Fibrominn Biomass Power Plant Sampling Location Stack Outlet Operator TKG Fuel Type Biomass Minimum Fuel Factor FALSE Orsat Leak Check PostTest Date 07/03/07 Project # snc-07-benson.mn-comp#1 # of Ports Used Maximum Fuel Factor Orsat Identification N/A Sample Analysis Time 23:42 Run Stop Time 2:38 (%CO2) (%O2) (ppmco) (%CO 2 ) (%O 2 ) (%CO) (%N 2 ) (M d ) ( M d ) hh:mm percent percent ppm percent percent percent percent lb/lb-mole lb/lb-mole 2: Results Averages Average Calculated Fuel Factor Molecular Wt Deviation < 0.3? (F o ) avg FALSE Average Excess Air Fuel Factor in Handbook Range? (%EA) avg 30.5 percent FALSE Sample Analysis Time 2:44 Run Stop Time 5:22 (%CO2) (%O2) (ppmco) (%CO 2 ) (%O 2 ) (%CO) (%N 2 ) (M d ) ( M d ) hh:mm percent percent ppm percent percent percent percent lb/lb-mole lb/lb-mole 2: Results Averages Average Calculated Fuel Factor Molecular Wt Deviation < 0.3? (F o ) avg FALSE Average Excess Air Fuel Factor in Handbook Range? (%EA) avg 30.5 percent FALSE Sample Analysis Time Gas Analysis Data Run Number OUT-PM-3 Run Start Time 5:27 Run Stop Time 7:58 (%CO2) (%O2) (ppmco) (%CO 2 ) (%O 2 ) (%CO) (%N 2 ) (M d ) ( M d ) hh:mm percent percent ppm percent percent percent percent lb/lb-mole lb/lb-mole 2: Results Averages Average Calculated Fuel Factor Molecular Wt Deviation < 0.3? (F o ) avg FALSE Average Excess Air Fuel Factor in Handbook Range? (%EA) avg 30.5 percent FALSE Fuel Type Coal, Anthracite Coal, Lignite Coal, Bituminous Oil, Distillate Oil, Residual Gas, Natural Gas, Propane Gas, Butane Biomass Wood Bark Run Number Carbon Dioxide Conc. Run Number Carbon Dioxide Conc. Carbon Dioxide Conc. Oxygen Conc. Oxygen Conc. Oxygen Conc. OUT-PM-1 OUT-PM-2 Carbon Monoxide Conc. Fuel Factor Fo Minimum Maximum snc-07-benson.mn-comp#1-outlet-pm Carbon Monoxide Conc. Carbon Monoxide Conc. Gas Analysis Data Run Start Time Carbon Dioxide Conc. Gas Analysis Data Run Start Time Carbon Dioxide Conc. Carbon Dioxide Conc. Oxygen Conc. Oxygen Conc. Oxygen Conc. Carbon Monoxide Conc. Carbon Monoxide Conc. Carbon Monoxide Conc. Nitrogen Conc. Nitrogen Conc. Nitrogen Conc. Dry Molecular Weight Dry Molecular Weight Dry Molecular Weight Molecular Weight Deviation Molecular Weight Deviation Molecular Weight Deviation
70 FALSE PreTest METHOD 4 - DETERMINATION OF MOISTURE CONTENT IN STACK GASES Plant Name Fibrominn Biomass Power Plant Sampling Location Stack Outlet Operator TKG Stack Type Circular FALSE Train Leak Check PostTest Date Project # # of Ports Used Meter Box Number Meter Cal Factor (Y) 07/03/07 snc-07-benson.mn-comp#1 4 SAMP-CP Moisture Content Data Run Number OUT-PM-1 Run Start Time 23:42 Run Stop Time 2:38 Total Meter Volume (V m ) dcf Barometric Press. (P b ) in Hg Avg Stack Temp (t s ) avg 293 of Stack Static Press. (P static ) in H2O Avg Meter Temp (t m ) avg 78 of Avg Orifice Press. ( H) avg 1.87 in H2O Impinger 1 Impinger 2 Impinger 3 Impinger 4 Impinger 5 Impinger 6 Impinger 7 Impinger 8 g g g g g g g g Contents DI DI DI Sil Gel Final Value (V f ),(W f ) Initial Value (V i ),(W i ) Net Value (V n ),(W n ) Results Total Weight (W t ) g Water Vol Weighed (V wsg(std) ) scf Std Meter Volume (V m(std) ) dscf Sat. Moisture Content (B ws(svp) ) % Calc Moisture Content (B ws(calc) ) 20.4 % Final Moisture Content (B ws ) 20.4 % Moisture Content Data Run Number OUT-PM-2 Run Start Time 2:44 Run Stop Time 5:22 Total Meter Volume (V m ) dcf Barometric Press. (P b ) in Hg Avg Stack Temp (t s ) avg 297 of Stack Static Press. (P static ) in H2O Avg Meter Temp (t m ) avg 80 of Avg Orifice Press. ( H) avg 1.98 in H2O Impinger 1 Impinger 2 Impinger 3 Impinger 4 Impinger 5 Impinger 6 Impinger 7 Impinger 8 g g g g g g g g Contents DI DI DI Sil Gel Final Value (V f ),(W f ) Initial Value (V i ),(W i ) Net Value (V n ),(W n ) Results Total Weight (W t ) g Water Vol Weighed (V wsg(std) ) scf Std Meter Volume (V m(std) ) dscf Sat. Moisture Content (B ws(svp) ) % Calc Moisture Content (B ws ) 23.9 % Final Moisture Content (B ws ) 23.9 % Moisture Content Data Run Number OUT-PM-3 Run Start Time 5:27 Run Stop Time 7:58 Total Meter Volume (V m ) dcf Barometric Press. (P b ) in Hg Avg Stack Temp (t s ) avg 296 of Stack Static Press. (P static ) in H2O Avg Meter Temp (t m ) avg 81 of Avg Orifice Press. ( H) avg 2.25 in H2O Impinger 1 Impinger 2 Impinger 3 Impinger 4 Impinger 5 Impinger 6 Impinger 7 Impinger 8 g g g g g g g g Contents DI DI DI Sil Gel Final Value (V f ),(W f ) Initial Value (V i ),(W i ) Net Value (V n ),(W n ) Results Total Weight (W t ) g Water Vol Weighed (V wsg(std) ) scf Std Meter Volume (V m(std) ) dscf Sat. Moisture Content (B ws(svp) ) % Calc Moisture Content (B ws ) 22.4 % Final Moisture Content (B ws ) 22.4 % snc-07-benson.mn-comp#1-outlet-pm
71 Plant Name Fibrominn Biomass Power Plant METHOD 5 (FRONTHALF) AND 202 (BACKHALF) ISOKINETIC SAMPLING DATA Date Project # 7/3/2007 snc-07-benson.mn-comp#1 Ideal Nozzle Diameter and IsoKinetic Factor Setup Sampling Location Stack Outlet Pitot Tube Coefficient (C p ) 0.84 Operator TKG Run # OUT-PM-1 Avg Stack Temp (t s ) 291 of # of Points Across 3 # of Ports Used 4 Avg Gas Meter Temp (t m ) SCFM ( H@) 1.83 in H2O Leak Checks Sampling Equipment Avg Pitot Tube Diff. Pressure ( p avg ) 1.05 in H2O Train Pre 0 15 in Hg Meter # SAMP-CP-0016 Stack Moisture Content (B ws ) % OK? Post 0 15 in Hg Meterbox Cal. Factor (Y) Stack Dry Molecular Weight (M d ) lb/lb-mole Pitot Pre 4/5 in. H 2 O for 15 sec Nozzle # R#8 Estimated Orifice Flow Rate (Q m ) acfm OK? Post 4/5 in. H 2 O for 15 sec Average Nozzle Diameter (D na ) in DP to DH Isokinetic Factor (K) 1.28 Orsat OK? Rec. Nozzle Diameter (D ni ) in Probe # / Length SAMP-HP-0004 / 60 in Pressures Nozzle Measurements Liner Material inconel Barometric Pressure (P b ) in Hg Pre PASS Sample Case / Oven # SAMP-BH-0027 Stack Static Pressure (P static ) in H2O Post PASS Impinger Case # SAMP-BC-0004 Absolute Stack Pressure (P s ) in Hg Absolute Meter Pressure (P m ) in Hg Run Time Weights Imp 1 Imp 2 Imp 3 Imp 4 Imp 5 Imp 6 Imp 7 Imp 8 Start 23:42 End 2:38 Pre Wash H 2 O 50.0 ml Filter # Post Volume MeCl 50.0 ml M-1916 Dry Gas Desired Actual Impinger Meter Meter Square Local Cumulative Cumulative Est-Run Traverse Sampling Timer Meter Velocity Orifice Orifice Stack Probe Filter Exit Aux Inlet Outlet Pump Root Stack Meter Percent Meter Point # Time Time Reading Head H H Temp Temp Temp Temp Temp Temp Temp Vacuum P Velocity Volume IsoKinetic Volume (Θ) (V m ) ( p) ( H d ) ( H a ) (t s ) (t mi ) (t mo ) ( p 1/2 ) (v s ) l (V m ) std (I) (V m ) std min hh:mm:ss ft3 in H2O in H2O in H2O of of of of of of of in Hg (in H2O)1/2 ft/sec scf % scf A :00: A :12: A :25: B :37: B :50: B :02: C :15: C :27: C :40: D :52: D :05: D :17: Last Pt :30: Final Val :30: Max Vac 4.0 Final Values Average Values snc-07-benson.mn-comp#1-outlet-pm
72 METHOD 5 (FRONTHALF) AND 202 (BACKHALF) ISOKINETIC SAMPLING DATA Plant Name Fibrominn Biomass Power Plant Date 7/4/2007 Ideal Nozzle Diameter and IsoKinetic Factor Setup Sampling Location Stack Outlet Project # snc-07-benson.mn-comp#1 Pitot Tube Coefficient (C p ) 0.84 Operator TKG Run # OUT-PM-2 Avg Stack Temp (t s ) 293 of # of Points Across 3 # of Ports Used 4 Avg Gas Meter Temp (t m ) SCFM ( H@) 1.83 in H2O Leak Checks Sampling Equipment Avg Pitot Tube Diff. Pressure ( p avg ) 1.21 in H2O Train Pre 0 15 in Hg Meter # SAMP-CP-0016 Stack Moisture Content (B ws ) % OK? Post 0 15 in Hg Meterbox Cal. Factor (Y) Stack Dry Molecular Weight (M d ) lb/lb-mole Pitot Pre 4/5 in. H 2 O for 15 sec Nozzle # R#1 Estimated Orifice Flow Rate (Q m ) acfm OK? Post 4/5 in. H 2 O for 15 sec Average Nozzle Diameter (D na ) in DP to DH Isokinetic Factor (K) 1.37 Orsat OK? Rec. Nozzle Diameter (D ni ) in Probe # / Length SAMP-HP-0011 / 60 in Pressures Nozzle Measurements Liner Material inconel Barometric Pressure (P b ) in Hg Pre PASS Sample Case / Oven # SAMP-BH-0004 Stack Static Pressure (P static ) in H2O Post PASS Impinger Case # SAMP-BC-0003 Absolute Stack Pressure (P s ) in Hg Absolute Meter Pressure (P m ) in Hg Run Time Weights Imp 1 Imp 2 Imp 3 Imp 4 Imp 5 Imp 6 Imp 7 Imp 8 Start 2:44 End 5:22 Pre Wash H 2 O 50.0 ml Filter # Post Volume MeCl 50.0 ml M-2149 Dry Gas Desired Actual Impinger Meter Meter Square Local Cumulative Cumulative Est-Run Traverse Sampling Timer Meter Velocity Orifice Orifice Stack Probe Filter Exit Aux Inlet Outlet Pump Root Stack Meter Percent Meter Point # Time Time Reading Head H H Temp Temp Temp Temp Temp Temp Temp Vacuum P Velocity Volume IsoKinetic Volume (Θ) (V m ) ( p) ( H d ) ( H a ) (t s ) (t mi ) (t mo ) ( p 1/2 ) (v s ) l (V m ) std (I) (V m ) std min hh:mm:ss ft3 in H2O in H2O in H2O of of of of of of of in Hg (in H2O)1/2 ft/sec scf % scf A :00: A :12: A :25: B :37: B :50: B :02: C :15: C :27: C :40: D :52: D :05: D :17: Last Pt :30: Final Val :30: Max Vac 5.0 Final Values Average Values snc-07-benson.mn-comp#1-outlet-pm
73 METHOD 5 (FRONTHALF) AND 202 (BACKHALF) ISOKINETIC SAMPLING DATA Plant Name Fibrominn Biomass Power Plant Date 7/4/2007 Ideal Nozzle Diameter and IsoKinetic Factor Setup Sampling Location Stack Outlet Project # snc-07-benson.mn-comp#1 Pitot Tube Coefficient (C p ) 0.84 Operator TKG Run # OUT-PM-3 Avg Stack Temp (t s ) 297 of # of Points Across 3 # of Ports Used 4 Avg Gas Meter Temp (t m ) SCFM ( H@) 1.83 in H2O Leak Checks Sampling Equipment Avg Pitot Tube Diff. Pressure ( p avg ) 1.20 in H2O Train Pre 0 15 in Hg Meter # SAMP-CP-0016 Stack Moisture Content (B ws ) % OK? Post 0 15 in Hg Meterbox Cal. Factor (Y) Stack Dry Molecular Weight (M d ) lb/lb-mole Pitot Pre 4/5 in. H 2 O for 15 sec Nozzle # R#8 Estimated Orifice Flow Rate (Q m ) acfm OK? Post 4/5 in. H 2 O for 15 sec Average Nozzle Diameter (D na ) in DP to DH Isokinetic Factor (K) 1.27 Orsat OK? Rec. Nozzle Diameter (D ni ) in Probe # / Length SAMP-HP-0004 / 60 in Pressures Nozzle Measurements Liner Material inconel Barometric Pressure (P b ) in Hg Pre PASS Sample Case / Oven # SAMP-BH-0028 Stack Static Pressure (P static ) in H2O Post PASS Impinger Case # SAMP-BC-0026 Absolute Stack Pressure (P s ) in Hg Absolute Meter Pressure (P m ) in Hg Run Time Weights Imp 1 Imp 2 Imp 3 Imp 4 Imp 5 Imp 6 Imp 7 Imp 8 Start 5:27 End 7:58 Pre Wash H 2 O 50.0 ml Filter # Post Volume MeCl 50.0 ml M-1973 Dry Gas Desired Actual Impinger Meter Meter Square Local Cumulative Cumulative Est-Run Traverse Sampling Timer Meter Velocity Orifice Orifice Stack Probe Filter Exit Aux Inlet Outlet Pump Root Stack Meter Percent Meter Point # Time Time Reading Head H H Temp Temp Temp Temp Temp Temp Temp Vacuum P Velocity Volume IsoKinetic Volume (Θ) (V m ) ( p) ( H d ) ( H a ) (t s ) (t mi ) (t mo ) ( p 1/2 ) (v s ) l (V m ) std (I) (V m ) std min hh:mm:ss ft3 in H2O in H2O in H2O of of of of of of of in Hg (in H2O)1/2 ft/sec scf % scf A :00: A :12: A :25: B :37: B :50: B :02: C :15: C :27: C :40: D :52: D :05: D :17: Last Pt :30: Final Val :30: Max Vac 8.0 Final Values Average Values snc-07-benson.mn-comp#1-outlet-pm
74 METHOD 5 (FRONTHALF) AND 202 (BACKHALF) - SAMPLE RECOVERY AND INTEGRITY DATA SHEET Plant Name Fibrominn Biomass Power Plant Sampling Location Stack Outlet Operator TKG Date 07/03/07 Project # snc-07-benson.mn-comp#1 Acetone Lot Number C38B11 Run Number Run Start Time Run Stop Time Train Prepared By Train Recovered By Recovery Date Relinquished By Received By Relinquished Date Relinquished Time Filter Acetone Wash Run History Data OUT-PM-1 OUT-PM-2 OUT-PM-3 23:42 2:44 5:27 (hh:mm) 2:38 5:22 7:58 (hh:mm) KV/SK KV/SK KV/SK KV/SK KV/SK KV/SK 7/3/2007 7/4/2007 7/4/2007 (mm/dd/yy) TG TG TG PS PS PS 7/5/2007 7/5/2007 7/5/2007 (mm/dd/yy) 19:00 19:00 19:00 (hh:mm) Equipment Identification Numbers Silica Gel Impinger Case Sample Box Oven M-1916 M-2149 M-1973 ok ok ok ok ok ok SAMP-BC-0004 SAMP-BC-0003 SAMP-BC-0026 Sample Blank Taken YES SAMP-BH-0027 SAMP-BH-0004 SAMP-BH-0028 ok ok ok Final Volume Initial Volume Net Volume Moisture Content Data Impingers 1, 2, and 3 - Liquid Volume (V f ) ml (V i ) ml (V n ) ml Comments Final Weight Initial Weight Net Weight Impinger 4 - Silica Gel Weight (W f ) g (W i ) g (W n ) g Comments Total Volume Total Water Collected (V lc ) ml snc-07-benson.mn-comp#1-outlet-pm
75 FALSE METHOD 5 (FRONTHALF) AND 202 (BACKHALF) - SAMPLE ANALYTICAL DATA SHEET Plant Name Fibrominn Biomass Power Plant Date 07/03/07 Sampling Location Stack Outlet Project # snc-07-benson.mn-comp#1 Operator TKG Acetone Lot Number C38B11 Filter Probe Wash Beaker # Water Beaker # MeCl (org) Beaker # Placed in Desiccator Analytical Data Number Date Time M /06/07 10: /06/07 10: /06/07 10: /06/07 10:30 Run OUT-PM-1 Start Time 23:42 Leakage Evident? Estimated Volume 0.00 Filter and Beaker Weight Measurement 1 Measurement 2 Measurement 3 Measurement 4 Probe Wash and Beaker Weight Measurement 1 Measurement 2 Measurement 3 Measurement 4 Imp Content and Beaker Weight Measurement 1 Measurement 2 Measurement 3 Measurement 4 Organics and Beaker Weight Measurement 1 Measurement 2 Measurement 3 Measurement 4 Weight Data Filter Date Time Humidity Temp Cal Audit g mm/dd/yy hh:mm %RH of g (m 1f ) /06/07 16:37 38% 76 (m 2f ) /7 11:45 38% 75 (m 3f ) (m 4f ) Acetone Date Time Humidity Temp Cal Audit g mm/dd/yy hh:mm %RH of g (m 1a ) /06/07 16:37 38% 76 (m 2a ) /7 11:45 38% 75 (m 3a ) (m 4a ) Imp Water Date Time Humidity Temp Cal Audit g mm/dd/yy hh:mm %RH of g (m 1ino ) /06/07 16:37 38% 76 (m 2ino ) /7 11:45 38% 75 (m 3ino ) (m 4ino ) MeCl Org Date Time Humidity Temp Cal Audit g mm/dd/yy hh:mm %RH of g (m 1org ) /06/07 16:37 38% 76 (m 2org ) /7 11:45 38% 75 (m 3org ) (m 4org ) snc-07-benson.mn-comp#1-outlet-pm
76 METHOD 5 (FRONTHALF) AND 202 (BACKHALF) - SAMPLE ANALYTICAL DATA SHEET Plant Name Fibrominn Biomass Power Plant Date 07/03/07 Sampling Location Stack Outlet Project # snc-07-benson.mn-comp#1 Operator TKG Acetone Lot Number C38B11 Tare Tare (Pre-Particulate) Weights Filter Filter Beaker Acetone Beaker Imp Content Beaker g Tare Organics Beaker PM 10 Beaker g Run OUT-PM-1 Sample Volume and Blank Concentrations Probe Wash Volume Impinger Content Volume Organics Wash Volume Net Wash Volume Acetone Blank Weight of Solids Imp Cont Blank Weight of Solids MeCl Blank Weight of Solids Acetone Blank Volume Imp Content Blank Volume MeCl Blank Volume Acetone Blank Concentration Imp Content Blank Concentration MeCl Blank Concentration (v a ) ml (v ino ) ml (v org ) ml (v n ) ml (w ab ) g (w inob ) g (w orgb ) g (v ab ) ml (v inob ) ml (v orgb ) ml (C a ) mg/ml (C ino ) mg/ml (C org ) mg/ml Results Filter f PM10 a1' Probe a' Imp Cont ino' Organics org' Final Weight (m fx ) g Tare Weight (m tx ) g Weight Gain (m x ) mg Blank Adjustment (W x ) mg Total Particulates (M n ) mg snc-07-benson.mn-comp#1-outlet-pm
77 FALSE METHOD 5 (FRONTHALF) AND 202 (BACKHALF) - SAMPLE ANALYTICAL DATA SHEET Plant Name Fibrominn Biomass Power Plant Date 07/03/07 Sampling Location Stack Outlet Project # snc-07-benson.mn-comp#1 Operator TKG Acetone Lot Number C38B11 Filter Probe Wash Beaker # Water Beaker # MeCl (org) Beaker # Placed in Desiccator Analytical Data Number Date Time M /06/07 10: /06/07 10: /06/07 10: /06/07 10:30 Run OUT-PM-2 Start Time 2:44 Leakage Evident? Estimated Volume 0.00 Filter and Beaker Weight Measurement 1 Measurement 2 Measurement 3 Measurement 4 Probe Wash and Beaker Weight Measurement 1 Measurement 2 Measurement 3 Measurement 4 Imp Content and Beaker Weight Measurement 1 Measurement 2 Measurement 3 Measurement 4 Organics and Beaker Weight Measurement 1 Measurement 2 Measurement 3 Measurement 4 Weight Data Filter Date Time Humidity Temp Cal Audit g mm/dd/yy hh:mm %RH of g (m 1f ) /06/07 16:37 38% 76 (m 2f ) /7 11:45 38% 75 (m 3f ) (m 4f ) Acetone Date Time Humidity Temp Cal Audit g mm/dd/yy hh:mm %RH of g (m 1a ) /06/07 16:37 38% 76 (m 2a ) /7 11:45 38% 75 (m 3a ) (m 4a ) Imp Water Date Time Humidity Temp Cal Audit g mm/dd/yy hh:mm %RH of g (m 1ino ) /06/07 16:37 38% 76 (m 2ino ) /7 11:45 38% 75 (m 3ino ) (m 4ino ) MeCl Org Date Time Humidity Temp Cal Audit g mm/dd/yy hh:mm %RH of g (m 1org ) /06/07 16:37 38% 76 (m 2org ) /7 11:45 38% 75 (m 3org ) (m 4org ) snc-07-benson.mn-comp#1-outlet-pm
78 METHOD 5 (FRONTHALF) AND 202 (BACKHALF) - SAMPLE ANALYTICAL DATA SHEET Plant Name Fibrominn Biomass Power Plant Date 07/03/07 Sampling Location Stack Outlet Project # snc-07-benson.mn-comp#1 Operator TKG Acetone Lot Number C38B11 Tare Tare (Pre-Particulate) Weights Filter Filter Beaker Acetone Beaker Imp Water Beaker g Tare Organics Beaker PM 10 Beaker g Run OUT-PM-2 Sample Volume and Blank Concentrations Probe Wash Volume (v a ) ml Impinger Content Volume (v ino ) ml Organics Wash Volume (v org ) ml Net Wash Volume (v n ) ml Acetone Blank Weight of Solids (w ab ) g Imp Cont Blank Weight of Solids (w inob ) g MeCl Blank Weight of Solids (w orgb ) g Acetone Blank Volume (v ab ) ml Imp Content Blank Volume (v inob ) ml MeCl Blank Volume (v orgb ) ml Acetone Blank Concentration (C a ) mg/ml Imp Content Blank Concentration (C ino ) mg/ml MeCl Blank Concentration (C org ) mg/ml Results Final Weight Tare Weight Weight Gain Blank Adjustment Total Particulates Filter f PM10 a1' Probe a' Imp Cont ino' Organics org' (m fx ) g (m tx ) g (m x ) mg (W x ) mg (M n ) mg snc-07-benson.mn-comp#1-outlet-pm
79 FALSE METHOD 5 (FRONTHALF) AND 202 (BACKHALF) - SAMPLE ANALYTICAL DATA SHEET Plant Name Fibrominn Biomass Power Plant Date 07/03/07 Sampling Location Stack Outlet Project # snc-07-benson.mn-comp#1 Operator TKG Acetone Lot Number C38B11 Filter Probe Wash Beaker # Water Beaker # MeCl (org) Beaker # Placed in Desiccator Analytical Data Number Date Time M /06/07 10: /06/07 10: /06/07 10: /06/07 10:30 Run OUT-PM-3 Start Time 5:27 Leakage Evident? Estimated Volume 0.00 Filter and Beaker Weight Measurement 1 Measurement 2 Measurement 3 Measurement 4 Probe Wash and Beaker Weight Measurement 1 Measurement 2 Measurement 3 Measurement 4 Imp Content and Beaker Weight Measurement 1 Measurement 2 Measurement 3 Measurement 4 Organics and Beaker Weight Measurement 1 Measurement 2 Measurement 3 Measurement 4 Weight Data Filter Date Time Humidity Temp Cal Audit g mm/dd/yy hh:mm %RH of g (m 1f ) /06/07 16:37 38% 76 (m 2f ) /7 11:45 38% 75 (m 3f ) (m 4f ) Acetone Date Time Humidity Temp Cal Audit g mm/dd/yy hh:mm %RH of g (m 1a ) /06/07 16:37 38% 76 (m 2a ) /7 11:45 38% 75 (m 3a ) (m 4a ) Imp Water Date Time Humidity Temp Cal Audit g mm/dd/yy hh:mm %RH of g (m 1ino ) /06/07 16:37 38% 76 (m 2ino ) /7 11:45 38% 75 (m 3ino ) (m 4ino ) MeCl Org Date Time Humidity Temp Cal Audit g mm/dd/yy hh:mm %RH of g (m 1org ) /06/07 16:37 38% 76 (m 2org ) /7 11:45 38% 75 (m 3org ) (m 4org ) snc-07-benson.mn-comp#1-outlet-pm
80 METHOD 5 (FRONTHALF) AND 202 (BACKHALF) - SAMPLE ANALYTICAL DATA SHEET Plant Name Fibrominn Biomass Power Plant Date 07/03/07 Sampling Location Stack Outlet Project # snc-07-benson.mn-comp#1 Operator TKG Acetone Lot Number C38B11 Tare Tare (Pre-Particulate) Weights Filter Filter Beaker Acetone Beaker Imp Water Beaker g Tare Organics Beaker PM 10 Beaker g Run OUT-PM-3 Sample Volume and Blank Concentrations Probe Wash Volume (v a ) ml Impinger Content Volume (v ino ) ml Organics Wash Volume (v org ) ml Net Wash Volume (v n ) ml Acetone Blank Weight of Solids (w ab ) g Imp Cont Blank Weight of Solids (w inob ) g MeCl Blank Weight of Solids (w orgb ) g Acetone Blank Volume (v ab ) ml Imp Content Blank Volume (v inob ) ml MeCl Blank Volume (v orgb ) ml Acetone Blank Concentration (C a ) mg/ml Imp Content Blank Concentration (C ino ) mg/ml MeCl Blank Concentration (C org ) mg/ml Results Final Weight Tare Weight Weight Gain Blank Adjustment Total Particulates Filter f PM10 a1' Probe a' Imp Cont ino' Organics org' (m fx ) g (m tx ) g (m x ) mg (W x ) mg (M n ) mg snc-07-benson.mn-comp#1-outlet-pm
81 EXAMPLE CALCULATIONS (Reference Method 1 - Circular Stack) L fw = distance to far wall of stack (in.) L nw = distance to near wall of stack (in.) [reference] D = diameter of stack (in.) A s = area of stack (ft 2 ) B = distance downstream (in.) B D = stack diameters downstream (dia.) A = distance upstream (in.) A D = stack diameters upstream (dia.) Area of Stack (ft 2 ) 2 D A s ( ft ) = π A s (ft 2 ) = 3.14 x in. 2 x 12in./ft = ft 2 2 Diameter of Stack (in.) D( in.) = L fw L nw D (in.) = 129 in in. = 108 in. Stack Diameters Downstream B B D ( dia.) = D 910 in. B D (dia.) = = 8.43 diameters 108 in. Stack Diameters Upstream A A D ( dia.) = D 2358 in. A D (dia.) = = diameters 108 in. Number of Traverse Points Based on 40 CFR Part 60, Appendix A, Method 1, Section 2.2 Traverse Point Locations Based on 40 CFR Part 60, Appendix A, Method 1, Section 2.3 Note: Lack of significant figures may cause rounding errors between actual calculations and example calculations. snc-07-benson.mn-comp#1-outlet-pm
82 EXAMPLE CALCULATIONS (Reference Method 2) P b = barometric pressure (in. Hg) C p = pitot tube coefficient P static = static pressure (in. H 2 0) p = velocity head (in. H 2 O) P s = absolute stack pressure (in. Hg) A s = area of stack (ft 2 ) %N 2 = nitrogen concentration (%) N a = null angle (deg.) %CO 2 = carbon dioxide concentration (%) t s = stack temperature ( o F) %O 2 = oxygen concentration (%) T u = temperature offset, 460 o R %CO = carbon monoxide concentration (%) K p = pitot tube constant, MW = molecular weight (lb/lb-mole) (ft/sec)(((lb/lb-mole)(in. Hg))/(( o R)(in. Hg))) 1/2 B ws = stack moisture content (%) M d = stack dry molecular weight (lb/lb-mole) M s = stack wet molecular weight (lb/lb-mole) T std = standard temperature, 68 o F, 528 o R P std = standard pressure, in. Hg v sl = local velocity (ft/sec) v s = average stack gas velocity (ft/sec) Q sd = average stack dry standard flow rate (dscf/hr) Q aw = average stack wet flow rate (ascf/min) Absolute Stack Pressure (in. Hg) Pstatic P S ( in. Hg ) = Pb in. H 2 O P s (in. Hg) = in. Hg + = 13.6 in. H 2 O/in. Hg in. Hg Nitrogen Concentration (%) % N 2 = 100 % CO 2 % O 2 % CO %N 2 (%) = % % - 0 % = % Stack Dry Molecular Weight (lb/lb-mole) MW comp M ( lb / lb mol ) = 100 d % component M d (lb/lb-mol) = 44 lb/lb-mol 100 x % + 32 lb/lb-mol 100 x 4.83 % + etc. = 30.5 lb lb-mol Stack Wet Molecular Weight (lb/lb-mole) M B = WS BWS lb / lb mol ) M d 1 + MW H O S ( 2 M S (lb/lb-mol) = 30.5 lb 30 % 18 lb 30 % lb x x = lb-mol 100 lb-mol 100 lb-mol Local Velocity (ft/sec) v s( l ) ( ft / sec) = K p C p p ts + Tu P M s 1/2 s ft (lb/lb-mol)(in. Hg) o R v sl (ft/sec) = sec ( o x 0.84 x 1.00 in.h 2 O x R)(in. H 2 O) 29.9 in. Hg x lb/lb-mol ft = sec Note: Lack of significant figures may cause rounding errors between actual calculations and example calculations. snc-07-benson.mn-comp#1-outlet-pm
83 EXAMPLE CALCULATIONS (Reference Method 2) P b = barometric pressure (in. Hg) C p = pitot tube coefficient P static = static pressure (in. H 2 0) p = velocity head (in. H 2 O) P s = absolute stack pressure (in. Hg) A s = area of stack (ft 2 ) %N 2 = nitrogen concentration (%) N A = null angle (deg.) %CO 2 = carbon dioxide concentration (%) t s = stack temperature ( o F) %O 2 = oxygen concentration (%) T u = temperature offset, 460 o R %CO = carbon monoxide concentration (%) MW = molecular weight (lb/lb-mole) B ws = stack moisture content (%) M d = stack dry molecular weight (lb/lb-mole) M s = stack wet molecular weight (lb/lb-mole) K p = pitot tube constant, (ft/sec)(((lb/lb-mole)(in. Hg))/(( o R)(in. Hg))) 1/2 T STD = standard temperature, 68 o F P STD = standard pressure, in. Hg v sl = local velocity (ft/sec) v s = average stack gas velocity (ft/sec) Q SD = average stack dry standard flow rate (dscf/hr) Q AW = average stack wet flow rate (ascf/min) Average Stack Gas Velocity (ft/sec) v ( ft / sec) = K s p C p ( p ) ( t ) s 1/ ft (lb/lb-mol)(in. Hg) v sl (ft/sec) = x 0.84 ( o x sec R)(in. H 2 O) avg s avg + T P M s u /2 in.h 2 O x o R ft = 29.9 in. Hg x lb/lb-mol sec Average Stack Dry Standard Flow Rate (dscfh) Bws vs As T Qsd dscfh 100 ( ) = ( t + T ) P 3600 sec 30.0 % ft Q sd (dscf/hr) = x 1 - x hr 100 sec o R in. Hg = o R x in. Hg s u std std P s x ft 2 x 8,192,279 dscf hr Average Stack Wet Flow Rate (acfm) Q ( acfm ) = 60 v A aw 60 sec Q aw (acf/min) = x min sec s s ft x ,654 acf ft 2 = min Average Stack Wet Standard Flow Rate (ascfh) Q sw 60 Qaw Tstd Ps ( ascfh) = ( t + T ) P s u std Q sw (ascf/hr) = 60 min 277,654 acf x hr min o R x o R x in. Hg = 11,703,256 ascf in. Hg hr Note: Lack of significant figures may cause rounding errors between actual calculations and example calculations. snc-07-benson.mn-comp#1-outlet-pm
84 EXAMPLE CALCULATIONS (Reference Method 3a) %N 2 = nitrogen concentration (%) %CO 2 = carbon dioxide concentration (%) %O 2 = oxygen concentration (%) ppmco = carbon monoxide concentration (ppm) %CO = carbon monoxide concentration (%) M d = stack dry molecular weight (lb/lb-mole) (F o ) avg = average calculated fuel factor (%EA) avg = average excess air (%) Carbon Monoxide Concentration (%) % CO = ppmco 10,000 %CO (%) = ppm 10,000 ppm/% = 1.0E-02 % Nitrogen Concentration (%) N = 100 % CO % O % CO % %N 2 (%) = % - 5 % % = % Stack Dry Molecular Weight (lb/lb-mole) MW comp M ( lb / lb mol ) = 100 d % component M d (lb/lb-mol) = 44 lb/lb-mol 100 x 14 % + 32 lb/lb-mol lb x 5 % + etc. = 100 lb-mol Average Calculated Fuel Factor F o( avg ) = [ 20.9 (% O2 ) ( ( ) avg )] avg 0.5 % CO (% CO 2 ) + (% CO ) avg 20.9% - 5 % x 0.01 % F o(avg) = = 14 % % avg Average Excess Air (%) 100 % EAavg (%) = N [(% O2 ) ( ( ) avg )] avg 0.5 % CO ( ) % O 0.5 % ( ) [( ) ( ( CO ) )] 2 avg 2 avg avg (%EA) AVG = 100 x 5 % x x % % % x 0.01 % = 30.5 % Note: Lack of significant figures may cause rounding errors between actual calculations and example calculations. snc-07-benson.mn-comp#1-outlet-pm
85 EXAMPLE CALCULATIONS (Reference Method 4) V mf = final dry gas meter reading (dcf) W t = total impinger weight (g) = Σ(W f -W i ) V mi = initial dry gas meter reading (dcf) K 5 = water mass to std water vapor, ft 3 /g V m = total meter volume (dcf) K 1 = standard volume correction, o R/in. Hg t m(avg) = average meter temp. ( o F) Y = meter calibration factor t s(avg) = average stack temp. ( o F) T u = absolute temperature offset, 460 o R P b = barometric pressure (in. Hg) B ws = final moisture content (%) = min of B ws(calc) and B ws(svp) P static = static pressure (in. H 2 O) H avg = average orifice pressure (in. H 2 O) V i = initial impinger volume (ml) Water Volume Weighed (dscf) V f = final impinger volume (ml) W i = initial impinger weight (g) W f = final impinger weight (g) V t = total impinger volume (ml) = Σ(V f -V i ) V wsg ( std ) dscf ) = Wt ( K 5 V g x ft 3 wsg(std) = /g = dscf Standard Meter Volume (dscf) V m( std ) K1 Y V ( dscf ) = m H avg Pb ( tm ) + Tu avg o R 1.87 in. H 2 O x 1.00 x dcf x in. Hg + V m(std) = in. Hg 13.6 in. H 2 O / in. Hg = o F o R dscf Calculated Moisture Content (%) Vwsg ( std ) Bws ( calc ) (%) = 100 V + V wsg ( std ) m( std ) B ws(calc) = 100 x dscf dscf dscf = % Saturated Moisture Content (%) B ws ( svp ) 10 (%) = 100 P ts ( avg ) Pstatic B ws(svp) = 100 x b in. Hg o F in. H 2 O 13.6 in. H 2 O / in. Hg 100 = 100 % Note: Lack of significant figures may cause rounding errors between actual calculations and example calculations. snc-07-benson.mn-comp#1-outlet-pm
86 EXAMPLE CALCULATIONS (Isokinetic Sampling) C n = nozzle diameter constant, p avg = average pitot tube differential pressure (in. H 2 O) Q m = estimated orifice flow rate, acfm H@ = 0.75 SCFM (in. H 2 O) else Vm/Θ from previous run D na = actual nozzle diameter (in.) V m = total meter volume (acf) p = velocity head (in. H 2 O) Θ = total sampling time (min) t m = average gas meter temperature ( o F) Desired Orifice (in. H 2 O) T u = absolute temperature offset, 460 o R H d ( in. H 2O) = K p C p = pitot tube coefficient H d (in. H 2 O) = 1.28 x 1.5 in. H 2 O = in. H 2 O B wm = meter moisture content (%) B ws = stack moisture content (%) Absolute Meter Pressure (in. Hg) t s = average stack temperature ( o F) Pm ( in. Hg ) = Pb + M d = stack dry molecular weight (lb/lb-mole) 13.6 P s = absolute stack pressure (in. Hg) 1.83 in. H 2 O P m (in. Hg) = in. Hg + C k = K Factor Constant, in. H 2 O/in. Hg = in. Hg Recommended Nozzle Diameter (in.) D ni ( in.) = C n Q ( t + T ) m u m P C m p Bwm Bws ( t + T ) s u M d B ws P p s avg ( 18 B ) ws D ni (in.) = (lb-mole o R in. H 2 O) 1/2 min in. 2 acf in. Hg 3/4 lb 1/2 x 81 o F o R x acf x in. Hg x % % x 291 o F o R x lb 25.0 % 18 lb x x lb-mole 100 lb-mol in. Hg x 1.05 in. H 2 O 25.0 % = in. DP to DH Isokinetic Factor 2 Bwm Bwm M Bws d tm + Tu Ps K C k C p H D na 100 B B ws B ws wm ts T u Pm M + d % o F o R K = in. H 2 O x x x x in. H 0.0 % 291 o F o 2 O in. 4 x 0.84 x R lb 0.0 % 18 lb 0.0 % x x lb/mole 100 lb-mol in. Hg x = lb 25.0 % 18 lb 25.0 % in. Hg x x lb/mole 100 lb-mol 100 Note: Lack of significant figures may cause rounding errors between actual calculations and example calculations. snc-07-benson.mn-comp#1-outlet-pm
87 EXAMPLE CALCULATIONS (Reference Method 5) K 4 = isokinetic conversion constant, min in.hg/sec o R v x = blank volume (ml) m #x = weight measurements (g) m fx = final weight, avg of last two measurements (g) v a = acetone volume (ml) m tx = tare weight (g) v ino = impinger content volume (ml) v org = organics wash volume (ml) w x = blank weight of solids (g) Total Particulates (mg) M ( mg) = Σ m W n ( ) x x M n (mg) = Σ 10.3 mg mg + etc = mg Local Stack Velocity (ft/sec) v s(l) (ft/sec) = ft (lb/lb-mol)(in. Hg) sec ( o R)(in. H 2 O) 1/2 x v s( l ) ( ft / sec) = K C 0.84 x 1.50 in.h 2 O x p p p Ps M d t s + T u B ws Bws o F o R lb 25.0 % 18 lb 25.0 % in. Hg x x x lb/mole 100 lb-mol 100 = sec ft Cumulative Percent Isokinetic (%) I (%) = I (%) = Θ ( t ) + T ) 2 12 Dna 1 ( ) B 1 ws v P π s( l ) avg K 4 s s avg 2 u V m min x min in. Hg x 307 o sec o F o R x scf R ft in. ft. 25 % x in. Hg x 3.14 x x x 1 - sec 2 12 in. 100 = % Net Wash Volume (ml) v ( ml) = v + v + v n a ino org v n (ml) = 90 ml ml ml = 1195 ml Blank Concentration (mg/ml) wx C x ( mg / ml) = 1000 v x Blank Adjustment (lesser of) W ( mg) = m LorLv C W x (mg) = 10.3 mg or 1000 x g mg mg C x (mg/ml) = = ml x 150 ml ml ml x x x x = mg Weight Gain (mg) m ( mg) m m x ( ) 1000 = fx tx m x (mg) = mg mg x 1000 = 10.3 mg Note: Lack of significant figures may cause rounding errors between actual calculations and example calculations. snc-07-benson.mn-comp#1-outlet-pm
88 EXAMPLE CALCULATIONS (Reference Method 5) M n = total particulates (mg) V m(std) = standard meter volume (dscf) Q sd = dry standard stack flow rate (dscfm) F d = fuel f-factor (dscf/mmbtu) Stack Particulate Concentration (g/dscf) M n c s ( g / dscf ) = V %O 2 = oxygen percentage (%) g mg 0.00 g c s (g/dscf) = x = Q sw = wet standard stack flow rate (ascfm) 1000 mg dscf dscf m( std ) Stack Particulate Concentration (gr/dscf) ' M n 7000 c s ( gr / dscf ) = V m( std ) g mg c' s (gr/dscf) = x 1000 mg dscf x 7000 gr lb x lb g gr = dscf Particulate Emissions Rate (kg/hr) 60 E( kg / hr) = c s Qsd 1000 kg 60 min E (kg/hr) = x 1000 g hr x 0.00 g dscf x 176,434 dscf min = kg hr Particulate Emissions Rate (lb/hr) ' M n Qsd 60 E ( lb / hr) = V m( std ) g 60 min lb mg 176,434 dscf lb E' (lb/hr) = x x x x = mg hr g dscf min hr Particulate Emissions Rate (ton/yr) '' ' 8760 E ( ton / yr) = E 2000 ton 8760 hr lb ton x E'' (ton/yr) = x = 2000 lb yr hr yr Particulate Emissions Rate (lb/mmbtu) ''' M n Fd 20.9 E ( lb / MMBtu ) = Vm( std ) % O2 g lb mg 1,890 dscf lb E''' (lb/mmbtu) = x x x x = 1000 mg g dscf MMBtu % MMBtu Heat Input (MMBtu/hr) 100 Bws 20.9 % O2 HI ( MMBtu / hr) = Qsw Fd ,292.7 wkscf 10 3 scf % % HI (MMBtu/hr) = x x x hr kscf 100 x 1,890 dscf/mmbtu 20.9 = 784 MMBtu hr Note: Lack of significant figures may cause rounding errors between actual calculations and example calculations. snc-07-benson.mn-comp#1-outlet-pm
89 TEST RESULTS AND CALCULATIONS Opacity Emissions Data
90 TIME (min) Company: Fibrominn, LLC Average Opacity: 2.69 % Equipment: Biomass Boiler Stack Exhaust Maximum Opacity: 15 % Location: Benson, Minnesota Run 1 6 Minute Average: 3.07 % Date: July 2, Minute Maximum: % Project #: snc-07-benson.mn-comp#1 Readings at 20 %: 0 readings OPACITY (%) 6 MIN AVG. TIME (min) OPACITY (%) 6 MIN AVG. TIME (min) OPACITY (%) 6 MIN AVG. OPACITY (%) N/A N/A N/A N/A N/A N/A N/A N/A N/A N/A N/A N/A N/A N/A N/A N/A N/A ` N/A ` N/A ` N/A ` N/A N/A N/A TIME (min) 6 MIN AVG. snc-07-benson.mn-comp#1-opacity
91 TIME (min) Company: Fibrominn, LLC Average Opacity: 2.94 % Equipment: Biomass Boiler Stack Exhaust Maximum Opacity: 15 % Location: Benson, Minnesota Run 2 6 Minute Average: 2.78 % Date: July 2, Minute Maximum: % Project #: snc-07-benson.mn-comp#1 Readings at 20 %: 0 readings OPACITY (%) 6 MIN AVG. TIME (min) OPACITY (%) 6 MIN AVG. TIME (min) OPACITY (%) 6 MIN AVG. OPACITY (%) N/A N/A N/A N/A N/A N/A N/A N/A N/A N/A N/A N/A N/A N/A N/A N/A N/A N/A N/A N/A N/A N/A N/A TIME (min) 6 MIN AVG. snc-07-benson.mn-comp#1-opacity
92 TIME (min) Company: Fibrominn, LLC Average Opacity: 0.83 % Equipment: Biomass Boiler Stack Exhaust Maximum Opacity: 5% Location: Benson, Minnesota Run 3 6 Minute Average: 0.92 % Date: July 2, Minute Maximum: 5.00 % Project #: snc-07-benson.mn-comp#1 Readings at 20 %: 0 readings OPACITY (%) 6 MIN AVG. TIME (min) OPACITY (%) 6 MIN AVG. TIME (min) OPACITY (%) 6 MIN AVG. OPACITY (%) N/A N/A N/A N/A N/A N/A N/A N/A N/A N/A N/A N/A N/A N/A N/A N/A N/A N/A N/A N/A N/A N/A N/A TIME (min) 6 MIN AVG. snc-07-benson.mn-comp#1-opacity
93 Company: Fibrominn, LLC Average Opacity: 2.69 % Equipment: Biomass Boiler Stack Exhaust Maximum Opacity: 15 % Location: Benson, Minnesota Run 1 6 Minute Average: 3.07 % Date: July 2, Minute Maximum: % Project #: snc-07-benson.mn-comp#1 Readings at 20 %: 0 readings OPACITY READINGS (15 second intervals) OPACITY (%) TIME (minutes) OPACITY RESULTS (6 minute averages) OPACITY (%) TIME (minutes) snc-07-benson.mn-comp#1-opacity
94 Company: Fibrominn, LLC Average Opacity: 2.94 % Equipment: Biomass Boiler Stack Exhaust Maximum Opacity: 15 % Location: Benson, Minnesota Run 2 6 Minute Average: 2.78 % Date: July 2, Minute Maximum: % Project #: snc-07-benson.mn-comp#1 Readings at 20 %: 0 readings OPACITY READINGS (15 second intervals) OPACITY (%) TIME (minutes) OPACITY RESULTS (6 minute averages) OPACITY (%) TIME (minutes) snc-07-benson.mn-comp#1-opacity
95 Company: Fibrominn, LLC Average Opacity: 0.83 % Equipment: Biomass Boiler Stack Exhaust Maximum Opacity: 5% Location: Benson, Minnesota Run 3 6 Minute Average: 0.92 % Date: July 2, Minute Maximum: 5.00 % Project #: snc-07-benson.mn-comp#1 Readings at 20 %: 0 readings OPACITY READINGS (15 second intervals) OPACITY (%) TIME (minutes) OPACITY RESULTS (6 minute averages) OPACITY (%) TIME (minutes) snc-07-benson.mn-comp#1-opacity
96
97
98
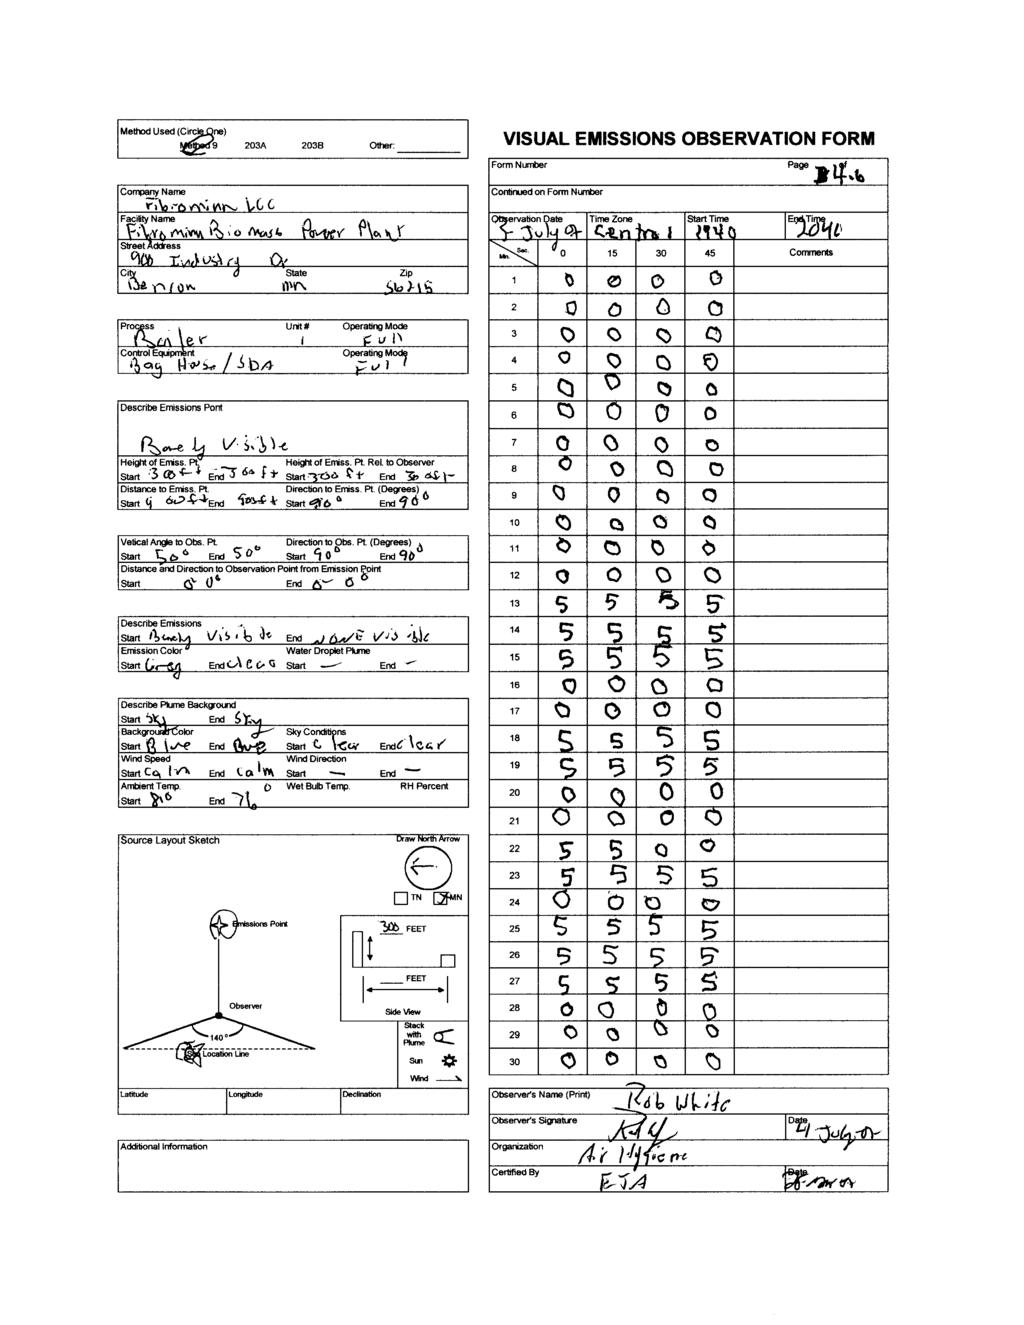
99
100
101
102 APPENDIX B UNIT OPERATION PARAMETERS
103 Fibrominn, LLC Air Permit # : Plant Name or Location: Date: Project Number: Manufacturer & Equipment: Unit Number: Fibrominn Biomass Power Plant July 3, 2007 snc-07-benson.mn-comp#1 Biomass Boiler 1 RUN UNITS Out-1 Out-2 Out-3 In-1 In-2 In-3 Start Time hh:mm:ss 17:58:14 19:40:14 21:39:14 17:58:14 19:40:14 21:39:14 End Time hh:mm:ss 18:57:44 20:39:44 22:38:44 18:57:44 20:39:44 22:38:44 Bar. Pressure in. Hg Amb. Temp. F Rel. Humidity % Spec. Humidity lb water / lb air Unit Number Outlet Outlet Outlet Inlet Inlet Inlet Stack Flow (M2) SCFH 10,257,198 9,847,715 10,305,362 8,106,276 8,438,795 10,329,857 Stack Moisture % Method Heat Input MMBtu/hr Gross Power Output gross MW Steam Rate lb/hr 487, , , , , ,767 Biomass Flow TPH Urea Injection gal/hr Feedwater Flow lb/hr 496, , , , , ,715 Secondary Air Flow lb/hr 354, , , , , ,522 Primary Air Flow lb/hr 249, , , , , ,475 Dist. Air Flow lb/hr 70,974 71,209 72,455 70,974 71,209 72,455 SDA Slurry Flow GPM SDA Quench Flow GPM Sootblower Flow lb/hr 4,414 2,176 2,649 4,414 2,176 2,649 SH Steam Temp F SH Steam Pres. psi 1,500 1,504 1,499 1,500 1,504 1,499 snc-07-benson.mn-comp#1-gases
104 5250-JI FI TIC FIC SCI FI TI TI TIC PI TI-015A 3223-TI-015B TURBINE OUTPUT (gross MW) STEAM FLOW (LB/HR) SDA INLET TEMP (DEGF) TOAL FEEDWATER FLOW (LB/HR) BIOMASS FUEL FLOW (TPH) PROPANE FLOW (SCFH) FWP DISCH TEMP (DEGF) ECONOMIZER OUT FW TEMP (DEGF) SH OUT STEAM TEMP SH OUTLET STEAM PRESS (PSI) SH OUTLET FLUE GAS TEMP (DEGF) SH OUTLET FLUE GAS TEMP (DEGF) 7/3/07 17: , , , /3/07 17: , , , /3/07 18: , , , /3/07 18: , , , /3/07 18: , , , /3/07 18: , , , /3/07 18: , , , /3/07 18: , , , /3/07 18: , , , /3/07 18: , , , /3/07 18: , , , /3/07 18: , , , /3/07 18: , , , /3/07 18: , , , /3/07 18: , , , /3/07 18: , , , /3/07 18: , , , /3/07 18: , , , /3/07 18: , , , /3/07 18: , , , /3/07 18: , , , /3/07 18: , , , /3/07 18: , , , /3/07 18: , , , /3/07 18: , , , /3/07 18: , , , /3/07 18: , , , /3/07 18: , , , /3/07 18: , , , /3/07 18: , , , /3/07 18: , , , /3/07 18: , , , /3/07 18: , , , /3/07 18: , , , /3/07 18: , , , /3/07 18: , , , /3/07 18: , , , /3/07 18: , , , /3/07 18: , , , /3/07 18: , , , /3/07 18: , , , /3/07 18: , , , /3/07 18: , , , /3/07 18: , , , /3/07 18: , , , /3/07 18: , , , /3/07 18: , , , /3/07 18: , , , /3/07 18: , , , /3/07 18: , , , snc-07-benson.mn-comp#1-gases Sheet1 9/3/2007
105 5250-JI FI TIC FIC SCI FI TI TI TIC PI TI-015A 3223-TI-015B TURBINE OUTPUT (gross MW) STEAM FLOW (LB/HR) SDA INLET TEMP (DEGF) TOAL FEEDWATER FLOW (LB/HR) BIOMASS FUEL FLOW (TPH) PROPANE FLOW (SCFH) FWP DISCH TEMP (DEGF) ECONOMIZER OUT FW TEMP (DEGF) SH OUT STEAM TEMP SH OUTLET STEAM PRESS (PSI) SH OUTLET FLUE GAS TEMP (DEGF) SH OUTLET FLUE GAS TEMP (DEGF) 7/3/07 18: , , , /3/07 18: , , , /3/07 18: , , , /3/07 18: , , , /3/07 18: , , , /3/07 18: , , , /3/07 18: , , , /3/07 18: , , , /3/07 18: , , , /3/07 18: , , , /3/07 18: , , , /3/07 18: , , , /3/07 19: , , , /3/07 19: , , , /3/07 19: , , , /3/07 19: , , , /3/07 19: , , , /3/07 19: , , , /3/07 19: , , , /3/07 19: , , , /3/07 19: , , , /3/07 19: , , , /3/07 19: , , , /3/07 19: , , , /3/07 19: , , , /3/07 19: , , , /3/07 19: , , , /3/07 19: , , , /3/07 19: , , , /3/07 19: , , , /3/07 19: , , , /3/07 19: , , , /3/07 19: , , , /3/07 19: , , , /3/07 19: , , , /3/07 19: , , , /3/07 19: , , , /3/07 19: , , , /3/07 19: , , , /3/07 19: , , , /3/07 19: , , , /3/07 19: , , , /3/07 19: , , , /3/07 19: , , , /3/07 19: , , , /3/07 19: , , , /3/07 19: , , , /3/07 19: , , , /3/07 19: , , , /3/07 19: , , , snc-07-benson.mn-comp#1-gases Sheet1 9/3/2007
106 5250-JI FI TIC FIC SCI FI TI TI TIC PI TI-015A 3223-TI-015B TURBINE OUTPUT (gross MW) STEAM FLOW (LB/HR) SDA INLET TEMP (DEGF) TOAL FEEDWATER FLOW (LB/HR) BIOMASS FUEL FLOW (TPH) PROPANE FLOW (SCFH) FWP DISCH TEMP (DEGF) ECONOMIZER OUT FW TEMP (DEGF) SH OUT STEAM TEMP SH OUTLET STEAM PRESS (PSI) SH OUTLET FLUE GAS TEMP (DEGF) SH OUTLET FLUE GAS TEMP (DEGF) 7/3/07 19: , , , /3/07 19: , , , /3/07 19: , , , /3/07 19: , , , /3/07 19: , , , /3/07 19: , , , /3/07 19: , , , /3/07 19: , , , /3/07 19: , , , /3/07 19: , , , /3/07 19: , , , /3/07 19: , , , /3/07 19: , , , /3/07 19: , , , /3/07 19: , , , /3/07 19: , , , /3/07 19: , , , /3/07 19: , , , /3/07 19: , , , /3/07 19: , , , /3/07 19: , , , /3/07 19: , , , /3/07 20: , , , /3/07 20: , , , /3/07 20: , , , /3/07 20: , , , /3/07 20: , , , /3/07 20: , , , /3/07 20: , , , /3/07 20: , , , /3/07 20: , , , /3/07 20: , , , /3/07 20: , , , /3/07 20: , , , /3/07 20: , , , /3/07 20: , , , /3/07 20: , , , /3/07 20: , , , /3/07 20: , , , /3/07 20: , , , /3/07 20: , , , /3/07 20: , , , /3/07 20: , , , /3/07 20: , , , /3/07 20: , , , /3/07 20: , , , /3/07 20: , , , /3/07 20: , , , /3/07 20: , , , /3/07 20: , , , snc-07-benson.mn-comp#1-gases Sheet1 9/3/2007
107 5250-JI FI TIC FIC SCI FI TI TI TIC PI TI-015A 3223-TI-015B TURBINE OUTPUT (gross MW) STEAM FLOW (LB/HR) SDA INLET TEMP (DEGF) TOAL FEEDWATER FLOW (LB/HR) BIOMASS FUEL FLOW (TPH) PROPANE FLOW (SCFH) FWP DISCH TEMP (DEGF) ECONOMIZER OUT FW TEMP (DEGF) SH OUT STEAM TEMP SH OUTLET STEAM PRESS (PSI) SH OUTLET FLUE GAS TEMP (DEGF) SH OUTLET FLUE GAS TEMP (DEGF) 7/3/07 20: , , , /3/07 20: , , , /3/07 20: , , , /3/07 20: , , , /3/07 20: , , , /3/07 20: , , , /3/07 20: , , , /3/07 20: , , , /3/07 20: , , , /3/07 20: , , , /3/07 20: , , , /3/07 20: , , , /3/07 20: , , , /3/07 20: , , , /3/07 20: , , , /3/07 20: , , , /3/07 20: , , , /3/07 20: , , , /3/07 20: , , , /3/07 20: , , , /3/07 20: , , , /3/07 20: , , , /3/07 20: , , , /3/07 20: , , , /3/07 20: , , , /3/07 20: , , , /3/07 20: , , , /3/07 20: , , , /3/07 20: , , , /3/07 20: , , , /3/07 20: , , , /3/07 20: , , , /3/07 21: , , , /3/07 21: , , , /3/07 21: , , , /3/07 21: , , , /3/07 21: , , , /3/07 21: , , , /3/07 21: , , , /3/07 21: , , , /3/07 21: , , , /3/07 21: , , , /3/07 21: , , , /3/07 21: , , , /3/07 21: , , , /3/07 21: , , , /3/07 21: , , , /3/07 21: , , , /3/07 21: , , , /3/07 21: , , , snc-07-benson.mn-comp#1-gases Sheet1 9/3/2007
108 5250-JI FI TIC FIC SCI FI TI TI TIC PI TI-015A 3223-TI-015B TURBINE OUTPUT (gross MW) STEAM FLOW (LB/HR) SDA INLET TEMP (DEGF) TOAL FEEDWATER FLOW (LB/HR) BIOMASS FUEL FLOW (TPH) PROPANE FLOW (SCFH) FWP DISCH TEMP (DEGF) ECONOMIZER OUT FW TEMP (DEGF) SH OUT STEAM TEMP SH OUTLET STEAM PRESS (PSI) SH OUTLET FLUE GAS TEMP (DEGF) SH OUTLET FLUE GAS TEMP (DEGF) 7/3/07 21: , , , /3/07 21: , , , /3/07 21: , , , /3/07 21: , , , /3/07 21: , , , /3/07 21: , , , /3/07 21: , , , /3/07 21: , , , /3/07 21: , , , /3/07 21: , , , /3/07 21: , , , /3/07 21: , , , /3/07 21: , , , /3/07 21: , , , /3/07 21: , , , /3/07 21: , , , /3/07 21: , , , /3/07 21: , , , /3/07 21: , , , /3/07 21: , , , /3/07 21: , , , /3/07 21: , , , /3/07 21: , , , /3/07 21: , , , /3/07 21: , , , /3/07 21: , , , /3/07 21: , , , /3/07 21: , , , /3/07 21: , , , /3/07 21: , , , /3/07 21: , , , /3/07 21: , , , /3/07 21: , , , /3/07 21: , , , /3/07 21: , , , /3/07 21: , , , /3/07 21: , , , /3/07 21: , , , /3/07 21: , , , /3/07 21: , , , /3/07 21: , , , /3/07 21: , , , /3/07 22: , , , /3/07 22: , , , /3/07 22: , , , /3/07 22: , , , /3/07 22: , , , /3/07 22: , , , /3/07 22: , , , /3/07 22: , , , snc-07-benson.mn-comp#1-gases Sheet1 9/3/2007
109 5250-JI FI TIC FIC SCI FI TI TI TIC PI TI-015A 3223-TI-015B TURBINE OUTPUT (gross MW) STEAM FLOW (LB/HR) SDA INLET TEMP (DEGF) TOAL FEEDWATER FLOW (LB/HR) BIOMASS FUEL FLOW (TPH) PROPANE FLOW (SCFH) FWP DISCH TEMP (DEGF) ECONOMIZER OUT FW TEMP (DEGF) SH OUT STEAM TEMP SH OUTLET STEAM PRESS (PSI) SH OUTLET FLUE GAS TEMP (DEGF) SH OUTLET FLUE GAS TEMP (DEGF) 7/3/07 22: , , , /3/07 22: , , , /3/07 22: , , , /3/07 22: , , , /3/07 22: , , , /3/07 22: , , , /3/07 22: , , , /3/07 22: , , , /3/07 22: , , , /3/07 22: , , , /3/07 22: , , , /3/07 22: , , , /3/07 22: , , , /3/07 22: , , , /3/07 22: , , , /3/07 22: , , , /3/07 22: , , , /3/07 22: , , , /3/07 22: , , , /3/07 22: , , , /3/07 22: , , , /3/07 22: , , , /3/07 22: , , , /3/07 22: , , , /3/07 22: , , , /3/07 22: , , , /3/07 22: , , , /3/07 22: , , , /3/07 22: , , , /3/07 22: , , , /3/07 22: , , , /3/07 22: , , , /3/07 22: , , , /3/07 22: , , , /3/07 22: , , , /3/07 22: , , , /3/07 22: , , , /3/07 22: , , , /3/07 22: , , , /3/07 22: , , , /3/07 22: , , , /3/07 22: , , , /3/07 22: , , , /3/07 22: , , , /3/07 22: , , , /3/07 22: , , , /3/07 22: , , , /3/07 22: , , , /3/07 22: , , , /3/07 22: , , , snc-07-benson.mn-comp#1-gases Sheet1 9/3/2007
110 5250-JI FI TIC FIC SCI FI TI TI TIC PI TI-015A 3223-TI-015B TURBINE OUTPUT (gross MW) STEAM FLOW (LB/HR) SDA INLET TEMP (DEGF) TOAL FEEDWATER FLOW (LB/HR) BIOMASS FUEL FLOW (TPH) PROPANE FLOW (SCFH) FWP DISCH TEMP (DEGF) ECONOMIZER OUT FW TEMP (DEGF) SH OUT STEAM TEMP SH OUTLET STEAM PRESS (PSI) SH OUTLET FLUE GAS TEMP (DEGF) SH OUTLET FLUE GAS TEMP (DEGF) 7/3/07 22: , , , /3/07 22: , , , /3/07 23: , , , /3/07 23: , , , /3/07 23: , , , /3/07 23: , , , /3/07 23: , , , /3/07 23: , , , /3/07 23: , , , /3/07 23: , , , /3/07 23: , , , /3/07 23: , , , /3/07 23: , , , /3/07 23: , , , /3/07 23: , , , /3/07 23: , , , /3/07 23: , , , /3/07 23: , , , /3/07 23: , , , /3/07 23: , , , /3/07 23: , , , /3/07 23: , , , /3/07 23: , , , /3/07 23: , , , /3/07 23: , , , /3/07 23: , , , /3/07 23: , , , /3/07 23: , , , /3/07 23: , , , /3/07 23: , , , /3/07 23: , , , /3/07 23: , , , /3/07 23: , , , /3/07 23: , , , /3/07 23: , , , /3/07 23: , , , /3/07 23: , , , /3/07 23: , , , /3/07 23: , , , /3/07 23: , , , /3/07 23: , , , /3/07 23: , , , /3/07 23: , , , /3/07 23: , , , /3/07 23: , , , /3/07 23: , , , /3/07 23: , , , /3/07 23: , , , /3/07 23: , , , /3/07 23: , , , snc-07-benson.mn-comp#1-gases Sheet1 9/3/2007
111 5250-JI FI TIC FIC SCI FI TI TI TIC PI TI-015A 3223-TI-015B TURBINE OUTPUT (gross MW) STEAM FLOW (LB/HR) SDA INLET TEMP (DEGF) TOAL FEEDWATER FLOW (LB/HR) BIOMASS FUEL FLOW (TPH) PROPANE FLOW (SCFH) FWP DISCH TEMP (DEGF) ECONOMIZER OUT FW TEMP (DEGF) SH OUT STEAM TEMP SH OUTLET STEAM PRESS (PSI) SH OUTLET FLUE GAS TEMP (DEGF) SH OUTLET FLUE GAS TEMP (DEGF) 7/3/07 23: , , , /3/07 23: , , , /3/07 23: , , , /3/07 23: , , , /3/07 23: , , , /3/07 23: , , , /3/07 23: , , , /3/07 23: , , , /3/07 23: , , , /3/07 23: , , , /3/07 23: , , , /3/07 23: , , , /4/07 0: , , , /4/07 0: , , , /4/07 0: , , , /4/07 0: , , , /4/07 0: , , , /4/07 0: , , , /4/07 0: , , , /4/07 0: , , , /4/07 0: , , , /4/07 0: , , , /4/07 0: , , , /4/07 0: , , , /4/07 0: , , , /4/07 0: , , , /4/07 0: , , , /4/07 0: , , , /4/07 0: , , , /4/07 0: , , , /4/07 0: , , , /4/07 0: , , , /4/07 0: , , , /4/07 0: , , , /4/07 0: , , , /4/07 0: , , , /4/07 0: , , , /4/07 0: , , , /4/07 0: , , , /4/07 0: , , , /4/07 0: , , , /4/07 0: , , , /4/07 0: , , , /4/07 0: , , , /4/07 0: , , , /4/07 0: , , , /4/07 0: , , , /4/07 0: , , , /4/07 0: , , , /4/07 0: , , , snc-07-benson.mn-comp#1-gases Sheet1 9/3/2007
112 5250-JI FI TIC FIC SCI FI TI TI TIC PI TI-015A 3223-TI-015B TURBINE OUTPUT (gross MW) STEAM FLOW (LB/HR) SDA INLET TEMP (DEGF) TOAL FEEDWATER FLOW (LB/HR) BIOMASS FUEL FLOW (TPH) PROPANE FLOW (SCFH) FWP DISCH TEMP (DEGF) ECONOMIZER OUT FW TEMP (DEGF) SH OUT STEAM TEMP SH OUTLET STEAM PRESS (PSI) SH OUTLET FLUE GAS TEMP (DEGF) SH OUTLET FLUE GAS TEMP (DEGF) 7/4/07 0: , , , /4/07 0: , , , /4/07 0: , , , /4/07 0: , , , /4/07 0: , , , /4/07 0: , , , /4/07 0: , , , /4/07 0: , , , /4/07 0: , , , /4/07 0: , , , /4/07 0: , , , /4/07 0: , , , /4/07 0: , , , /4/07 0: , , , /4/07 0: , , , /4/07 0: , , , /4/07 0: , , , /4/07 0: , , , /4/07 0: , , , /4/07 0: , , , /4/07 0: , , , /4/07 0: , , , /4/07 1: , , , /4/07 1: , , , /4/07 1: , , , /4/07 1: , , , /4/07 1: , , , /4/07 1: , , , /4/07 1: , , , /4/07 1: , , , /4/07 1: , , , /4/07 1: , , , /4/07 1: , , , /4/07 1: , , , /4/07 1: , , , /4/07 1: , , , /4/07 1: , , , /4/07 1: , , , /4/07 1: , , , /4/07 1: , , , /4/07 1: , , , /4/07 1: , , , /4/07 1: , , , /4/07 1: , , , /4/07 1: , , , /4/07 1: , , , /4/07 1: , , , /4/07 1: , , , /4/07 1: , , , /4/07 1: , , , snc-07-benson.mn-comp#1-gases Sheet1 9/3/2007
113 5250-JI FI TIC FIC SCI FI TI TI TIC PI TI-015A 3223-TI-015B TURBINE OUTPUT (gross MW) STEAM FLOW (LB/HR) SDA INLET TEMP (DEGF) TOAL FEEDWATER FLOW (LB/HR) BIOMASS FUEL FLOW (TPH) PROPANE FLOW (SCFH) FWP DISCH TEMP (DEGF) ECONOMIZER OUT FW TEMP (DEGF) SH OUT STEAM TEMP SH OUTLET STEAM PRESS (PSI) SH OUTLET FLUE GAS TEMP (DEGF) SH OUTLET FLUE GAS TEMP (DEGF) 7/4/07 1: , , , /4/07 1: , , , /4/07 1: , , , /4/07 1: , , , /4/07 1: , , , /4/07 1: , , , /4/07 1: , , , /4/07 1: , , , /4/07 1: , , , /4/07 1: , , , /4/07 1: , , , /4/07 1: , , , /4/07 1: , , , /4/07 1: , , , /4/07 1: , , , /4/07 1: , , , /4/07 1: , , , /4/07 1: , , , /4/07 1: , , , /4/07 1: , , , /4/07 1: , , , /4/07 1: , , , /4/07 1: , , , /4/07 1: , , , /4/07 1: , , , /4/07 1: , , , /4/07 1: , , , /4/07 1: , , , /4/07 1: , , , /4/07 1: , , , /4/07 1: , , , /4/07 1: , , , /4/07 2: , , , /4/07 2: , , , /4/07 2: , , , /4/07 2: , , , /4/07 2: , , , /4/07 2: , , , /4/07 2: , , , /4/07 2: , , , /4/07 2: , , , /4/07 2: , , , /4/07 2: , , , /4/07 2: , , , /4/07 2: , , , /4/07 2: , , , /4/07 2: , , , /4/07 2: , , , /4/07 2: , , , /4/07 2: , , , snc-07-benson.mn-comp#1-gases Sheet1 9/3/2007
114 5250-JI FI TIC FIC SCI FI TI TI TIC PI TI-015A 3223-TI-015B TURBINE OUTPUT (gross MW) STEAM FLOW (LB/HR) SDA INLET TEMP (DEGF) TOAL FEEDWATER FLOW (LB/HR) BIOMASS FUEL FLOW (TPH) PROPANE FLOW (SCFH) FWP DISCH TEMP (DEGF) ECONOMIZER OUT FW TEMP (DEGF) SH OUT STEAM TEMP SH OUTLET STEAM PRESS (PSI) SH OUTLET FLUE GAS TEMP (DEGF) SH OUTLET FLUE GAS TEMP (DEGF) 7/4/07 2: , , , /4/07 2: , , , /4/07 2: , , , /4/07 2: , , , /4/07 2: , , , /4/07 2: , , , /4/07 2: , , , /4/07 2: , , , /4/07 2: , , , /4/07 2: , , , /4/07 2: , , , /4/07 2: , , , /4/07 2: , , , /4/07 2: , , , /4/07 2: , , , /4/07 2: , , , /4/07 2: , , , /4/07 2: , , , /4/07 2: , , , /4/07 2: , , , /4/07 2: , , , /4/07 2: , , , /4/07 2: , , , /4/07 2: , , , /4/07 2: , , , /4/07 2: , , , /4/07 2: , , , /4/07 2: , , , /4/07 2: , , , /4/07 2: , , , /4/07 2: , , , /4/07 2: , , , /4/07 2: , , , /4/07 2: , , , /4/07 2: , , , /4/07 2: , , , /4/07 2: , , , /4/07 2: , , , /4/07 2: , , , /4/07 2: , , , /4/07 2: , , , /4/07 2: , , , /4/07 3: , , , /4/07 3: , , , /4/07 3: , , , /4/07 3: , , , /4/07 3: , , , /4/07 3: , , , /4/07 3: , , , /4/07 3: , , , snc-07-benson.mn-comp#1-gases Sheet1 9/3/2007
115 5250-JI FI TIC FIC SCI FI TI TI TIC PI TI-015A 3223-TI-015B TURBINE OUTPUT (gross MW) STEAM FLOW (LB/HR) SDA INLET TEMP (DEGF) TOAL FEEDWATER FLOW (LB/HR) BIOMASS FUEL FLOW (TPH) PROPANE FLOW (SCFH) FWP DISCH TEMP (DEGF) ECONOMIZER OUT FW TEMP (DEGF) SH OUT STEAM TEMP SH OUTLET STEAM PRESS (PSI) SH OUTLET FLUE GAS TEMP (DEGF) SH OUTLET FLUE GAS TEMP (DEGF) 7/4/07 3: , , , /4/07 3: , , , /4/07 3: , , , /4/07 3: , , , /4/07 3: , , , /4/07 3: , , , /4/07 3: , , , /4/07 3: , , , /4/07 3: , , , /4/07 3: , , , /4/07 3: , , , /4/07 3: , , , /4/07 3: , , , /4/07 3: , , , /4/07 3: , , , /4/07 3: , , , /4/07 3: , , , /4/07 3: , , , /4/07 3: , , , /4/07 3: , , , /4/07 3: , , , /4/07 3: , , , /4/07 3: , , , /4/07 3: , , , /4/07 3: , , , /4/07 3: , , , /4/07 3: , , , /4/07 3: , , , /4/07 3: , , , /4/07 3: , , , /4/07 3: , , , /4/07 3: , , , /4/07 3: , , , /4/07 3: , , , /4/07 3: , , , /4/07 3: , , , /4/07 3: , , , /4/07 3: , , , /4/07 3: , , , /4/07 3: , , , /4/07 3: , , , /4/07 3: , , , /4/07 3: , , , /4/07 3: , , , /4/07 3: , , , /4/07 3: , , , /4/07 3: , , , /4/07 3: , , , /4/07 3: , , , /4/07 3: , , , snc-07-benson.mn-comp#1-gases Sheet1 9/3/2007
116 5250-JI FI TIC FIC SCI FI TI TI TIC PI TI-015A 3223-TI-015B TURBINE OUTPUT (gross MW) STEAM FLOW (LB/HR) SDA INLET TEMP (DEGF) TOAL FEEDWATER FLOW (LB/HR) BIOMASS FUEL FLOW (TPH) PROPANE FLOW (SCFH) FWP DISCH TEMP (DEGF) ECONOMIZER OUT FW TEMP (DEGF) SH OUT STEAM TEMP SH OUTLET STEAM PRESS (PSI) SH OUTLET FLUE GAS TEMP (DEGF) SH OUTLET FLUE GAS TEMP (DEGF) 7/4/07 3: , , , /4/07 3: , , , /4/07 4: , , , /4/07 4: , , , /4/07 4: , , , /4/07 4: , , , /4/07 4: , , , /4/07 4: , , , /4/07 4: , , , /4/07 4: , , , /4/07 4: , , , /4/07 4: , , , /4/07 4: , , , /4/07 4: , , , /4/07 4: , , , /4/07 4: , , , /4/07 4: , , , /4/07 4: , , , /4/07 4: , , , /4/07 4: , , , /4/07 4: , , , /4/07 4: , , , /4/07 4: , , , /4/07 4: , , , /4/07 4: , , , /4/07 4: , , , /4/07 4: , , , /4/07 4: , , , /4/07 4: , , , /4/07 4: , , , /4/07 4: , , , /4/07 4: , , , /4/07 4: , , , /4/07 4: , , , /4/07 4: , , , /4/07 4: , , , /4/07 4: , , , /4/07 4: , , , /4/07 4: , , , /4/07 4: , , , /4/07 4: , , , /4/07 4: , , , /4/07 4: , , , /4/07 4: , , , /4/07 4: , , , /4/07 4: , , , /4/07 4: , , , /4/07 4: , , , /4/07 4: , , , /4/07 4: , , , snc-07-benson.mn-comp#1-gases Sheet1 9/3/2007
117 5250-JI FI TIC FIC SCI FI TI TI TIC PI TI-015A 3223-TI-015B TURBINE OUTPUT (gross MW) STEAM FLOW (LB/HR) SDA INLET TEMP (DEGF) TOAL FEEDWATER FLOW (LB/HR) BIOMASS FUEL FLOW (TPH) PROPANE FLOW (SCFH) FWP DISCH TEMP (DEGF) ECONOMIZER OUT FW TEMP (DEGF) SH OUT STEAM TEMP SH OUTLET STEAM PRESS (PSI) SH OUTLET FLUE GAS TEMP (DEGF) SH OUTLET FLUE GAS TEMP (DEGF) 7/4/07 4: , , , /4/07 4: , , , /4/07 4: , , , /4/07 4: , , , /4/07 4: , , , /4/07 4: , , , /4/07 4: , , , /4/07 4: , , , /4/07 4: , , , /4/07 4: , , , /4/07 4: , , , /4/07 4: , , , /4/07 5: , , , /4/07 5: , , , /4/07 5: , , , /4/07 5: , , , /4/07 5: , , , /4/07 5: , , , /4/07 5: , , , /4/07 5: , , , /4/07 5: , , , /4/07 5: , , , /4/07 5: , , , /4/07 5: , , , /4/07 5: , , , /4/07 5: , , , /4/07 5: , , , /4/07 5: , , , /4/07 5: , , , /4/07 5: , , , /4/07 5: , , , /4/07 5: , , , /4/07 5: , , , /4/07 5: , , , /4/07 5: , , , /4/07 5: , , , /4/07 5: , , , /4/07 5: , , , /4/07 5: , , , /4/07 5: , , , /4/07 5: , , , /4/07 5: , , , /4/07 5: , , , /4/07 5: , , , /4/07 5: , , , /4/07 5: , , , /4/07 5: , , , /4/07 5: , , , /4/07 5: , , , /4/07 5: , , , snc-07-benson.mn-comp#1-gases Sheet1 9/3/2007
118 5250-JI FI TIC FIC SCI FI TI TI TIC PI TI-015A 3223-TI-015B TURBINE OUTPUT (gross MW) STEAM FLOW (LB/HR) SDA INLET TEMP (DEGF) TOAL FEEDWATER FLOW (LB/HR) BIOMASS FUEL FLOW (TPH) PROPANE FLOW (SCFH) FWP DISCH TEMP (DEGF) ECONOMIZER OUT FW TEMP (DEGF) SH OUT STEAM TEMP SH OUTLET STEAM PRESS (PSI) SH OUTLET FLUE GAS TEMP (DEGF) SH OUTLET FLUE GAS TEMP (DEGF) 7/4/07 5: , , , /4/07 5: , , , /4/07 5: , , , /4/07 5: , , , /4/07 5: , , , /4/07 5: , , , /4/07 5: , , , /4/07 5: , , , /4/07 5: , , , /4/07 5: , , , /4/07 5: , , , /4/07 5: , , , /4/07 5: , , , /4/07 5: , , , /4/07 5: , , , /4/07 5: , , , /4/07 5: , , , /4/07 5: , , , /4/07 5: , , , /4/07 5: , , , /4/07 5: , , , /4/07 5: , , , /4/07 6: , , , /4/07 6: , , , /4/07 6: , , , /4/07 6: , , , /4/07 6: , , , /4/07 6: , , , /4/07 6: , , , /4/07 6: , , , /4/07 6: , , , /4/07 6: , , , /4/07 6: , , , /4/07 6: , , , /4/07 6: , , , /4/07 6: , , , /4/07 6: , , , /4/07 6: , , , /4/07 6: , , , /4/07 6: , , , /4/07 6: , , , /4/07 6: , , , /4/07 6: , , , /4/07 6: , , , /4/07 6: , , , /4/07 6: , , , /4/07 6: , , , /4/07 6: , , , /4/07 6: , , , /4/07 6: , , , snc-07-benson.mn-comp#1-gases Sheet1 9/3/2007
119 5250-JI FI TIC FIC SCI FI TI TI TIC PI TI-015A 3223-TI-015B TURBINE OUTPUT (gross MW) STEAM FLOW (LB/HR) SDA INLET TEMP (DEGF) TOAL FEEDWATER FLOW (LB/HR) BIOMASS FUEL FLOW (TPH) PROPANE FLOW (SCFH) FWP DISCH TEMP (DEGF) ECONOMIZER OUT FW TEMP (DEGF) SH OUT STEAM TEMP SH OUTLET STEAM PRESS (PSI) SH OUTLET FLUE GAS TEMP (DEGF) SH OUTLET FLUE GAS TEMP (DEGF) 7/4/07 6: , , , /4/07 6: , , , /4/07 6: , , , /4/07 6: , , , /4/07 6: , , , /4/07 6: , , , /4/07 6: , , , /4/07 6: , , , /4/07 6: , , , /4/07 6: , , , /4/07 6: , , , /4/07 6: , , , /4/07 6: , , , /4/07 6: , , , /4/07 6: , , , /4/07 6: , , , /4/07 6: , , , /4/07 6: , , , /4/07 6: , , , /4/07 6: , , , /4/07 6: , , , /4/07 6: , , , /4/07 6: , , , /4/07 6: , , , /4/07 6: , , , /4/07 6: , , , /4/07 6: , , , /4/07 6: , , , /4/07 6: , , , /4/07 6: , , , /4/07 6: , , , /4/07 6: , , , /4/07 7: , , , /4/07 7: , , , /4/07 7: , , , /4/07 7: , , , /4/07 7: , , , /4/07 7: , , , /4/07 7: , , , /4/07 7: , , , /4/07 7: , , , /4/07 7: , , , /4/07 7: , , , /4/07 7: , , , /4/07 7: , , , /4/07 7: , , , /4/07 7: , , , /4/07 7: , , , /4/07 7: , , , /4/07 7: , , , snc-07-benson.mn-comp#1-gases Sheet1 9/3/2007
120 5250-JI FI TIC FIC SCI FI TI TI TIC PI TI-015A 3223-TI-015B TURBINE OUTPUT (gross MW) STEAM FLOW (LB/HR) SDA INLET TEMP (DEGF) TOAL FEEDWATER FLOW (LB/HR) BIOMASS FUEL FLOW (TPH) PROPANE FLOW (SCFH) FWP DISCH TEMP (DEGF) ECONOMIZER OUT FW TEMP (DEGF) SH OUT STEAM TEMP SH OUTLET STEAM PRESS (PSI) SH OUTLET FLUE GAS TEMP (DEGF) SH OUTLET FLUE GAS TEMP (DEGF) 7/4/07 7: , , , /4/07 7: , , , /4/07 7: , , , /4/07 7: , , , /4/07 7: , , , /4/07 7: , , , /4/07 7: , , , /4/07 7: , , , /4/07 7: , , , /4/07 7: , , , /4/07 7: , , , /4/07 7: , , , /4/07 7: , , , /4/07 7: , , , /4/07 7: , , , /4/07 7: , , , /4/07 7: , , , /4/07 7: , , , /4/07 7: , , , /4/07 7: , , , /4/07 7: , , , /4/07 7: , , , /4/07 7: , , , /4/07 7: , , , /4/07 7: , , , /4/07 7: , , , /4/07 7: , , , /4/07 7: , , , /4/07 7: , , , /4/07 7: , , , /4/07 7: , , , /4/07 7: , , , /4/07 7: , , , /4/07 7: , , , /4/07 7: , , , /4/07 7: , , , /4/07 7: , , , /4/07 7: , , , /4/07 7: , , , /4/07 7: , , , /4/07 7: , , , snc-07-benson.mn-comp#1-gases Sheet1 9/3/2007
121 7/3/07 17:58 7/3/07 17:59 7/3/07 18:00 7/3/07 18:01 7/3/07 18:02 7/3/07 18:03 7/3/07 18:04 7/3/07 18:05 7/3/07 18:06 7/3/07 18:07 7/3/07 18:08 7/3/07 18:09 7/3/07 18:10 7/3/07 18:11 7/3/07 18:12 7/3/07 18:13 7/3/07 18:14 7/3/07 18:15 7/3/07 18:16 7/3/07 18:17 7/3/07 18:18 7/3/07 18:19 7/3/07 18:20 7/3/07 18:21 7/3/07 18:22 7/3/07 18:23 7/3/07 18:24 7/3/07 18:25 7/3/07 18:26 7/3/07 18:27 7/3/07 18:28 7/3/07 18:29 7/3/07 18:30 7/3/07 18:31 7/3/07 18:32 7/3/07 18:33 7/3/07 18:34 7/3/07 18:35 7/3/07 18:36 7/3/07 18:37 7/3/07 18:38 7/3/07 18:39 7/3/07 18:40 7/3/07 18:41 7/3/07 18:42 7/3/07 18:43 7/3/07 18:44 7/3/07 18:45 7/3/07 18:46 7/3/07 18: TI-015C 3222-FI FI FI FI-011 LS_FLOW QW_FLOW 3521-TI FI-501A 3561-FI-501B 3561-FI-501C 3241-FI-005 SH OUTLET FLUE GAS TEMP (DEGF) SECONDARY AIR FLOW (LB/HR) PRIMARY AIR FLOW (LB/HR) DISTRIBUTION AIR FLOW (LB/HR) SDA TOTAL SLURRY FLOW (GPM) SDA QUENCH WATER FLOW (GPM) UREA INJECTION PUMP 1 UREA INJECTION PUMP 2 UREA INJECTION PUMP 3 SOOTBLOWER STEAM FLOW (LB/HR) CEMS STACK FLOW (SCFM) SDA OUTLET TEMP (DEGF) , , , , , , , , , , , , , , , , , , , , , , , , , , , , , , , , , , , , , , , , , , , , , , , , , , , , , , , , , , , , , , , , , , , , , , , , , , , , , , , , , , , , , , , , , , , , , , , , , , , , , , , , , , , , , , , , , , , , , , , , , , , , , , , , , , , , , , , , , , , , , , , , , , , , , , , , , , , , , , , , , , , , , , , , , , , , , , , , , , , snc-07-benson.mn-comp#1-gases Sheet1 9/3/2007
122 7/3/07 18:48 7/3/07 18:49 7/3/07 18:50 7/3/07 18:51 7/3/07 18:52 7/3/07 18:53 7/3/07 18:54 7/3/07 18:55 7/3/07 18:56 7/3/07 18:57 7/3/07 18:58 7/3/07 18:59 7/3/07 19:00 7/3/07 19:01 7/3/07 19:02 7/3/07 19:03 7/3/07 19:04 7/3/07 19:05 7/3/07 19:06 7/3/07 19:07 7/3/07 19:08 7/3/07 19:09 7/3/07 19:10 7/3/07 19:11 7/3/07 19:12 7/3/07 19:13 7/3/07 19:14 7/3/07 19:15 7/3/07 19:16 7/3/07 19:17 7/3/07 19:18 7/3/07 19:19 7/3/07 19:20 7/3/07 19:21 7/3/07 19:22 7/3/07 19:23 7/3/07 19:24 7/3/07 19:25 7/3/07 19:26 7/3/07 19:27 7/3/07 19:28 7/3/07 19:29 7/3/07 19:30 7/3/07 19:31 7/3/07 19:32 7/3/07 19:33 7/3/07 19:34 7/3/07 19:35 7/3/07 19:36 7/3/07 19: TI-015C 3222-FI FI FI FI-011 LS_FLOW QW_FLOW 3521-TI FI-501A 3561-FI-501B 3561-FI-501C 3241-FI-005 SH OUTLET FLUE GAS TEMP (DEGF) SECONDARY AIR FLOW (LB/HR) PRIMARY AIR FLOW (LB/HR) DISTRIBUTION AIR FLOW (LB/HR) SDA TOTAL SLURRY FLOW (GPM) SDA QUENCH WATER FLOW (GPM) UREA INJECTION PUMP 1 UREA INJECTION PUMP 2 UREA INJECTION PUMP 3 SOOTBLOWER STEAM FLOW (LB/HR) CEMS STACK FLOW (SCFM) SDA OUTLET TEMP (DEGF) , , , , , , , , , , , , , , , , , , , , , , , , , , , , , , , , , , , , , , , , , , , , , , , , , , , , , , , , , , , , , , , , , , , , , , , , , , , , , , , , , , , , , , , , , , , , , , , , , , , , , , , , , , , , , , , , , , , , , , , , , , , , , , , , , , , , , , , , , , , , , , , , , , , , , , , , , , , , , , , , , , , , , , , , , , , snc-07-benson.mn-comp#1-gases Sheet1 9/3/2007
123 7/3/07 19:38 7/3/07 19:39 7/3/07 19:40 7/3/07 19:41 7/3/07 19:42 7/3/07 19:43 7/3/07 19:44 7/3/07 19:45 7/3/07 19:46 7/3/07 19:47 7/3/07 19:48 7/3/07 19:49 7/3/07 19:50 7/3/07 19:51 7/3/07 19:52 7/3/07 19:53 7/3/07 19:54 7/3/07 19:55 7/3/07 19:56 7/3/07 19:57 7/3/07 19:58 7/3/07 19:59 7/3/07 20:00 7/3/07 20:01 7/3/07 20:02 7/3/07 20:03 7/3/07 20:04 7/3/07 20:05 7/3/07 20:06 7/3/07 20:07 7/3/07 20:08 7/3/07 20:09 7/3/07 20:10 7/3/07 20:11 7/3/07 20:12 7/3/07 20:13 7/3/07 20:14 7/3/07 20:15 7/3/07 20:16 7/3/07 20:17 7/3/07 20:18 7/3/07 20:19 7/3/07 20:20 7/3/07 20:21 7/3/07 20:22 7/3/07 20:23 7/3/07 20:24 7/3/07 20:25 7/3/07 20:26 7/3/07 20: TI-015C 3222-FI FI FI FI-011 LS_FLOW QW_FLOW 3521-TI FI-501A 3561-FI-501B 3561-FI-501C 3241-FI-005 SH OUTLET FLUE GAS TEMP (DEGF) SECONDARY AIR FLOW (LB/HR) PRIMARY AIR FLOW (LB/HR) DISTRIBUTION AIR FLOW (LB/HR) SDA TOTAL SLURRY FLOW (GPM) SDA QUENCH WATER FLOW (GPM) UREA INJECTION PUMP 1 UREA INJECTION PUMP 2 UREA INJECTION PUMP 3 SOOTBLOWER STEAM FLOW (LB/HR) CEMS STACK FLOW (SCFM) SDA OUTLET TEMP (DEGF) , , , , , , , , , , , , , , , , , , , , , , , , , , , , , , , , , , , , , , , , , , , , , , , , , , , , , , , , , , , , , , , , , , , , , , , , , , , , , , , , , , , , , , , , , , , , , , , , , , , , , , , , , , , , , , , , , , , , , , , , , , , , , , , , , , , , , , , , , , , , , , , , , , , , , , , , , , , , , , , , , , , , , , , , , , , , snc-07-benson.mn-comp#1-gases Sheet1 9/3/2007
124 7/3/07 20:28 7/3/07 20:29 7/3/07 20:30 7/3/07 20:31 7/3/07 20:32 7/3/07 20:33 7/3/07 20:34 7/3/07 20:35 7/3/07 20:36 7/3/07 20:37 7/3/07 20:38 7/3/07 20:39 7/3/07 20:40 7/3/07 20:41 7/3/07 20:42 7/3/07 20:43 7/3/07 20:44 7/3/07 20:45 7/3/07 20:46 7/3/07 20:47 7/3/07 20:48 7/3/07 20:49 7/3/07 20:50 7/3/07 20:51 7/3/07 20:52 7/3/07 20:53 7/3/07 20:54 7/3/07 20:55 7/3/07 20:56 7/3/07 20:57 7/3/07 20:58 7/3/07 20:59 7/3/07 21:00 7/3/07 21:01 7/3/07 21:02 7/3/07 21:03 7/3/07 21:04 7/3/07 21:05 7/3/07 21:06 7/3/07 21:07 7/3/07 21:08 7/3/07 21:09 7/3/07 21:10 7/3/07 21:11 7/3/07 21:12 7/3/07 21:13 7/3/07 21:14 7/3/07 21:15 7/3/07 21:16 7/3/07 21: TI-015C 3222-FI FI FI FI-011 LS_FLOW QW_FLOW 3521-TI FI-501A 3561-FI-501B 3561-FI-501C 3241-FI-005 SH OUTLET FLUE GAS TEMP (DEGF) SECONDARY AIR FLOW (LB/HR) PRIMARY AIR FLOW (LB/HR) DISTRIBUTION AIR FLOW (LB/HR) SDA TOTAL SLURRY FLOW (GPM) SDA QUENCH WATER FLOW (GPM) UREA INJECTION PUMP 1 UREA INJECTION PUMP 2 UREA INJECTION PUMP 3 SOOTBLOWER STEAM FLOW (LB/HR) CEMS STACK FLOW (SCFM) SDA OUTLET TEMP (DEGF) , , , , , , , , , , , , , , , , , , , , , , , , , , , , , , , , , , , , , , , , , , , , , , , , , , , , , , , , , , , , , , , , , , , , , , , , , , , , , , , , , , , , , , , , , , , , , , , , , , , , , , , , , , , , , , , , , , , , , , , , , , , , , , , , , , , , , , , , , , , , , , , , , , , , , , , , , , , , , , , , , , , , , , snc-07-benson.mn-comp#1-gases Sheet1 9/3/2007
125 7/3/07 21:18 7/3/07 21:19 7/3/07 21:20 7/3/07 21:21 7/3/07 21:22 7/3/07 21:23 7/3/07 21:24 7/3/07 21:25 7/3/07 21:26 7/3/07 21:27 7/3/07 21:28 7/3/07 21:29 7/3/07 21:30 7/3/07 21:31 7/3/07 21:32 7/3/07 21:33 7/3/07 21:34 7/3/07 21:35 7/3/07 21:36 7/3/07 21:37 7/3/07 21:38 7/3/07 21:39 7/3/07 21:40 7/3/07 21:41 7/3/07 21:42 7/3/07 21:43 7/3/07 21:44 7/3/07 21:45 7/3/07 21:46 7/3/07 21:47 7/3/07 21:48 7/3/07 21:49 7/3/07 21:50 7/3/07 21:51 7/3/07 21:52 7/3/07 21:53 7/3/07 21:54 7/3/07 21:55 7/3/07 21:56 7/3/07 21:57 7/3/07 21:58 7/3/07 21:59 7/3/07 22:00 7/3/07 22:01 7/3/07 22:02 7/3/07 22:03 7/3/07 22:04 7/3/07 22:05 7/3/07 22:06 7/3/07 22: TI-015C 3222-FI FI FI FI-011 LS_FLOW QW_FLOW 3521-TI FI-501A 3561-FI-501B 3561-FI-501C 3241-FI-005 SH OUTLET FLUE GAS TEMP (DEGF) SECONDARY AIR FLOW (LB/HR) PRIMARY AIR FLOW (LB/HR) DISTRIBUTION AIR FLOW (LB/HR) SDA TOTAL SLURRY FLOW (GPM) SDA QUENCH WATER FLOW (GPM) UREA INJECTION PUMP 1 UREA INJECTION PUMP 2 UREA INJECTION PUMP 3 SOOTBLOWER STEAM FLOW (LB/HR) CEMS STACK FLOW (SCFM) SDA OUTLET TEMP (DEGF) , , , , , , , , , , , , , , , , , , , , , , , , , , , , , , , , , , , , , , , , , , , , , , , , , , , , , , , , , , , , , , , , , , , , , , , , , , , , , , , , , , , , , , , , , , , , , , , , , , , , , , , , , , , , , , , , , , , , , , , , , , , , , , , , , , , , , , , , , , , , , , , , , , , , , , , , , , , , , , , , , , , , , , snc-07-benson.mn-comp#1-gases Sheet1 9/3/2007
126 7/3/07 22:08 7/3/07 22:09 7/3/07 22:10 7/3/07 22:11 7/3/07 22:12 7/3/07 22:13 7/3/07 22:14 7/3/07 22:15 7/3/07 22:16 7/3/07 22:17 7/3/07 22:18 7/3/07 22:19 7/3/07 22:20 7/3/07 22:21 7/3/07 22:22 7/3/07 22:23 7/3/07 22:24 7/3/07 22:25 7/3/07 22:26 7/3/07 22:27 7/3/07 22:28 7/3/07 22:29 7/3/07 22:30 7/3/07 22:31 7/3/07 22:32 7/3/07 22:33 7/3/07 22:34 7/3/07 22:35 7/3/07 22:36 7/3/07 22:37 7/3/07 22:38 7/3/07 22:39 7/3/07 22:40 7/3/07 22:41 7/3/07 22:42 7/3/07 22:43 7/3/07 22:44 7/3/07 22:45 7/3/07 22:46 7/3/07 22:47 7/3/07 22:48 7/3/07 22:49 7/3/07 22:50 7/3/07 22:51 7/3/07 22:52 7/3/07 22:53 7/3/07 22:54 7/3/07 22:55 7/3/07 22:56 7/3/07 22: TI-015C 3222-FI FI FI FI-011 LS_FLOW QW_FLOW 3521-TI FI-501A 3561-FI-501B 3561-FI-501C 3241-FI-005 SH OUTLET FLUE GAS TEMP (DEGF) SECONDARY AIR FLOW (LB/HR) PRIMARY AIR FLOW (LB/HR) DISTRIBUTION AIR FLOW (LB/HR) SDA TOTAL SLURRY FLOW (GPM) SDA QUENCH WATER FLOW (GPM) UREA INJECTION PUMP 1 UREA INJECTION PUMP 2 UREA INJECTION PUMP 3 SOOTBLOWER STEAM FLOW (LB/HR) CEMS STACK FLOW (SCFM) SDA OUTLET TEMP (DEGF) , , , , , , , , , , , , , , , , , , , , , , , , , , , , , , , , , , , , , , , , , , , , , , , , , , , , , , , , , , , , , , , , , , , , , , , , , , , , , , , , , , , , , , , , , , , , , , , , , , , , , , , , , , , , , , , , , , , , , , , , , , , , , , , , , , , , , , , , , , , , , , , , , , , , , , , , , , , , , , , , , , , , , , , , , , , , , snc-07-benson.mn-comp#1-gases Sheet1 9/3/2007
127 7/3/07 22:58 7/3/07 22:59 7/3/07 23:00 7/3/07 23:01 7/3/07 23:02 7/3/07 23:03 7/3/07 23:04 7/3/07 23:05 7/3/07 23:06 7/3/07 23:07 7/3/07 23:08 7/3/07 23:09 7/3/07 23:10 7/3/07 23:11 7/3/07 23:12 7/3/07 23:13 7/3/07 23:14 7/3/07 23:15 7/3/07 23:16 7/3/07 23:17 7/3/07 23:18 7/3/07 23:19 7/3/07 23:20 7/3/07 23:21 7/3/07 23:22 7/3/07 23:23 7/3/07 23:24 7/3/07 23:25 7/3/07 23:26 7/3/07 23:27 7/3/07 23:28 7/3/07 23:29 7/3/07 23:30 7/3/07 23:31 7/3/07 23:32 7/3/07 23:33 7/3/07 23:34 7/3/07 23:35 7/3/07 23:36 7/3/07 23:37 7/3/07 23:38 7/3/07 23:39 7/3/07 23:40 7/3/07 23:41 7/3/07 23:42 7/3/07 23:43 7/3/07 23:44 7/3/07 23:45 7/3/07 23:46 7/3/07 23: TI-015C 3222-FI FI FI FI-011 LS_FLOW QW_FLOW 3521-TI FI-501A 3561-FI-501B 3561-FI-501C 3241-FI-005 SH OUTLET FLUE GAS TEMP (DEGF) SECONDARY AIR FLOW (LB/HR) PRIMARY AIR FLOW (LB/HR) DISTRIBUTION AIR FLOW (LB/HR) SDA TOTAL SLURRY FLOW (GPM) SDA QUENCH WATER FLOW (GPM) UREA INJECTION PUMP 1 UREA INJECTION PUMP 2 UREA INJECTION PUMP 3 SOOTBLOWER STEAM FLOW (LB/HR) CEMS STACK FLOW (SCFM) SDA OUTLET TEMP (DEGF) , , , , , , , , , , , , , , , , , , , , , , , , , , , , , , , , , , , , , , , , , , , , , , , , , , , , , , , , , , , , , , , , , , , , , , , , , , , , , , , , , , , , , , , , , , , , , , , , , , , , , , , , , , , , , , , , , , , , , , , , , , , , , , , , , , , , , , , , , , , , , , , , , , , , , , , , , , , , , , , , , , , , , , , , , , , , , , , , , , , , , , , , , , , , , , , , , , , , , , , , snc-07-benson.mn-comp#1-gases Sheet1 9/3/2007
128 7/3/07 23:48 7/3/07 23:49 7/3/07 23:50 7/3/07 23:51 7/3/07 23:52 7/3/07 23:53 7/3/07 23:54 7/3/07 23:55 7/3/07 23:56 7/3/07 23:57 7/3/07 23:58 7/3/07 23:59 7/4/07 0:00 7/4/07 0:01 7/4/07 0:02 7/4/07 0:03 7/4/07 0:04 7/4/07 0:05 7/4/07 0:06 7/4/07 0:07 7/4/07 0:08 7/4/07 0:09 7/4/07 0:10 7/4/07 0:11 7/4/07 0:12 7/4/07 0:13 7/4/07 0:14 7/4/07 0:15 7/4/07 0:16 7/4/07 0:17 7/4/07 0:18 7/4/07 0:19 7/4/07 0:20 7/4/07 0:21 7/4/07 0:22 7/4/07 0:23 7/4/07 0:24 7/4/07 0:25 7/4/07 0:26 7/4/07 0:27 7/4/07 0:28 7/4/07 0:29 7/4/07 0:30 7/4/07 0:31 7/4/07 0:32 7/4/07 0:33 7/4/07 0:34 7/4/07 0:35 7/4/07 0:36 7/4/07 0: TI-015C 3222-FI FI FI FI-011 LS_FLOW QW_FLOW 3521-TI FI-501A 3561-FI-501B 3561-FI-501C 3241-FI-005 SH OUTLET FLUE GAS TEMP (DEGF) SECONDARY AIR FLOW (LB/HR) PRIMARY AIR FLOW (LB/HR) DISTRIBUTION AIR FLOW (LB/HR) SDA TOTAL SLURRY FLOW (GPM) SDA QUENCH WATER FLOW (GPM) UREA INJECTION PUMP 1 UREA INJECTION PUMP 2 UREA INJECTION PUMP 3 SOOTBLOWER STEAM FLOW (LB/HR) CEMS STACK FLOW (SCFM) SDA OUTLET TEMP (DEGF) , , , , , , , , , , , , , , , , , , , , , , , , , , , , , , , , , , , , , , , , , , , , , , , , , , , , , , , , , , , , , , , , , , , , , , , , , , , , , , , , , , , , , , , , , , , , , , , , , , , , , , , , , , , , , , , , , , , , , , , , , , , , , , , , , , , , , , , , , , , , , , , , , , , , , , , , , , , , , , , , , , , , , , , , , , , , , , , , , , , , , , , , , , , , , , , , , , , , , , , snc-07-benson.mn-comp#1-gases Sheet1 9/3/2007
129 7/4/07 0:38 7/4/07 0:39 7/4/07 0:40 7/4/07 0:41 7/4/07 0:42 7/4/07 0:43 7/4/07 0:44 7/4/07 0:45 7/4/07 0:46 7/4/07 0:47 7/4/07 0:48 7/4/07 0:49 7/4/07 0:50 7/4/07 0:51 7/4/07 0:52 7/4/07 0:53 7/4/07 0:54 7/4/07 0:55 7/4/07 0:56 7/4/07 0:57 7/4/07 0:58 7/4/07 0:59 7/4/07 1:00 7/4/07 1:01 7/4/07 1:02 7/4/07 1:03 7/4/07 1:04 7/4/07 1:05 7/4/07 1:06 7/4/07 1:07 7/4/07 1:08 7/4/07 1:09 7/4/07 1:10 7/4/07 1:11 7/4/07 1:12 7/4/07 1:13 7/4/07 1:14 7/4/07 1:15 7/4/07 1:16 7/4/07 1:17 7/4/07 1:18 7/4/07 1:19 7/4/07 1:20 7/4/07 1:21 7/4/07 1:22 7/4/07 1:23 7/4/07 1:24 7/4/07 1:25 7/4/07 1:26 7/4/07 1: TI-015C 3222-FI FI FI FI-011 LS_FLOW QW_FLOW 3521-TI FI-501A 3561-FI-501B 3561-FI-501C 3241-FI-005 SH OUTLET FLUE GAS TEMP (DEGF) SECONDARY AIR FLOW (LB/HR) PRIMARY AIR FLOW (LB/HR) DISTRIBUTION AIR FLOW (LB/HR) SDA TOTAL SLURRY FLOW (GPM) SDA QUENCH WATER FLOW (GPM) UREA INJECTION PUMP 1 UREA INJECTION PUMP 2 UREA INJECTION PUMP 3 SOOTBLOWER STEAM FLOW (LB/HR) CEMS STACK FLOW (SCFM) SDA OUTLET TEMP (DEGF) , , , , , , , , , , , , , , , , , , , , , , , , , , , , , , , , , , , , , , , , , , , , , , , , , , , , , , , , , , , , , , , , , , , , , , , , , , , , , , , , , , , , , , , , , , , , , , , , , , , , , , , , , , , , , , , , , , , , , , , , , , , , , , , , , , , , , , , , , , , , , , , , , , , , , , , , , , , , , , , , , , , , , , , , , , , , , , , , , , , , , , , , , , snc-07-benson.mn-comp#1-gases Sheet1 9/3/2007
130 7/4/07 1:28 7/4/07 1:29 7/4/07 1:30 7/4/07 1:31 7/4/07 1:32 7/4/07 1:33 7/4/07 1:34 7/4/07 1:35 7/4/07 1:36 7/4/07 1:37 7/4/07 1:38 7/4/07 1:39 7/4/07 1:40 7/4/07 1:41 7/4/07 1:42 7/4/07 1:43 7/4/07 1:44 7/4/07 1:45 7/4/07 1:46 7/4/07 1:47 7/4/07 1:48 7/4/07 1:49 7/4/07 1:50 7/4/07 1:51 7/4/07 1:52 7/4/07 1:53 7/4/07 1:54 7/4/07 1:55 7/4/07 1:56 7/4/07 1:57 7/4/07 1:58 7/4/07 1:59 7/4/07 2:00 7/4/07 2:01 7/4/07 2:02 7/4/07 2:03 7/4/07 2:04 7/4/07 2:05 7/4/07 2:06 7/4/07 2:07 7/4/07 2:08 7/4/07 2:09 7/4/07 2:10 7/4/07 2:11 7/4/07 2:12 7/4/07 2:13 7/4/07 2:14 7/4/07 2:15 7/4/07 2:16 7/4/07 2: TI-015C 3222-FI FI FI FI-011 LS_FLOW QW_FLOW 3521-TI FI-501A 3561-FI-501B 3561-FI-501C 3241-FI-005 SH OUTLET FLUE GAS TEMP (DEGF) SECONDARY AIR FLOW (LB/HR) PRIMARY AIR FLOW (LB/HR) DISTRIBUTION AIR FLOW (LB/HR) SDA TOTAL SLURRY FLOW (GPM) SDA QUENCH WATER FLOW (GPM) UREA INJECTION PUMP 1 UREA INJECTION PUMP 2 UREA INJECTION PUMP 3 SOOTBLOWER STEAM FLOW (LB/HR) CEMS STACK FLOW (SCFM) SDA OUTLET TEMP (DEGF) , , , , , , , , , , , , , , , , , , , , , , , , , , , , , , , , , , , , , , , , , , , , , , , , , , , , , , , , , , , , , , , , , , , , , , , , , , , , , , , , , , , , , , , , , , , , , , , , , , , , , , , , , , , , , , , , , , , , , , , , , , , , , , , , , , , , , , , , , , , , , , , , , , , , , , , , , , , , , , , , , , , , , , , , , , , , , , , snc-07-benson.mn-comp#1-gases Sheet1 9/3/2007
131 7/4/07 2:18 7/4/07 2:19 7/4/07 2:20 7/4/07 2:21 7/4/07 2:22 7/4/07 2:23 7/4/07 2:24 7/4/07 2:25 7/4/07 2:26 7/4/07 2:27 7/4/07 2:28 7/4/07 2:29 7/4/07 2:30 7/4/07 2:31 7/4/07 2:32 7/4/07 2:33 7/4/07 2:34 7/4/07 2:35 7/4/07 2:36 7/4/07 2:37 7/4/07 2:38 7/4/07 2:39 7/4/07 2:40 7/4/07 2:41 7/4/07 2:42 7/4/07 2:43 7/4/07 2:44 7/4/07 2:45 7/4/07 2:46 7/4/07 2:47 7/4/07 2:48 7/4/07 2:49 7/4/07 2:50 7/4/07 2:51 7/4/07 2:52 7/4/07 2:53 7/4/07 2:54 7/4/07 2:55 7/4/07 2:56 7/4/07 2:57 7/4/07 2:58 7/4/07 2:59 7/4/07 3:00 7/4/07 3:01 7/4/07 3:02 7/4/07 3:03 7/4/07 3:04 7/4/07 3:05 7/4/07 3:06 7/4/07 3: TI-015C 3222-FI FI FI FI-011 LS_FLOW QW_FLOW 3521-TI FI-501A 3561-FI-501B 3561-FI-501C 3241-FI-005 SH OUTLET FLUE GAS TEMP (DEGF) SECONDARY AIR FLOW (LB/HR) PRIMARY AIR FLOW (LB/HR) DISTRIBUTION AIR FLOW (LB/HR) SDA TOTAL SLURRY FLOW (GPM) SDA QUENCH WATER FLOW (GPM) UREA INJECTION PUMP 1 UREA INJECTION PUMP 2 UREA INJECTION PUMP 3 SOOTBLOWER STEAM FLOW (LB/HR) CEMS STACK FLOW (SCFM) SDA OUTLET TEMP (DEGF) , , , , , , , , , , , , , , , , , , , , , , , , , , , , , , , , , , , , , , , , , , , , , , , , , , , , , , , , , , , , , , , , , , , , , , , , , , , , , , , , , , , , , , , , , , , , , , , , , , , , , , , , , , , , , , , , , , , , , , , , , , , , , , , , , , , , , , , , , , , , , , , , , , , , , , , , , , , , , , , , , , , , , , , , , , , , snc-07-benson.mn-comp#1-gases Sheet1 9/3/2007
132 7/4/07 3:08 7/4/07 3:09 7/4/07 3:10 7/4/07 3:11 7/4/07 3:12 7/4/07 3:13 7/4/07 3:14 7/4/07 3:15 7/4/07 3:16 7/4/07 3:17 7/4/07 3:18 7/4/07 3:19 7/4/07 3:20 7/4/07 3:21 7/4/07 3:22 7/4/07 3:23 7/4/07 3:24 7/4/07 3:25 7/4/07 3:26 7/4/07 3:27 7/4/07 3:28 7/4/07 3:29 7/4/07 3:30 7/4/07 3:31 7/4/07 3:32 7/4/07 3:33 7/4/07 3:34 7/4/07 3:35 7/4/07 3:36 7/4/07 3:37 7/4/07 3:38 7/4/07 3:39 7/4/07 3:40 7/4/07 3:41 7/4/07 3:42 7/4/07 3:43 7/4/07 3:44 7/4/07 3:45 7/4/07 3:46 7/4/07 3:47 7/4/07 3:48 7/4/07 3:49 7/4/07 3:50 7/4/07 3:51 7/4/07 3:52 7/4/07 3:53 7/4/07 3:54 7/4/07 3:55 7/4/07 3:56 7/4/07 3: TI-015C 3222-FI FI FI FI-011 LS_FLOW QW_FLOW 3521-TI FI-501A 3561-FI-501B 3561-FI-501C 3241-FI-005 SH OUTLET FLUE GAS TEMP (DEGF) SECONDARY AIR FLOW (LB/HR) PRIMARY AIR FLOW (LB/HR) DISTRIBUTION AIR FLOW (LB/HR) SDA TOTAL SLURRY FLOW (GPM) SDA QUENCH WATER FLOW (GPM) UREA INJECTION PUMP 1 UREA INJECTION PUMP 2 UREA INJECTION PUMP 3 SOOTBLOWER STEAM FLOW (LB/HR) CEMS STACK FLOW (SCFM) SDA OUTLET TEMP (DEGF) , , , , , , , , , , , , , , , , , , , , , , , , , , , , , , , , , , , , , , , , , , , , , , , , , , , , , , , , , , , , , , , , , , , , , , , , , , , , , , , , , , , , , , , , , , , , , , , , , , , , , , , , , , , , , , , , , , , , , , , , , , , , , , , , , , , , , , , , , , , , , , , , , , , , , , , , , , , , , , , , , , , , , , , , , , , , , , , , snc-07-benson.mn-comp#1-gases Sheet1 9/3/2007
133 7/4/07 3:58 7/4/07 3:59 7/4/07 4:00 7/4/07 4:01 7/4/07 4:02 7/4/07 4:03 7/4/07 4:04 7/4/07 4:05 7/4/07 4:06 7/4/07 4:07 7/4/07 4:08 7/4/07 4:09 7/4/07 4:10 7/4/07 4:11 7/4/07 4:12 7/4/07 4:13 7/4/07 4:14 7/4/07 4:15 7/4/07 4:16 7/4/07 4:17 7/4/07 4:18 7/4/07 4:19 7/4/07 4:20 7/4/07 4:21 7/4/07 4:22 7/4/07 4:23 7/4/07 4:24 7/4/07 4:25 7/4/07 4:26 7/4/07 4:27 7/4/07 4:28 7/4/07 4:29 7/4/07 4:30 7/4/07 4:31 7/4/07 4:32 7/4/07 4:33 7/4/07 4:34 7/4/07 4:35 7/4/07 4:36 7/4/07 4:37 7/4/07 4:38 7/4/07 4:39 7/4/07 4:40 7/4/07 4:41 7/4/07 4:42 7/4/07 4:43 7/4/07 4:44 7/4/07 4:45 7/4/07 4:46 7/4/07 4: TI-015C 3222-FI FI FI FI-011 LS_FLOW QW_FLOW 3521-TI FI-501A 3561-FI-501B 3561-FI-501C 3241-FI-005 SH OUTLET FLUE GAS TEMP (DEGF) SECONDARY AIR FLOW (LB/HR) PRIMARY AIR FLOW (LB/HR) DISTRIBUTION AIR FLOW (LB/HR) SDA TOTAL SLURRY FLOW (GPM) SDA QUENCH WATER FLOW (GPM) UREA INJECTION PUMP 1 UREA INJECTION PUMP 2 UREA INJECTION PUMP 3 SOOTBLOWER STEAM FLOW (LB/HR) CEMS STACK FLOW (SCFM) SDA OUTLET TEMP (DEGF) , , , , , , , , , , , , , , , , , , , , , , , , , , , , , , , , , , , , , , , , , , , , , , , , , , , , , , , , , , , , , , , , , , , , , , , , , , , , , , , , , , , , , , , , , , , , , , , , , , , , , , , , , , , , , , , , , , , , , , , , , , , , , , , , , , , , , , , , , , , , , , , , , , , , , , , , , snc-07-benson.mn-comp#1-gases Sheet1 9/3/2007
134 7/4/07 4:48 7/4/07 4:49 7/4/07 4:50 7/4/07 4:51 7/4/07 4:52 7/4/07 4:53 7/4/07 4:54 7/4/07 4:55 7/4/07 4:56 7/4/07 4:57 7/4/07 4:58 7/4/07 4:59 7/4/07 5:00 7/4/07 5:01 7/4/07 5:02 7/4/07 5:03 7/4/07 5:04 7/4/07 5:05 7/4/07 5:06 7/4/07 5:07 7/4/07 5:08 7/4/07 5:09 7/4/07 5:10 7/4/07 5:11 7/4/07 5:12 7/4/07 5:13 7/4/07 5:14 7/4/07 5:15 7/4/07 5:16 7/4/07 5:17 7/4/07 5:18 7/4/07 5:19 7/4/07 5:20 7/4/07 5:21 7/4/07 5:22 7/4/07 5:23 7/4/07 5:24 7/4/07 5:25 7/4/07 5:26 7/4/07 5:27 7/4/07 5:28 7/4/07 5:29 7/4/07 5:30 7/4/07 5:31 7/4/07 5:32 7/4/07 5:33 7/4/07 5:34 7/4/07 5:35 7/4/07 5:36 7/4/07 5: TI-015C 3222-FI FI FI FI-011 LS_FLOW QW_FLOW 3521-TI FI-501A 3561-FI-501B 3561-FI-501C 3241-FI-005 SH OUTLET FLUE GAS TEMP (DEGF) SECONDARY AIR FLOW (LB/HR) PRIMARY AIR FLOW (LB/HR) DISTRIBUTION AIR FLOW (LB/HR) SDA TOTAL SLURRY FLOW (GPM) SDA QUENCH WATER FLOW (GPM) UREA INJECTION PUMP 1 UREA INJECTION PUMP 2 UREA INJECTION PUMP 3 SOOTBLOWER STEAM FLOW (LB/HR) CEMS STACK FLOW (SCFM) SDA OUTLET TEMP (DEGF) , , , , , , , , , , , , , , , , , , , , , , , , , , , , , , , , , , , , , , , , , , , , , , , , , , , , , , , , , , , , , , , , , , , , , , , , , , , , , , , , , , , , , , , , , , , , , , , , , , , , , , , , , , , , , , , , , , , , , , , , , , , , , , , , , , , , , , , , , , , , , , , , , , , , , , , , , , , , , , , , , , , , , , , snc-07-benson.mn-comp#1-gases Sheet1 9/3/2007
135 7/4/07 5:38 7/4/07 5:39 7/4/07 5:40 7/4/07 5:41 7/4/07 5:42 7/4/07 5:43 7/4/07 5:44 7/4/07 5:45 7/4/07 5:46 7/4/07 5:47 7/4/07 5:48 7/4/07 5:49 7/4/07 5:50 7/4/07 5:51 7/4/07 5:52 7/4/07 5:53 7/4/07 5:54 7/4/07 5:55 7/4/07 5:56 7/4/07 5:57 7/4/07 5:58 7/4/07 5:59 7/4/07 6:00 7/4/07 6:01 7/4/07 6:02 7/4/07 6:03 7/4/07 6:04 7/4/07 6:05 7/4/07 6:06 7/4/07 6:07 7/4/07 6:08 7/4/07 6:09 7/4/07 6:10 7/4/07 6:11 7/4/07 6:12 7/4/07 6:13 7/4/07 6:14 7/4/07 6:15 7/4/07 6:16 7/4/07 6:17 7/4/07 6:18 7/4/07 6:19 7/4/07 6:20 7/4/07 6:21 7/4/07 6:22 7/4/07 6:23 7/4/07 6:24 7/4/07 6:25 7/4/07 6:26 7/4/07 6: TI-015C 3222-FI FI FI FI-011 LS_FLOW QW_FLOW 3521-TI FI-501A 3561-FI-501B 3561-FI-501C 3241-FI-005 SH OUTLET FLUE GAS TEMP (DEGF) SECONDARY AIR FLOW (LB/HR) PRIMARY AIR FLOW (LB/HR) DISTRIBUTION AIR FLOW (LB/HR) SDA TOTAL SLURRY FLOW (GPM) SDA QUENCH WATER FLOW (GPM) UREA INJECTION PUMP 1 UREA INJECTION PUMP 2 UREA INJECTION PUMP 3 SOOTBLOWER STEAM FLOW (LB/HR) CEMS STACK FLOW (SCFM) SDA OUTLET TEMP (DEGF) , , , , , , , , , , , , , , , , , , , , , , , , , , , , , , , , , , , , , , , , , , , , , , , , , , , , , , , , , , , , , , , , , , , , , , , , , , , , , , , , , , , , , , , , , , , , , , , , , , , , , , , , , , , , , , , , , , , , , , , , , , , , , , , , , , , , , , , , , , , , , , , , , , , , , , , , , , , , , , , , , , , , , , , , , , , , , , , , , , , , , , , , , , , , , , , , , , , , , , , snc-07-benson.mn-comp#1-gases Sheet1 9/3/2007
136 7/4/07 6:28 7/4/07 6:29 7/4/07 6:30 7/4/07 6:31 7/4/07 6:32 7/4/07 6:33 7/4/07 6:34 7/4/07 6:35 7/4/07 6:36 7/4/07 6:37 7/4/07 6:38 7/4/07 6:39 7/4/07 6:40 7/4/07 6:41 7/4/07 6:42 7/4/07 6:43 7/4/07 6:44 7/4/07 6:45 7/4/07 6:46 7/4/07 6:47 7/4/07 6:48 7/4/07 6:49 7/4/07 6:50 7/4/07 6:51 7/4/07 6:52 7/4/07 6:53 7/4/07 6:54 7/4/07 6:55 7/4/07 6:56 7/4/07 6:57 7/4/07 6:58 7/4/07 6:59 7/4/07 7:00 7/4/07 7:01 7/4/07 7:02 7/4/07 7:03 7/4/07 7:04 7/4/07 7:05 7/4/07 7:06 7/4/07 7:07 7/4/07 7:08 7/4/07 7:09 7/4/07 7:10 7/4/07 7:11 7/4/07 7:12 7/4/07 7:13 7/4/07 7:14 7/4/07 7:15 7/4/07 7:16 7/4/07 7: TI-015C 3222-FI FI FI FI-011 LS_FLOW QW_FLOW 3521-TI FI-501A 3561-FI-501B 3561-FI-501C 3241-FI-005 SH OUTLET FLUE GAS TEMP (DEGF) SECONDARY AIR FLOW (LB/HR) PRIMARY AIR FLOW (LB/HR) DISTRIBUTION AIR FLOW (LB/HR) SDA TOTAL SLURRY FLOW (GPM) SDA QUENCH WATER FLOW (GPM) UREA INJECTION PUMP 1 UREA INJECTION PUMP 2 UREA INJECTION PUMP 3 SOOTBLOWER STEAM FLOW (LB/HR) CEMS STACK FLOW (SCFM) SDA OUTLET TEMP (DEGF) , , , , , , , , , , , , , , , , , , , , , , , , , , , , , , , , , , , , , , , , , , , , , , , , , , , , , , , , , , , , , , , , , , , , , , , , , , , , , , , , , , , , , , , , , , , , , , , , , , , , , , , , , , , , , , , , , , , , , , , , , , , , , , , , , , , , , , , , , , , , , , , , , , , , , , , , , , , , , , , , , , , , , , , , , , , , , , , , , , , , , , , , , , , , , , , , , , , , , , , , snc-07-benson.mn-comp#1-gases Sheet1 9/3/2007
137 7/4/07 7:18 7/4/07 7:19 7/4/07 7:20 7/4/07 7:21 7/4/07 7:22 7/4/07 7:23 7/4/07 7:24 7/4/07 7:25 7/4/07 7:26 7/4/07 7:27 7/4/07 7:28 7/4/07 7:29 7/4/07 7:30 7/4/07 7:31 7/4/07 7:32 7/4/07 7:33 7/4/07 7:34 7/4/07 7:35 7/4/07 7:36 7/4/07 7:37 7/4/07 7:38 7/4/07 7:39 7/4/07 7:40 7/4/07 7:41 7/4/07 7:42 7/4/07 7:43 7/4/07 7:44 7/4/07 7:45 7/4/07 7:46 7/4/07 7:47 7/4/07 7:48 7/4/07 7:49 7/4/07 7:50 7/4/07 7:51 7/4/07 7:52 7/4/07 7:53 7/4/07 7:54 7/4/07 7:55 7/4/07 7:56 7/4/07 7:57 7/4/07 7: TI-015C 3222-FI FI FI FI-011 LS_FLOW QW_FLOW 3521-TI FI-501A 3561-FI-501B 3561-FI-501C 3241-FI-005 SH OUTLET FLUE GAS TEMP (DEGF) SECONDARY AIR FLOW (LB/HR) PRIMARY AIR FLOW (LB/HR) DISTRIBUTION AIR FLOW (LB/HR) SDA TOTAL SLURRY FLOW (GPM) SDA QUENCH WATER FLOW (GPM) UREA INJECTION PUMP 1 UREA INJECTION PUMP 2 UREA INJECTION PUMP 3 SOOTBLOWER STEAM FLOW (LB/HR) CEMS STACK FLOW (SCFM) SDA OUTLET TEMP (DEGF) , , , , , , , , , , , , , , , , , , , , , , , , , , , , , , , , , , , , , , , , , , , , , , , , , , , , , , , , , , , , , , , , , , , , , , , , , , , , , , , , , , , , , , , , , , , , , , , , , , , , , , , , , , , , , , , , , , , , , , , , , , , , , , , , , , , , , , , , , , , , , , , , , , , , , , , , , , , , , , , , , , , , snc-07-benson.mn-comp#1-gases Sheet1 9/3/2007
138 Test High Load Run PM-10 TEST DATA FROM THE DCS Date and Time Leak Detection 1 Leak Detection 2 Leak Detection 3 Leak Detection 4 Leak Detection 5 Leak Detection 6 Leak Detection 7 Leak Detection 8 Baghouse DP 7/3/07 11:42 PM /3/07 11:47 PM /3/07 11:52 PM /3/07 11:57 PM /4/07 12:02 AM /4/07 12:07 AM /4/07 12:12 AM /4/07 12:17 AM /4/07 12:22 AM /4/07 12:27 AM /4/07 12:32 AM /4/07 12:37 AM /4/07 12:42 AM /4/07 12:47 AM /4/07 12:52 AM /4/07 12:57 AM /4/07 1:02 AM /4/07 1:07 AM /4/07 1:12 AM /4/07 1:17 AM /4/07 1:22 AM /4/07 1:27 AM /4/07 1:32 AM /4/07 1:37 AM /4/07 1:42 AM /4/07 1:47 AM /4/07 1:52 AM /4/07 1:57 AM /4/07 2:02 AM /4/07 2:07 AM /4/07 2:12 AM /4/07 2:17 AM /4/07 2:22 AM /4/07 2:27 AM /4/07 2:32 AM /4/07 2:37 AM /4/07 2:42 AM
139 PM-10 TEST DATA FROM THE DCS Test High Load Run Date and Time Leak Detection 1 Leak Detection 2 Leak Detection 3 Leak Detection 4 Leak Detection 5 Leak Detection 6 Leak Detection 7 Leak Detection 8 Baghouse DP 7/4/07 2:44 AM /4/07 2:49 AM /4/07 2:54 AM /4/07 2:59 AM /4/07 3:04 AM /4/07 3:09 AM /4/07 3:14 AM /4/07 3:19 AM /4/07 3:24 AM /4/07 3:29 AM /4/07 3:34 AM /4/07 3:39 AM /4/07 3:44 AM /4/07 3:49 AM /4/07 3:54 AM /4/07 3:59 AM /4/07 4:04 AM /4/07 4:09 AM /4/07 4:14 AM /4/07 4:19 AM /4/07 4:24 AM /4/07 4:29 AM /4/07 4:34 AM /4/07 4:39 AM /4/07 4:44 AM /4/07 4:49 AM /4/07 4:54 AM /4/07 4:59 AM /4/07 5:04 AM /4/07 5:09 AM /4/07 5:14 AM /4/07 5:19 AM /4/07 5:24 AM
140 PM-10 TEST DATA FROM THE DCS Test High Load Run Date and Time Leak Detection 1 Leak Detection 2 Leak Detection 3 Leak Detection 4 Leak Detection 5 Leak Detection 6 Leak Detection 7 Leak Detection 8 Baghouse DP 7/4/07 5:27 AM /4/07 5:32 AM /4/07 5:37 AM /4/07 5:42 AM /4/07 5:47 AM /4/07 5:52 AM /4/07 5:57 AM /4/07 6:02 AM /4/07 6:07 AM /4/07 6:12 AM /4/07 6:17 AM /4/07 6:22 AM /4/07 6:27 AM /4/07 6:32 AM /4/07 6:37 AM /4/07 6:42 AM /4/07 6:47 AM /4/07 6:52 AM /4/07 6:57 AM /4/07 7:02 AM /4/07 7:07 AM /4/07 7:12 AM /4/07 7:17 AM /4/07 7:22 AM /4/07 7:27 AM /4/07 7:32 AM /4/07 7:37 AM /4/07 7:42 AM /4/07 7:47 AM /4/07 7:52 AM /4/07 7:57 AM /4/07 8:02 AM
141 APPENDIX C CALIBRATION GAS CERTIFICATIONS
142
143
144
145
146
147
148
149
150
151
152 CC2463 (84.7).max
153
154 SC022886B (252).max
155
156 APPENDIX D QUALITY ASSURANCE AND QUALITY CONTROL DATA
157 QA/QC PROGRAM Air Hygiene ensures the quality and validity of its emission measurement and reporting procedures through a rigorous quality assurance (QA) program. The program is developed and administered by an internal QA team and encompasses five major areas: 1. QA reviews of reports, laboratory work, and field testing 2. Equipment calibration and maintenance 3. Chain-of-custody 4. Training 5. Knowledge of current test methods Each of these areas is discussed individually below. QA Reviews Air Hygiene s review procedure includes review of each source test report, along with laboratory and fieldwork, by the QA Team. The most important review is the one that takes place before a test program begins. The QA Team works closely with technical division personnel to prepare and review test protocols. Test protocol review includes selection of appropriate test procedures, evaluation of interferences or other restrictions that might preclude use of standard test procedures, and evaluation and/or development of alternate procedures. Equipment Calibration and Maintenance The equipment used to conduct the emission measurements is maintained according to the manufacturer s instructions to ensure proper operation. In addition to the maintenance program, calibrations are carried out on each measurement device according to the schedule outlined by the Environmental Protection Agency. Quality control checks are also conducted in the field for each test program. Chain-of-Custody Air Hygiene maintains full chain-of-custody documentation on all samples and data sheets. In addition to normal documentation of changes between field sample custodians, laboratory personnel, and field test personnel, Air Hygiene documents every individual who handles any test component in the field (e.g., probe wash, impinger loading and recovery, filter loading and recovery, etc.). Samples are stored in a locked area to which only Air Hygiene personnel have access. Field data sheets are secured at Air Hygiene s offices upon return from the field. Training Personnel s training is essential to ensure quality testing. Air Hygiene has formal and informal training programs, which include: 1. Attendance at EPA-sponsored training courses 2. Enrollment in EPA correspondence courses 3 A requirement for all technicians to read and understand Air Hygiene s QA manual 4. In-house training and QA meetings on a regular basis 5. Maintenance of training records Knowledge of Current Test Methods With the constant updating of standard test methods and the wide variety of emerging test procedures, it is essential that any qualified source tester keep abreast of new developments. Air Hygiene subscribes to services, which provide updates on EPA reference methods, rules, and regulations. Additionally, source test personnel regularly attend and present papers at testing and emission-related seminars and conferences. Air Hygiene personnel maintain membership in the Air and Waste Management Association and the American Industrial Hygiene Association. snc-07-benson.mn-comp#1-rpt
158 COMBUSTION TESTING QUALITY ASSURANCE ACTIVITIES A number of quality assurance activities were undertaken before, during, and after this testing project. This section of the report combined with the documentation in Appendix C describe each of those activities. Each instrument s response was checked and adjusted in the field prior to the collection of data via multi-point calibration. The instrument s linearity was checked by adjusting its zero and span responses to zero nitrogen and an upscale calibration gas in the range of the expected concentrations. The instrument response was then challenged with other calibration gases of known concentration and accepted as being linear if the response of the other calibration gases agreed within ± two percent of the range of predicted values. NO 2 to NO conversion was checked via direct connect with an EPA Protocol certified concentration of NO 2 in a balance of nitrogen. Conversion was verified to be between 90 and 110 percent. After each test run, the analyzers were checked for zero and span drift. This allowed each test run to be bracketed by calibrations and documents the precision of the data just collected. The criterion for acceptable data is that the instrument drift is no more than three percent of the full-scale response. The quality assurance worksheets in the following pages summarize all multipoint calibration checks and zero to span checks performed during the tests. These worksheets (as prepared from the data records of Appendix A) show that no drifts in excess of three percent occurred in the zero to span checks following each test run. The sampling systems were leak checked by demonstrating that a vacuum greater than 10 in Hg could be held for at least one minute with a decline of less than one in. Hg. A leak test was conducted after the sample system was set up and before the system was dismantled. This test was conducted to ensure that ambient air had not diluted the sample. Any leakage detected prior to the tests would be repaired and another leak check conducted before testing commenced. No leaks were found during the pre or post-test leak checks. The absence of leaks in the sampling system was also verified by a sampling system bias check. The sampling system s integrity was tested by comparing the responses of the analyzers to the calibration gases introduced via two paths. The first path was directly into the analyzer and the second path via the sample system at the sample probe. Any difference in the instrument responses by these two methods was attributed to sampling system bias or leakage. The criterion for acceptance is agreement within five percent of the span of the analyzer. The control gases used to calibrate the instruments were analyzed and certified by the compressed gas vendors to plus or minus one percent accuracy for all gases. EPA Protocol No. 1 was used, where applicable to assign the concentration values traceable to the National Institute of Standards and Technology (NIST), Standard Reference Materials (SRM s). The gas calibration sheets as prepared by the vendor are contained in Appendix C. Air Hygiene collected and reported the enclosed test data in accordance with the procedures and quality assurance activities described in this test report. Air Hygiene makes no warranty as to the suitability of the test methods. Air Hygiene also assumes no liability relating to the interpretation and use of the test data. Date: July 2-4, 2007 Company: Fibrominn, LLC Location: Benson, Minnesota Techs: TKG INSTRUMENTAL ANALYSIS QUALITY ASSURANCE DATA Sample System Leak Check Date Sample System Leak Rate (l/min) July 2-4, July 2-4, snc-07-benson.mn-comp#1-rpt
159 Calibration Date: July 2, 2007 Client: Fibrominn, LLC Location: Stack Oulet NOx Span (ppm) = THERMO 42C (NOx Analyzer) Certified Concentration (ppm) Instrument Response (ppm) Calibration Error (%) Absolute Conc. (ppm) Pass or Fail (±2%, 0.5ppm) YES (%) YES (%) YES (%) Linearity = Instrument Response (ppm) THERMO 42C (NOx Analyzer) Linearity Plot Certified Concentrations (ppm) CO Span (ppm) = THERMO 48C (CO Analyzer) Certified Concentration (ppm) Instrument Response (ppm) Calibration Error (%) Absolute Conc. (ppm) Pass or Fail (±2%, 0.5ppm) YES (%) YES (%) YES (%) Linearity = Instrument Response (ppm) THERMO 48C (CO Analyzer) Linearity Plot Certified Concentrations (ppm) O2 Span (%) = SERVOMEX 1440 (O₂Analyzer) Certified Concentration (%) Instrument Response (%) Calibration Error (%) Absolute Conc. (%) Pass or Fail (±2%, 0.5%) YES (%) YES (%) YES (%) Linearity = Instrument Response (ppm) SERVOMEX 1440 (O₂Analyzer) Linearity Plot Certified Concentrations (ppm) CO Span (ppm) = THERMO 48C (CO Analyzer) - High Range Certified Concentration (ppm) Instrument Response (ppm) Calibration Error (%) Absolute Conc. (ppm) Pass or Fail (±2%, 0.5ppm) YES (%) YES (%) YES (%) Linearity = THERMO 48C (CO Analyzer) - High Range Linearity Plot Instrument Response (ppm) Certified Concentrations (ppm) CO2 Span (%) = SERVOMEX 1440 (CO₂Analyzer) Certified Concentration (%) Instrument Response (%) Calibration Error (%) Absolute Conc. (%) Pass or Fail (±2%, 0.5%) YES (%) YES (%) YES (%) Linearity = Instrument Response (ppm) SERVOMEX 1440 (CO₂Analyzer) Linearity Plot Certified Concentrations (ppm) SO2 Span (ppm) = THERMO 43C (SO₂Analyzer) Certified Concentration (ppm) Instrument Response (ppm) Calibration Error (%) Absolute Conc. (ppm) Pass or Fail (±2%, 0.5ppm) YES (%) YES (%) YES (%) Linearity = Instrument Response (ppm) THERMO 43C (SO₂Analyzer) Linearity Plot Certified Concentrations (ppm) snc-07-benson.mn-comp#1-gases App. D
160 NOx Converter Efficiency Date: July 2, 2007 Analyzer: INST-NX-0012 RM 7E, ( ), Introduce a concentration of 40 to 60 ppmv NO 2 to the analyzer in direct calibration mode and record the NOx concentration displayed by the analyzer.... Calculate the converter efficiency using Equation 7E-7 in Section The specification for converter efficiency in Section 13.5 must be met.... The NO 2 must be prepared according to the EPA Traceability Protocol and have an accuracy within 2.0 percent. Audit Gas: NO 2 Concentration (C v ), ppmvd Converter Efficiency Calculations: Analyzer Reading, NO Channel, ppmvd 2.73 Analyzer Reading, NOx Channel, ppmvd Analyzer Reading, NO 2 Channel (C Dir(NO2) ), ppmvd Converter Efficiency, % RM 7E, ( ), 13.5 NO2 to NO Conversion Efficiency Test (as applicable). The NO2 to NO conversion efficiency, calculated according to Equation 7E-7 or Equation 7E-9, must be greater than or equal to 90 percent. C Dir ppmvd Eff Eq. 7E-7 = NO = x 100 = CV ppmvd 94.22% Date/Time Elapsed Time NOx NO mm/dd/yy hh:mm:ss Seconds ppmvd ppmvd 07/02/07 06:36: /02/07 06:36: /02/07 06:37: /02/07 06:37: /02/07 06:38: /02/07 06:38: /02/07 06:39: /02/07 06:39: snc-07-benson.mn-comp#1-gases App. D
161 Calibration Date: July 2, 2007 Client: Fibrominn, LLC Location: SDA Inlet CO Span (ppm) = THERMO 48 (CO Analyzer) Certified Concentration (ppm) Instrument Response (ppm) Calibration Error (%) Absolute Conc. (ppm) Pass or Fail (±2%, 0.5ppm) YES (%) YES (%) YES (%) Linearity = Instrument Response (ppm) THERMO 48 (CO Analyzer) Linearity Plot Certified Concentrations (ppm) O2 Span (%) = M&C PMA 22 (O₂Analyzer) Certified Concentration (%) Instrument Response (%) Calibration Error (%) Absolute Conc. (%) Pass or Fail (±2%, 0.5%) YES (%) YES (%) YES (%) Linearity = Instrument Response (ppm) M&C PMA 22 (O₂Analyzer) Linearity Plot Certified Concentrations (ppm) CO2 Span (%) = FUJI 3300 (CO₂Analyzer) Certified Concentration (%) Instrument Response (%) Calibration Error (%) Absolute Conc. (%) Pass or Fail (±2%, 0.5%) YES (%) YES (%) YES (%) Linearity = Instrument Response (ppm) FUJI 3300 (CO₂Analyzer) Linearity Plot Certified Concentrations (ppm) SO2 Span (ppm) = AMETEK 721M (SO₂Analyzer) Certified Concentration (ppm) Instrument Response (ppm) Calibration Error (%) Absolute Conc. (ppm) Pass or Fail (±2%, 0.5ppm) YES (%) YES (%) YES (%) Linearity = Instrument Response (ppm) AMETEK 721M (SO₂Analyzer) Linearity Plot Certified Concentrations (ppm) snc-07-benson.mn-comp#1-gases App. D
162 Calibration Date: July 3, 2007 Client: Fibrominn, LLC Location: Stack Oulet NOx Span (ppm) = THERMO 42C (NOx Analyzer) Certified Concentration (ppm) Instrument Response (ppm) Calibration Error (%) Absolute Conc. (ppm) Pass or Fail (±2%, 0.5ppm) YES (%) YES (%) YES (%) Linearity = Instrument Response (ppm) THERMO 42C (NOx Analyzer) Linearity Plot Certified Concentrations (ppm) CO Span (ppm) = THERMO 48C (CO Analyzer) Certified Concentration (ppm) Instrument Response (ppm) Calibration Error (%) Absolute Conc. (ppm) Pass or Fail (±2%, 0.5ppm) YES (%) YES (%) YES (%) Linearity = Instrument Response (ppm) THERMO 48C (CO Analyzer) Linearity Plot Certified Concentrations (ppm) SERVOMEX 1440 (O₂Analyzer) Linearity Plot O2 Span (%) = SERVOMEX 1440 (O ₂ Analyzer) Certified Concentration (%) Instrument Response (%) Calibration Error (%) Absolute Conc. (%) Pass or Fail (±2%, 0.5%) YES (%) YES (%) YES (%) Linearity = Instrument Response (%) Certified Concentrations (%) CO Span (ppm) = THERMO 48C (CO Analyzer) - High Range Certified Concentration (ppm) Instrument Response (ppm) Calibration Error (%) Absolute Conc. (ppm) Pass or Fail (±2%, 0.5ppm) YES (%) YES (%) YES (%) Linearity = THERMO 48C (CO Analyzer) - High Range Linearity Plot Instrument Response (ppm) Certified Concentrations (ppm) SERVOMEX 1440 (CO₂Analyzer) Linearity Plot CO2 Span (%) = SERVOMEX 1440 (CO ₂ Analyzer) Certified Concentration (%) Instrument Response (%) Calibration Error (%) Absolute Conc. (%) Pass or Fail (±2%, 0.5%) YES (%) YES (%) YES (%) Linearity = Instrument Response (%) Certified Concentrations (%) THERMO 43C (SO₂Analyzer) Linearity Plot SO2 Span (ppm) = THERMO 43C (SO ₂ Analyzer) Certified Concentration (ppm) Instrument Response (ppm) Calibration Error (%) Absolute Conc. (ppm) Pass or Fail (±2%, 0.5ppm) YES (%) YES (%) YES (%) Linearity = Instrument Response (ppm) Certified Concentrations (ppm) snc-07-benson.mn-comp#1-gases App. D
163 NOx Converter Efficiency Date: July 3, 2007 Analyzer: INST-NX-0012 RM 7E, ( ), Introduce a concentration of 40 to 60 ppmv NO 2 to the analyzer in direct calibration mode and record the NOx concentration displayed by the analyzer.... Calculate the converter efficiency using Equation 7E-7 in Section The specification for converter efficiency in Section 13.5 must be met.... The NO 2 must be prepared according to the EPA Traceability Protocol and have an accuracy within 2.0 percent. Audit Gas: NO 2 Concentration (C v ), ppmvd Converter Efficiency Calculations: Analyzer Reading, NO Channel, ppmvd 2.55 Analyzer Reading, NOx Channel, ppmvd Analyzer Reading, NO 2 Channel (C Dir(NO2) ), ppmvd Converter Efficiency, % RM 7E, ( ), 13.5 NO2 to NO Conversion Efficiency Test (as applicable). The NO2 to NO conversion efficiency, calculated according to Equation 7E-7 or Equation 7E-9, must be greater than or equal to 90 percent. C Dir ppmvd Eff Eq. 7E-7 = NO = x 100 = CV ppmvd 96.2% Date/Time Elapsed Time NOx NO mm/dd/yy hh:mm:ss Seconds ppmvd ppmvd 07/03/07 06:24: /03/07 06:25: /03/07 06:25: /03/07 06:26: /03/07 06:26: /03/07 06:27: /03/07 06:27: /03/07 06:28: snc-07-benson.mn-comp#1-gases App. D
164 Calibration Date: July 3, 2007 Client: Fibrominn, LLC Location: SDA Inlet CO Span (ppm) = THERMO 48 (CO Analyzer) Certified Concentration (ppm) Instrument Response (ppm) Calibration Error (%) Absolute Conc. (ppm) Pass or Fail (±2%, 0.5ppm) YES (%) YES (%) YES (%) Linearity = Instrument Response (ppm) THERMO 48 (CO Analyzer) Linearity Plot Certified Concentrations (ppm) O2 Span (%) = M&C PMA 22 (O₂Analyzer) Certified Concentration (%) Instrument Response (%) Calibration Error (%) Absolute Conc. (%) Pass or Fail (±2%, 0.5%) YES (%) YES (%) YES (%) Linearity = Instrument Response (%) M&C PMA 22 (O₂Analyzer) Linearity Plot Certified Concentrations (%) CO2 Span (%) = FUJI 3300 (CO₂Analyzer) Certified Concentration (%) Instrument Response (%) Calibration Error (%) Absolute Conc. (%) Pass or Fail (±2%, 0.5%) YES (%) YES (%) YES (%) Linearity = Instrument Response (%) FUJI 3300 (CO₂Analyzer) Linearity Plot Certified Concentrations (%) SO2 Span (ppm) = AMETEK 721M (SO₂Analyzer) Certified Concentration (ppm) Instrument Response (ppm) Calibration Error (%) Absolute Conc. (ppm) Pass or Fail (±2%, 0.5ppm) YES (%) YES (%) YES (%) Linearity = Instrument Response (ppm) AMETEK 721M (SO₂Analyzer) Linearity Plot Certified Concentrations (ppm) snc-07-benson.mn-comp#1-gases App. D
165 Strat Test Pre and Post QA/QC Check DRIFT AND BIAS CHECK O2 NOx CO Initial Zero Final Zero Avg. Zero Initial UpScale Final UpScale Avg. UpScale Sys Resp (Zero) Sys Resp (Upscale) Upscale Cal Gas Initial Zero Bias 0.86% 0.01% 0.00% Final Zero Bias -0.14% 0.18% 0.05% Zero Drift 1.00% 0.17% 0.05% Initial Upscale Bias 0.05% -1.10% -0.61% Final Upscale Bias -0.43% -0.23% -0.25% Upscale Drift 0.48% 0.87% 0.36% Initial Zero Final Zero Initial Upscale Final Upscale Calibration Span % of Range (drift) % of Range (bias) Respone Time (min) Sys. Response (min) 0.8 Date/Time O2-10 NOx-10 CO-10 mm/dd/yy hh:mm:ss % ppm ppm 07/02/07 06:48: /02/07 06:48: /02/07 06:48: /02/07 06:48: /02/07 06:48: /02/07 06:49: /02/07 06:49: /02/07 06:49: /02/07 06:49: /02/07 06:49: /02/07 06:49: /02/07 06:50: /02/07 06:50: /02/07 06:50: /02/07 06:50: /02/07 06:50: /02/07 06:50: /02/07 06:51: /02/07 06:51: /02/07 06:51: /02/07 06:51: /02/07 06:51: /02/07 06:51: /02/07 06:52: /02/07 06:52: /02/07 06:52: /02/07 06:52: /02/07 06:52: /02/07 06:52: /02/07 06:53: /02/07 06:53: /02/07 06:53: /02/07 06:53: /02/07 06:53: /02/07 06:53: /02/07 06:54: /02/07 06:54: /02/07 06:54: /02/07 06:54: /02/07 06:54: /02/07 06:54: /02/07 06:55: /02/07 06:55: /02/07 06:55: /02/07 06:55: snc-07-benson.mn-comp#1-stack-strat App. D
166 Strat Test Pre and Post QA/QC Check DRIFT AND BIAS CHECK O2 SO2 Initial Zero Final Zero Avg. Zero Initial UpScale Final UpScale Avg. UpScale Sys Resp (Zero) Sys Resp (Upscale) Upscale Cal Gas Initial Zero Bias 0.19% 0.30% Final Zero Bias 0.00% 0.05% Zero Drift 0.19% 0.25% Initial Upscale Bias -0.33% -1.79% Final Upscale Bias -0.67% -2.31% Upscale Drift 0.33% 0.51% Initial Zero Final Zero Initial Upscale Final Upscale Calibration Span % of Range (drift) % of Range (bias) Respone Time (min) Sys. Response (min) 1.3 Date/Time O2IN-10 SO2IN-10 mm/dd/yy hh:mm:ss % ppm 07/02/07 06:46: /02/07 06:46: /02/07 06:46: /02/07 06:46: /02/07 06:46: /02/07 06:47: /02/07 06:47: /02/07 06:47: /02/07 06:47: /02/07 06:47: /02/07 06:47: /02/07 06:48: /02/07 06:48: /02/07 06:48: /02/07 06:48: /02/07 06:48: /02/07 06:48: /02/07 06:49: /02/07 06:49: /02/07 06:49: /02/07 06:49: /02/07 06:49: /02/07 06:49: /02/07 06:50: /02/07 06:50: /02/07 06:50: /02/07 06:50: /02/07 06:50: /02/07 06:50: /02/07 06:51: /02/07 06:51: snc-07-benson.mn-comp#1-sda-strat App. D
167 High Load, Run - Out-1 Raw Average Corrected Average Initial Zero Final Zero Avg. Zero Initial UpScale Final UpScale Avg. UpScale Sys Resp (Zero) Sys Resp (Upscale) Upscale Cal Gas Initial Zero Bias Final Zero Bias Zero Drift Initial Upscale Bias Final Upscale Bias Upscale Drift Alternative Specification Abs Diff DRIFT AND BIAS CHECK O2 NOx CO CO2 SO % 0.00% 0.04% 0.37% 0.66% 0.05% 0.40% 0.24% 0.21% 0.57% 0.19% 0.40% 0.20% 0.16% 0.09% -0.33% -1.09% -0.03% -0.37% 0.97% -0.76% -1.81% -0.15% -0.16% -1.04% 0.43% 0.72% 0.12% 0.21% 2.01% Initial Zero Final Zero Initial Upscale Final Upscale Calibration Span 3% of Range (drift) 5% of Range (bias) High Load, Run - Out-2 Raw Average Corrected Average Initial Zero Final Zero Avg. Zero Initial UpScale Final UpScale Avg. UpScale Sys Resp (Zero) Sys Resp (Upscale) Upscale Cal Gas Initial Zero Bias Final Zero Bias Zero Drift Initial Upscale Bias Final Upscale Bias Upscale Drift Alternative Specification Abs Diff DRIFT AND BIAS CHECK O2 NOx CO CO2 SO % 0.40% 0.24% 0.21% 0.57% 0.05% 0.58% 0.11% 0.58% -0.13% 0.00% 0.19% 0.13% 0.37% 0.70% -0.76% -1.81% -0.15% -0.16% -1.04% -0.71% -1.73% -0.02% -0.05% -2.49% 0.05% 0.08% 0.13% 0.11% 1.45% Initial Zero Final Zero Initial Upscale Final Upscale Calibration Span 3% of Range (drift) 5% of Range (bias) snc-07-benson.mn-comp#1-gases App. D
168 High Load, Run - Out-3 Raw Average Corrected Average Initial Zero Final Zero Avg. Zero Initial UpScale Final UpScale Avg. UpScale Sys Resp (Zero) Sys Resp (Upscale) Upscale Cal Gas Initial Zero Bias Final Zero Bias Zero Drift Initial Upscale Bias Final Upscale Bias Upscale Drift Alternative Specification Abs Diff DRIFT AND BIAS CHECK O2 NOx CO CO2 SO % 0.58% 0.11% 0.58% -0.13% 0.10% 0.45% 0.24% 0.63% 0.61% 0.05% 0.13% 0.13% 0.05% 0.74% -0.71% -1.73% -0.02% -0.05% -2.49% -0.67% -1.91% -0.04% -0.05% -0.46% 0.05% 0.18% 0.02% 0.00% 2.03% Initial Zero Final Zero Initial Upscale Final Upscale Calibration Span 3% of Range (drift) 5% of Range (bias) DRIFT AND BIAS CHECK High Load, Run - In-1 O2 SO2 Raw Average Corrected Average Initial Zero Final Zero Avg. Zero Initial UpScale Final UpScale Avg. UpScale Sys Resp (Zero) Sys Resp (Upscale) Upscale Cal Gas Initial Zero Bias -0.05% 0.93% Final Zero Bias 0.33% 1.35% Zero Drift 0.38% 0.42% Initial Upscale Bias -0.24% -1.29% Final Upscale Bias -0.81% -2.54% Upscale Drift 0.57% 1.25% Initial Zero Final Zero Initial Upscale Final Upscale Alternative Specification Abs Diff Calibration Span 3% of Range (drift) 5% of Range (bias) snc-07-benson.mn-comp#1-gases App. D
169 DRIFT AND BIAS CHECK High Load, Run - In-2 O2 SO2 Raw Average Corrected Average Initial Zero Final Zero Avg. Zero Initial UpScale Final UpScale Avg. UpScale Sys Resp (Zero) Sys Resp (Upscale) Upscale Cal Gas Initial Zero Bias 0.33% 1.35% Final Zero Bias 0.33% 1.44% Zero Drift 0.00% 0.09% Initial Upscale Bias -0.81% -2.54% Final Upscale Bias -0.81% -0.61% Upscale Drift 0.00% 1.93% Initial Zero Final Zero Initial Upscale Final Upscale Alternative Specification Abs Diff Calibration Span 3% of Range (drift) 5% of Range (bias) DRIFT AND BIAS CHECK High Load, Run - In-3 O2 SO2 Raw Average Corrected Average Initial Zero Final Zero Avg. Zero Initial UpScale Final UpScale Avg. UpScale Sys Resp (Zero) Sys Resp (Upscale) Upscale Cal Gas Initial Zero Bias 0.33% 1.44% Final Zero Bias 0.24% 1.57% Zero Drift 0.10% 0.13% Initial Upscale Bias -0.81% -0.61% Final Upscale Bias -0.81% 1.00% Upscale Drift 0.00% 1.62% Initial Zero Final Zero Initial Upscale Final Upscale Alternative Specification Abs Diff Calibration Span 3% of Range (drift) 5% of Range (bias) snc-07-benson.mn-comp#1-gases App. D
170 SAMPLE DESCRIPTION AND CHAIN OF CUSTODY RECORD Project Number: snc-07-benson.mn-comp#1 Laboratory Analysis Requested: Air Hygiene International, Inc S. 122nd East Ave, Suite F Tulsa, Oklahoma (888) Person Taking Samples: TP RM 26a and Volume Sample Number Location Date Volume RM 26a Volume Analysis Method IN-HCl-1 Inlet, HCl, Run 1 7/3/2007 As Marked X 455 IN-HCl-2 Inlet, HCl, Run 2 7/3/2007 As Marked X 430 IN-HCl-3 Inlet, HCl, Run 3 7/3/2007 As Marked X 390 Blank HCl Blank 7/3/2007 As Marked X 100 Sidd Kshirsagar 07/03/07 18:58 07/03/07 Relinquished by: (Signature) Date: Time: Received by: (Signature) Date: Time: 18:58 Relinquished by: (Signature) Date: Time: Received by: (Signature) Date: Time: snc-07-benson.mn-comp#1-inlet-hcl
171 SAMPLE DESCRIPTION AND CHAIN OF CUSTODY RECORD Project Number: snc-07-benson.mn-comp#1 Laboratory Analysis Requested: Air Hygiene International, Inc S. 122nd East Ave, Suite F Tulsa, Oklahoma (888) Person Taking Samples: TG RM 26a and Volume Sample Number Location Date Volume RM 26a Volume Analysis Method IN-HCl-1 Inlet, HCl, Run 1 7/2/2007 As Marked X 725 IN-HCl-2 Inlet, HCl, Run 2 7/2/2007 As Marked X 725 IN-HCl-3 Inlet, HCl, Run 3 7/2/2007 As Marked X 715 Blank HCl Blank 7/2/2007 As Marked X 100 Sidd Kshirsagar 07/03/07 18:58 07/03/07 18:58 Relinquished by: (Signature) Date: Time: Received by: (Signature) Date: Time: Relinquished by: (Signature) Date: Time: Received by: (Signature) Date: Time: snc-07-benson.mn-comp#1-outlet-hcl
172 SAMPLE DESCRIPTION AND CHAIN OF CUSTODY RECORD Project Number: snc-07-benson.mn-comp#1 Laboratory Analysis Requested: Air Hygiene International, Inc S. 122nd East Ave, Suite F Tulsa, Oklahoma (888) Person Taking Samples: Sample Number TKG Location Date Volume METHOD 5 (FRONTHALF) AND 202 (BACKHALF) RM 5 RM 202 Analysis Method OUT-PM-1-F Stack Outlet, Run 1 Filter 7/3/2007 N/A X OUT-PM-2-F Stack Outlet, Run 2 Filter 7/4/2007 N/A X OUT-PM-3-F Stack Outlet, Run 3 Filter 7/4/2007 N/A X OUT-PM-1-PW Stack Outlet, Run 1 Probe Wash 7/3/2007 as marked X OUT-PM-2-PW Stack Outlet, Run 2 Probe Wash 7/4/2007 as marked X OUT-PM-3-PW Stack Outlet, Run 3 Probe Wash 7/4/2007 as marked X OUT-PM-1-BH Stack Outlet, Run 1 Back Half 7/3/2007 as marked X OUT-PM-2-BH Stack Outlet, Run 2 Back Half 7/4/2007 as marked X OUT-PM-3-BH Stack Outlet, Run 3 Back Half 7/4/2007 as marked X OUT-PM-1-MC Stack Outlet, Run 1 MeCl Rinse 7/3/2007 as marked X OUT-PM-2-MC Stack Outlet, Run 2 MeCl Rinse 7/4/2007 as marked X OUT-PM-3-MC Stack Outlet, Run 3 MeCl Rinse 7/4/2007 as marked X AC-B MC-B Stack Outlet, Acetone Blank 7/3/2007 as marked X Stack Outlet, MeCl Blank 7/3/2007 as marked X DI-B Stack Outlet, DI Water Blank 7/3/2007 as marked X 07/05/07 19:00 07/05/07 19:00 Relinquished by: (Signature) Date: Time: Received by: (Signature) Date: Time: Relinquished by: (Signature) Date: Time: Received by: (Signature) Date: Time: snc-07-benson.mn-comp#1-outlet-pm
173
174 METERING SYSTEM CALIBRATION SHEET EPA Reference Method 5 Metering System Pre-Test Calibration Air Hygiene Assett ID: samp-cp-0016 Filename: Make: Apex Date: 06/07/07 Model #: XC-522 Barometric Pressure: (in. Hg) Serial #: Theoretical Critical Vacuum: (in. Hg) Z:\Shared\QAQC\Calibrations\PM-Equipment\M-5 Consoles\Calibration Sheet v4.0\current\[samp-cp-0016 Calibration xls]Original (5 point) H (in H2O) DRY GAS METER READINGS Time Volume Initial Temps. Initial Final Total Inlet Outlet (min) (cu ft) (cu ft) (cu ft) (deg F) (deg F) Final Temps. Orifice K' Orifice Actual Ambient Temperature Inlet Outlet Serial# Coefficient Vacuum Initial Final Average (deg F) (deg F) (number) (see above) (in Hg) (deg F) (deg F) (deg F) RESULTS DRY GAS METER ORIFICE VOLUME VOLUME VOLUME VOLUME VOLUME CORRECTED CORRECTED CORRECTED CORRECTED NOMINAL Vm(std) Vm(std) Vcr(std) Vcr(std) Vcr (cu ft) (liters) (cu ft) (liters) (cu ft) DRY GAS METER ORIFICE CALIBRATION FACTOR CALIBRATION FACTOR Y H@ Variation Value Value Value Variation (number) (number) (in H2O) (mm H2O) (in H2O) AVERAGE: PASSED Notes: For Calibration Factor Y, the ratio of the reading of the calibration meter to the dry gas meter,acceptable tolerance of individual values from the average is +/ For Orifice Calibration Factor dh@, the orifice differential pressure in inches of H 2 0 that equates to 0.75 cfm of air at 68 o F and inches of Hg, acceptable tolerance of individual values from the average is +/ For valid test results, the Actual Vacuum should be 1 to 2 in. Hg greater than the Theoretical Critical Vacuum shown above. The Critical Orifice Coefficient, K', must be entered in English units, (ft)^3*(deg R)^0.5/((in.Hg)*(min)). SIGNATURE: DATE: 06/07/07 SAMP-CP-0016 Calibration Original (5 point)
175 METERING SYSTEM CALIBRATION SHEET EPA Reference Method 5 Metering System Pre-Test Calibration Air Hygiene Assett ID: samp-cp-0017 Filename: Make: Apex Date: 06/06/07 Model #: XC-522 Barometric Pressure: (in. Hg) Serial #: Theoretical Critical Vacuum: (in. Hg) Z:\Shared\QAQC\Calibrations\PM-Equipment\M-5 Consoles\Calibration Sheet v4.0\current\[samp-cp-0017 Calibration xls]Original (5 point) H (in H2O) DRY GAS METER READINGS Time Volume Initial Temps. Initial Final Total Inlet Outlet (min) (cu ft) (cu ft) (cu ft) (deg F) (deg F) Final Temps. Orifice K' Orifice Actual Ambient Temperature Inlet Outlet Serial# Coefficient Vacuum Initial Final Average (deg F) (deg F) (number) (see above) (in Hg) (deg F) (deg F) (deg F) RESULTS DRY GAS METER ORIFICE VOLUME VOLUME VOLUME VOLUME VOLUME CORRECTED CORRECTED CORRECTED CORRECTED NOMINAL Vm(std) Vm(std) Vcr(std) Vcr(std) Vcr (cu ft) (liters) (cu ft) (liters) (cu ft) DRY GAS METER ORIFICE CALIBRATION FACTOR CALIBRATION FACTOR Y H@ Variation Value Value Value Variation (number) (number) (in H2O) (mm H2O) (in H2O) AVERAGE: PASSED Notes: For Calibration Factor Y, the ratio of the reading of the calibration meter to the dry gas meter,acceptable tolerance of individual values from the average is +/ For Orifice Calibration Factor dh@, the orifice differential pressure in inches of H 2 0 that equates to 0.75 cfm of air at 68 o F and inches of Hg, acceptable tolerance of individual values from the average is +/ For valid test results, the Actual Vacuum should be 1 to 2 in. Hg greater than the Theoretical Critical Vacuum shown above. The Critical Orifice Coefficient, K', must be entered in English units, (ft)^3*(deg R)^0.5/((in.Hg)*(min)). SIGNATURE: DATE: 06/06/07 SAMP-CP-0017 Calibration Original (5 point)
176 APPENDIX E STRATIFICATION TEST DATA
177 STRATIFICATION TEST DATA SDA Inlet Test Data
178 Company Plant Name Equipment Location Source Information Fibrominn, LLC Fibrominn Biomass Power Plant Biomass Boiler, SDA Inlet Benson, Minnesota Test Information Date 07/02/07 Project # snc-07-benson.mn-comp#1 Unit Number 1 Load high Number of Ports Available 2 Number of Ports Used 2 Stack and Test Type Isokinetic Traverse (Wet Chemistry Testing) Velocity Traverse (Flow and Flow RATA Test) Stratification Traverse (Compliance Test) RM 20 Stratification Traverse (RATA) Part 60 Part 75 Circular Stack snc-07-benson.mn-comp#1-sda-strat
179 METHOD 1 - STRATIFICATION TEST FOR A CIRCULAR SOURCE Company Fibrominn, LLC Date 07/02/07 Plant Name Fibrominn Biomass Power Plant Equipment Biomass Boiler, SDA Inlet Project # snc-07-benson.mn-comp#1 # of Ports Available 2 Location Benson, Minnesota # of Ports Used 2 Circular Stack or Duct Diameter Distance to Far Wall of Stack (L fw ) in. North Distance to Near Wall of Stack (L nw ) 7.00 in. Diameter of Stack (D) in. L fw = in. Area of Stack (A s ) ft 2 Distance from Disturbances to Port Distance Upstream (A) in. D = in. Diameters Upstream (A D ) 2.71 diameters A Distance Downstream (B) in. L nw = 7.0 in. Diameters Downstream (B D ) 9.47 diameters Diameters to Flow Disturbance Number of Traverse Points Required Minimum Number of 1 Traverse Points Minimum Number of Traverse Points Comp Stratification Down (B D ) Up (A D ) Particulate Velocity Stream Stream Points Points Criteria Points RM 7E RM1 pts Alt 7E points A = 29.2 ft. 12 points A D = 2.7 dia. >= 8.00 >= or or 12 2 Minimum Number of Upstream Spec Traverse Points Downstream Spec RATA Stratification Traverse Pts Required Criteria Points B = ft. 1 Check Minimum Number of Points for the Upstream Part75/60 12 RM1 pts B D = 9.5 dia. and Downstream conditions, then use the largest. 75 abrv (a) 3 points 2 8 for Circular Stacks 12 to 24 inches 75 abrv (b) 6 points 12 for Circular Stacks over 24 inches 12 points B FLOW Disturbance to Disturbance to Upstream Port Downstream Port Number of Traverse Points Used 2 Ports by 6 Pts / port 12 Pts Used 12 Required Traverse Point Number Traverse Point Locations Percent of Stack Diameter Distance from Inside Wall Distance Including Reference Length Stratification Traverse (Compliance Test) % in. in % 5 5/8 12 5/ % 18 7/8 25 7/ / % 38 1/8 45 1/ / % 90 7/8 97 7/8 97 7/ % 110 1/ /8 45 1/ % 123 3/ /8 25 7/ / snc-07-benson.mn-comp#1-sda-strat
180 STRATIFICATION TRAVERSE (COMPLIANCE TEST) RESULTS Company Fibrominn, LLC Plant Name Fibrominn Biomass Power Plant Equipment Biomass Boiler, SDA Inlet Location Benson, Minnesota Date 07/02/07 Project # snc-07-benson.mn-comp#1 # of Ports Available 2 # of Ports Used 2 Stack Dimensions Traverse Data Diameter or Length of Stack (D) in. 2 Ports by 6 Pts / port Width of Stack (W) in. 12 Pts Used 12 Required Area of Stack (A s ) ft 2 Run Start 7:10:41 Run End 7:49:41 Traverse Point Time Per Point Point Start Time Point Stop Time (Reading) O2 Percent Difference min. hh:mm:ss hh:mm:ss % % ppm % ppm % B :10:41 7:13: % % B :13:41 7:16: % % B :16:41 7:19: % % B :19:41 7:22: % % B :22:41 7:25: % % B :25:41 7:28: % % A :28:41 7:34: % % A :34:41 7:37: % % A :37:41 7:40: % % A :40:41 7:43: % % A :43:41 7:46: % % A :46:41 7:49: % % SO2 Percent Difference Percent Difference Average snc-07-benson.mn-comp#1-sda-strat
181 STRAT TEST DETERMINED SAMPLE POINTS FOR CIRCULAR STACK Company Fibrominn, LLC Plant Name Fibrominn Biomass Power Plant Equipment Biomass Boiler, SDA Inlet Location Benson, Minnesota Date 07/02/07 Project # snc-07-benson.mn-comp#1 # of Ports Available 2 # of Ports Used 2 Stack Dimensions Traverse Data Diameter or Length of Stack (D) in. 2 Ports by 6 Pts / port Width of Stack (W) in. 12 Pts Used 12 Required Area of Stack (A s ) ft 2 Run Start 7:10:41 Run End 7:49:41 40 CFR 60, Appendix A, Method 7E Criteria Stratification Results Traverse Maximum Percent Difference Point Number Maximum Conc. Difference Stack Diameter % for O ppm for SO in. Stratification Conclusions Maximum % Diff. Percent Diff. >10% Failed Stratification Test Maximum Conc. Diff. Conc. Diff. > 0.5% Stack Diameter D > 93.6 in. Use RM 1 Measurement Points and Sample Full Stack Test Type Percent of Stack Diameter Moisture, for MW Moisture, for wet-to-dry Gas Distance from Inside Wall Distance Including Reference Length % in. in (b)(2) alt. points do not apply North A snc-07-benson.mn-comp#1-sda-strat
182 STRATIFICATION TEST DATA Stack Exhaust Data
183 Company Plant Name Equipment Location Source Information Fibrominn, LLC Fibrominn Biomass Power Plant Biomass Boiler, Stack Exhaust Benson, Minnesota Test Information Date 07/02/07 Project # snc-07-benson.mn-comp#1 Unit Number 1 Load high Number of Ports Available 4 Number of Ports Used 2 Stack and Test Type Isokinetic Traverse (Wet Chemistry Testing) Velocity Traverse (Flow and Flow RATA Test) Stratification Traverse (Compliance Test) RM 20 Stratification Traverse (RATA) Part 60 Part 75 Circular Stack snc-07-benson.mn-comp#1-stack-strat
184 METHOD 1 - STRATIFICATION TEST FOR A CIRCULAR SOURCE Company Fibrominn, LLC Date 07/02/07 Plant Name Fibrominn Biomass Power Plant Equipment Biomass Boiler, Stack Exhaust Project # snc-07-benson.mn-comp#1 # of Ports Available 4 Location Benson, Minnesota # of Ports Used 2 Circular Stack or Duct Diameter B Distance to Far Wall of Stack (L fw ) in. North Distance to Near Wall of Stack (L nw ) in. Diameter of Stack (D) in. L fw = in. Area of Stack (A s ) ft 2 Distance from Disturbances to Port Distance Upstream (A) in. D = in. Diameters Upstream (A D ) diameters C Distance Downstream (B) in. L nw = 21.0 in. Diameters Downstream (B D ) 8.43 diameters A Diameters to Flow Disturbance Number of Traverse Points Required Minimum Number of 1 Traverse Points Minimum Number of Traverse Points Comp Stratification Down (B D ) Up (A D ) Particulate Velocity Stream Stream Points Points Criteria Points RM 7E RM1 pts Alt 7E points A = ft. 12 points A D = 21.8 dia. >= 8.00 >= or or 12 2 Minimum Number of Upstream Spec Traverse Points Downstream Spec RATA Stratification Traverse Pts Required Criteria Points B = 75.8 ft. 1 Check Minimum Number of Points for the Upstream Part75/60 12 RM1 pts B D = 8.4 dia. and Downstream conditions, then use the largest. 75 abrv (a) 3 points 2 8 for Circular Stacks 12 to 24 inches 75 abrv (b) 6 points 12 for Circular Stacks over 24 inches 12 points B FLOW Disturbance to Disturbance to Upstream Port Downstream Port Number of Traverse Points Used 2 Ports by 6 Pts / port 12 Pts Used 12 Required Traverse Point Number Traverse Point Locations Percent of Stack Diameter Distance from Inside Wall Distance Including Reference Length Stratification Traverse (Compliance Test) % in. in % 4 6/8 25 6/ % 15 6/8 36 6/ / % / % % 92 2/ / % 103 2/ /8 36 6/ / snc-07-benson.mn-comp#1-stack-strat
185 STRATIFICATION TRAVERSE (COMPLIANCE TEST) RESULTS Company Fibrominn, LLC Plant Name Fibrominn Biomass Power Plant Equipment Biomass Boiler, Stack Exhaust Location Benson, Minnesota Date 07/02/07 Project # snc-07-benson.mn-comp#1 # of Ports Available 4 # of Ports Used 2 Stack Dimensions Traverse Data Diameter or Length of Stack (D) in. 2 Ports by 6 Pts / port Width of Stack (W) in. 12 Pts Used 12 Required Area of Stack (A s ) ft 2 Run Start 7:10:41 Run End 7:49:41 Traverse Point Time Per Point Point Start Time Point Stop Time (Reading) O2 Percent Difference min. hh:mm:ss hh:mm:ss % % ppm % ppm % B :10:41 7:13: % % % B :13:41 7:16: % % % B :16:41 7:19: % % % B :19:41 7:22: % % % B :22:41 7:25: % % % B :25:41 7:28: % % % A :28:41 7:34: % % % A :34:41 7:37: % % % A :37:41 7:40: % % % A :40:41 7:43: % % % A :43:41 7:46: % % % A :46:41 7:49: % % % NOx Percent Difference CO Percent Difference Average snc-07-benson.mn-comp#1-stack-strat
186 STRAT TEST DETERMINED SAMPLE POINTS FOR CIRCULAR STACK Company Fibrominn, LLC Plant Name Fibrominn Biomass Power Plant Equipment Biomass Boiler, Stack Exhaust Location Benson, Minnesota Date 07/02/07 Project # snc-07-benson.mn-comp#1 # of Ports Available 4 # of Ports Used 2 Stack Dimensions Traverse Data Diameter or Length of Stack (D) in. 2 Ports by 6 Pts / port Width of Stack (W) in. 12 Pts Used 12 Required Area of Stack (A s ) ft 2 Run Start 7:10:41 Run End 7:49:41 40 CFR 60, Appendix A, Method 7E Criteria Stratification Results Traverse Maximum Percent Difference Point Number Maximum Conc. Difference Stack Diameter % for CO ppm for CO in. Stratification Conclusions Maximum % Diff. Percent Diff. >10% Failed Stratification Test Maximum Conc. Diff. Conc. Diff. > 0.5% Stack Diameter D > 93.6 in. Use RM 1 Measurement Points and Sample Full Stack Test Type Percent of Stack Diameter Moisture, for MW Moisture, for wet-to-dry Gas Distance from Inside Wall Distance Including Reference Length % in. in (b)(2) alt. points do not apply North A snc-07-benson.mn-comp#1-stack-strat
187 APPENDIX F FUEL ANALYSIS
188 Client: Fibrominn, LLC Location: Fibrominn Biomass Power Plant Date: July 3, 2007 Project #: snc-07-benson.mn-comp#1 Biomass - Fuel Analysis Characteristics of Fuel Gas Component Wt% Sample Btu per lb. of biomass = 4,372 gross (HHV) carbon LOT 10 Btu per lb. of biomass = 4,415 gross (HHV) carbon LOT 11 Btu per lb. of biomass = 4,203 gross (HHV) carbon LOT 12 Btu per lb. of biomass = 4,346 gross (HHV) carbon LOT 13 Btu per lb. of biomass = 4,334 gross (HHV) carbon AVERAGE F c -Factor (SCF dry exhaust per MMBtu [HHV]) = F c -Factor (SCF dry exhaust per MMBtu [HHV]) = F c -Factor (SCF dry exhaust per MMBtu [HHV]) = F c -Factor (SCF dry exhaust per MMBtu [HHV]) = F c -Factor (SCF dry exhaust per MMBtu [HHV]) = (Based on EPA RM-19) at 68 deg F and psia 1, LOT 10 1, LOT 11 1, LOT 12 1, LOT 13 1, AVERAGE snc-07-benson.mn-comp#1-gases App. E
189 I ltaze1 I Hazen Research, Inc Indiana Street Go den CO USA Te 1303) Fax: 1303) Date July HRI Project 002-uD9 HRI Series No. G30/07-1 Date Rec'd. 07 /06/07 Cust. P.0.# McHale & Assoc iates, Inc. Gany Anderson th Ave SE Sammamish, WA Reporti ng Basi s > Pnoximate (Z) Moi sture Ash Vol ati I e Fixed C Total Su l fur Btu/l b (HHV) Ml4F Btu/l b MAF Btu/lb Air Dry Loss (Z) U.lt imate (Z) Moi stune Carbon Hydrogen Ni trogen Sul fur Ash 0xygen* Total Ch l oni ne** Forms of Sul fur (as Sul fate Pyritic 0rgani c Total As Rec'd " r s,u) Waten SolubleAlka.l ies (.%) Na20 K Dry Sampl e Identi fi cati on Turkey Litter Sample 10 Ai r Dry * 0xygen by Di fference. ** Not usual ly repontedas part of the ultimate analysis. Lb. Alkali/MM Btu= Lb. Ash/f4M Btu= Lb. S02/MM Btu= r.42 HGI= G % l'4o i sture As Rec'd. Sp.Gn.= Fr"ee Swel 1i ng Index= F-Factor(dny),DSCF/ 4M BTU= 9,920 Fuel s Labor"atory Supervi sor An Employee-Owned Company Page 44 of 184
190 I I{AZEN I Hazen Besearch, Inc Indiafa Streel Go den. CO USA Tel: (303) Fax:(303) McHal e & Associates, Inc. Gany Anderson th Ave SE Sammamish, WA Reporti ng Basi s > Proximate (Z) Moi sture Ash Vol ati I e Fixed C Tota l Sul fur Btu/lb (HHV) f4mf Btu/l b l'4af Btu/l b Air Dry Loss (Z) Ultimate (%) Moi sture Carbon Hydrogen Ni trogen Su.l fut Ash 0xygen* Total Chl or.ine** Forms of Sul fur (as Sul fate Pyr itic 0rgani c Total As Rec'd s, %) l^jater So.lubl e Alkalies (Z) Na20 K * 0xygen by Di fference. ** Not usually reported as Dry r Date Ju.ly HRI Project 002-UD9 HRI Series No. G30/07-2 Date Rec'd. 07/06/07 Cust. P.0.# Sampl e I denti fi cati on Turkey Litter Sample 11 Ai r Dny r r r i part of the ultimateanal ysi s. Lb. Alkali/MM Btu= Lb. Ash/MM Btu= Lb. S02/Ml'4 Btu= HGI= 3 Moi sture As Rec'd. SP.Gr.= Free Swel 1i ng Index= F-Factor(dry), DSCF/MM BTU= 9,758 Repor"t Prepared By: /;.r.- o- b'.a-sv,>r Ge r a -d-h.- fu ilrni n s ha rn Fuel s Laboratory Supenvi sor An Employee-Owned Company Page 45 of 184
191 I lt^ze] I Hazen Research, lnc nd ana Streel Golden. CO USA Tel: (303) Fax (303) McHal e & Associates, Inc. Gary Anderson th Ave SE Sammamish, l/a Reporti ng Basi s > Proximate (Z) Moi sture Ash Vol ati I e Fixed C Total Sul fur Btu/lb (HHV) MMF Btu/lb MAF Btu/lb Air Dry Loss (Z) Ultimate (Z) Moi sture Carbon Hydrogen Ni trogen Sul fur Ash 0xygen* Tota l Ch loni ne** Forms of Sul fur (as Sul fate Pyritlc 0rgani c Tota l Water Sol ubl e Na20 K20 As Rec'd s,z) 0.34 Al kal ies (%) Dry Date July HRI Project 002-uDg HRI Series No. G30/07-3 Date Rec' d. 07 /06/07 Cust. P.0.# Sample I denti f icati on Turkey Litter Sample 12 Ai r Dny * Oxygen by Di fference. ** Not usual ly reportedas part of the ultimate analysis. Lb. Al kal i /MM Btu= Lb. Ash/MM Btu= Lb. S02/MM Btu= 1.63 % Moisture As Rec'd. Sp. Gt". = Free Swel l ing Index= F'Factor(dry),DSCF/M 4 BTU= 10,321 Rgport Prepared By: t' /,1ra t/ ic-lz-. (- uo u'> w f v'v - Gerard H. Cunni ngham Fuel s Laboratony Supervi sor An Employee-Owned Company Page 46 of 184
192 I }IAZEN I Hazen Research, Inc lndiana Street Go den. CO USA Telr {303) Fax: (303) McHal e & Associates, Inc. Gary Anderson th Ave SE Sammami sh, l,,la Reporti ng Basi s > Proximate (X) Moi stune Ash Vol ati I e Fixed C Total Sul fur" Btu/lb (HHV) MMF Btu/lb f4af Btu/l b Air Dry Loss (Z) Ultimate (.?) Moi sture Carbon Hydrogen Ni tr"ogen Sul fur Ash 0xygen* Total Chl orine** Forms of Sul fur (as Sul fate Pyri ti c 0rgani c Total l,laten Sol ubl e Na20 K20 As Rec'd s, z) 0.36 Al kal i es (.%) Dry ? tt 0.55 Date HRI Project HRI Series No. Date Rec' d. Cust. P.0.# July uD9 G30/ /06/ 07 Sampi e Identi fi cati on Tunkey Litter Sample 13 Ai r Dry 3.59 t Lb. A.l kal i /Ml'4 Btu= Lb. Ash/MM Btu= Lb. S02/MM Btu= 1.65 HGI= td Z Moi sture As Rec'd. Sp.Gn.= Free Swel 1i ng Index= F - Factot'( dry), DSCF/MM BTU= 10, 123 Repont Prepaned By: * 0xygen by Di fference. ** Not usual I y repontedas part of the ultjmate analysis. V,'cr- a D4tlrJ- A>,- Gerard H. Cunni nghan Fuel s Laboratory Supervi sor An Employee-Owned Company Page 47 of 184
193 APPENDIX G TEST PROTOCOL
194 COMPLIANCE TEST PROTOCOL FOR ONE BIOMASS BOILER (SPRAY DRYER ABSORBER INLET AND STACK OUTLET) PREPARED FOR SNC LAVALIN, POWERMINN 9090 LLC, AND FIBROMINN LLC AT THE FIBROMINN BIOMASS POWER PLANT BENSON, MINNESOTA Minnesota Pollution Control Agency Permit No: April 25, 2007 Corporate Headquarters 5634 S. 122nd E. Ave. Ste. F Tulsa, Oklahoma Las Vegas Office 5925 E. Lake Mead Blvd. Las Vegas, Nevada Philadelphia Office 8900 State Road Philadelphia, Pennsylvania Houston Office 1920 Treble Drive Humble, Texas (918) or (888)
195 COMPLIANCE TEST PROTOCOL FOR ONE BIOMASS BOILER (SPRAY DRYER ABSORBER INLET AND STACK OUTLET) PREPARED FOR SNC LAVALIN, POWERMINN 9090 LLC, AND FIBROMINN LLC AT THE FIBROMINN BIOMASS POWER PLANT BENSON, MINNESOTA Minnesota Pollution Control Agency Permit No: April 25, 2007 Prepared By: rev - 0 Thomas K. Graham, PE, Director of Operations Corporate Headquarters 5634 S. 122nd E. Ave. Ste. F Tulsa, Oklahoma Las Vegas Office 5925 E. Lake Mead Blvd. Las Vegas, Nevada Philadelphia Office 8900 State Road Philadelphia, Pennsylvania Houston Office 1920 Treble Drive Humble, Texas (918) or (888)
196
197 Table of Contents 1.0 INTRODUCTION General Facility Description Reason for Testing SUMMARY Owner Information Operator Information Site Information Engineering Consultant Information Test Contractor Information Expected Test Start Date Testing Schedule Test Report Content Equipment and Procedures Proposed Variations Compliance Sampling Strategy... 6 Appendix A QA/QC PROGRAM Appendix B TEST EQUIPMENT CONFIGURATION and DESCRIPTION Figure 1 Emissions Testing Setup Figure 2 Wet Chemistry Setup Table 1 Testing Matrix Table 2 Analytical Instrumentation Table 2 Analytical Instrumentation Testing Configuration Appendix C Appendix D Appendix E STACK DRAWINGS EXAMPLE TEMPLATES AND CALCULATIONS AIR HYGIENE STATEMENT OF QUALIFICATIONS i
198 1.0 INTRODUCTION 1.1 General Facility Description PowerMinn 9090, LLC (PowerMinn) owns and Fibrominn, LLC (Fibrominn) operates the Fibrominn Biomass Power Plant (FBPP) in Swift County, Benson, Minnesota. FBPP comprises one boiler, fueled principally with poultry litter. Vegetative biomass may also be burned. The facility generates an average of 50 megawatts (MW) of electricity for export and has a peak electrical export capacity of 55 MW. Emissions from the boiler are controlled by a baghouse spray dryer to control particulate matter and particulate matter less than 10 micron in diameter (PM/PM 10 ), sulfur dioxide (SO 2 ), sulfuric acid mist (H 2 SO 4 ), and hydrochloric acid (HCl). Selective non-catalytic reduction (SNCR) is used to control nitrogen oxides (NOx). Good combustion practices are used to control carbon monoxide (CO) and volatile organic compounds (VOCs). Air emissions testing on the unit will occur at the spray dryer absorber (SDA) inlet and the stack outlet. The SDA inlet duct is circular and measures 10.8 feet (ft) (129 inches) in diameter at the test ports which are approximately 120 ft above grade level. The test ports are located approximately ft (1,222 inches) downstream and approximately 29.2 ft (350 inches) upstream from the nearest disturbances. The stack exhaust is circular and measures 9 feet (ft) (108 inches) in diameter at the test ports which are approximately 104 ft above grade level with an exit elevation of approximately 300 ft above grade level. The test ports are located approximately 75.8 ft (910 inches) downstream and approximately ft (2,358 inches) upstream from the nearest disturbances. 1.2 Reason for Testing FBPP is required to perform air emissions testing in conjunction with the requirements of the Minnesota Pollution Control Agency (MPCA) air emissions permit (Permit No ) and the requirements of the United States Environmental Protection Agency (EPA); to determine the concentrations, rates, and reductions of certain pollutants. Pollutants measured at the stack exhaust will include HCl, mercury (Hg), PM/PM 10, dioxins/furans (PCDD/PCDF), SO 2, NOx, CO, opacity, carbon dioxide (CO 2 ), and oxygen (O 2 ). A reduced number of pollutants will be measured at the SDA inlet (SO 2, HCl, and Hg) to calculate capture efficiencies. All common stack exhaust and SDA pollutant tests will be performed simultaneously. This protocol will be submitted to the MPCA at least 30 days before the first test. 2.0 SUMMARY 2.1 Owner Information Company: PowerMinn 9090, LLC Mailing address: 2295 Corporate Boulevard, Suite 222 Boca Raton, Florida snc-07-benson.mn-comp#1-protocol-rev0c 1
199 2.2 Operator Information Company: Fibrominn, LLC Contact Person: Chuck Wagoner, Owners Site Construction Rep. Mailing address: 900 Industrial Drive PO Box 265 Benson, Minnesota Office: (320) Fax: (320) Site Information Site Name: Contact Person: Location: Office: (320) Cell: (425) Fibrominn Biomass Power Plant Victor Myers, Commissioning Manager 900 Industry Drive Benson Swift County, Minnesota Fax: (320) Engineering Consultant Information Company: SNC Lavalin (SNC) Contact Person: Robert Dolesky, Project Engineer Mailing Address: West Georgia St Vancouver, British Columbia Canada V6E 3C9 Office: (604) Fax: (604) Test Contractor Information Company: Contact Person: Mailing Address: Office: (918) Cell: (918) Fax: (918) Website: 2.6 Expected Test Start Date Thursday, June 14, 2007 Air Hygiene International, Inc. Thomas K. Graham, PE, Director of Operations 5634 South 122 nd East Ave., Suite F Tulsa, Oklahoma tom@airhygiene.com snc-07-benson.mn-comp#1-protocol-rev0c 2
200 2.7 Testing Schedule The following schedule indicates specific activities required to be done each day; however, the schedule may require flexibility and will be extended as necessary. If there are no operational delays, this schedule can be completed as detailed by the testing crew on the two sources (stack outlet and SDA inlet). The details below describe the activities to be conducted on each source. Pre-test Activities Due Date 1. Conduct site inspection per SNC and Air Hygiene 2. Prepare draft test protocol (Air Hygiene) prior to testing 3. Submit final approved test plan to SNC (Air Hygiene) 3 days after comments on draft 4. Pre-test meeting with SNC, MPCA, etc. Prior to testing 5. Receive site safety training Day of arrival for setup On-Site Pre-testing Schedule Time Day 0 Initial Site Mobilization and Setup Arrive at site 09:00 Attend safety training class 09:00 10:00 Setup on inlet and outlet 10:00 18:00 Activities below will be conducted at the SDA inlet and stack exhaust outlet. Testing will be conducted as appropriate run conditions are available and the testing schedule may move up each day if conditions permit. The schedule assumes 12 hour days with no overtime. All tests will be conducted under representative operation conditions with the biomass fired boiler steam load between 90 and 100 percent of the nominal rating (490,000 lb/hr). Operation during periods of boiler and air pollution control system malfunctions or upset conditions will not be considered representative conditions and will be reason for delaying, interrupting, aborting, or invalidating a test run. The following are typical malfunctions or upset conditions that will be reason for delaying, interrupting, or invalidating a test run. 1. Crane outage 2. Fan outage 3. Spray dryer absorber or lime slaker problem 4. Carbon system malfunction 5. Broken or frozen grate bar 6. Plugged feed chute 7. Plugged ash discharge 8. Plugged ash conveyor system 9. Turbine trip 10. Hydraulic failure of system 11. Fabric filter malfunction 12. Steam flow not within 10 percent of steam flow set point 13. Boiler tube leak or rupture 14. Plug or bridge in refuse feed hopper snc-07-benson.mn-comp#1-protocol-rev0c 3
201 When the malfunction or upset condition has been cleared, testing will resume from that point at which it was stopped. If the malfunction or upset condition results in an extended test delay, then the affected test run(s) may be aborted and a new run(s) conducted when the malfunction has been corrected or process upset cleared. The above list represents but not entirely encompasses the most typical malfunctions or process upsets potentially encountered. On-site Testing Activities Time Day 1 Compliance / Performance Testing Daily setup and calibrations 06:00 07:00 Conduct stratification test 07:00 09:00 o Collect outlet data for NOx and O 2 to determine sample collection location(s) Conduct preliminary cyclonic testing and flow measurements 07:00 09:00 o Collect inlet and outlet data for differential pressures, temperatures, and null angles Conduct testing for NOx, CO, SO 2, CO 2, and O 2 09:00 13:00 o Collect outlet data for NOx, CO, SO 2, CO 2, and O 2 (3, 60-minute runs) o Collect simultaneous inlet data for SO 2 and O 2 (3, 60-minute runs) Conduct testing for opacity 09:00 13:00 o Collect outlet data for opacity (3, 60-minute runs) Conduct simultaneous testing for HCl 09:00 14:00 o Collect inlet data for HCl (3, 60-minute runs with setup) O 2, CO 2, and CO data will be monitored by periodic Tedlar bag collection o Collect outlet data for HCl (3, 60-minute runs with setup) O 2, CO 2, and CO data will be monitored by the RM analyzers Day 2 Compliance / Performance Testing Daily setup and calibrations 06:00 07:00 Conduct simultaneous testing for Hg 07:00 16:00 o Collect inlet data for Hg (3, 120-minute runs with setup) O 2, CO 2, and CO data will be monitored by periodic Tedlar bag collection o Collect outlet data for Hg (3, 120-minute runs with setup) O 2, CO 2, and CO data will be monitored by the RM analyzers Day 3 Compliance / Performance Testing Daily setup and calibrations 06:00 07:00 Conduct testing for PCDD/PCDF (Runs 1 and 2) 07:00 18:00 o Collect outlet data for PCDD/PCDF (2, 240-min runs with setup) O 2, CO 2, and CO data will be monitored by the RM analyzers Day 4 Compliance / Performance Testing Daily setup and calibrations 06:00 07:00 Conduct testing for PCDD/PCDF (Run 3) 07:00 13:00 o Collect outlet data for PCDD/PCDF (1, 240-min run with setup) O 2, CO 2, and CO data will be monitored by the RM analyzers Day 5 Compliance / Performance Testing Daily setup and calibrations 06:00 07:00 Conduct testing for PM/PM 10 07:00 18:00 o Collect outlet data for PM/PM 10 (3, approx. 150-min, min. 100dscf runs with setup) O 2, CO 2, and CO data will be monitored by the RM analyzers snc-07-benson.mn-comp#1-protocol-rev0c 4
202 Activities after Testing Demobilization of Testing Crew (Air Hygiene) Day 5 Preparation of draft test report (Air Hygiene) Days 6 14* Submit for review to SNC (Air Hygiene) Day 15 Review and comment on draft (SNC) Days Prepare final hard copy test reports (Air Hygiene) Days Final reports delivered to SNC (Air Hygiene) Day 19 * Draft report timeline may depend on out-sourced laboratory analysis timeline. PCDD/PCDF analysis in particular typically takes from 17 to 21 days to complete a full analysis. 2.8 Test Report Content The test report methods and content will meet the requirements of the MPCA and the EPA for compliance and certification testing. The reports will include discussion of the following: Introduction Plant and Sampling Location Description Summary and Discussion of Test Results Relative to Acceptance Criteria Sampling and Analytical Procedures QA/QC Activities Test Results and Related Calculations Stack and Testing Equipment Drawings Raw Field Data and Calibration Data Sheets Sampling Log and Chain-of-Custody Records Audit Data Sheets 2.9 Equipment and Procedures Test Methods and Parameters to Satisfy 40 CFR Part 60 EPA Method 1 for sample location [inlet and outlet] EPA Method 2 for exhaust flow [inlet and outlet] EPA Method 3a for oxygen (O 2 ) [inlet and outlet] EPA Method 3a for carbon dioxide (CO 2 ) [inlet and outlet] EPA Method 4 for exhaust gas moisture [inlet and outlet] EPA Method 5 for particulate matter (PM front half filterable) [outlet] EPA Method 6c for sulfur dioxide (SO 2 ) [inlet and outlet, simultaneous] EPA Method 7e for nitrogen oxides (NOx) [outlet] EPA Method 9 for opacity [outlet] EPA Method 10 for carbon monoxide (CO) [outlet] EPA Method 23 for dioxins and furans (PCDD/PCDF) [outlet] EPA Method 26a for hydrogen chloride (HCl) [inlet and outlet, simultaneous] EPA Method 202 for particulate matter (PM 10 back half condensable) [outlet] Ontario Hydro Method for mercury (Hg) [inlet and outlet, simultaneous] 2.10 Proposed Variations Stainless steel nozzles and inconel liners will be used instead of borosilicate glass (to prevent breakage) in the Method 5/202 sampling assembly. snc-07-benson.mn-comp#1-protocol-rev0c 5
203 Due to test matrix restrictions, schedule, and operations availability; wet chemistry (isokinetic) runs may be stopped before a run is complete. In this case a delay of more than two hours will constitute cooling and capping off the impinger train. Also, wet chemistry test runs may not be run consecutively. Method 26a testing will be from a single point Compliance Sampling Strategy All compliance testing will be performed while the unit is operating between 90 and 100 percent of the nominal throughput. During the dioxin/furan testing, the temperature ( o F) at the inlet to the baghouse spray dryer will be recorded by the plant. In addition to this parameter, for all testing, plant personnel will also track boiler measurements including: turbine output (MW), steam flow (lb/hr), feed water flow (gpm), ambient temperature ( o F), ambient relative humidity (%), barometric pressure (in. Hg), fuel flow (tph), feed water temperature ( o F), super heater outlet steam temperature ( o F), super heater outlet steam pressure (psig), super heater outlet flue gas temperature ( o F), total over fire and under fire combustion air flow (Kacfm); and spray dryer absorber measurements including: total slurry feed (gpm), dilution water feed (gpm), inlet and outlet flue gas temperature ( o F), slurry concentration (%). A. Gases (NOx, SO 2, CO, CO 2, and O 2 ) EPA Methods 7e, 6c, 10, and 3a NOx, SO 2, CO, CO 2, and O 2 testing will be conducted on the stack outlet. Each test run will be 60 minutes in duration. Simultaneously, SO 2 and O 2 testing will be conducted on the SDA inlet to calculate control efficiency. B. PM/PM 10 Testing EPA Methods 5/202 Total Particulate matter (PM) and particulate matter less than 10 microns in diameter (PM 10 ) testing will be conducted on the stack outlet. Each test run will be approximately 150 minutes in duration pulling at least 100 dry standard cubic feet (dscf) of sample volume. An S-type pitot tube will be used to measure cyclonic flow and velocity pressure in accordance with EPA Method 2. This data will be correlated with meter coefficients, temperatures, barometric pressure, and stack gas moisture (EPA Method 4) to determine the stack gas dry exhaust flow rate. PM/PM 10 samples will be collected following EPA Method 5 (front half filterables) and EPA Method 202 (back half condensables) with an isokinetic sampling train utilizing a stainless steel nozzle and inconel probe liner. A scale will be used to measure net weight gain from each impinger to determine moisture gain. Gravimetric analysis by Air Hygiene s in-house laboratory will provide PM/PM 10 results. The exit of the filter holder is connected to a series of four full size impingers. The first three impingers each contain 100 milliliters of de-ionized water. The fourth contains a tared quantity of silica gel. The impingers are maintained at a temperature below 68 o F for the duration of each test. In accordance with EPA Method 202 requirements, all glassware is cleaned prior to testing with soap and water, rinsed with de-ionized water, acetone and finally methylene chloride. Procedures for selecting sampling locations and for operation of the apparatus are derived from EPA Method 5/202 and associated EPA Methods 1 though 4. The sampling apparatus is leak-cheaked before and after each test run. Sampling is performed at an isokinetic rate greater than 90 percent and less than 110 percent. snc-07-benson.mn-comp#1-protocol-rev0c 6
204 At the conclusion of each test run, the filter is removed from the filter holder and placed in a labeled Petri dish (container No. 1). Any particles adhering to the filter holder gasket are also transferred to the dish. The probe liner, nozzle, probe fittings and front half of the filter holder are washed three times with acetone to remove any particulate matter or condensate. These rinses are saved in a pre-cleaned glass sample jar (container No. 2). As soon as possible after the post-test leak check the probe and filter will be detached from the impinger train and the nitrogen (N 2 ) purge will begin. During the purge, N 2 will flow through the back half of the sample train at 20 liters per min for one hour. The purge will effectively remove any SO 2 in the sample train which may solidify and cause the laboratory to over-report the amount of particulate matter. The first three impinger catches are measured, their weights recorded, and the catches transferred to container No. 3. The weight gain is added to the silica gel weight gain of the forth impinger to determine the stack gas moisture content. The impingers and all connecting glassware are then rinsed twice with de-ionized water. These rinses are added to container No. 3. A final rinse, of the above components, with methylene chloride is saved in glass sample container No. 4. Sample bottles are sealed, shaken and labeled, and the liquid level is marked. At that time, approximately 200-ml each of de-ionized water, acetone and methylene chloride are prepared for analysis as reagent blanks. Particulate samples collected on the glass fiber filters are analyzed gravimetrically to a constant weight. The front half wastes are transferred to tared beakers, evaporated to dryness, and brought to constant weights. The impinger water is extracted by adding the contents of the methylene chloride rinse to the impinger water, and separating the layers in a separatory funnel. Two additional 75 milliliter portions of methylene chloride are added to the funnel to complete the extraction. The organic extract fraction is then placed into a tared beaker and evaporated at room temperature to dryness. It is then desiccated for 24 hours and brought to a constant weight. The aqueous inorganic fraction is taken to dryness at a slightly elevated temperature and allowed to air dry at room temperature. The residue is then desiccated for 24 hours and brought to a constant weight. The weight differentials for the organic and inorganic fractions are combined to determine the total condensable particulate matter. The particulate analysis is performed by Air Hygiene s in house laboratory. C. Mercury Testing Ontario Hydro Method Mercury (Hg) testing will be conducted simultaneously on the SDA inlet and stack outlet. Each test run will be 120 minutes in duration. An S-type pitot tube will be used to measure cyclonic flow and velocity pressure in accordance with EPA Method 2. This data will be correlated with meter coefficients, temperatures, barometric pressure, and stack gas moisture (EPA Method 4) to determine the stack gas dry exhaust flow rate. Mercury samples will be collected following the Ontario Hydro Method (ASTM D ) with an isokinetic sampling train utilizing a glass nozzle and probe liner. snc-07-benson.mn-comp#1-protocol-rev0c 7
205 The exit of the filter holder is connected to a series of eight full size impingers. The first three impingers each contain 100 ml of 1.0 N potassium chloride (KCl). The fourth impinger contains 100 ml of 5% nitric acid (HNO 3 ) / 10% hydrogen peroxide (H 2 O 2 ). The fifth, sixth, and seventh impinger contain 100 ml of 10% sulfuric acid (H 2 SO 4 ) / 4% potassium permangate (KMnO 4 ). The eighth contains a tared quantity of silica gel. The impingers are maintained at a temperature below 68 o F for the duration of each test. Procedures for selecting sampling locations and for operation of the apparatus are derived from Ontario Hydro Method and associated EPA RMs 1 though 4. The sampling apparatus is leak-checked before and after each test run. Sampling is performed at an isokinetic rate greater than 90 percent and less than 110 percent. At the conclusion of each test run, the probe and nozzle will be rinsed and brushed with 0.1 normal nitric acid to remove any particulate matter. These rinses will be collected into polyethylene sample containers. The quartz fiber filter will be recovered and placed into a polyethylene sample container. The volume of liquid collected in each of the impingers will be quantified. The liquid from the first three impingers will be transferred to a leak-free polyethylene storage container. The first three impingers and all connecting glassware will be rinsed with 0.1 normal nitric acid which will be added to the storage container. The liquid from the fourth impinger will be transferred to a separate polyethylene container, and the impinger will be rinsed into the container with 0.1 normal nitric acid. The contents of impingers 5, 6, and 7 will be collected into an amber glass container. All impingers 5, 6, and 7 and the connecting glassware will then be rinsed with 0.1 normal nitric acid and 8.0 normal hydrochloric acid. These rinses will also be collected in the glass container. All containers will be sealed, labeled and liquid levels marked prior to transport to the laboratory. The silica gel weight and the volume of condensate collected in the impingers will be used to determine moisture content of the stack gas. A scale will be used to measure net weight gain from each impinger to determine moisture gain. An out-sourced laboratory will be used to provide mercury results. D. Dioxin/Furan Testing EPA Method 23 Dioxin/Furan (PCDD/PCDF) testing will be conducted on the stack outlet. Each test run will be 240 minutes in duration. An S-type pitot tube will be used to measure cyclonic flow and velocity pressure in accordance with EPA Method 2. This data will be correlated with meter coefficients, temperatures, barometric pressure, and stack gas moisture (EPA Method 4) to determine the stack gas dry exhaust flow rate. Dioxin/Furan samples will be collected following EPA Method 23 with an isokinetic sampling train utilizing a glass nozzle and probe liner. Particulate will be collected on a filter and a sorbent cartridge will retain vaporous emissions. Following sampling, the appropriate components of the train will be recovered and transferred to the laboratory for analysis. The components will be extracted and the extracts will be cleaned to remove excessive levels of potential interference. A scale will be used to measure net weight gain from each impinger to determine moisture gain. An out-sourced laboratory will be used to provide dioxin/furan results. snc-07-benson.mn-comp#1-protocol-rev0c 8
206 All sampling train components that contact the recovered sample will be composed of borosilicate glass, polytetrafluoroethylene (PTFE) or similar materials to avoid potential sample contamination or reactions with PCDDs and PCDFs. The exit of the filter holder will be connected to a water jacketed glass coil condenser and adsorbent trap unit, configured such that the flue gas and condensed moisture will flow down through the resin in the cartridge. The adsorbent trap will contain an XAD resin cartridge to adsorb the PCDDs and PCDFs present in the vapor and condensed portion of the sample. The resin cartridges will be pre-cleaned and spiked with isotopically labeled surrogates by an outsourced laboratory prior to use in the field. During operation, a leak-free submersible pump will be used to re-circulate cooling water through the coil condenser to ensure proper cooling of the condenser and resin cartridge unit. Immediately following the adsorbent cartridge will be a series of four full size leak-free glass impingers. All impingers will be of the Greenburg-Smith design, with the first impinger being further modified to have a short stem, to prevent the sample gas from bubbling through the collected condensate. The first impinger will be empty, the second and third impingers each contained 100 milliliters of HPLC-grade distilled water, the fourth empty and the firth will be charge with silica gel. The impingers will be immersed in an ice bath for the duration of the test. All train components will be cleaned before use to avoid organic contamination. This cleaning will include a hot soapy wash, three dionized water rinses, two hours of heating at 450 o F, three acetone rinses, and three methylene chloride rinses. All glassware components are then covered with hexane rinsed aluminum foil until assembled at the site. The impingers will be connected to the metering system via an umbilical. The metering system includes a vacuum gauge, a leak-free pump, thermometers accurate to within ±5.4 o F, and a dry gas meter accurate to within two percent. Procedures for selecting sampling locations and for operation of the train will be derived from EPA Method 23 and associated Methods 1 through 5. The flue gas sample will be collected by operating the train according to the Method 5 specifications, including leakchecking, isokinetic sampling rates, and stack traversing. Sampling will be performed isokinetically (within plus or minus 10 percent). At the conclusion of each test run, the probe and umbilical will be carefully removed from the sampling train. The inlet to the sampling train will be removed to a clean field laboratory for sample recovery. The sample from the probe nozzle and probe liner will be recovered at the sampling location. The recovered sample will consist of the following components: Glass fiber filter and particulate catch; Adsorbent trap containing the XAD-2 resin; Acetone/Methylene chloride rinse: Probe liner and nozzle rinsed and brushed three times with acetone and rinsed three times with methylene chloride combined with three rinses of the filter holder, coil condenser and all interconnecting glassware, with three soaks of the condenser with acetone and methylene chloride each; snc-07-benson.mn-comp#1-protocol-rev0c 9
207 Toluene rinse: Probe liner and nozzle rinsed three times combined with three rinses of the filter holder, coil condenser and all interconnecting glassware with three soaks of the condenser with toluene; The volume of water collected in the impinger train will be measured gravimetrically. One field train blank will be assembled, recovered and analyzed in the same manner as a sample train. The samples will be analyzed for PCDDs and PCDFs in accordance with EPA Method 23 protocol using high resolution gas chromatography and high resolution mass spectrometry (GC/MS). All Method 23 samples will be analyzed with the DB-5S column with modified calibration and additional quality assurance procedures as a direct substitute for the DB-5 and DB-225 columns. Confirmation of the 2,3,7,8 TCDF and 2,3,7,8 isomers will be performed on the DB-5S column and modified calibration procedures meets the column separation requirement and can be used as a direct substitute for the DB-5 and DB-225 columns in accordance with Method 23 as approved by the USEPA. All of the organic analytical work will be performed by an outsourced laboratory. All components of the recovered sampling train, including the toluene rinse, will be pooled and extracted for one analysis. E. Hydrogen Chloride Testing EPA Method 26/26a Hydrogen chloride (HCl) testing will be conducted simultaneously on the SDA inlet and stack outlet. Each test run will be 60 minutes in duration. Each test will be conducted from a single point in the stack. This data will be correlated with meter coefficients, temperatures, barometric pressure, and stack gas moisture (EPA Method 4) to determine the stack gas dry exhaust flow rate. HCl samples will be collected following EPA Method 26a with an isokinetic sampling train utilizing a glass nozzle and probe liner. A scale will be used to measure net weight gain from each impinger to determine moisture gain. An out-sourced laboratory will be used to provide HCl results. The train components will include a glass nozzle, heated glass lined probe, heated quartz fiber filter, and four full size impingers. The first impinger will have 50 milliliters of 0.1 N sulfuric acid solution and a short stem. The second and third impingers will each have 100 milliliters of 0.1 N sulfuric acid solution. The forth impinger will be empty and the fifth will contain silica gel. The soldium hydroxide impingers will not be used as chlorine (Cl 2 ), does not need to be determined. An integrated sample of at least 30 dry standard cubic feet will be extracted from the gas stream and passed through the dilute sulfuric acid. In the dilute acid, the HCl gas dissolves and forms chloride (Cl - ) ions. The train will be leak checked as described in Method 5 from the end of the glass probe liner after testing. After the one hour test the first four impingers, all connecting glassware and back half of the filter housing will be rinsed into one polyethylene container. The probe liner, filter and filter housing will not be recovered. The liquid level of the one sample container will be marked. The Cl - concentration will be determined by ion chromatoghraphy. As part of the quality assurance program, one duplicate analysis will be performed as specified in Method 26a. In addition, a spike analysis will be performed on one of the snc-07-benson.mn-comp#1-protocol-rev0c 10
208 samples. Three runs will be performed for each unit. The hydrogen chloride removal efficiency will be calculated using the 7% O 2 concentration at the SDA inlet and stack outlet. F. Opacity EPA Method 9 Visual opacity from the stack outlet will be determined using EPA Method 9. This method determines the level of any visible emissions that occur during the observation period. It requires that the opacity of emission be determined by a trained and certified individual. Three one hour runs will be observed from the proper location(s) on the stack outlet. The opacity level is recorded every 15 seconds. snc-07-benson.mn-comp#1-protocol-rev0c 11
209 APPENDIX A QA/QC PROGRAM
210 QA/QC PROGRAM AIR HYGIENE ensures the quality and validity of its emission measurement and reporting procedures through a rigorous quality assurance (QA) program. The program is developed and administered by an internal QA team and encompasses five major areas: 1. QA reviews of reports, laboratory work, and field testing; 2. Equipment calibration and maintenance; 3. Chain-of-custody; 4. Training; and 5. Knowledge of current test methods. QA Reviews AIR HYGIENE s review procedure includes a review of each source test report, along with laboratory and fieldwork by the QA Team. The most important review is the one that takes place before a test program begins. The QA Team works closely with technical division personnel to prepare and review test protocols. Test protocol review includes selection of appropriate test procedures, evaluation of interferences or other restrictions that might preclude use of standard test procedures, and evaluation and/or development of alternate procedures. Equipment Calibration and Maintenance The equipment used to conduct the emission measurements is maintained according to the manufacturer s instructions to ensure proper operation. In addition to the maintenance program, calibrations are carried out on each measurement device according to the schedule outlined by the Environmental Protection Agency. Quality control checks are also conducted in the field for each test program. Chain-of-Custody AIR HYGIENE maintains full chain-of-custody documentation on all samples and data sheets. In addition to normal documentation of changes between field sample custodians, laboratory personnel, and field test personnel, AIR HYGIENE documents every individual who handles any test component in the field (e.g., probe wash, impinger loading and recovery, filter loading and recovery, etc.). Samples are stored in a locked area to which only AIR HYGIENE personnel have access. Field data sheets are secured at AIR HYGIENE s offices upon return from the field. Training Personnel training is essential to ensure quality testing. AIR HYGIENE has formal and informal training programs, which include: 1. Attendance at EPA-sponsored training courses; 2. Enrollment in EPA correspondence courses; 3. A requirement for all technicians to read and understand Air Hygiene Incorporated s QA manual; 4. In-house training and QA meetings on a regular basis; and 5. Maintenance of training records. Knowledge of Current Test Methods With the constant updating of standard test methods and the wide variety of emerging test procedures, it is essential that any qualified source tester keep abreast of new developments. AIR HYGIENE subscribes to services, which provide updates on EPA reference methods, rules, and regulations. Additionally, source test personnel regularly attend and present papers at testing and emission-related seminars and conferences.
211 COMBUSTION TESTING QUALITY ASSURANCE ACTIVITIES A number of quality assurance activities are undertaken before, during, and after each testing project. The following paragraphs detail the quality control techniques, which are rigorously followed during testing projects. Each instrument s response is checked and adjusted in the field prior to the collection of data via multi-point calibration. The instrument s linearity is checked by first adjusting its zero and span responses to zero nitrogen and an upscale calibration gas in the range of the expected concentrations. The instrument response is then challenged with other calibration gases of known concentration and accepted as being linear if the response of the other calibration gases agreed within ± 2 percent of range of the predicted values. After each test run, the analyzers are checked for zero and span drift. This allowed each test run to be bracketed by calibrations and documents the precision of the data just collected. The criteria for acceptable data are that the instrument drift is no more than 3 percent of the full-scale response. Quality assurance worksheets are prepared to document the multipoint calibration checks and zero to span checks performed during the tests. The sampling systems are leak checked by demonstrating that a vacuum greater than 10 in Hg could be held for at least 1 minute with a decline of less than 1 in. Hg. A leak test is conducted after the sample system is set up and before the system is dismantled. This test was conducted to ensure that ambient air had not diluted the sample. Any leakage detected prior to the tests would be repaired and another leak check conducted before testing commenced. The absence of leaks in the sampling system is also verified by a sampling system bias check. The sampling system s integrity is tested by comparing the responses of the analyzers to the calibration gases introduced via two paths. The first path was directly into the analyzer and the second path via the sample system at the sample probe. Any difference in the instrument responses by these two methods is attributed to sampling system bias or leakage. The criteria for acceptance are agreement within 5% of the span of the analyzer. The control gases used to calibrate the instruments are analyzed and certified by the compressed gas vendors to ± 1% accuracy for all gases. EPA Protocol No. 1 was used where applicable to assign the concentration values traceable to the National Institute of Standards and Technology (NIST), Standard Reference Materials. AIR HYGIENE maintains a large variety of calibration gases to allow the flexibility to accurately test emissions over a wide range of concentrations.
212 APPENDIX B TEST EQUIPMENT CONFIGURATION and DESCRIPTION
213 INSTRUMENT CONFIGURATION AND OPERATIONS FOR GAS ANALYSIS The sampling and analysis procedures to be used conform in principle with the methods outlined in the Code of Federal Regulations, Title 40, Part 60, Appendix A, Methods 1, 2, 3a, 4, 5, 6c, 7e, 9, 10, 23, 26a; 40 CFR 51, Appendix M, Method 202; and the Ontario Hydro Method. The sample system to be used for the NOx, SO 2, CO 2, CO, and O 2 tests is configured per the following description. A stainless steel probe will be inserted into the sample port of the stack. The gas sample will be continuously pulled through the probe and transported via 3/8 inch heat-traced Teflon tubing to a stainless steel, minimum-contact condenser designed to dry the sample and then through Teflon tubing via a stainless steel/teflon diaphragm pump and into the sample manifold within the mobile laboratory. From the manifold, the sample is partitioned to the NOx, SO 2, CO 2, CO, and O 2 analyzers through rotameters that control the flow rate of the sample. The schematic (Figure 1) shows that the sample system is also equipped with a separate path through which a calibration gas could be delivered to the probe and back through the entire sampling system. This allows for convenient performance of system bias checks as required by the testing methods. All instruments are housed in an air-conditioned, trailer-mounted mobile laboratory. Gaseous calibration standards are provided in aluminum cylinders with the concentrations certified by the vendor according to EPA Protocol No. 1. This general schematic also illustrates the analyzers to be used for the tests (i.e., O 2, CO). All data from the Reference Method continuous monitoring instruments are recorded on a Logic Beach Hyperlogger. The Hyperlogger retrieves calibrated emissions data from each instrument every second. An average value is recorded every 30 seconds. The stack gas analysis for O 2 and CO 2 concentrations will be performed in accordance with procedures set forth in EPA Method 3a. The O 2 analyzer uses a paramagnetic cell detector. The CO 2 analyzer uses a continuous nondispersive infrared (NDIR) analyzer. EPA Method 6c will be used to determine the concentrations of SO 2. An ultraviolet analyzer will be used to determine the sulfur dioxide concentrations in the gas stream. EPA Method 7e will be used to determine concentrations of NOx. A chemiluminescence analyzer will be used to determine the nitrogen oxides concentration in the gas stream. A NO 2 in nitrogen certified gas cylinder will be used to verify at least a 90 percent NO 2 conversion on the day of the test. CO emission concentrations will be quantified in accordance with procedures set forth in EPA Method 10. A continuous nondispersive infrared (NDIR) analyzer was used for this purpose. Figure 2 represents the sample train setup for all of the wet chemistry (isokinetic) sampling. An S-type pitot tube will be used to measure cyclonic flow and velocity pressure in accordance with EPA Method 2. This data will be correlated with meter coefficients, temperatures, barometric pressure, and stack gas moisture (EPA Method 4) to determine the stack gas dry exhaust flow rate. Samples will be collected following EPA Methods with an isokinetic sampling train utilizing a stainless steel or glass nozzles and inconel or glass probe liners as appropriate. A scale will be used to measure net weight gain from each impinger to determine moisture gain.

214 ##.## ##.## ##.## ##.## ##.## ##.## E:\SHARED\DRAWINGS\ETL SCHEMATIC.PPT 09/17/02 DRAWING: TKG COPYRIGHT 2002 AIR HYGIENE INTERNATIONAL, INC. CO 2 ANALYZER STACK flow bias line THC cal line to vent to NOx to CO to CO 2 /O 2 MANIFOLD CO ANALYZER O 2 ANALYZER HYPER- LOGGER DATA RECORDER NOx ANALYZER heated sample line to THC THC ANALYZER GAS CONDITIONER SO 2 ANALYZER (optional) calibration/bias line VENT CALIBRATION/BIAS GAS BOTTLES Figure 1 EMISSIONS TESTING LAB 5634 S. 122 nd East Ave, Suite F Tulsa, Oklahoma (888)
215 E:\SHARED\DRAWINGS\SAMPLING TRAIN GEN3.PPT 02/11/04 DRAWING: TKG View of Probe End (from the bottom) Nozzle Temperature Sensor Temperature Sensor Probe Type S Pitot Tube Stack Wall Liner (glass, stainless steel, or inconel) Probe Housing (heated opt.) Temperature Sensor Impingers COPYRIGHT 2004 AIR HYGIENE INTERNATIONAL, INC. could add more impingers or other components to system Wet Chemistry Assembly (photo) Temperature Sensor Type S Pitot Tube Glass Filter Holder Ice Water Bath Vacuum Line Orifice Temperature Sensor Oil-Filler Manometer Temperature Sensor Hot Box Heated Area Filled with water or other various chemicals to cause capture of condensed liquid or reaction with target compounds Cold Box Vacuum Gauge By-pass Valve Main Valve Dry Gas Meter Figure 2 WET CHEMISTRY ASSEMBLY Oil-Filler Manometer Air-Tight Pump 5634 S. 122 nd East Ave, Suite F Tulsa, Oklahoma (888)
216 TABLE #1: TESTING MATRIX Target Emission EPA Test Method Location Test Length O 2 3a Inlet / Outlet 3, 60 minute runs [inlet] 3, 60 minute runs [outlet] SO 2 6c Inlet / Outlet 3, 60 minute runs [inlet] 3, 60 minute runs [outlet] NOx 7e Outlet 3, 60 minute runs CO 10 Inlet / Outlet 3, 60 minute runs [inlet] 3, 60 minute runs [outlet] CO 2 3a Inlet / Outlet 3, 60 minute runs [inlet] 3, 60 minute runs [outlet] PM (front half 5 Outlet 3, 150-minute runs filterable) PM 10 (back half 202 Outlet 3, 150-minute runs condensable) Opacity 9 Outlet 3, 60-minute runs Hg Ontario Hydro Outlet 3, 120-minute runs HCl 26/26a Inlet / Outlet 3, 60 minute runs [inlet] 3, 60 minute runs [outlet] Dioxins/Furans 23 Outlet 3, 240-minute runs TABLE #2: ANALYTICAL INSTRUMENTATION Parameter NOx SO 2 CO CO 2 O 2 Model and Manufacturer API 200AH or equivalent Ametek 721M or equivalent TECO 48C or equivalent Servomex or equivalent Servomex or equivalent Common Use Ranges User may select up to 5,000 ppm User may select up to 10,000 ppm 0-10,000 ppm Sensitivity Detection Principle 0.1 ppm Thermal reduction of NO 2 to NO Chemilumines-cence of reaction of NO with O 3. Detection by PMT. Inherently linear for listed ranges. 0.1 ppm Ultraviolet 0.1 ppm Infrared absorption, gas filter correlation detector, microprocessor based linearization. 0-20% 0.1% Nondispersive infrared 0-25% 0.1% Oxygen - Paramagnetic cell
217 TABLE #3: ANALYTICAL INSTRUMENTATION TESTING CONFIGURATION Parameter Sample Methodology Example Range Sensitivity Calibration Gases (based on example range) NOx 7e ppm 0.1 ppm Zero = 0 ppm nitrogen Mid = ppm High = 500 ppm SO 2 6c ppm 0.1 ppm Zero = 0 ppm nitrogen Mid = ppm High = 200 ppm CO ppm 0.1 ppm Zero = 0 ppm nitrogen Mid = ppm High = 200 ppm CO 2 3a 0-20% 0.1% Zero = 0 ppm nitrogen Mid = 8 12% High = 20% O 2 3a 0-21% 0.1% Zero = 0 ppm nitrogen Mid = % High = 21%
218 APPENDIX C STACK DRAWINGS
219 METHOD 1 - ISOKINETIC TRAVERSE FOR A CIRCULAR SOURCE Company SNC - Lavalin Date 2007 Plant Name Fibrominn Biomass Power Plant Equipment Biomass Boiler, SDA Inlet Project # snc-07-benson.mn-comp#1 # of Ports Available 4 Location Benson, Minnesota # of Ports Used 4 Circular Stack or Duct Diameter D Distance to Far Wall of Stack (L fw ) in. North Distance to Near Wall of Stack (L nw ) in.* Diameter of Stack (D) in. L fw = in. Area of Stack (A s ) ft 2 *assume 12 in. reference Distance from Disturbances to Port Distance Upstream (A) in. D = in. Diameters Upstream (A D ) 2.71 diameters A Distance Downstream (B) in. L nw = 12.0 in. Diameters Downstream (B D ) 9.47 diameters C Diameters to Flow Disturbance Number of Traverse Points Required Minimum Number of 1 Traverse Points Minimum Number of Traverse Points Comp Stratification Down (B D ) Up (A D ) Particulate Velocity Stream Stream Points Points Criteria Points RM 7E RM1 pts Alt 7E points A = 29.2 ft. 12 points A D = 2.7 dia. >= 8.00 >= or or 12 2 Minimum Number of Upstream Spec Traverse Points Downstream Spec RATA Stratification Traverse Pts Required Criteria Points B = ft. 1 Check Minimum Number of Points for the Upstream Part75/60 12 RM1 pts B D = 9.5 dia. and Downstream conditions, then use the largest. 75 abrv (a) 3 points 2 8 for Circular Stacks 12 to 24 inches 75 abrv (b) 6 points 12 for Circular Stacks over 24 inches 12 points B FLOW Disturbance to Disturbance to Upstream Port Downstream Port Number of Traverse Points Used 4 Ports by 3 Pts / port 12 Pts Used 12 Required Traverse Point Number Traverse Point Locations Percent of Stack Diameter Distance from Inside Wall Distance Including Reference Length Isokinetic Traverse (Wet Chemistry % in. in % 5 5/8 17 5/ % 18 7/8 30 7/ % 38 1/8 50 1/ / / / snc-07-benson.mn-comp#1-sda-strat
220 METHOD 1 - ISOKINETIC TRAVERSE FOR A CIRCULAR SOURCE Company SNC - Lavalin Date 2007 Plant Name Fibrominn Biomass Power Plant Equipment Biomass Boiler, Stack Exhaust Project # snc-07-benson.mn-comp#1 # of Ports Available 4 Location Benson, Minnesota # of Ports Used 4 Circular Stack or Duct Diameter D Distance to Far Wall of Stack (L fw ) in. North Distance to Near Wall of Stack (L nw ) in.* Diameter of Stack (D) in. L fw = in. Area of Stack (A s ) ft 2 *assume 12 in. reference Distance from Disturbances to Port Distance Upstream (A) in. D = in. Diameters Upstream (A D ) diameters A Distance Downstream (B) in. L nw = 12.0 in. Diameters Downstream (B D ) 8.43 diameters C Diameters to Flow Disturbance Number of Traverse Points Required Minimum Number of 1 Traverse Points Minimum Number of Traverse Points Comp Stratification Down (B D ) Up (A D ) Particulate Velocity Stream Stream Points Points Criteria Points RM 7E RM1 pts Alt 7E points A = ft. 12 points A D = 21.8 dia. >= 8.00 >= or or 12 2 Minimum Number of Upstream Spec Traverse Points Downstream Spec RATA Stratification Traverse Pts Required Criteria Points B = 75.8 ft. 1 Check Minimum Number of Points for the Upstream Part75/60 12 RM1 pts B D = 8.4 dia. and Downstream conditions, then use the largest. 75 abrv (a) 3 points 2 8 for Circular Stacks 12 to 24 inches 75 abrv (b) 6 points 12 for Circular Stacks over 24 inches 12 points B FLOW Disturbance to Disturbance to Upstream Port Downstream Port Number of Traverse Points Used 4 Ports by 3 Pts / port 12 Pts Used 12 Required Traverse Point Number Traverse Point Locations Percent of Stack Diameter Distance from Inside Wall Distance Including Reference Length Isokinetic Traverse (Wet Chemistry % in. in % 4 6/8 16 6/ % 15 6/8 27 6/ % / / snc-07-benson.mn-comp#1-stack-strat
221 APPENDIX D EXAMPLE TEMPLATES AND CALCULATIONS
222 SINGLE LOAD TEST - FIELD DATA SHEET Company: O 2 NOx CO Location: CYLINDER SERIAL Low Date: NUMBERS Mid Unit Make and Model: High Unit Number: Serial Number: THC CO 2 SO 2 Data Recorded By: CYLINDER SERIAL Low Tested With AHI Unit(s): Truck(s): Trailer(s): NUMBERS Mid LDEQ Warmup/Cal Req: On (Day/Time): Cal (Day/Time): High RUN INFORMATION Time Start (hh:mm:ss) Time Stop (hh:mm:ss) Rated Power (MW or hp) Actual Power (MW or hp) Barometric Pressure (in. Hg) Ambient Temperature ( o F) Relative Humidity (%) Fuel Flow (lb/min) Fuel Flow (SCF/hr)=(lb/min)*21.7 Specific Humidity (gr/lb) Spec. Hum. (lb H 2 O/lb air)=(gr/lb)/7000 PCD (psi) PCD (mm Hg)=(psi+14.24)* NOx Water Injection (gpm) Load NO 2 CONVERSION RESPONSE TIME % #1 % #2 % #3 NO 2 Gas (ppm) TIME (hh:mm) RESP (min) NO Reading (ppm) NOx Reading (ppm) Cylinder Num 1 st Gas Inject 1 st 95% 2 nd 95% 3 rd 95% REPORT INFORMATION 2 nd Gas Inject INSTRUMENT SERIAL # 1 st 95% O 2 2 nd 95% NOx 3 rd 95% CO 3 rd Gas Inject THC 1 st 95% CO 2 2 nd 95% SO 2 3 rd 95% CALIBRATION Zero Gas Low Gas Mid Gas High Gas O 2 NOx CO THC CO 2 SO 2 Conc. Actual Conc. Actual Conc. Actual Conc. Actual Conc. Actual Conc. Actual BIAS Initial Run #1 Run #1 / Run #2 Run #2 / Run #3 Run #3 / Final Bias Gas Actual Conc. O 2 NOx CO THC CO 2 SO 2 Zero Mid Zero Mid Zero Mid Zero Mid Zero Mid Zero Mid
223 Method Used (Circle One) Method 9 203A 203B Other: VISUAL EMISSIONS OBSERVATION FORM Form Number Page of Company Name Continued on Form Number Facility Name Observation Date Time Zone Start Time End Time Street Address Min. Sec Comments City State Zip 1 2 Process Unit # Operating Mode 3 Control Equipment Operating Mode 4 Describe Emissions Pont Height of Emiss. Pt. Height of Emiss. Pt. Rel. to Observer Start End Start End Distance to Emiss. Pt. Direction to Emiss. Pt. (Degrees) Start End Start End Vetical Angle to Obs. Pt. Direction to Obs. Pt. (Degrees) Start End Start End Distance and Direction to Observation Point from Emission Point Start End Describe Emissions Start End Emission Color Water Droplet Plume Start End Start End Describe Plume Background Start End Background Color Sky Conditions Start End Start End Wind Speed Wind Direction Start End Start End Ambient Temp. Wet Bulb Temp. RH Percent Start End Source Layout Sketch Draw North Arrow TN MN Emissions Point FEET FEET 27 Observer Side View 28 Stack 140 o with Plume 29 Sun Location Line Sun 30 Wind Latitude Longitude Declination Observer's Name (Print) Observer's Signature Date Additional Information Organization Certified By Date
224 Air Permit # : Plant Name or Location: Date: Project Number: Manufacturer & Equipment: Model: Serial Number: Unit Number: Test Load: Tester(s) / Test Unit(s): RUN UNITS Start Time hh:mm:ss End Time hh:mm:ss Bar. Pressure in. Hg Amb. Temp. F Rel. Humidity % Spec. Humidity lb water / lb air Comb. Inlet Pres. psig NOx Water Inj. gpm Total Fuel Flow SCFH Heat Input MMBtu/hr Power Output megawatts Steam Rate lb/hr Comp&RATA&Eng-AHI v1.3
225 Calibration Date: Client: THERMO 42H (NOx Analyzer) Linearity Plot NOx Span (ppm) = THERMO 42H (NOx Analyzer) Certified Concentration (ppm) Linearity = Instrument Response (ppm) Calibration Error (%) Absolute Conc. (ppm) Pass or Fail (±2%, 0.5ppm) Instrument Response (ppm) Certified Concentrations (ppm) API 300 (CO Analyzer) Linearity Plot CO Span (ppm) = Certified Concentration (ppm) API 300 (CO Analyzer) Instrument Response (ppm) Calibration Error (%) Absolute Conc. (ppm) Pass or Fail (±2%, 0.5ppm) Instrument Response (ppm) Linearity = Certified Concentrations (ppm) SERVOMEX 1400 (O2 Analyzer) Linearity Plot O2 Span (%) = SERVOMEX 1400 (O2 Analyzer) Certified Concentration (ppm) Instrument Response (ppm) Calibration Error (%) Absolute Conc. (ppm) Pass or Fail (±2%, 0.5%) Instrument Response (%) Linearity = Certified Concentrations (%) THC Range (ppm) = THERMO 51 (THC Analyzer) Certified Concentration (ppm) Linearity = Instrument Response (ppm) Calibration Error (%) 1 -zero/high based on 2% of span, low/mid based on 5% of concentration Estimated Point (ppm) Pass or Fail (±2,5%) 1 Instrument Response (ppm) THERMO 51 (THC Analyzer) Linearity Plot Certified Concentrations (ppm) 1.20 FUJI 3300 (CO2 Analyzer) Linearity Plot CO2 Span (%) = FUJI 3300 (CO 2 Analyzer) Certified Concentration (ppm) Instrument Response (ppm) Calibration Error (%) Absolute Conc. (ppm) Pass or Fail (±2%, 0.5%) Instrument Response (%) Linearity = Certified Concentrations (%) Ametek 721M (SO2 Analyzer) Linearity Plot 1.20 SO2 Span (ppm) = Ametek 721M (SO 2 Analyzer) Certified Concentration (ppm) Instrument Response (ppm) Calibration Error (%) Absolute Conc. (ppm) Pass or Fail (±2%, 0.5ppm) Instrument Response (ppm) Linearity = Certified Concentrations (ppm) Comp&RATA&Eng-AHI v1.3 App. D
226 NOx Converter Efficiency Date: Analyzer: RM 7E, ( ), Introduce a concentration of 40 to 60 ppmv NO 2 to the analyzer in direct calibration mode and record the NOx concentration displayed by the analyzer.... Calculate the converter efficiency using Equation 7E-7 in Section The specification for converter efficiency in Section 13.5 must be met.... The NO 2 must be prepared according to the EPA Traceability Protocol and have an accuracy within 2.0 percent. Audit Gas: NO 2 Concentration (C v ), ppmvd Converter Efficiency Calculations: Analyzer Reading, NO Channel, ppmvd Analyzer Reading, NOx Channel, ppmvd Analyzer Reading, NO 2 Channel (C Dir(NO2) ), ppmvd Converter Efficiency, % RM 7E, ( ), 13.5 NO2 to NO Conversion Efficiency Test (as applicable). The NO2 to NO conversion efficiency, calculated according to Equation 7E-7 or Equation 7E-9, must be greater than or equal to 90 percent. C Dir ppmvd Eff 2 = 100 Eq. 7E-7 = NO x 100 = CV ppmvd Date/Time Elapsed Time NOx NO mm/dd/yy hh:mm:ss Seconds ppmvd ppmvd Comp&RATA&Eng-AHI v1.3 App. D
227 Fuel Data Weather Data Fuel F d factor SCF/MMBtu Barometric Pressure in. Hg Fuel Heating Value (HHV) Btu/SCF Relative Humidity Ambient Temperature Specific Humidity % o F lb H 2O / lb air Unit Data Unit Load megawatts Heat Input lb/mmbtu Steam Rate Steam lb/hr Combustor Inlet Pres. psig NOx Control Water Injection gpm Est. Stack Moisture % Stack Exhaust Flow (M2) SCFH Stack Exhaust Flow (M19) SCFH Run - 1 Date/Time Elapsed Time O 2 NOx CO (mm/dd/yy hh:mm:ss) (seconds) (%) (ppmvd) (ppmvd) RAW AVERAGE Bias Serial Number: Initial Zero Final Zero Avg. Zero Initial UpScale Final UpScale Avg. UpScale O 2 NOx CO (%) (ppmvd) (ppmvd) Upscale Cal Gas EMISSIONS DATA Corrected Raw Average (ppm/% dry basis) Corrected Raw Average (ppm/% wet basis) Concentration (ppm@ %O₂) Concentration (ppm@ %O₂&ISO) Emission Rate (lb/hr) Emission Rate (tons/day) at 24 hr/day Emission Rate (tons/year) at 8760 hr/yr Emission Rate (lb/mmbtu) Emission Rate (g/hp*hr) O 2 NOx CO Comp&RATA&Eng-AHI v1.3 App. B
228 DRIFT AND BIAS CHECK Run - 1 O2 NOx CO Raw Average Corrected Average Initial Zero Final Zero Avg. Zero Initial UpScale Final UpScale Avg. UpScale Sys Resp (Zero) Sys Resp (Upscale) Upscale Cal Gas Initial Zero Bias Final Zero Bias Zero Drift Initial Upscale Bias Final Upscale Bias Upscale Drift Alternative Specification Abs Diff Initial Zero Final Zero Initial Upscale Final Upscale Calibration Span 3% of Range (drift) 5% of Range (bias) DRIFT AND BIAS CHECK Run - 2 O2 NOx CO Raw Average Corrected Average Initial Zero Final Zero Avg. Zero Initial UpScale Final UpScale Avg. UpScale Sys Resp (Zero) Sys Resp (Upscale) Upscale Cal Gas Initial Zero Bias Final Zero Bias Zero Drift Initial Upscale Bias Final Upscale Bias Upscale Drift Alternative Specification Abs Diff Initial Zero Final Zero Initial Upscale Final Upscale Calibration Span 3% of Range (drift) 5% of Range (bias) Comp&RATA&Eng-AHI v1.3 App. D
229 TABLE A.2 LOAD 1 DATA SUMMARY Start Time (hh:mm:ss) End Time (hh:mm:ss) Run Duration (min) Bar. Pressure (in. Hg) Amb. Temp. ( F) Rel. Humidity (%) Spec. Humidity (lb water / lb air) Turbine Fuel Flow (SCFH) Stack Flow (RM19) (SCFH) Power Output (megawatts) NOx (ppmvd) NOx (lb/hr) NOx (lb/mmbtu) NOx (g/hp*hr) CO (ppmvd) CO (lb/hr) CO (lb/mmbtu) CO (g/hp*hr) O₂(%) Parameter Run - 1 Run - 2 Run - 3 Average TABLE A.3 LOAD 2 DATA SUMMARY Start Time (hh:mm:ss) End Time (hh:mm:ss) Run Duration (min) Bar. Pressure (in. Hg) Amb. Temp. ( F) Rel. Humidity (%) Spec. Humidity (lb water / lb air) Turbine Fuel Flow (SCFH) Stack Flow (RM19) (SCFH) Power Output (megawatts) NOx (ppmvd) NOx (lb/hr) NOx (lb/mmbtu) NOx (g/hp*hr) CO (ppmvd) CO (lb/hr) CO (lb/mmbtu) CO (g/hp*hr) O₂(%) Parameter Run - 4 Run - 5 Run - 6 Average Comp&RATA&Eng-AHI v1.3 App. A
230 EXAMPLE CALCULATIONS (INFORMATION) Specific Humidity (RH sp ) Note: RHsp (gr/lb) calculated using temperature, relative humidity, and barometric pressure with psychrometric chart, psychrometric calculator, or built in psychrometric algorithm. RH sp lb 7000 gr gr lb ( lb / lb) = RH sp = gr lb x l lb 7000 gr = lb H 2 O lb Air Fuel Flow Conversion (Q f ) Note: Qf(lb/min) is a value uptained from the source operator. Q f = Q f 1 G MW Fuel Q f = lb 60 min ft 3 lb-mol x x x min hr lb-mol lb = SCFH Combustor Inlet Pressure / Compressor Discharge Pressure (CIP / CDP) (corrected from gauge to atmospheric pres. and conv. to mm Hg.) CIP / CDP = mmhg ( psig + P) 1psi CIP / CDP = psig + Note: CIP / CDP (psig) is a value obtained from the source operator. x mmhg 1 psia = mmhg (abs) Heat Rate (MMBtu/hr) HHV DRY Q f HR = 1,000,000 Heat Rate = Btu SCF x hr SCF x MMBtu 10 6 Btu = hr MMBtu Estimated Stack Gas Moisture Content (B ws ) B ws 2 Q f (%) = 100 Q s B ws = 2 x hr SCF x hr SCF x 100 = % Note: Lack of significant figures may cause rounding errors between actual calculations and example calculations. EXAMPLE CALCULATIONS (CALIBRATION) Analyzer Calibration Error RM 7E, ( ), 12.2 Analyzer Calibration Error. For non-dilution systems, use Equation 7E-1 to calculate the analyzer calibration error for the low-, mid-, and high-level calibration gases. (calc for analyzer mid gas, if applicable) ACE C = C CS Dir V 100 Eq. 7E-1 ACE = ppm - ppm ppm x 100 = % Calibration Error and Estimated Point, RM 25A, THC Analyzer RM 25A, ( ), 8.4 Calibration Error Test. Immediately prior to the test series (within 2 hours of the start of the test), introduce zero gas and highlevel calibration gas at the calibration valve assembly. Adjust the analyzer output to the appropriate levels, if necessary. Calculate the predicted response for the low-level and mid-level gases based on a linear response line between the zero and high-level response. Then introduce low-level and mid-level calibration gases successively to the measurement system.... These differences must be less than 5 percent of the respective calibration gas value. (calc for THC analyzer mid gas, if applicable) C Dir ( H ) C Dir ( Z ) E P = C Dir ( M ) + C C C V ( H ) V ( Z ) Dir ( Z ) Eq. of a line y=mx+b E p = ppm - ppm - ppm ppm x ppm + = ppm ACE C = C CS Dir V 100 Eq. 7E-1 ACE THC = ppm - ppm ppm x 100 = % Note: Lack of significant figures may cause rounding errors between actual calculations and example calculations. Comp&RATA&Eng-AHI v1.3 App. A
231 EXAMPLE CALCULATIONS (BIAS, DRIFT, AND CORRECTED RAW AVERAGE) System Bias RM 7E, ( ), 12.3 System Bias. For non-dilution systems, use Equation 7E-2 to calculate the system bias separately for the low-level and upscale calibration gases. (calc for analyzer upscale gas, Run 1 initial bias, if applicable) SB = C S C CS Dir 100 Eq. 7E-2 SB = ppm - ppm ppm x 100 = % Drift Assessment RM 7E, ( ), 12.5 Drift Assessment. Use Equation 7E-4 to separately calculate the low-level and upscale drift over each test run. (calc for analyzer upscale drift, Run 1, if applicable) D = SB final SB i Eq. 7E-4 D = % - % = % Alternative Drift and Bias RM 7E, ( ), 13.2 / 13.3 System Bias and Drift. Alternatively, the results are acceptable if Cs Cdir is 0.5 ppmv or if Cs Cv is 0.5 ppmv (as applicable). (calc for analyzer initial upscale, Run 1, if applicable) SB / D Alt = C S C Dir Eq. Section 13.2 and 13.3 SB / D Alt = ppm - ppm = ppm Bias Adjusted Average RM 7E, ( ), 12.6 Effluent Gas Concentration. For each test run, calculate Cavg, the arithmetic average of all valid concentration values (e.g., 1- minute averages). Then adjust the value of Cavg for bias, using Equation 7E-5. (calc for analyzer, Run 1, if applicable) C Gas = C MA ( C ) Avg C O C M C O ppm Eq. 7E-5 C Gas = ppm - ppm x = ppm ppm - ppm EXAMPLE CALCULATIONS (BSFC) Using HHV with Q f (SCFH) Using LHV with Q f (Btu/hp*hr) HHV Q BSFC ( Btu / hp hr ) = Q BSFC ( Btu / hp hr ) = f bhp f BSFC = Btu hp*hr = Btu hp*hr BSFC = Btu SCF x SCF hr x 1 hp = Btu hp*hr Using LHV with Q f (SCFH) Using HHV with Q f (Btu/hp*hr) LHV Q BSFC ( Btu / hp hr ) = bhp f Q BSFC ( Btu / hp hr ) = f LHV HHV BSFC = SCF Btu x SCF x hr 1 hp = Btu hp*hr BSFC = N/A Btu hp*hr x Btu SCF x scf Btu = Btu hp*hr EXAMPLE CALCULATIONS (Emissions based on Table 29 values) Emission Rate (lb/hr) Q f (Btu/hp*hr)) E (lb/hr) = g hp*hr E E( lb / hr ) = x lb g g x / hp hr bhp hp = hr lb Emission Rate (g/hp-hr) Q f (Btu/hp*hr)) E g / hp hr ) = CRA Q 1 10 Btu SCF lb 1 parts E (g/hp-hr) = ppm x x x x x 1 MMBtu hp*hr MMBtu lb-mol 10 6 ppm 10 6 Btu g lb-mol 20.9% g x x x = lb 20.9% - hp*hr SCF % 1 10 ( f FFactor MW % G 20.9% CRA O 2 Note: Lack of significant figures may cause rounding errors between actual calculations and example calculations. Comp&RATA&Eng-AHI v1.3 App. A
232 EXAMPLE CALCULATIONS (RUNS) Stack Exhaust Flow (Q S ) - RM19 Q S FFactor Q f HHV 20.9% =,000, % C 1 Gas ( O 2) Q S = x SCF x MMBtu MMBtu 20.90% x 10 6 Btu 20.9% - hr % SCF = x Btu SCF SCFH NO 2 Conversion Efficiency Correction RM 7E, ( ), 12.8 NO2 - NO Conversion Efficiency Correction. If desired, calculate the total NOX concentration with a correction for converter efficiency using Equations 7E-8. (calc for non-bias corrected (raw) NOx gas, Run 1, if applicable) NOx Corr NOx NO = NO Eff NO 2 ppm - ppm Eq. 7E-8 NOx Corr = ppm + x 100 = ppm % Moisture Correction RM 7E, ( ), RM7E, ( ), Moisture Correction. Use Equation 7E-10 if your measurements need to be corrected to a dry basis. (calc for THC analyzer, Run 1, if applicable) Note: Calculations may not match as Run 1 results are typically also bias adjusted C D CW = 1 B WS ppmvw Eq. 7E-10 C D = = ppmvd 1 - Diluent-Corrected Polutant Concentration, O 2 Based RM 20, ( ), Correction of Pollutant Concentration Using O2 Concentration. Calculate the O2 corrected pollutant concentration, as follows: (calc for gas, Run 1, if applicable) C adj = C Gas ( T arg et ) 20.9% 20.9% AdjFactor C Gas ( O 2) Eq C adj = ppm x 20.9% % - % % = ppm@%o₂ Diluent-Corrected Polutant Concentration, CO 2 Based RM 20, ( ), Correction of Pollutant Concentration Using CO2 Concentration. Calculate the CO2 corrected pollutant concentration, as follows: (calc for gas, Run 1, if applicable) X C adj = C Gas ( T arg et ) C CO 2 Gas ( CO 2) Eq C adj = ppm x % % = 7.2 CO 2 Correction Factor. If pollutant concentrations are to be corrected to percent O 2 and CO 2 concentration is measured in lieu of O 2 concentration measurement, a CO 2 correction factor is needed. Calculate the CO 2 correction factor as follows: Calculate the fuel specific F o, as follows: F 0 = F F c d Eq F 0 = x SCF/MMBtu SCF/MMBtu = Calculate the CO 2 correction factor for correcting measurement data to percent oxygen, as follows: X CO % = AdjFactor F 0 Eq X CO2 = 20.9% - % = % Diluent-Corrected Polutant Concentration Corrected to ISO Conditions 40CFR60.335(b)(1), Conversion for conc. at ISO Conditions (68 F, 1 atm). Calculate, as follows: (calc with Run 1 data, if applicable) C ISO C ISO = = C Adj P ( 19 ( )) 288 r H O e Po Ta ppm@%o₂ x 1.53 psig psi psi/mm Hg. psig + psi psi/mm Hg. x (19x( lb/lb )) 1.53 x 288 K K = ppm@% and ISO Note: Lack of significant figures may cause rounding errors between actual calculations and example calculations. Comp&RATA&Eng-AHI v1.3 App. A
233 EXAMPLE CALCULATIONS (RUNS) Emissions Rate (lb/hr) Calculation for pound per hour emission rate. Calculate, as follows: (calc for gas Run 1, if applicable) E lb / hr C Gas = 6 10 Q S MW G E lb/hr = ppm 10 6 ppm/part x SCFH x lb/lb-mol SCF/lb-mol = hr lb Emissions Rate (ton/year) Calculation for tons per year emission rate based on 8760 hours per year. Calculate, as follows: (calc for gas Run 1, if applicable) E ton / yr E = lb / hr hr 2000 year E ton/yr = lb hr ton ton x x = hr year 2000 lb year Emissions Rate (lb/mmbtu) RM 19, ( ), 12.2 Emission Rates of PM, SO2, and NOx. Select from the following sections the applicable procedure to compute the PM, SO2, or NOx emission rate (E) in ng/j (lb/million Btu). (calc for gas Run 1, if applicable) Oxygen Based Oxygen-Based F Factor, Dry Basis. When measurements are on a dry basis for both O 2 (%O 2 d) and pollutant (Cd) concentrations, use the following equation: E lb / MMBtu C = Gas Fd Factor Conv 20.9% C C Gas ( O 2) 20.9% Eq E lb/mmbtu = ppm x SCF/MMBtu x 20.9% - % lb/ppm*ft 3 x 20.9% = lb MMBtu Carbon Dioxide Based Carbon Dioxide-Based F Factor, Dry Basis. When measurements are on a dry basis for both CO 2 (%CO 2 d) and pollutant (Cd) concentrations, use the following equation: E lb / MMBtu C = Gas Fd Factor Conv C Gas ( CO 2) C 100% Eq E lb/mmbtu = ppm x SCF/MMBtu x % lb/ppm*ft 3 x 100% = lb MMBtu Conversion Constant Convc for Conv c = MW 3 ( lb / ppm ft ) G 6 10 Conv c = lb lb mole x 10 6 lb mole SCF = ppm-ft 3 lb Sulfur Dioxide Rate (lb/mmbtu), 40CFR60, App. A, RM 19, Eq (11/20/03) SO 2 ( lb / MMBtu ) = 0.97 K S( wt%) GCV SO 2 = 0.97 x 2x10 4 Btu wt% MMBtu x wt% Btu/lb = lb MMBtu Emissions Rate (g/hp-hr) Calculation for grams per horsepower-hour. Calculate, as follows: (calc for gas Run 1, if applicable) E g / hp hr E lb / hr E lb / = or mw hr hp E g/hp-hr = lb hr x g lb x 1 mw x mw hp = g hp*hr E g/hp-hr = lb hr x g lb x 1 hp = g hp*hr Note: Lack of significant figures may cause rounding errors between actual calculations and example calculations. Comp&RATA&Eng-AHI v1.3 App. A
234 RM 7E, ( ), 12.1 Nomenclature. The terms used in the equations are defined as follows: ACE = Analyzer calibration error, percent of calibration span. B WS = Moisture content of sample gas as measured by Method 4 or other approved method, percent/100. C Avg = Average unadjusted gas concentration indicated by data recorder for the test run. C D = Pollutant concentration adjusted to dry conditions. C Dir = Measured concentration of a calibration gas (low, mid, or high) when introduced in direct calibration mode. C Gas = Average effluent gas concentration adjusted for bias. C M = Average of initial and final system calibration bias (or 2-point system calibration error) check responses for the upscale calibration gas. C MA = Actual concentration of the upscale calibration gas, ppmv. C O = Average of the initial and final system calibration bias (or 2-point system calibration error) check responses from the low-level (or zero) calibration gas. C S = Measured concentration of a calibration gas (low, mid, or high) when introduced in system calibration mode. C SS = Concentration of NOx measured in the spiked sample. C Spike = Concentration of NOx in the undiluted spike gas. C Calc = Calculated concentration of NOx in the spike gas diluted in the sample. C V = Manufacturer certified concentration of a calibration gas (low, mid, or high). C W = Pollutant concentration measured under moist sample conditions, wet basis. CS = Calibration span. D = Drift assessment, percent of calibration span. E p = The predicted response for the low-level and mid-level gases based on a linear response line between the zero and high-level response. Eff NO2 = NO 2 to NO converter efficiency, percent. H = High calibration gas, designator. L = Low calibration gas, designator. M = Mid calibration gas, designator. NOFinal = The average NO concentration observed with the analyzer in the NO mode during the converter efficiency test in Section NOxCorr = The NOx concentration corrected for the converter efficiency. NOxFinal = The final NOx concentration observed during the converter efficiency test in Section NOxPeak = The highest NOx concentration observed during the converter efficiency test in Section Q Spike = Flow rate of spike gas introduced in system calibration mode, L/min. Q Total = Total sample flow rate during the spike test, L/min. R = Spike recovery, percent. SB = System bias, percent of calibration span. SB i = Pre-run system bias, percent of calibration span. SB f = Post-run system bias, percent of calibration span. SB / D Alt = Alternative absolute difference criteria to pass bias and/or drift checks. SCE = System calibration error, percent of calibration span. SCE i = Pre-run system calibration error, percent of calibration span. SCE final = Post-run system calibration error, percent of calibration span. Z = Zero calibration gas, designator. 40CFR60.355(b)(1), ( ), Nomenclature. The terms used in the equations are defined as follows: P r = reference combustor inlet absolute pressure at kilopascals ambient pressure, mm Hg P o = observed combustor inlet absolute pressure at test, mm Hg H o = observed humidity of ambient air, g H 2 O/g air e = transcendental constant, T a = ambient temperature, K Small Engine and FTIR Nomenclature. The terms used in the equations are defined as follows: bhp = brake horsepower hp = horsepower Q sys = system flow (lpm) Q m = matrix spike flow (lpm) Comp&RATA&Eng-AHI v1.3 App. A
235 RM 19, ( ), 12.1 Nomenclature. The terms used in the equations are defined as follows: AdjFactor = percent oxygen or carbon dioxide adjustment applied to a target polltant B wa = Moisture fraction of ambient air, percent. Btu = British thermal unit % C = Concentration of carbon from an ultimate analysis of fuel, weight percent. % CO2d,% CO2w = Concentration of carbon dioxide on a dry and wet basis, respectively, percent. CIP / CDP = Combustor inlet pressure / compressor discharge pressure (mm Hg); note, some manufactures reference as PCD. E = Pollutant emission rate, ng/j (lb/million Btu). E a = Average pollutant rate for the specified performance test period, ng/j (lb/million Btu). E ao, E ai = Average pollutant rate of the control device, outlet and inlet, respectively, for the performance test period, ng/j (lb/million Btu). E bi = Pollutant rate from the steam generating unit, ng/j (lb/million Btu). E bo = Pollutant emission rate from the steam generating unit, ng/j (lb/million Btu). E ci = Pollutant rate in combined effluent, ng/j (lb/million Btu). E co = Pollutant emission rate in combined effluent, ng/j (lb/million Btu). E d = Average pollutant rate for each sampling period (e.g.,24-hr Method 6B sample or 24-hr fuel sample) or for each fuel lot (e.g., amount of fuel bunkered), ng/j (lb/million Btu). E di = Average inlet SO 2 rate for each sampling period d, ng/j (lb/million Btu). E g = Pollutant rate from gas turbine, ng/j (lb/million Btu). E ga = Daily geometric average pollutant rate, ng/j (lbs/million Btu) or ppm corrected to 7 percent O 2. E jo,e ji = Matched pair hourly arithmetic average pollutant rate, outlet and inlet, respectively, ng/j (lb/million Btu) or ppm corrected to 7 percent O 2. E h = Hourly average pollutant, ng/j (lb/million Btu). E hj = Hourly arithmetic average pollutant rate for hour "j," ng/j (lb/million Btu) or ppm corrected to 7 percent O 2. EXP = Natural logarithmic base (2.718) raised to the value enclosed by brackets. Fc = Ratio of the volume of carbon dioxide produced to the gross calorific value of the fuel from Method 19 F d, F w, F c = Volumes of combustion components per unit of heat content, scm/j (scf/million Btu). ft 3 = cubic feet G = ideal gas conversion factor ( SCF/lb-mol at 68 deg F & psia) GCM = gross Btu per SCF (constant, compound based) GCV = Gross calorific value of the fuel consistent with the ultimate analysis, kj/kg (Btu/lb). GCV p, GCV r = Gross calorific value for the product and raw fuel lots, respectively, dry basis, kj/kg (Btu/lb). % H = Concentration of hydrogen from an ultimate analysis of fuel, weight percent. H b = Heat input rate to the steam generating unit from fuels fired in the steam generating unit, J/hr (million Btu/hr). H g = Heat input rate to gas turbine from all fuels fired in the gas turbine, J/hr (million Btu/hr). % H2O = Concentration of water from an ultimate analysis of fuel, weight percent. H r = Total numbers of hours in the performance test period (e.g., 720 hours for 30-day performance test period). K = volume of combustion component per pound of component (constant) K = Conversion factor, 10 5 (kj/j)/(%) [10 6 Btu/million Btu]. K c = (9.57 scm/kg)/% [(1.53 scf/lb)/%]. K cc = (2.0 scm/kg)/% [(0.321 scf/lb)/%]. K hd = (22.7 scm/kg)/% [(3.64 scf/lb)/%]. K hw = (34.74 scm/kg)/% [(5.57 scf/lb)/%]. K n = (0.86 scm/kg)/% [(0.14 scf/lb)/%]. K o = (2.85 scm/kg)/% [(0.46 scf/lb)/%]. K s = (3.54 scm/kg)/% [(0.57 scf/lb)/%]. K sulfur = 2x10 4 Btu/wt%-MMBtu K w = (1.30 scm/kg)/% [(0.21 scf/lb)/%]. lb = pound ln = Natural log of indicated value. L p,l r = Weight of the product and raw fuel lots, respectively, metric ton (ton). % N = Concentration of nitrogen from an ultimate analysis of fuel, weight percent. M % = mole percent mol = mole MW = molecular weight (lb/lb-mol) MW AIR = molecular weight of air ( lb/lb-mole) 1 NCM = net Btu per SCF (constant based on compound) % O = Concentration of oxygen from an ultimate analysis of fuel, weight percent. % O2d, % O2w = Concentration of oxygen on a dry and wet basis, respectively, percent. P B = barometirc pressure, in Hg P s = Potential SO2 emissions, percent. % S = Sulfur content of as-fired fuel lot, dry basis, weight percent. S e = Standard deviation of the hourly average pollutant rates for each performance test period, ng/j (lb/million Btu). % Sf = Concentration of sulfur from an ultimate analysis of fuel, weight percent. S(wt%) = weight percent of sulfur, per lab analysis by appropriate ASTM standard S i = Standard deviation of the hourly average inlet pollutant rates for each performance test period, ng/j (lb/million Btu). S o = Standard deviation of the hourly average emission rates for each performance test period, ng/j (lb/million Btu). %S p, %S r = Sulfur content of the product and raw fuel lots respectively, dry basis, weight percent. SCF = standard cubic feet SH = specific humidity, pounds of water per pound of air t 0.95 = Values shown in Table 19-3 for the indicated number of data points n. T amb = ambient temperature, o F W/D Factor = = conv. at psia and 68 deg F (ref. Civil Eng. Ref. Manual, 7th Ed.) X CO2 =CO 2 Correction factor, percent. X k = Fraction of total heat input from each type of fuel k. Comp&RATA&Eng-AHI v1.3 App. A
236 ALARMS EXIST!!! - Check Alarm Sheet TRUE English Units 2 Cells Unprotected Plant Name Sampling Location Fuel or Source Type Fuel F-Factor Source Information Gas, Natural Test Information Starting Test Date Project # Operator Standard Temperature 68 of Standard Pressure in Hg Minimum Required Sample Vol. indust. spec. 100 scf Run Duration chk Subpart 180 minutes Unit Number Load % or w/db Base Run Number Number of Ports Available Number of Ports Used Port Inside Diameter in Circular Stack TRUE Test Equipment Information Run Meter Box Number Meter Calibration Factor Orifice Meter Coefficient from ACS (Y) ( ) Pitot Identification Pitot Tube Coefficient Orsat Identification Nozzle Number Nozzle Diameter Probe Number Probe Length (SS, Glass. ) Liner Material Sample Case / Oven Number Impinger Case Number Acetone Lot Number in H 2 O from ACS (C p ) from ACS from ACS (D n ) in from ACS from list inconel inconel inconel from ACS from ACS from bottle in Company Name Address City, State Country Zip Project Manager Phone Number Fax Number Testing Company Information Air Hygiene International, Inc. (Tulsa, Oklahoma) 5634 S. 122nd East Ave., Suite F Tulsa, Oklahoma (918) (918) Isocalc-AHI v4.3
237 METHOD 1 - SAMPLE AND VELOCITY TRAVERSES FOR CIRCULAR SOURCES Plant Name Sampling Location Operator Stack Type Circular Stack Size Date Project # # of Ports Available # of Ports Used Port Inside Diameter Circular Stack or Duct Diameter Distance to Far Wall of Stack (L fw ) in Distance to Near Wall of Stack (L nw ) in Diameter of Stack (D) in Area of Stack (A s ) ft2 L fw L nw Distance from Port to Disturbances Distance Downstream (B) in Diameters Downstream (B D ) diameters Distance Upstream (A) in Diameters Upstream (A D ) diameters D Number of Traverse Points Required A Diameters to Minimum Number of 1 Flow Disturbance Traverse Points B Down Up Particulate Velocity Stream Stream Points Points >= 8.00 >= or or 12 2 Upstream Spec Number of Traverse Points Used Downstream Spec Ports by Across Traverse Pts Required Pts Used Required 1 Check Minimum Number of Points for the Upstream and Downstream conditions, then use the largest. TRUE Particulate Traverse 2 8 for Circular Stacks 12 to 24 inches Traverse Point Locations 12 for Circular Stacks over 24 inches Fraction Distance Distance Location of Traverse Points in Circular Stacks Traverse Point (Fraction of Stack Dimension from Inside Wall to Traverse Point) Number of Traverse Points Across the Stack Number Traverse of from Including Point Stack Inside Reference Number Diameter Wall Length in in Isocalc-AHI v4.3
238 FALSE PreTest METHOD 2 - DETERMINATION OF STACK GAS VELOCITY AND VOLUMETRIC FLOW RATE Plant Name Sampling Location Operator Stack Type Circular Pitot Leak Check FALSE PostTest Date Project # # of Ports Used Pitot Identification Pitot Coefficient (C p ) 0.84 Stack Dimensions Velocity Traverse Data Diameter or Length of Stack (D) in Run Number V1 Width of Stack (W) in Run Time Start End Area of Stack (A s ) ft2 Traverse Velocity Null Stack Local Point Head Angle Temp Velocity Pressures ( p) (N a ) (t s ) (v s(l) ) Barometric Pressure (P b ) in Hg in H2O deg of ft/sec Static Pressure (P static ) in H2O Absolute Stack Pressure (P s ) in Hg Alarms Exist - Enter Static Pressure (see below)!!! Stack Gas Composition Composition Data: FALSE Estimated Composition Carbon Dioxide Concentration (%CO 2 ) % Oxygen Concentration (%O 2 ) % Carbon Monoxide Concentration (%CO) % Nitrogen Concentration (%N 2 ) % Stack Moisture Content (B ws ) % Stack Dry Molecular Weight (M d ) lb/lb-mole Stack Wet Molecular Weight (M s ) lb/lb-mole Results Avg Stack Gas Velocity Avg Stack Dry Std Flow Rate Avg Stack Dry Std Flow Rate Avg Stack Wet Flow Rate Avg Stack Wet Std Flow Rate Stack Cross Section Schematic (v s ) ft/sec (Q sd ) dscf/hr (Q sd ) dscf/min (Q aw ) acf/min (Q sw ) ascf/hr Average = Square roots of p Alarms Exist - Measure Static Pressure, turn side-to side, unplug to get positive reading!!! Isocalc-AHI v4.3
239 FALSE PreTest FALSE FALSE FALSE METHOD 3a - DETERMINATION OF DRY MOLECULAR WEIGHT BY ANALYZER Plant Name Sampling Location Operator Fuel Type N/A Orsat Leak Check FALSE Minimum Fuel Factor PostTest Date Project # # of Ports Used Maximum Fuel Factor Orsat Identification Sample Analysis Time Run Number Carbon Dioxide Conc. Oxygen Conc. 1 Carbon Monoxide Conc. Gas Analysis Data Run Start Time Carbon Dioxide Conc. Oxygen Conc. Carbon Monoxide Conc. Nitrogen Conc. Run Stop Time Dry Molecular Weight Molecular Weight Deviation (%CO2) (%O2) (ppmco) (%CO 2 ) (%O 2 ) (%CO) (%N 2 ) (M d ) ( M d ) hh:mm percent percent ppm percent percent percent percent lb/lb-mole lb/lb-mole Results Average Calculated Fuel Factor Average Excess Air Averages (F o ) avg Molecular Wt Deviation < 0.3? FALSE (%EA) avg percent Fuel Factor in Handbook Range? Sample Analysis Time Run Number Carbon Dioxide Conc. Oxygen Conc. 2 Carbon Monoxide Conc. Gas Analysis Data Run Start Time Carbon Dioxide Conc. Oxygen Conc. Carbon Monoxide Conc. Nitrogen Conc. Run Stop Time Dry Molecular Weight Molecular Weight Deviation (%CO2) (%O2) (ppmco) (%CO 2 ) (%O 2 ) (%CO) (%N 2 ) (M d ) ( M d ) hh:mm percent percent ppm percent percent percent percent lb/lb-mole lb/lb-mole Results Average Calculated Fuel Factor Average Excess Air Averages (F o ) avg Molecular Wt Deviation < 0.3? FALSE (%EA) avg percent Fuel Factor in Handbook Range? Sample Analysis Time Gas Analysis Data Run Number 3 Run Start Time Run Stop Time Carbon Dioxide Conc. Oxygen Conc. Carbon Monoxide Conc. Carbon Dioxide Conc. Oxygen Conc. Carbon Monoxide Conc. Nitrogen Conc. Dry Molecular Weight Molecular Weight Deviation (%CO2) (%O2) (ppmco) (%CO 2 ) (%O 2 ) (%CO) (%N 2 ) (M d ) ( M d ) hh:mm percent percent ppm percent percent percent percent lb/lb-mole lb/lb-mole Results Average Calculated Fuel Factor Average Excess Air Averages (F o ) avg Molecular Wt Deviation < 0.3? FALSE (%EA) avg percent Fuel Factor in Handbook Range? Fuel Type Coal, Anthracite Coal, Lignite Coal, Bituminous Oil, Distillate Oil, Residual Gas, Natural Gas, Propane Gas, Butane Wood Wood Bark Isocalc-AHI v4.3 Fuel Factor Fo Minimum Maximum
240 FALSE PreTest METHOD 4 - DETERMINATION OF MOISTURE CONTENT IN STACK GASES Plant Name Sampling Location Operator Stack Type Circular Train Leak Check FALSE PostTest Date Project # # of Ports Used Meter Box Number Meter Cal Factor (Y) Moisture Content Data Run Number 1 Run Start Time Run Stop Time Total Meter Volume (V m ) dcf Barometric Press. (P b ) in Hg Avg Meter Temp (t m ) avg of Stack Static Press. (P static ) in H2O Avg Stack Temp (t s ) avg of Avg Orifice Press. ( H) avg in H2O Impinger 1 Impinger 2 Impinger 3 Impinger 4 Impinger 5 Impinger 6 Impinger 7 Impinger 8 g g g g g g g g Contents DI DI DI Sil Gel Final Value (V f ),(W f ) Initial Value (V i ),(W i ) Net Value (V n ),(W n ) Results Total Weight (W t ) g Water Vol Weighed (V wsg(std) ) scf Std Meter Volume (V m(std) ) dscf Sat. Moisture Content (B ws(svp) ) % Calc Moisture Content (B ws(calc) ) % Final Moisture Content (B ws ) % Moisture Content Data Run Number 2 Run Start Time Run Stop Time Total Meter Volume (V m ) dcf Barometric Press. (P b ) in Hg Avg Meter Temp (t m ) avg of Stack Static Press. (P static ) in H2O Avg Stack Temp (t s ) avg of Avg Orifice Press. ( H) avg in H2O Impinger 1 Impinger 2 Impinger 3 Impinger 4 Impinger 5 Impinger 6 Impinger 7 Impinger 8 g g g g g g g g Contents DI DI DI Sil Gel Final Value (V f ),(W f ) Initial Value (V i ),(W i ) Net Value (V n ),(W n ) Results Total Weight (W t ) g Water Vol Weighed (V wsg(std) ) scf Std Meter Volume (V m(std) ) dscf Sat. Moisture Content (B ws(svp) ) % Calc Moisture Content (B ws ) % Final Moisture Content (B ws ) % Moisture Content Data Run Number 3 Run Start Time Run Stop Time Total Meter Volume (V m ) dcf Barometric Press. (P b ) in Hg Avg Meter Temp (t m ) avg of Stack Static Press. (P static ) in H2O Avg Stack Temp (t s ) avg of Avg Orifice Press. ( H) avg in H2O Impinger 1 Impinger 2 Impinger 3 Impinger 4 Impinger 5 Impinger 6 Impinger 7 Impinger 8 g g g g g g g g Contents DI DI DI Sil Gel Final Value (V f ),(W f ) Initial Value (V i ),(W i ) Net Value (V n ),(W n ) Results Total Weight (W t ) g Water Vol Weighed (V wsg(std) ) scf Std Meter Volume (V m(std) ) dscf Sat. Moisture Content (B ws(svp) ) % Calc Moisture Content (B ws ) % Final Moisture Content (B ws ) % Isocalc-AHI v4.3
241 Plant Name Sampling Location Operator # of Points Across Ideal Nozzle Diameter and IsoKinetic Factor Setup Pitot Tube Coefficient (C p ) 0.84 Avg Stack Temp (t s ) of Avg Gas Meter Temp 0.75 SCFM (t m ) ( H@) in H2O Avg Pitot Tube Diff. Pressure ( p avg ) in H2O Stack Moisture Content Stack Dry Molecular Weight Estimated Orifice Flow Rate DP to DH Isokinetic Factor Leak Checks Sampling Equipment Train Pre in Hg Meter # (B ws ) % OK? Post in Hg Meterbox Cal. Factor (Y) (M d ) lb/lb-mole Pitot Pre in. H 2 O for sec Nozzle # (Q m ) acfm OK? Post in. H 2 O for sec Average Nozzle Diameter (D na ) in (K) Orsat OK? Rec. Nozzle Diameter (D ni ) in Probe # / Length in Pressures Nozzle Measurements Liner Material inconel Barometric Pressure (P b ) in Hg Pre PASS Sample Case / Oven # Stack Static Pressure (P static ) in H2O Post PASS Impinger Case # Absolute Stack Pressure (P s ) in Hg Absolute Meter Pressure (P m ) in Hg Run Time Weights Imp 1 Imp 2 Imp 3 Imp 4 Imp 5 Imp 6 Imp 7 Imp 8 Start End Pre Wash H 2 O 50.0 ml Filter # Post Volume MeCl ml Alarms Exist - Enter Run Times!!! Date Project # Run # 1 # of Ports Used ISOKINETIC SAMPLING DATA Dry Gas Desired Actual Impinger Meter Meter Square Local Cumulative Cumulative Est-Run Traverse Sampling Timer Meter Velocity Orifice Orifice Stack Probe Filter Exit Aux Inlet Outlet Pump Root Stack Meter Percent Meter Point # Time Time Reading Head H H Temp Temp Temp Temp Temp Temp Temp Vacuum P Velocity Volume IsoKinetic Volume (Θ) (V m ) ( p) ( H d ) ( H a ) (t s ) (t mi ) (t mo ) ( p 1/2 ) (v s ) l (V m ) std (I) (V m ) std min hh:mm:ss ft3 in H2O in H2O in H2O of of of of of of of in Hg (in H2O)1/2 ft/sec scf % scf 0.0 0:00:00 #VALUE! Final Val 0.0 0:00:00 Max Vac Average Values Final Values Isocalc-AHI v4.3
242 - SAMPLE RECOVERY AND INTEGRITY DATA SHEET Plant Name Sampling Location Operator Date Project # Acetone Lot Number Run History Data Run Number Run Start Time Run Stop Time Train Prepared By Train Recovered By Recovery Date Relinquished By Received By Relinquished Date Relinquished Time (hh:mm) (hh:mm) (mm/dd/yy) (mm/dd/yy) (hh:mm) Equipment Identification Numbers Filter Acetone Wash Silica Gel Impinger Case Sample Box Oven Alarms Exist - Enter Filter Numbers!!! Sample Blank Taken NO Alarms Exist - Collect Sample Blanks of at least 75ml each!!! Final Volume Initial Volume Net Volume Moisture Content Data Impingers 1, 2, and 3 - Liquid Volume (V f ) ml (V i ) ml (V n ) ml Comments Final Weight Initial Weight Net Weight Impinger 4 - Silica Gel Weight (W f ) g (W i ) g (W n ) g Comments Total Volume Total Water Collected (V lc ) ml Isocalc-AHI v4.3
243 FALSE METHOD 5 (FRONTHALF) AND 202 (BACKHALF) - SAMPLE ANALYTICAL DATA SHEET Plant Name Sampling Location Operator Analytical Data Placed in Desiccator Number Date Time Filter Probe Wash Beaker # Water Beaker # MeCl (org) Beaker # Date Project # Acetone Lot Number Run 1 Start Time Leakage Evident? Estimated Volume 0.00 Filter and Beaker Weight Measurement 1 Measurement 2 Measurement 3 Measurement 4 Measurement 1 Measurement 2 Measurement 3 Measurement 4 Measurement 1 Measurement 2 Measurement 3 Measurement 4 Measurement 1 Measurement 2 Measurement 3 Measurement 4 (m 1f ) (m 2f ) (m 3f ) (m 4f ) Probe Wash and Beaker Weight (m 1a ) (m 2a ) (m 3a ) (m 4a ) Imp Content and Beaker Weight (m 1ino ) (m 2ino ) (m 3ino ) (m 4ino ) Organics and Beaker Weight (m 1org ) (m 2org ) (m 3org ) (m 4org ) Weight Data Filter Date Time Humidity Temp Cal Audit g mm/dd/yy hh:mm %RH of g Acetone Date Time Humidity Temp Cal Audit g mm/dd/yy hh:mm %RH of g Imp Water Date Time Humidity Temp Cal Audit g mm/dd/yy hh:mm %RH of g MeCl Org Date Time Humidity Temp Cal Audit g mm/dd/yy hh:mm %RH of g Isocalc-AHI v4.3
244 METHOD 5 (FRONTHALF) AND 202 (BACKHALF) - SAMPLE ANALYTICAL DATA SHEET Plant Name Sampling Location Operator Date Project # Acetone Lot Number Tare Filter Tare Tare (Pre-Particulate) Weights Filter Beaker Acetone Beaker Organics Beaker PM 10 Beaker Imp Content Beaker g Run 1 g Sample Volume and Blank Concentrations Probe Wash Volume (v a ) ml Impinger Content Volume (v ino ) ml Organics Wash Volume (v org ) ml Net Wash Volume (v n ) ml Acetone Blank Weight of Solids (w ab ) g Imp Cont Blank Weight of Solids (w inob ) g MeCl Blank Weight of Solids (w orgb ) g Acetone Blank Volume (v ab ) ml Imp Content Blank Volume (v inob ) ml MeCl Blank Volume (v orgb ) ml Acetone Blank Concentration (C a ) mg/ml Imp Content Blank Concentration (C ino ) mg/ml MeCl Blank Concentration (C org ) mg/ml Results Final Weight Tare Weight Weight Gain Blank Adjustment Total Particulates Filter f PM10 a1' Probe a' Imp Cont ino' Organics org' (m fx ) g (m tx ) g (m x ) mg (W x ) mg (M n ) mg Isocalc-AHI v4.3
245 METHOD 5 (FRONTHALF) AND 202 (BACKHALF) - RESULTS Plant Name Sampling Location Operator Date Project # Stack Type Circular Run Number Run Start Time Run Stop Time Meter Calibration Factor Pitot Tube Coefficient Average Nozzle Diameter Initial Meter Volume Final Meter Volume Total Meter Volume Total Sampling Time Average Meter Temperature Average Stack Temperature Barometric Pressure Stack Static Pressure Absolute Stack Pressure Average Orifice Pressure Drop Absolute Meter Pressure Avg Square Root Pitot Pressure Impingers 1-3 Water Volume Gain Impinger 4 Silica Gel Weight Gain Total Water Volume Collected Standard Water Vapor Volume Standard Meter Volume Calculated Stack Moisture Saturated Stack Moisture Reported Stack Moisture Content Carbon Dioxide Percentage Oxygen Percentage Carbon Monoxide Percentage Nitrogen Percentage Dry Gas Molecular Weight Wet Stack Gas Molecular Weight Calculated Fuel Factor Fuel F-Factor Percent Excess Air Average Stack Gas Velocity Stack Cross-Sectional Area Actual Stack Flow Rate Wet Standard Stack Flow Rate Dry Standard Stack Flow Rate Percent of Isokinetic Rate Mass of Particulate on Filter Mass of Particulate in Acetone Mass of Particulate in Imp Content Mass of Particulate in Org Rinse Total Mass of Particulates Stack Particulate Concentration Particulate Emission Rate (Pt 75 App F Sect ) Heat Input Historical Data Average hh:mm hh:mm (Y) (C p ) (D na ) #DIV/0! #DIV/0! in Stack Test Data (V m ) i ft3 (V m ) f ft3 (V m ) ft3 (Θ) min (t m ) avg of (t s ) avg of (P b ) in Hg (P static ) in H2O (P s ) in Hg ( H) avg in H2O (P m ) in Hg ( p 1/2 ) avg (in H2O)1/2 Moisture Content Data (V n ) ml (W n ) g (V lc ) ml (V w ) std scf (V m ) std dscf (B ws(calc) ) % (B ws(svp) ) % (B ws ) % Gas Analysis Data (%CO 2 ) % (%O 2 ) % (%CO) % (%N 2 ) % (M d ) lb/lb-mole (M s ) lb/lb-mole (F o ) (F d ) dscf/mmbtu (%EA) % Volumetric Flow Rate Data (v s ) ft/sec (A s ) ft2 (Q aw ) acfm (Q sw ) wkscfh (Q sd ) dscfm (I) % Emission Rate Data (M f ) mg (M a ') mg (M ino ') mg (M org ') mg (M n ) mg (c s ) g/dscf (c ' s ) gr/dscf (E) kg/hr (E ' ) lbs/hr (E '' ) tons/yr (E ''' ) lbs/mmbtu (HI) MMBtu/hr Isocalc-AHI v4.3
246 SAMPLE DESCRIPTION AND CHAIN OF CUSTODY RECORD Project Number: Laboratory Analysis Requested: Air Hygiene International, Inc S. 122nd East Ave, Suite F Tulsa, Oklahoma (888) Person Taking Samples: Sample Number Location Date Volume Analysis Method Relinquished by: (Signature) Date: Time: Received by: (Signature) Date: Time: Relinquished by: (Signature) Date: Time: Received by: (Signature) Date: Time: Isocalc-AHI v4.3
![EXAMPLE CALCULATIONS (Reference Method 1 - Circular Stack) L fw = distance to far wall of stack (in.) L nw = distance to near wall of stack (in.) [reference] D = diameter of stack (in.](/docs-images/83/88907740/images/247-2.jpg ") A s = area of stack (ft 2 ) B = distance downstream (in.) B D = stack diameters downstream (dia.) A = distance upstream (in.) A D = stack diameters upstream (dia.")
247 EXAMPLE CALCULATIONS (Reference Method 1 - Circular Stack) L fw = distance to far wall of stack (in.) L nw = distance to near wall of stack (in.) [reference] D = diameter of stack (in.) A s = area of stack (ft 2 ) B = distance downstream (in.) B D = stack diameters downstream (dia.) A = distance upstream (in.) A D = stack diameters upstream (dia.) Area of Stack (ft 2 ) 2 D A s ( ft ) = π A s (ft 2 ) = 3.14 x in. 2 x 12in./ft = ft 2 2 Diameter of Stack (in.) D( in.) = L fw L nw D (in.) = 0 in. - 0 in. = in. Stack Diameters Downstream B B D ( dia.) = D 0 in. B D (dia.) = = diameters in. Stack Diameters Upstream A A D ( dia.) = D 0 in. A D (dia.) = = diameters in. Number of Traverse Points Based on 40 CFR Part 60, Appendix A, Method 1, Section 2.2 Traverse Point Locations Based on 40 CFR Part 60, Appendix A, Method 1, Section 2.3 Note: Lack of significant figures may cause rounding errors between actual calculations and example calculations. Isocalc-AHI v4.3
248 EXAMPLE CALCULATIONS (Reference Method 2) P b = barometric pressure (in. Hg) C p = pitot tube coefficient P static = static pressure (in. H 2 0) p = velocity head (in. H 2 O) P s = absolute stack pressure (in. Hg) A s = area of stack (ft 2 ) %N 2 = nitrogen concentration (%) N a = null angle (deg.) %CO 2 = carbon dioxide concentration (%) t s = stack temperature ( o F) %O 2 = oxygen concentration (%) T u = temperature offset, 460 o R %CO = carbon monoxide concentration (%) K p = pitot tube constant, MW = molecular weight (lb/lb-mole) (ft/sec)(((lb/lb-mole)(in. Hg))/(( o R)(in. Hg))) 1/2 B ws = stack moisture content (%) M d = stack dry molecular weight (lb/lb-mole) M s = stack wet molecular weight (lb/lb-mole) T std = standard temperature, 68 o F, 528 o R P std = standard pressure, in. Hg v sl = local velocity (ft/sec) v s = average stack gas velocity (ft/sec) Q sd = average stack dry standard flow rate (dscf/hr) Q aw = average stack wet flow rate (ascf/min) Absolute Stack Pressure (in. Hg) Pstatic P S ( in. Hg ) = Pb in. H 2 O P s (in. Hg) = 0 in. Hg + = 13.6 in. H 2 O/in. Hg in. Hg Nitrogen Concentration (%) % N 2 = 100 % CO 2 % O 2 % CO %N 2 (%) = % - 0 % - 0 % = % Stack Dry Molecular Weight (lb/lb-mole) MW comp M ( lb / lb mol ) = 100 d % component M d (lb/lb-mol) = 44 lb/lb-mol 100 x 0 % + 32 lb/lb-mol 100 x 0 % + etc. = lb lb-mol Stack Wet Molecular Weight (lb/lb-mole) M B = WS BWS lb / lb mol ) M d 1 + MW H O S ( 2 M S (lb/lb-mol) = lb 0 % 18 lb 0 % lb x x = lb-mol 100 lb-mol 100 lb-mol Local Velocity (ft/sec) v s( l ) ( ft / sec) = K p C p p ts + Tu P M s s v sl (ft/sec) = ft sec (lb/lb-mol)(in. Hg) ( o R)(in. H 2 O) 1/2 x 0.84 x 0.00 in.h 2 O x 0 in. Hg x o R lb/lb-mol = sec ft Note: Lack of significant figures may cause rounding errors between actual calculations and example calculations. Isocalc-AHI v4.3
249 EXAMPLE CALCULATIONS (Reference Method 2) P b = barometric pressure (in. Hg) C p = pitot tube coefficient P static = static pressure (in. H 2 0) p = velocity head (in. H 2 O) P s = absolute stack pressure (in. Hg) A s = area of stack (ft 2 ) %N 2 = nitrogen concentration (%) N A = null angle (deg.) %CO 2 = carbon dioxide concentration (%) t s = stack temperature ( o F) %O 2 = oxygen concentration (%) T u = temperature offset, 460 o R %CO = carbon monoxide concentration (%) MW = molecular weight (lb/lb-mole) B ws = stack moisture content (%) M d = stack dry molecular weight (lb/lb-mole) M s = stack wet molecular weight (lb/lb-mole) K p = pitot tube constant, (ft/sec)(((lb/lb-mole)(in. Hg))/(( o R)(in. Hg))) 1/2 T STD = standard temperature, 68 o F P STD = standard pressure, in. Hg v sl = local velocity (ft/sec) v s = average stack gas velocity (ft/sec) Q SD = average stack dry standard flow rate (dscf/hr) Q AW = average stack wet flow rate (ascf/min) Average Stack Gas Velocity (ft/sec) v ( ft / sec) = K s p C ( p ) avg ft (lb/lb-mol)(in. Hg) v sl (ft/sec) = sec ( o R)(in. H 2 O) p ( t ) s s 1/2 avg + T P M x 0.84 x s u 1/2 in.h 2 O x in. Hg x o R lb/lb-mol = sec ft Average Stack Dry Standard Flow Rate (dscfh) Bws vs As T Qsd dscfh 100 ( ) = ( t + T ) P s u 3600 sec 0.0 % ft Q sd (dscf/hr) = x 1 - x x ft 2 x hr 100 sec o R o R x in. Hg dscf = in. Hg hr std std P s Average Stack Wet Flow Rate (acfm) Q ( acfm ) = 60 v A aw 60 sec Q aw (acf/min) = x min sec s s ft x ft 2 = min ascf Average Stack Wet Standard Flow Rate (dscfh) Q sw 60 Qaw Tstd Ps ( ascfh) = ( t + T ) P s u std Q sw (ascf/hr) = 60 min acf x hr min o R x o R x in. Hg = in. Hg hr ascf Note: Lack of significant figures may cause rounding errors between actual calculations and example calculations. Isocalc-AHI v4.3
250 EXAMPLE CALCULATIONS (Reference Method 3a) %N 2 = nitrogen concentration (%) %CO 2 = carbon dioxide concentration (%) %O 2 = oxygen concentration (%) ppmco = carbon monoxide concentration (ppm) %CO = carbon monoxide concentration (%) M d = stack dry molecular weight (lb/lb-mole) (F o ) avg = average calculated fuel factor (%EA) avg = average excess air (%) Carbon Monoxide Concentration (%) % CO = ppmco 10,000 %CO (%) = 0.00 ppm 10,000 ppm/% = % Nitrogen Concentration (%) N = 100 % CO % O % CO % %N 2 (%) = % - % - % = % Stack Dry Molecular Weight (lb/lb-mole) MW comp M ( lb / lb mol ) = 100 d % component M d (lb/lb-mol) = 44 lb/lb-mol 100 x % + 32 lb/lb-mol lb x % + etc. = 100 lb-mol Average Calculated Fuel Factor F o( avg ) = [ 20.9 (% O2 ) ( ( ) avg )] avg 0.5 % CO (% CO 2 ) + (% CO ) avg 20.9% - % x % F o(avg) = = % + % avg Average Excess Air (%) 100 % EAavg (%) = N [(% O2 ) ( ( ) avg )] avg 0.5 % CO ( ) % O 0.5 % ( ) [( ) ( ( CO ) )] 2 avg 2 avg avg (%EA) AVG = 100 x % x x % - % % x % = % Note: Lack of significant figures may cause rounding errors between actual calculations and example calculations. Isocalc-AHI v4.3
251 EXAMPLE CALCULATIONS (Reference Method 4) V mf = final dry gas meter reading (dcf) W t = total impinger weight (g) = Σ(W f -W i ) V mi = initial dry gas meter reading (dcf) K 5 = water mass to std water vapor, ft 3 /g V m = total meter volume (dcf) K 1 = standard volume correction, o R/in. Hg t m(avg) = average meter temp. ( o F) Y = meter calibration factor t s(avg) = average stack temp. ( o F) T u = absolute temperature offset, 460 o R P b = barometric pressure (in. Hg) B ws = final moisture content (%) = min of B ws(calc) and B ws(svp) P static = static pressure (in. H 2 O) H avg = average orifice pressure (in. H 2 O) V i = initial impinger volume (ml) Water Volume Weighed (dscf) V f = final impinger volume (ml) W i = initial impinger weight (g) W f = final impinger weight (g) V t = total impinger volume (ml) = Σ(V f -V i ) V wsg ( std ) dscf ) = Wt ( K 5 V g x ft 3 wsg(std) = /g = dscf Standard Meter Volume (dscf) V m( std ) K1 Y V ( dscf ) = m H avg Pb ( tm ) + Tu avg V m(std) = in. Hg o R x x dcf x o F o R in. Hg + in. H 2 O 13.6 in. H 2 O / in. Hg = dscf Calculated Moisture Content (%) Vwsg ( std ) Bws ( calc ) (%) = 100 V + V wsg ( std ) m( std ) B ws(calc) = 100 x dscf + dscf dscf = % Saturated Moisture Content (%) B ws ( svp ) 10 (%) = 100 P ts ( avg ) b Pstatic o F B ws(svp) = 100 x in. H 2 O in. Hg in. H 2 O / in. Hg 100 = % Note: Lack of significant figures may cause rounding errors between actual calculations and example calculations. Isocalc-AHI v4.3
252 EXAMPLE CALCULATIONS (Isokinetic Sampling) C n = nozzle diameter constant, p avg = average pitot tube differential pressure (in. H 2 O) Q m = estimated orifice flow rate, acfm H@ = 0.75 SCFM (in. H 2 O) else Vm/Θ from previous run D na = actual nozzle diameter (in.) V m = total meter volume (acf) p = velocity head (in. H 2 O) Θ = total sampling time (min) t m = average gas meter temperature ( o F) Desired Orifice (in. H 2 O) T u = absolute temperature offset, 460 o R H d ( in. H 2O) = K p C p = pitot tube coefficient H d (in. H 2 O) = x 0 in. H 2 O = in. H 2 O B wm = meter moisture content (%) B ws = stack moisture content (%) Absolute Meter Pressure (in. Hg) t s = average stack temperature ( o F) Pm ( in. Hg ) = Pb + M d = stack dry molecular weight (lb/lb-mole) 13.6 P s = absolute stack pressure (in. Hg) in. H 2 O P m (in. Hg) = 0.00 in. Hg + C k = K Factor Constant, in. H 2 O/in. Hg = in. Hg Recommended Nozzle Diameter (in.) D ni ( in.) = C n Q ( t + T ) m u m P C m p Bwm Bws ( t + T ) s u M d B ws P p s avg ( 18 B ) ws D ni (in.) = (lb-mole o R in. H 2 O) 1/2 min in. 2 acf in. Hg 3/4 lb 1/2 x 0 o F o R x acf x in. Hg x % % x 0 o F o R x lb 0.0 % 18 lb x x lb-mole 100 lb-mol in. Hg x 0.00 in. H 2 O 0.0 % = in. DP to DH Isokinetic Factor 2 Bwm Bwm M Bws d tm + Tu Ps K C k C p H D na 100 B B ws B ws wm ts T u Pm M + d % o F o R K = x x x in. H 2 O in. 4 x 0.84 x in. H 2 O x 0.0 % 0 o F o R lb 0.0 % 18 lb 0.0 % x x lb/mole 100 lb-mol 100 in. Hg x lb 0.0 % 18 lb 0.0 % in. Hg x x lb/mole 100 lb-mol 100 = Note: Lack of significant figures may cause rounding errors between actual calculations and example calculations. Isocalc-AHI v4.3
253 EXAMPLE CALCULATIONS (Reference Method 5) K 4 = isokinetic conversion constant, min in.hg/sec o R v x = blank volume (ml) m #x = weight measurements (g) m fx = final weight, avg of last two measurements (g) v a = acetone volume (ml) m tx = tare weight (g) v ino = impinger content volume (ml) v org = organics wash volume (ml) w x = blank weight of solids (g) Total Particulates (mg) M ( mg) = Σ m W n ( ) x x M n (mg) = Σ mg - mg + etc = mg Local Stack Velocity (ft/sec) v s(l) (ft/sec) = ft sec (lb/lb-mol)(in. Hg) ( o R)(in. H 2 O) 1/2 x v s( l ) ( ft / sec) = K C 0.84 x 0.00 in.h 2 O x p p p Ps M d t s + T u B ws Bws o F o R lb 0.0 % 18 lb 0.0 % in. Hg x x x lb/mole 100 lb-mol 100 = sec ft Cumulative Percent Isokinetic (%) I (%) = I (%) = Θ ( t ) + T ) Dna 1 ( ) B 1 ws v P π s( l ) avg K 4 s s avg 2 u V m ##### min x min in. Hg x #DIV/0! o scf sec o F o R x R 2 #DIV/0! ft in. ft. 0 % x in. Hg x 3.14 x x x 1 - sec 2 12 in. 100 = % Net Wash Volume (ml) v ( ml) = v + v + v n a ino org v n (ml) = ml + ml + ml = ml Blank Concentration (mg/ml) wx C x ( mg / ml) = 1000 v x Blank Adjustment (lesser of) W ( mg) = m LorLv C W x (mg) = mg or 1000 x g mg mg C x (mg/ml) = = ml x ml ml ml x x x x = mg Weight Gain (mg) m ( mg) m m x ( ) 1000 = fx tx m x (mg) = mg - mg x 1000 = mg Note: Lack of significant figures may cause rounding errors between actual calculations and example calculations. Isocalc-AHI v4.3
254 EXAMPLE CALCULATIONS (Reference Method 5) M n = total particulates (mg) V m(std) = standard meter volume (dscf) Q sd = dry standard stack flow rate (dscfm) F d = fuel f-factor (dscf/mmbtu) Stack Particulate Concentration (g/dscf) M n c s ( g / dscf ) = V %O 2 = oxygen percentage (%) g mg g c s (g/dscf) = x = Q sw = wet standard stack flow rate (ascfm) 1000 mg dscf dscf m( std ) Stack Particulate Concentration (gr/dscf) ' M n 7000 c s ( gr / dscf ) = V m( std ) g mg c' s (gr/dscf) = x 1000 mg dscf x 7000 gr lb x lb g = dscf gr Particulate Emissions Rate (kg/hr) 60 E( kg / hr) = c s Qsd 1000 kg 60 min E (kg/hr) = x 1000 g hr x dscf g x dscf min = hr kg Particulate Emissions Rate (lb/hr) ' M n Qsd 60 E ( lb / hr) = V m( std ) g 60 min lb mg dscf E' (lb/hr) = x x x x = 1000 mg hr g dscf min hr lb Particulate Emissions Rate (ton/yr) '' ' 8760 E ( ton / yr) = E 2000 ton 8760 hr lb E'' (ton/yr) = x x = 2000 lb yr hr yr ton Particulate Emissions Rate (lb/mmbtu) ''' M n Fd 20.9 E ( lb / MMBtu ) = Vm( std ) % O2 g lb mg dscf 20.9 lb E''' (lb/mmbtu) = x x x x = 1000 mg g dscf MMBtu % MMBtu Heat Input (MMBtu/hr) 100 Bws 20.9 % O2 HI ( MMBtu / hr) = Qsw Fd 20.9 wkscf 10 3 scf % % HI (MMBtu/hr) = x x x hr kscf 100 x dscf/mmbtu 20.9 = MMBtu hr Note: Lack of significant figures may cause rounding errors between actual calculations and example calculations. Isocalc-AHI v4.3
255 APPENDIX E AIR HYGIENE STATEMENT OF QUALIFICATIONS

256 STATEMENT OF QUALIFICATIONS POWERPLANT EMISSIONS TESTING 2006 \ Corporate Headquarters Houston, TX Office Las Vegas Office Philadelphia, PA Office 5634 S. 122 nd E. Ave. Ste. F 1920 Treble Drive, Suite E E. Lake Mead Blvd 8900 State Road Tulsa, OK Humble, TX Las Vegas, NV Philadelphia, PA or
 is a professional air emission testing services firm with fixed offices in Tulsa, Oklahoma; Houston, Texas; Denver, Colorado; and Orlando, Florida.")


! 3. NIST traceable gases for the most accurate calibration. Ranges as low as 5 ppm! 4.")
257 STATEMENT OF QUALIFICATIONS INTRODUCTION AIR HYGIENE AIR TESTING SERVICES FOR POWER PLANTS January, 2005 AIR HYGIENE INTERNATIONAL, INC. (AIR HYGIENE) is a professional air emission testing services firm with fixed offices in Tulsa, Oklahoma; Houston, Texas; Denver, Colorado; and Orlando, Florida. Additional mobilization points are located in Philadelphia, Atlanta, Chicago, Los Angeles, and Seattle to serve all 50 United States. AIR HYGIENE specializes in air emission testing services for combustion sources in both simple and combined cycle operation burning multiple fuels with multiple control devices and supporting equipment. AIR HYGIENE has testing laboratories which serve all fifty (50) of the United States and North America. Each mobile laboratory can be equipped with the following equipment and capabilities: 1. State-of-the-Art air emission analyzers, computers, and datalogging software. All designed into an efficient system to provide the fastest, most reliable information possible! 2. Dual racks for multiple source testing simultaneously or multiple points on a single source (in/out SCR, etc.)! 3. NIST traceable gases for the most accurate calibration. Ranges as low as 5 ppm! 4. PM 10, NH 3, mercury, sulfuric acid mist (H 2 SO 4 ), SO 3, and formaldehyde sampling equipment! 5. VOC testing with on-board gas chromatograph to remove methane and ethane! 6. On-board printers to provide hard copies of testing information on-site! 7. Networking capabilities to provide real-time emission data directly into the control room! AIR HYGIENE is known for providing professional services which include the following: Providing superior, cost saving services to our clients! High quality emission testing personnel with service oriented, friendly attitude! Meeting our client s needs whether it is 24 hour a day testing or short notice mobilization! Using great equipment that is maintained and dependable! Understanding the unique startup and operational needs associated with combustion turbines! MISSION STATEMENT Our mission is to provide innovative, practical, top-quality services allowing our clients to increase operating efficiency, save money, and comply with federal/state requirements. We believe our first responsibility is to the client. In providing our unique services, the owners of AIR HYGIENE demand ethical conduct from each employee of the company. The character and integrity of AIR HYGIENE employees allows our clients to feel confidence in the air testing services of AIR HYGIENE. Through a long-term commitment to this mission, AIR HYGIENE is known as a company committed to improving our clients operations. AIR HYGIENE Does work worth paying for every time! Is well known for our emission testing services and uncompromising efforts to serve our clients! Does work that matters! Is proud of our emission testing capabilities! Provides exciting growth opportunities for energetic individuals!
258 EMISSION TESTING TEAM Air Hygiene International, Inc. (AIR HYGIENE) intends to exceed your expectations on every project. From project management to field-testing teams, we re committed to hard work on your behalf. The job descriptions and flowchart below outline AIR HYGIENE s client management strategy for your testing services. From the initial request through receipt of the purchase order, the Inquisition To Order (ITO) team strives to inform every client of the benefits gained by using AIR HYGIENE for their emission testing project. The ITO team includes representatives from the sales, marketing, and contracts divisions. In addition, several support staff assist to ensure the ITO team provides the support for client needs as requested by a client or project manager. Project Managers are the primary contact for clients and ultimately responsible for every emission testing project. AIR HYGIENE s Project Managers experience range from masters level, professional engineers to industry experts with over 5,000 testing projects completed. Each project is assigned a Project Manager based primarily upon geographic location, then industry experience, contact history, and availability. The Project Manager prepares the testing strategy and organization for the project. This includes preparation of testing protocol; coordination with state agencies, client representatives, and any Testing Managers Staff Technicians Air Hygiene Project Manager Test Engineers Testing Assistants ITO Team Senior Technicians interested third parties. The site testing and report preparation are executed under the direction of the Project Manager from start to finish. Testing Managers have completed Air Hygiene s rigorous demonstration of capability training program and are capable of operating all testing equipment and performing all test methods required for your testing project. Testing Managers assist Project Managers by leading the field testing when required, preparing draft reports, calibrating equipment, and overseeing testing team on-site. Test Engineers have significant background and understanding of emission testing or related services. Test Engineers prepare pre-test drawings for port location, ensure on-site logistics for electrical and mechanical/structural needs, and conduct on site testing as directed by the Project Manager and/or Testing Manager. Test Engineers often have special understanding of process and/or regulations applicable to specific testing jobs, which provide great value to both the client and Project Manager in testing strategies. Testing Specialists have performed over 500 emission tests and have a basic understanding of both particulate and gaseous sampling strategies. Testing Specialists have significant testing experience with AIR HYGIENE equipment along with a variety of industries and source equipment. Testing Specialists often operate isokinetic sampling trains or gas analyzers on-site under the direction of the Project Manager and assist with preparation of field reports and quality assurance procedures. Staff Technicians are entry-level personnel who have performed 100 to 500 emission tests. Staff Technicians perform pre-test equipment preparation, on-site test preparation, and testing assistance under the direction of Project Manager and/or Testing Manager. At least one Staff Technician is assigned to every project to assist on-site. Staff Technicians connect sampling probes to ports, assist with leak checks, raise and lower equipment to and from sampling platform, and other support activities under the direction of the Project Manager and/or Testing Manager. Testing Assistants are entry-level personnel who have performed less than 100 emission tests. Testing Assistants help with equipment set-up, teardown, and simple testing procedures (i.e. move probe, fill ice bath, clean impingers, etc.) as directed.
 is a privately-held professional services firm headquartered in Tulsa, Oklahoma with additional offices in Denver, Colorado; Houston, Texas; and Orlando, Florida.")

259 Air Hygiene International, Inc. (AIR HYGIENE) is a privately-held professional services firm headquartered in Tulsa, Oklahoma with additional offices in Denver, Colorado; Houston, Texas; and Orlando, Florida. AIR HYGIENE specializes in emission testing services for a variety of industries including natural gas companies, utilities, refineries, printers, glass plants, bulk fuel loading stations, chemical plants, pulp & paper mills, various manufacturers and related industries. AIR HYGIENE provides turn-key emission testing services which include: 1. Pre-test site visit and consulting for port locations and setup; 2. Preparation of test plan for state agency; 3. Coordination with state agency regarding emission testing; 4. On-site emission testing services; and 5. Preparation of draft and final reports. AIR HYGIENE Emission Services Summary AIR HYGIENE has mobile laboratories that serve all 50 United States and around the world. AIR HYGIENE employees have performed over 15,000 emission tests on a variety of sources. AIR HYGIENE performs air emission certification compliance testing on combustion sources (natural gas, coal, fuel oil, jet fuel, etc), NSPS sources, and Title V compliance sites. Our experience ranges from emission testing for new PSD facilities, MACT and RACT required performance certification testing to Relative Accuracy Test Audits (RATA Tests) for Continuous Emission Monitoring Systems (CEMS) and Parametric Emission Monitoring Systems (PEMS). Air Hygiene has conducted numerous emission testing projects, which involved multiple groups relying upon instantaneous reporting of important test data. These projects relied upon Air Hygiene s SPIDER network. The SPIDER network provides Simultaneously Produced Information During Emission Readings (SPIDER) between the emission monitoring system and multiple locations (i.e. control room, test center, office, etc.). Hence, you can view real-time emission testing data on-demand from any location you choose! AIR HYGIENE performs FTIR testing by EPA Method 320 for Hazardous Air Pollutants (HAPS) including formaldehyde, benzene, xylene, toluene, hexane, ammonia, hydrogen chloride, etc. This methodology provides realtime analysis of these critical pollutants. AIR HYGIENE specializes in the following types of pollutants and EPA Reference Methods (RM): Nitrogen Oxides (NOx) RM 7e &/or 20 Sulfur Dioxide (SO 2 ) RM 6c Total Hydrocarbons (THC) RM 25a Volatile Organic Compounds (VOC) RM 25a & RM 18 Particulates (PM) RM 5(filterable) & 202(condensable) PM < 10 microns (PM 10 ) RM 201a PM < 2.5 microns (PM 2.5 ) RM 201b Opacity RM 9 Exhaust Flow RM 2 &/or 19 Moisture RM 4 Carbon Monoxide (CO) RM 10 Carbon Dioxide (CO 2 ) RM 3a Oxygen (O 2 ) RM 3a &/or 20 Dioxin & Furans RM 23 Metals RM 29 Chrome RM 306 Lead RM 12 Formaldehyde RM 320 (FTIR), SW , CARB 429, or CTM-037 H 2 S RM 11 BTEX RM 18 HAPS FTIR RM 320 (FTIR) Ammonia CTM-027 or BAAQMD ST-1B Mercury Ontario Hydro Method or RM 29


.")


260 TESTING EXPERIENCE AIR HYGIENE testing personnel account for more than sixty-five (65) years of testing experience and over 15,000 emission tests. Our testing services have involved dealings with all 50 state agencies and EPA regional offices. AIR HYGIENE testing personnel are rigorously trained on EPA reference test methods from 40 CFR Part 51, 60, 63, and 75. All testing personnel are instructed and tested on test responsibilities and must complete a Demonstration of Capability test per the AIR HYGIENE Quality Assurance Manual and the AIR HYGIENE Emission Testing Standard Operating Procedures Handbook. AIR HYGIENE has completed testing on over 134 power plants including 315 combustion turbines, 21 coal fired boilers, 17 gas fired boilers representing 64,876 megawatts (MW). Let us add your project to our list of satisfied customers! TESTING SUCCESS STORIES AIR HYGIENE personnel have performed thousands of testing projects which have yielded significant benefits for our clients. The following project descriptions briefly discuss some of these emission testing projects. Conducted numerous projects optimizing SCR performance by conducting inlet & outlet SCR analysis for NH 3, NOx, flow, and Oxygen. Used information to assist with flow optimization and AIG tuning. Conducted federal and state required compliance testing for NOx, CO, PM-10 (front & back-half), SO 2, VOC, Ammonia, Formaldehyde, Opacity, RATA testing (NOx and CO) for new and updated power plants with both simple and combined cycle turbines firing natural gas and fuel oil. Conducted dry low NOx burner tuning and performance testing for various models of GE, Siemens Westinghouse, Mitsubishi, Pratt & Whitney, and ABB combustion turbines to verify manufacturer s emission guarantees for clients in preparation for compliance testing. Conducted emission testing for NOx, CO, and VOC to assist tuning by performance engineers for meeting low-level NOx emissions and balancing combustion turbine performance. Performed power plant emission testing for natural gas fired combustion turbines. Tests included federal required testing per 40 CFR Part 75, state air permit requirements, RATA testing, and emission testing to verify manufacturer s guarantee s during electric/heat output performance testing. Other services for combustion turbine testing included preparation of the QA/QC manual, monitoring plan, seven-day drift test report, system linearity test, and cycle time test. TESTING LOCATIONS AIR HYGIENE bases mobilization charges on the distance from your site to the closest of nine (9) regional starting points covering all 50 United States. These include Seattle, Los Angeles, Denver, Tulsa, Houston, Chicago, Orlando, Atlanta, and Philadelphia. Each start point is located such that the AIR HYGIENE test teams can mobilize to your site at affordable costs to ensure we are price competitive to any U.S. location.


261 COMBUSTION TURBINE TESTING SERVICES SUMMARY Thank you for your consideration of the power and energy industry testing services of Air Hygiene International, Inc. (AIR HYGIENE). The following list details some of the testing services and extras AIR HYGIENE includes with each testing job. Types of Air Testing Services for Combustion Turbines: Turbine tuning/mapping for NOx & NH 3 emissions Pollutant testing to verify EPC contractual emission guarantees Research and Development (R&D) emission data research and turbine optimization 40 CFR Part 60 Subpart GG Turbine Compliance Testing 40 CFR Part 75 Acid Rain Classified Equipment Testing 40 CFR Part 75 Appendix E Peaking Plant CEMS alternative NOx emissions versus Heat Input mapping RATA Testing on CEMS systems for NOx, CO, SO 2, CO 2 or O 2, Flow (3-D & Wall effects) QA/QC Plans, Monitoring Plans, Linearity Checks, Testing Protocols, etc. are provided with our high quality, service oriented emission testing services Initial permit compliance testing for PM, PM-10, PM-2.5, SO 2, NOx, CO, exhaust flow, moisture, O 2, CO 2, Ammonia, Formaldehyde, other HAPs AIR HYGIENE will provide the following testing services: On-site, real-time test data Fuel F-Factor calculation data sheet Experienced turbine testing personnel Flexible testing schedules to meet your needs Electronic reports provided on CD upon request Extensive experience with all 50 state agencies in the U.S. EPA Protocol 1 Certified Gases (one percent accuracy) for precise calibration Low range (0-10 ppm) equipment calibration and measurement available Test protocol preparation, coordination with state agency, and site personnel Numerous mobile testing labs, which may be used for your projects across the U.S. State-of-the-art data logging technology to allow real-time examination of meaningful emission data Monitor your emissions data measured in our test lab from your control room via our datalogging network system AIR HYGIENE is committed to providing testing teams that will take the time to meet your needs. We ensure the job is completed on time with the least amount of interruption to your job and site operation as possible. Thank you for considering our services.

 has developed a unique strategy to help owners deal with these complicated requirements.")
262 AIR HYGIENE s Synergistic Approach to Power Plant Air Emissions Testing Power plants continue to be built, modified, and improved across the United States. These new or modified facilities are at the forefront of clean energy. These units are very efficient yet environmentally friendly, and must be to meet the stringent requirements set forth by the Environmental Protection Agency (EPA) and relevant state agencies. Air Hygiene International, Inc. (AIR HYGIENE) has developed a unique strategy to help owners deal with these complicated requirements. Unique Testing Strategy AIR HYGIENE has developed a synergistic approach to assisting the various groups involved in the completion of a commissioning/startup unit or modification project. AIR HYGIENE strives to combine the multiple testing aspects involved with bringing a combustion unit to commercial service. By conducting the various emission tests required for a new combustion unit using one test company, the following benefits are a given: 1. Save money by a. Reduced mobilizations b. Combined tests yield reduced fuel usage and site time c. Bulk projects receive quantity discounts 2. Improve efficiency through familiarity with site needs 3. Site personnel and testing team are comfortable working together These projects typically involve some or all of the following groups. There is not a defined set of responsibilities that will match every project. The table below simply suggests a typical list of testing responsibilities. Responsible Party Owner Operator Turbine/Boiler manufacturer EPC & Construction Company CEMS Supplier Lending Party (i.e. bank) Environmental Consultant Testing Responsibilities Initial and on-going federal and state compliance testing (i.e. NSPS Sub GG, Part 75, Operating Air Permit, etc.) Initial and on-going federal and state compliance testing (i.e. NSPS Sub GG, Part 75, Operating Air Permit, etc.) Contractual emission guarantees of unit (i.e. NOx, SO2, CO, VOC, PM-10, NH3, H2SO4) Contractual emission guarantees including control devices (i.e. NOx, SO2, CO, VOC, PM-10, NH3, H2SO4) Initial RATA testing (i.e. NOx, CO, SO2, CO2, O2, flow) No responsibility, but concerned with outcome of all tests Concerned with air permit and overall compliance; may select the test contractor and provide oversight for testing Example Project: A recent project provides a prime example of the synergistic benefits of using AIR HYGIENE to perform your commissioning/startup or remodification testing needs for performance and compliance. Eight GE Frame 7FA turbines were taken from performance testing through compliance testing in 20 days. The following tests were performed on each turbine: NOx tuning and mapping Contractual performance testing for NOx, CO, VOC, SO 2, NH 3, & PM CFR Part 60 Subpart GG: testing for NOx and CO at max load 40 CFR Part 75: NOx & CO RATA certification on CEMS State required compliance testing for NOx, CO, VOC, NH 3 (on-site analysis), formaldehyde (on-site analysis by FTIR), opacity and SO 2 burning natural gas Test data was provided on-site for all tests, except PM-10. Electronic files were ed for review to the turbine manufacturer, owner & operator, and environmental consultant within 24 hours following completion of site work. Complete reports including PM-10 were submitted to interested parties within 10 days following each blocks completion. Power Plant Testing Experience AIR HYGIENE personnel have over sixty-five (65) years of testing experience on combustion turbines, coal fired boilers, gas fired boilers, landfill gas, wood fired, & diesel fired engines across the United States. AIR HYGIENE has 10 combustion labs serving all 50 states from four permanent offices (Tulsa, OK; Houston, TX; Denver, CO; & Orlando, FL) and five mobilization points (Los Angeles, CA; Seattle, WA; Chicago, IL; Atlanta, GA; & Philadelphia, PA). AIR HYGIENE has tested plants ranging from 50 to 2,000 megawatts in both simple and combined cycle operation with controls including: Selective Catalytic Reduction - Ammonia injection Steam/Water injection Sprint injection Dry Low NOx burners (DLN) AIR HYGIENE has completed testing at 134 plants on 315 combustion turbines, 21 coal fired boilers, 17 gas fired boilers, and others representing 64,876 megawatts (MW). AIR HYGIENE tested 5 power plants in 2000 and we have grown since testing 8 in 2001, 19 in 2002, 41 in 2003, and 52 in Let us add your upcoming project to our list of satisfied customers!

, and volatile organic compounds (VOC) tests. A heated stainless steel probe is inserted into the sample ports of the stack to extract gas measurements from the emission stream.")


263 INSTRUMENT CONFIGURATION AND OPERATIONS FOR GAS ANALYSIS The sampling and analysis procedures used by AIR HYGIENE during tests conform in principle with the methods outlined in the Code of Federal Regulations, Title 40, Part 60, Appendix A, Methods 3a, 6c, 7e, 10, 18, 19, 20, and 25a. The flowchart on the next page depicts the sample system used by AIR HYGIENE for analysis of oxygen (O 2 ), carbon dioxide (CO 2 ), sulfur dioxide (SO 2 ), carbon monoxide (CO), nitrogen oxides (NOx), and volatile organic compounds (VOC) tests. A heated stainless steel probe is inserted into the sample ports of the stack to extract gas measurements from the emission stream. The gas sample is continuously pulled through the probe and transported via 3/8 inch heat-traced Teflon tubing to a stainless steel minimum-contact condenser designed to dry the sample through Teflon tubing via a stainless steel/teflon diaphragm pump and into the sample manifold within the mobile laboratory. From the manifold, the sample is partitioned to the O 2, CO 2, SO 2, CO, and NOx analyzers through glass and stainless steel rotameters that control the flow rate of the sample. The VOC sample is measured as a wet gas. The flowchart shows that the sample system is also equipped with a separate path through which a calibration gas can be delivered to the probe and back through the entire sampling system. This allows for convenient performance of system bias checks as required by the testing methods. All instruments are housed in an air-conditioned trailer which serves as a mobile laboratory. Gaseous calibration standards are provided in aluminum cylinders with the concentrations certified by the vendor. EPA Protocol No. 1 is used to determine the cylinder concentrations where applicable (i.e. NO x calibration gases). All data from the continuous monitoring instruments are recorded on a Logic Beach Hyperlogger which retrieves calibrated electronic data from each instrument every second and reports an average of the collected data every 30 seconds and 10 seconds. The averaging time can be selected to meet the clients needs. This data is available instantaneously for printout, statistical analysis, viewable by actual values, or examined by a trending graph! The number of test runs, test loads, and length of runs is based upon federal and state requirements for the facility. Typical run times associated with emission testing are as follows: Type of Test # of runs Length of runs O 2 Traverse (GG) 1 low load (8 48 points) 2 minutes per point NOx Stratification Test 1 base load (12 points) 2 4 minutes per point Subpart GG 3 4 loads (30%, 50%, 75%, & 100%) minutes per run RATA 9 12 normal load 21 minutes per run State Permit Test (gases) 3 base load 1 hour per run State Permit Test (particulates) 3 base load 2 4 hours per run The stack gas analysis for O 2 and CO 2 concentrations are performed in accordance with procedures set forth in EPA Method 3a (EPA Method 20 for O 2 on combustion turbines). The O 2 analyzer uses a paramagnetic cell detector. The CO 2 analyzer uses an infrared detector. CO emission concentrations are quantified in accordance with procedures set forth in EPA Method 10. A continuous nondispersive infrared (NDIR) analyzer is used for this purpose. NOx emission concentrations are measured in accordance with procedures set fort in EPA Method 7e and/or 20. A chemiluminescence analyzer is used to determine the nitrogen oxides concentration in the gas stream. Total hydrocarbons (THC), non-methane, non-ethane hydrocarbons also known as volatile organic compounds (VOC) are analyzed in accordance with procedures set forth in EPA Methods 18 & 25a. A flame ionization detector calibrated with methane is used to determine the THC concentration in the gas stream and VOCs analyzed by GC to determine methane, ethane, and remaining VOCs per EPA Method 18 determination with gas chromatograph using FID detector.
264 ##.## ##.## ##.## ##.## ##.## ##.## ##.## ##.## ##.## ##.## ##.## Linked c:\shared\drawings\smtrsch.drw flow C:\SHARED\DRAWINGS\DETT SCHEMATIC.PPT 05/23/01 TKG bias line total hydrocarbon line Inlet/outlet sampling or parallel source real-time sampling. heated sample line bias line to vent or SO 2 CO 2 /O 2 ANALYZER COPYRIGHT 2001 AIR HYGIENE INTERNATIONAL, INC. CO 2 ANALYZER O 2 ANALYZER HYPER- LOGGER DATA RECORDER STACK heated sample line total hydrocarbon line MANIFOLD CO ANALYZER CO ANALYZER NOx ANALYZER NOx ANALYZER to vent or SO 2 THC ANALYZER THC ANALYZER GAS CONDITIONER MANIFOLD calibration/bias line SO 2 ANALYZER (optional) VENT SO 2 ANALYZER (optional) VENT GAS CONDITIONER CALIBRATION/ BIAS GAS BOTTLES Emission Analyzer System Flowchart for the Deluxe Trailer Unit (Dual Testing System)
265 E:\SHARED\DRAWINGS\PORT INSTALLATION.PPT 02/08/02 TKG DRW NO: COPYRIGHT 2002 AIR HYGIENE INTERNATIONAL, INC. 6 I.D. B SEE NOTE 3 4 MIN C B SECTION A not to scale SECTION B not to scale 1 ½ I.D. (SEE NOTE 2) SECTION C not to scale 3.0 MIN 6.0 MAX A AREA OF DOWNSTREAM DISTURBANCE (e.g. flared end section) STACK I.D. FLOW AREA OF UPSTREAM DISTURBANCE (e.g. baffles) PARTIAL STACK not to scale A 2 X STACK I.D. (SEE NOTE 4) 8 X STACK I.D. (SEE NOTE 4) NOTES 1.TWO PORTS WITH CENTERLINES AT 90 O ANGLES 2. 3 /8 INCH THICK STEEL, WELDED TO STACK EXTERIOR, PROVIDES PLACE TO HOOK CHAIN FOR RAIL ASSEMBLY 3.MINIMUM THREE INCH INNER DIAMETER STEEL PIPE, WELDED TO STACK EXTERIOR, HOLE CUT INTO STACK WALL, NO POTRUSIONS OR OBSTRUCTIONS INSIDE STACK WALL 4.IF TOTAL STACK LENGTH IS NOT AVAILABLE, EPA MINIMUM REQUIREMENTS ARE ½ X STACK I.D. FROM PORTS TO TOP AND 2 X STACK I.D. FROM PORTS TO BOTTOM PORT INSTALLATION DIAGRAM 5634 S. 122 nd East Ave, Suite F Tulsa, Oklahoma (888) E:\SHARED\DRAWINGS\PORT INSTALLATION.PPT 02/08/02 TKG DRW NO: COPYRIGHT 2002 AIR HYGIENE INTERNATIONAL, INC. not to scale 3.0 MIN 6.0 MAX 13 MIN PORT CLAMPS INSTALLED 5634 S. 122 nd East Ave, Suite F Tulsa, Oklahoma (888)


266 TURBINE TESTING QUALITY ASSURANCE ACTIVITIES A number of quality assurance activities are undertaken before, during, and after turbine testing projects. This section describes each of those activities. Each instrument s response is checked and adjusted in the field prior to the collection of data via multi-point calibration. The instrument s linearity is checked by first adjusting its zero and span responses to zero nitrogen and an upscale calibration gas in the range of the expected concentrations. The instrument response is then challenged with other calibration gases of known concentration and accepted as being linear if the response of the other calibration gases agreed within ± two percent of range of the predicted values. NO 2 to NO conversion is checked via direct connect with a EPA Protocol certified concentration of NO 2 in a balance of nitrogen. Conversion is verified to be above 90 percent. Instruments are both factory tested and periodically field challenged with interference gases to verify the instruments have less than a two percent interference from CO 2, SO 2, CO, NO, and O 2. After each test run, the analyzers are checked for zero and span drift. This allows each test run to be bracketed by calibrations and documents the precision of the data collected. The criterion for acceptable data is that the instrument drift is no more than three percent of the full-scale response. Quality assurance worksheets summarize all multipoint calibration linearity checks and the zero to span checks performed during the tests are included in the test report. The sampling systems is leak-checked by demonstrating that a vacuum greater than 10 in. Hg can be held for at least one minute with a decline of less than one in. Hg. A leak test is conducted after the sample system is set up and before the system is dismantled. This test is conducted to ensure that ambient air does not dilute the sample. Any leakage detected prior to the tests is repaired and another leak check conducted before testing will commence. The absence of leaks in the sampling system is also verified by a sampling system bias check. The sampling system s integrity is tested by comparing the responses of the analyzers to the responses of the calibration gases introduced via two paths. The first path is directly into the analyzers and the second path includes the complete sample system with injection at the sample probe. Any difference in the instrument responses by these two methods is attributed to sampling system bias or leakage. The criterion for acceptance is agreement within five percent of the span of the analyzer. The control gases used to calibrate the instruments are analyzed and certified by the compressed gas vendors to ± one percent accuracy for all gases. EPA Protocol No. 1 is used, where applicable, to assign the concentration values traceable to the National Institute of Standards and Technology (NIST), Standard Reference Materials (SRM). The gas calibration sheets as prepared by the vendor are included in the test report.


267 TURBINE QUALITY ASSURANCE PROGRAM SUMMARY AIR HYGIENE ensures the quality and validity of its emission measurement and reporting procedures through a rigorous quality assurance (QA) program. The program is developed and administered by an internal QA team and encompasses five major areas: QA Reviews 1. QA reviews of reports, laboratory work, and field testing; 2. Equipment calibration and maintenance; 3. Chain-of-custody; 4. Training; and 5. Knowledge of current test methods. AIR HYGIENE s review procedure includes review of each source test report, along with laboratory and fieldwork, by the QA Team. The most important review is the one that takes place before a test program begins. The QA Team works closely with technical division personnel to prepare and review test protocols. Test protocol review includes selection of appropriate test procedures, evaluation of interferences or other restrictions that might preclude use of standard test procedures, and evaluation and/or development of alternate procedures. Equipment Calibration and Maintenance The equipment used to conduct the emission measurements is maintained according to the manufacturer s instructions to ensure proper operation. In addition to the maintenance program, calibrations are carried out on each measurement device according to the schedule outlined by the Environmental Protection Agency. Quality control checks are also conducted in the field for each test program. Finally, AIR HYGIENE participates in a PT gas program by analyzing blind gases semi-annually to ensure continued quality. Chain-of-Custody AIR HYGIENE maintains full chain-of-custody documentation on all samples and data sheets. In addition to normal documentation of changes between field sample custodians, laboratory personnel, and field test personnel, AIR HYGIENE documents every individual who handles any test component in the field (e.g., probe wash, impinger loading and recovery, filter loading and recovery, etc.). Samples are stored in a locked area to which only AIR HYGIENE personnel have access. Field data sheets are secured at AIR HYGIENE s offices upon return from the field. Training Personnel s training is essential to ensure quality testing. AIR HYGIENE has formal and informal training programs, which include: 1. Participation in EPA-sponsored training courses; 2. A requirement for all technicians to read and understand Air Hygiene Incorporated s QA manual; 3. In-house training relating to 40 CFR Part 60 Appendix A methods and QA meetings on a regular basis; 4. OSHA 40 hour Hazwopper Training; 5. Visible Emission (Opacity) Training; and 6. Maintenance of training records. Knowledge of Current Test Methods With the constant updating of standard test methods and the wide variety of emerging test procedures, it is essential that any qualified source tester keep abreast of new developments. AIR HYGIENE subscribes to services, which provide updates on EPA reference methods, rules, and regulations. Additionally, source test personnel regularly attend and present papers at testing and emission-related seminars and conferences. AIR HYGIENE personnel maintain membership in various relevant organizations associated with gas fired turbines.
268 F-Factor Datasheet and Fuel Gas Analysis Company: Location: Date: XYZ Power XYZ Power Plant April 9, 2001 Values to enter from fuel gas analysis by GPA Font Scheme: Blue Font = enter new data Black Font = calculated data Green Font = Labels for columns & rows Red Font = Important results with notes Gas Component Mole (%) Molecular Weight lb Component per Weight % of Fuel Heat Value Fuel Heat Value (lb/lb-mole) lb-mole of Gas Component [HHV] (Btu/scf) 1 [LHV] (Btu/scf) 1 Methane CH Ethane C2H Propane C3H iso-butane ic4h n-butane nc4h Iso-Pentane ic5h n-pentane nc5h Hexanes C6H Heptanes C7H Octanes C8H Carbon Dioxide CO Nitrogen N Hydrogen Sulfide H2S Oxygen O Helium He Hydrogen H Totals (dry) Totals (wet) Standardized to 60 o F and 1 atm to match fuel flow data If total is not then the mol% data was either entered incorrectly or the gas analysis is incomplete. Sometimes small differences are due to rounding error. High Heat Value of dry gas (HHV-dry) This is the primary fuel heat value used in emission testing calculations. High Heat Value of wet Gas. HHV-wet Low Heat Value of dry gas. LHV-dry Low Heat Value of wet gas. LHV-wet Characteristics of Fuel Gas Component Weight % Molecular Weight of gas = lb/lb-mole carbon Btu per lb. of gas = gross (HHV) Value used to convert THC oxygen 0.98 Btu per lb. of gas = net (LHV) readings to VOC. hydrogen wt % VOC in fuel gas = 0.83 % nitrogen 1.04 Specific Gravity = helium 0.00 sulfur 0.00 F-Factor (scf dry exhaust per MMBtu [HHV] = Total (Based on EPA RM-19) at 68 o F and 1 atm Fuel Specific F-Factor. Note that EPA Method 19 lists natural gas's F- F-Factor Calculation: factor as F-Factor = 1,000,000*((3.64*%H)+(1.53*%C)+(0.57*%S)+(0.14*%N)-(0.46*%O))/GCV %H, %C, %S, %N, & %O are percent weight values calculated from fuel analysis and have units of (scf/lb)/% GCV = Gross Btu per lb. of gas (HHV)
269 Fuel Data EXAMPLE TESTING DATASHEET FOR GASES XYZ Power Plant GE GTG Frame 7FA Combustion Turbine Fuel: Natural Gas Weather Data Fuel F-Factor 8,671.5 SCF/MMBtu Barometric Pressure in. Hg Generator Output MW Relative Humidity 82 % Fuel Flow 515,040.8 SCFH Dry Bulb Temperature 72 F Fuel Heating Value (HHV) 1,076.5 Btu/SCF Specific Humidity lb H2O/lb air Combustor Inlet Pressure 6,166.5 mm Hg Wet Bulb Temperature 68 F Heat Input (LHV) MMBtu/hr Stack Moisture Content 8.4 % yellow - supporting information Stack Exhaust Flow 13,600,266.4 SCFH gray - raw testing data green - final results Run #1-100% High Load Date/Time Elapsed Time O 2 NOx CO VOC SO 2 CO 2 (mm/dd/yy hh:mm:ss) (seconds) (%) (ppmvd) (ppmvd) (ppmvw) (ppmvd) (%) 06/27/01 11:47: /27/01 11:48: /27/01 11:48: /27/01 11:49: /27/01 11:49: /27/01 11:50: /27/01 11:50: /27/01 11:51: /27/01 11:51: /27/01 11:52: /27/01 11:52: /27/01 11:53: /27/01 11:53: /27/01 11:54: /27/01 11:54: /27/01 11:55: /27/01 11:55: /27/01 11:56: /27/01 11:56: /27/01 11:57: /27/01 11:57: /27/01 11:58: /27/01 11:58: /27/01 11:59: /27/01 11:59: /27/01 12:00: /27/01 12:00: /27/01 12:01: /27/01 12:01: /27/01 12:02: /27/01 12:02: /27/01 12:03: /27/01 12:03: /27/01 12:03: RAW AVERAGE QA/QC Data Control O 2 (%) NOx (ppmvd) CO (ppmvd) VOC (ppmvw) SO 2 (ppmvd) CO 2 (%) Bias & Drift Checks Initial Zero Final Zero Avg. Zero Initial UpScale Final UpScale Avg. UpScale Upscale Cal Gas Emissions Data O 2 (%) NOx (ppmvd) CO (ppmvd) VOC (ppmvd)* SO 2 (ppmvd) CO 2 (%) Corrected Raw Averages % O 2 N/A N/A 15% O 2 & ISO N/A N/A Emission Rate (lb/mmbtu) N/A N/A Emission Rate (lb/hr) N/A N/A Emission Rate 8760 hr/yr N/A N/A Emission Rate (g/mw*hr) N/A N/A *VOC data in Emissions Data Table has been converted to dry values by the equation below. *VOC uncorrected raw average * (100/100-stack moisture content)

 545-2579 (434) 589-7224 (816) 822-3250 Jose P.")
270 CLIENT REFERENCES The following are current clients who represent the various companies for whom AIR HYGIENE has performed testing services. Please feel free to call and discuss our services with them. Brian Kearney Linda Boyer David Sloat Reliant Energy Pennsylvania Power & Light Sargent & Lundy (814) (610) (312) Kathy Waxman Rex Lee Sheila Wheeler Keyspan Energy Kiewit Burns & McDonnell (516) (434) (816) Jose P. Lozada Kevin Kellie Mark Chrisos Burns and Roe Calpine Intergen (201) (918) (781) Gush Singh Ron Sigur Tom Price Bechtel Fresh Meadow Mechanical Calpine - Oregon (301) (516) (541) Don Fritz Jordan M. Haywood Ken Welch Mirant Siemens Westinghouse Universal Energy (702) (407) (281) Richard Winch Charles Spell Glenn Atkinson PowerTek (A Subsidiary of Power Technological Services) Arizona Public Service Co. Zachry Construction (417) (602) (770) Roosevelt Huggins Steve Brooks Tim Travers Black & Veatch Aquila Florida Power & Light (913) (816) (610) Tracy Patterson Rod Klauer Terrie Blackburn Cogentrix Peerless Manufacturing Williams Power (804) (972) (918) PK Chelian Mary Kate Grossman Sam Faghih Foster Wheeler AES SNC-Lavalin (908) (817) (425) Tim Mordhorst Mark Finnlay David Stackhouse Black Hills Alstrom KM Power (Kinder Morgan) (605) mark.finlay@power.alstom.com (303) Darin Watson Mike Geers Monty Wiggins Transalta Cinergy Modern Continental (360) (513) (864) Satoru (Scott) Shishido Karst Postma Chris Jacobsen Hitachi TIC Tenaska Power Partners (914) (970) (402) Robert Van Engelenhoven John Davis J. Neely Ashe Pacificorp LG Constructors Duke Energy (801) (702) (713) Jammie Bowen Joe Elliot Richard Hooper Utility Engineering Nooter Erickson Stone & Webster (806) (636) (303) Marilyn Teague William Stark Robert Farmer Sempra Energy RW Beck URS Corporation (949) (303) (602) Lewis Schuessler Charles Gibbs Mike Brown BE&K Engineering PIC World AEP (205) (678) (724)
271 APPENDIX H MPCA APPROVALS AND REQUESTED FORMS
272 Message Page 1 of 1 Thomas Graham From: Sent: To: Cc: Gorg, Steven [Steven.Gorg@state.mn.us] Tuesday, May 29, :02 PM chuck.wagoner@fibrowattusa.com Terry Walmsley; victor.myers@slthermal.com; robert.dolesky@snclavalin.com; Magee-Hill, Heather; Kilgriff, Sarah; Stock, Curtis; Place, Andrew; tom@airhygiene.com Subject: Fibrominn, LLC (SV 001): Test Plan Approval Letter (May 29, 2007) Attachments: Fibrominn (SV 001).pdf; Performance Test Report Completeness Criteria (PTRCC).pdf Hello Chuck. Attached is the approval letter and referenced form (Performance Test Report Completeness Criteria (PTRCC).pdf) for your recently submitted test plans. Thanks - Steve Steven J. Gorg, M.S., P.E. Environmental Engineer Industrial Division Minnesota Pollution Control Agency (MPCA) 520 Lafayette Road, St. Paul, MN Phone: Fax: steven.gorg@pca.state.mn.us MPCA web site: 7/16/2007
273 Performance Test Plan Approval Minnesota Pollution Control Agency 520 Lafayette Rd. N. Saint Paul, MN (651) AQ#4065 Facility Name: Fibrominn, LLC Facility Contact: Chuck Wagoner Address: 900 Industry Drive Phone: Test Locations: SV 001 (EU 001, MR ; CE 001, 003 and 004) Scheduled For: June 04 through June 11, 2007, at your facility located in Benson, Minnesota. Your test plan received on May 07, 2007, and discussed on May 29, 2007, is approved by the Minnesota Pollution Control Agency (MPCA) as follows: Shortened test notification approved Test plan approved without modification Test plan approved with the following provisions: The performance tests are being performed to measure emissions for determining the compliance status with permitted emission limits/requirements (see the relevant permit requirements for limits/requirements/parameters). Emission units and control equipment associated with the results of the performance test must be operated at maximum capacity/worse case conditions to avoid the establishment of new operational limits. The control equipment operational parameters may change based on the averages recorded during testing. Include in the final test report(s) the full reference method data record (strip chart and/or datalogger output) used to calculate emissions. The data record should include calibration values for any instrumental analyzer used for emissions compliance testing. Include in the final test report(s) all process and pollution control equipment operating data collected at 15 minute intervals and averaged for each test period. This information should be easily understood by individuals not familiar with the process. Include in the final test report and CD-ROM copy; a signed certifications form, the test plan, this test plan approval letter (TPAL) and the to which the TPAL was attached. The CD-ROM test report copy must be labeled with the AQ File Number, Company Name, Emission Unit Tested and Test Dates as stated on the submittal form. Only one paper copy and one CD-ROM/Microfiche copy of the test report are to be submitted. Include in the final test report a simplified drawing of the test locations including pollution control equipment, stack orientation and test port locations. Required Forms: Include the process rates and control equipment rates on the Operating Data Summary Form. Obtain the required submittal and operating data forms from the website noted below 1. Operating Data Summary- Combustion Operating Data Summary- Waste
274 Sources 1 Combustors 1 Operating Data Summary- Process Sources 1 Operating Data Summary- Asphalt Plants 1 Certifications Form 1 Microfiche/CD-ROM Submittal Form 1 Performance Test Report Completeness Criteria (PTRCC) (attached) 1 Available at: Approved by: Date: May 29, 2007 Steven J. Gorg, M.S., P.E. Environmental Engineer Industrial Division Compliance and Enforcement Section Please contact me at (651) if you have any questions regarding this approval. Please be aware that enforcement action will be taken for performance test failures indicating emissions above applicable limits (excess actual emissions to the environment). Failures commonly result in assessment of a monetary penalty. Upon the first test failure, the Company should take immediate measures to minimize emissions. The measures taken should be documented, as they will become part of the record of corrective actions. Hard Copy Performance Test Reports and Microfiche or CD Copy submittals will be addressed to: Compliance Tracking Coordinator, Compliance and Enforcement Unit, Industrial Division, Minnesota Pollution Control Agency, 520 Lafayette Road North, St. Paul, Minnesota cc: Terry Walmsley, Fibrowatt ( ) Victor Myers, Fibrominn ( ) Robert Dolesky, SNC Lavalin ( ) Thomas Graham, P.E., Air Hygiene International ( ) Heather Magee-Hill, MPCA St. Paul ( ) Sarah Kilgriff, MPCA St. Paul ( ) Curt Stock, MPCA St. Paul ( ) Andy Place, MPCA St. Paul ( ) AQ Correspondense File No. 4065

275 Air Performance Test Form Operating Data Summary for Combustion Sources Facility Information (please print) Company name: Fibrominn, LLC Furnace(s) No: 1 Test date(s): July 2-4, 2007 A. Fuel Input and Operating Capacities: Itemize fuels and materials added to the combustion process during the test period. Attach ultimate/proximate analysis of the fuel, if applicable. List appropriate units. Run No. Fuel type & origin (e.g. Bituminous/Eastern) Fuel input (list units) Heat content (list units) Steam (10 3 lbs/hr) Gross MW/hr Heat input (10 6 Btu/hr) 1 Biomass (turkey litter) 83.9 ton/hr 4,334 Btu/lb Biomass (turkey litter) 83.3 ton/hr 4,334 Btu/lb Biomass (turkey litter) 88.5 ton/hr 4,334 Btu/lb Avg. Biomass (turkey litter) ton/hr 4,334 Btu/lb B. Operating Data for Furnace and Air Pollution Control Equipment 1. Were the furnace(s) and control equipment operated consistent with normal procedures? Yes No If no, explain 2. Date(s) and procedure(s) of last maintenance/cleaning within 6 months: Remains unchanged from information provided in test plan 3. Include a copy of chart/data log records during test for the combustion efficiency indices: carbon monoxide (CO), oxygen (O 2 ), carbon dioxide, (CO 2 ), combustibles, steam flow, air flow, etc. (Label as appropriate.) 4. Soot blowing and ash pulling information: No soot blowing or ash pulling conducted, go to Item 5. What is the normal soot blowing frequency for unit(s)? Continuous, no further information required for this column. a) minutes/shift: 240 b) shifts/day: 2 What were the soot blowing times during the test? Start: periodic End: Start: End: Last time before testing when soot blown? (date and time) What is the normal ash pulling frequency for unit(s)? Continuous, no further information required for this column. a) minutes/shift: b) shifts/day: What were the soot blowing times during the test? Start: End: Start: End: Last time before testing when soot blown? (date and time) aq-f6-04 5/1/07 Page 1 of 2
VALIDATION STUDY OF FTIR-BASED EMISSIONS MEASUREMENTS AT A MUNICIPAL WASTE COMBUSTOR
 AP-157 VALIDATION STUDY OF FTIR-BASED EMISSIONS MEASUREMENTS AT A MUNICIPAL WASTE COMBUSTOR Grant M. Plummer, Ph.D. Peter Zemek, Ph.D. Special Projects Manager Applications Manager Enthalpy Analytical,
Gaseous CEMS technology
 GAS CEMS EXTRACTIVE IN-SITU COLD DRY HOT WET DRY DILUTION PROBE/ POINT IN-STACK CROSS STACK OUT OF STACK Gaseous CEMS technology Probe (at stack) Heated filter Heated sample line Condenser Pump Analyzers
PA DEP SOUTHWEST REGIONAL OFFICE
 PA DEP SOUTHWEST REGIONAL OFFICE MEMO TO FROM Air Quality Permit File: OP-04-00043 / Thomas J. Joseph, P.E. Facilities Engineering Manager Air Quality Program THROUGH Mark R. Gorog, P.E. Environmental
Omega Chemicals Emissions Testing Report
 Omega Chemicals 18-Feb-2015 Doc No. 60336610_1.1_RPT Omega Chemicals Emissions Testing Report February 2015 NATA ACCREDITATION No. 2778 (14391) Accredited for compliance with ISO/IEC 17025 This document
INDUSTRIAL RESOURCES, INC. Power Plant Fundamentals Training
 INDUSTRIAL RESOURCES, INC Power Plant Fundamentals Training Module 2 Power Plant Theory Power Plant Fundamentals Training This program is designed to provide you with a fundamental understanding of power
Validation Study of FTIR-Based Emissions Measurements at a Municipal Waste Combustor
 13th North American Waste to Energy Conference May 23-25, 2005, Orlando, Florida USA NAWTEC13-3158 Validation Study of FTIR-Based Emissions Measurements at a Municipal Waste Combustor G. J. Aldina Jeffrey
Mercury Stack Monitor SM-4
 Member of the envea Group Mercury Stack Monitor SM-4 Automatic continuous emission monitor (CEM) for mercury Continuous operation Sample dilution directly at stack - works with virtually any sample matrix
Chimney Sizing. Project Name: Location: Type Appliance: Hot Water Heater Incinerator. LP Gas #2 Oil #6 Oil Wood/Coal Waste (Type ) Appliance Input:
 Appliance Input:") Chimney Sizing Project Name: Location: Type Appliance: Type Fuel: Appliance Input: Boiler Hot Water Heater Incinerator Natural Gas LP Gas #2 Oil #6 Oil Wood/Coal Waste (Type ) BTU Hp Lbs/hr Height Above
Chimney Sizing Project Name: Location: Type Appliance: Type Fuel: Appliance Input: Boiler Hot Water Heater Incinerator Natural Gas LP Gas #2 Oil #6 Oil Wood/Coal Waste (Type ) BTU Hp Lbs/hr Height Above
050 - Industrial Fuel Combustion (Distillate, Residual, and LPG) & Stationary ICEs (Diesel and Other)
 & Stationary ICEs (Diesel and Other)") San Joaquin Valley AIR POLLUTION CONTROL DISTRICT 2006 Area Source Emissions Inventory Methodology 050 - INDUSTRIAL FUEL COMBUSTION (DISTILLATE, RESIDUAL, AND LPG) INDUSTRIAL STATIONARY IC ENGINES (DIESEL
San Joaquin Valley AIR POLLUTION CONTROL DISTRICT 2006 Area Source Emissions Inventory Methodology 050 - INDUSTRIAL FUEL COMBUSTION (DISTILLATE, RESIDUAL, AND LPG) INDUSTRIAL STATIONARY IC ENGINES (DIESEL
LANCOM200 PORTABLE ACID DEWPOINT TEMPERATURE MONITORING. Acid Dewpoint SO3 H2 SO4 QUALITY CUSTOMER SOLUTIONS
 PORTABLE ACID DEWPOINT TEMPERATURE MONITORING i Acid Dewpoint SO3 H2 SO4 QUALITY CUSTOMER SOLUTIONS AMETEK LAND HAS BEEN MANUFACTURING PRECISION MEASURING EQUIPMENT SINCE 1947. WE ARE SPECIALISTS IN NON-CONTACT
Developing an Improved Impinger-Based Method for Measuring Gaseous Hydrogen Chloride in Cement and Lime Kiln Emissions
 Developing an Improved Impinger-Based Method for Measuring Gaseous Hydrogen Chloride in Cement and Lime Kiln Emissions Laura L. Kinner and James W. Peeler Emission Monitoring Inc. Raleigh, NC 27612 Daniel
Covanta Durham York Renewable Energy Limited Partnership.
 Covanta Durham York Renewable Energy Limited Partnership. Protocol for the Measurement of Combustion Temperature And the Development of Time and Temperature Correlations Approved by: Mark White Director,
TO-15 Checklist Determination of VOCs in Air by GC-MS
 LAB ID: DATE: LAB NAME: ASSESSOR NAME: Method Number: TO-15 Checklist Determination of VOCs in Air by GC-MS SOP Number: Revision Number: SOP Date: Personnel records observed: Data records observed: Revision
Laboratory 1: Calibration of a High-Volume Sampler
 Laboratory 1 Laboratory 1: Calibration of a High-Volume Sampler 1.1 To the User of this Manual This manual has been prepared to guide the students through a series of laboratory exercises developed to
405 Compact Orifice Series and 1595 Conditioning Orifice Plate Flow Test Data Book and Flow Handbook
 405 Compact Orifice Series and 1595 Conditioning Orifice Plate Flow Test Book and Flow Handbook www.rosemount.com 405 Compact Orifice Series and 1595 Conditioning Orifice Plate Flow Test Book NOTICE Read
Annubar Primary Element Flow Calculations
 Rosemount 485 Annubar Annubar Primary Element Flow Calculations ANNUBAR PRIMARY ELEMENT FLOW EQUATIONS The Annubar primary element flow equations are all derived from the hydraulic equations which are
THE APPLICATION OF PROCESS MASS SPECTROMETRY TO FUMED SILICA PRODUCTION
 JPACSM 5 Process Analytical Chemistry THE APPLICATION OF PROCESS MASS SPECTROMETRY TO FUMED SILICA PRODUCTION Peter Traynor and Steven Trimuar Thermo Electron Corporation Houston, TX Robert G. Wright Thermo
405 Compact Orifice Series and 1595 Conditioning Orifice Plate Flow Test Data Book and Flow Handbook
 Reference Manual 405 Compact Orifice Series and 1595 Conditioning Orifice Plate Flow Test Book and Flow Handbook www.rosemount.com Reference Manual 405 and 1595 405 Compact Orifice Series and 1595 Conditioning
Sampling. Information is helpful in implementing control measures for reducing pollutant concentration to acceptable levels
 Types of pollutant sampling and measurement: Air quality monitoring: Sampling and measurement of air pollutants generally known, as air quality monitoring. It is an integral component of any air pollution
Atmospheric Analysis Gases. Sampling and analysis of gaseous compounds
 Atmospheric Analysis Gases Sampling and analysis of gaseous compounds Introduction - External environment (ambient air) ; global warming, acid rain, introduction of pollutants, etc - Internal environment
Lab 4 Major Anions In Atmospheric Aerosol Particles
 Georgia Institute of Technology School of Earth and Atmospheric Sciences EAS 4641 Spring 2008 Lab 4 Major Anions In Atmospheric Aerosol Particles Purpose of Lab 4: This experiment will involve determining
405 Compact Orifice Series and 1595 Conditioning Orifice Plate Flow Test Data Book and Flow Handbook
 405 Compact Orifice Series and 1595 Conditioning Orifice Plate Flow Test Book and Flow Handbook www.rosemount.com 405 and 1595 405 Compact Orifice Series and 1595 Conditioning Orifice Plate Flow Test
Draft PS 18 APPENDIX A Dynamic Spiking Procedure ( ) 1.1 This appendix to Performance Specification 18
 1.1 This appendix to Performance Specification 18") Draft PS 18 APPENDIX A Dynamic Spiking Procedure (4-4-2013) A1. Scope and Application 1.1 This appendix to Performance Specification 18 describes the procedure and performance requirements for dynamic
Draft PS 18 APPENDIX A Dynamic Spiking Procedure (4-4-2013) A1. Scope and Application 1.1 This appendix to Performance Specification 18 describes the procedure and performance requirements for dynamic
UV Hound Series. Dependable High Quality Air Monitoring. Accurate Readings Within Seconds. Portable UVDOAS Multi-gas Analyzers. Multi-Gas Capability
 UV Hound Series Portable UVDOAS Multi-gas Analyzers Multi-Gas Capability Dependable High Quality Air Monitoring Individual VOCs PPB Sensitivity Non-Contact Optical Measurement Automated Reporting Configurable
CONCEPTS AND DEFINITIONS. Prepared by Engr. John Paul Timola
 CONCEPTS AND DEFINITIONS Prepared by Engr. John Paul Timola ENGINEERING THERMODYNAMICS Science that involves design and analysis of devices and systems for energy conversion Deals with heat and work and
98 Series Backpressure Regulators and Relief Valves
 9 Series Backpressure Regulators and Relief Valves Bulletin.:9 November 09 W TYPE 9H W TYPE 9LD Figure. Typical 9 Relief Valves Introduction W TYPE 9HD The 9 Series (Figure ) is used for backpressure or
Humidity Calibration Solutions
 Humidity Calibration Solutions www.michell.com Humidity Calibration Solutions The Importance of Regular Calibration The reliable operation of a hygrometer and indeed any measuring instrument, can only
METHOD MIDGET IMPINGER HCl/Cl EMISSION SAMPLING TRAIN
 METHOD 0051 MIDGET IMPINGER HCl/Cl EMISSION SAMPLING TRAIN 1.0 SCOPE AND APPLICATION This method describes the collection of hydrogen chloride (HCl, CAS Registry Number 7647010) and chlorine (Cl, CAS Registry
White Paper. Overview: NDIR Definition:
 Title: NDIR Technology Overview, Compliance, and Comparison to Other Generally Available Gas Measurement Technologies TSN Number: 06 File:\\MII- SRV1\Metron\Bridge_Analyzers\Customer_Service_Documentation\White_Papers\06
Technical Contact. Randy Moore. (910) Highway 421 North Wilmington, NC 28401
 Highway 421 North Wilmington, NC 28401") NORTH CAROLINA DIVISION OF AIR QUALITY Air Permit Review Permit Issue Date: Facility Data Applicant (Facility s Name): Wilbara, LLC Facility Address: Wilbara, LLC SIC: 2819 / Industrial Inorganic Chemicals
NORTH CAROLINA DIVISION OF AIR QUALITY Air Permit Review Permit Issue Date: Facility Data Applicant (Facility s Name): Wilbara, LLC Facility Address: Wilbara, LLC SIC: 2819 / Industrial Inorganic Chemicals
TECORA Isostack G4 and DECS Stack Emissions Sampling. Methods for sampling emissions of Dioxins, Mercury and Heavy Metals
 Methods for sampling emissions of Dioxins, Mercury and Heavy Metals Outline of the session: Sampling using the Standard Reference Method Continuous sampling Dioxins Furans What are dioxins and dioxin-like
CONSTRUCTION MATERIALS
 CONSTRUCTION MATERIALS T E C H N O L O G I E S PERFORMANCE TEST REPORT FOR Southern Manufacturing Division of Accord Industries IN ACCORDANCE WITH FLORIDA BUILDING CODE (HIGH VELOCITY HURRICANE ZONES)
Re: Report on Yorktown Units 1 & 2 Operations Pursuant to Order No
 Services, inc. ~ Dominion 120 Tredegar Street, Richmond, VA 23219 ~r Energy Dominion Energy.com The Honorable James Richard Perry Secretary of the Energy United States Department of Energy 1000 Independence
ANALYTICAL METHOD DETERMINATION OF VOLATILE ALDEHYDES IN AMBIENT AIR Page 1 of 11 Air sampling and analysis
 DETERMINATION OF VOLATILE ALDEHYDES IN AMBIENT AIR Page 1 of 11 Replaces: Dated: Author: Date: AM-No.: New New Nils Arne Jentoft 18.06.2014 0 CHANGES This procedure is new. 1 SCOPE This document describes
New Test Results For Physical Separation Of Tritium From Noble Gases And It s Implications For Sensitivity And Accuracy In Air And Stack Monitoring
 New Test Results For Physical Separation Of Tritium From Noble Gases And It s Implications For Sensitivity And Accuracy In Air And Stack Monitoring -Robert Goldstein, Ivan Mitev, Dell Williamson, Overhoff
PowerPoint Presentation by: Associated Technical Authors. Publisher The Goodheart-Willcox Company, Inc. Tinley Park, Illinois
 Althouse Turnquist Bracciano PowerPoint Presentation by: Associated Technical Authors Publisher The Goodheart-Willcox Company, Inc. Tinley Park, Illinois Chapter 1 History and Fundamentals of Refrigeration
1. General details Objective Description of the bus and mode of operation during the measurements Measurement results...
 Table of contents 1. General details...3 Measurement bases:... 3 1. Continuous measurements:... 3 2. Discontinuous measurements:... 4 2. Objective...5 3. Description of the bus and mode of operation during
METHOD 7B - DETERMINATION OF NITROGEN OXIDE EMISSIONS FROM STATIONARY SOURCES (ULTRAVIOLET SPECTROPHOTOMETRIC METHOD)
") 683 METHOD 7B - DETERMINATION OF NITROGEN OXIDE EMISSIONS FROM STATIONARY SOURCES (ULTRAVIOLET SPECTROPHOTOMETRIC METHOD) NOTE: This method does not include all of the specifications (e.g., equipment and
683 METHOD 7B - DETERMINATION OF NITROGEN OXIDE EMISSIONS FROM STATIONARY SOURCES (ULTRAVIOLET SPECTROPHOTOMETRIC METHOD) NOTE: This method does not include all of the specifications (e.g., equipment and
Edgetech Instruments Inc.
 2015_07_ETI OVERVIEW Rev 3 MADE IN THE USA Edgetech Instruments (ETI) is a USA company based in Massachusetts. We have over 50 years of expertise in the design and manufacture of a comprehensive range
SECOND ENGINEER REG. III/2 APPLIED HEAT
 SECOND ENGINEER REG. III/2 APPLIED HEAT LIST OF TOPICS A B C D E F G H I J K Pressure, Temperature, Energy Heat Transfer Internal Energy, Thermodynamic systems. First Law of Thermodynamics Gas Laws, Displacement
Re: Report on Yorktown Units I & 2 Operations Pursuant to Order No
 a Services. inc Dominion 120 Tredegar Street, Richmond, VA 23219 r Energy Dominion E nergy,com The Honorable James Richard Perry Secretary of the Energy United States Department of Energy 1000 Independence
Warning!! Chapter 5 Gases. Chapter Objectives. Chapter Objectives. Chapter Objectives. Air Pollution
 Warning!! Larry Brown Tom Holme www.cengage.com/chemistry/brown Chapter 5 Gases These slides contains visual aids for learning BUT they are NOT the actual lecture notes! Failure to attend to lectures most
Item 1: Edits to Select Appendix S Class I Air Dispersion Modeling Report text
 2016 Class I Errata Poly Met Mining, Inc. NorthMet Project December 23, 2016 The following provides revisions and corrections to the Class I air dispersion modeling submitted with the permit application
Controlled FTIR measurements of acid gas (NO, mixed NO/SO 2 ) capture in water at high pressure
 capture in water at high pressure") ANLECR&D project 6 0215 0234 Controlled FTIR measurements of acid gas (NO, mixed NO/SO 2 ) capture in water at high pressure Sub contract to Macquarie University Report of ANLECR&D Project 6 0215 0243
ANLECR&D project 6 0215 0234 Controlled FTIR measurements of acid gas (NO, mixed NO/SO 2 ) capture in water at high pressure Sub contract to Macquarie University Report of ANLECR&D Project 6 0215 0243
Pilot-Plant Performance Testing to Support Development of a Dilution Extractive HCl Monitoring System
 Pilot-Plant Performance Testing to Support Development of a Dilution Extractive HCl Monitoring System Ty Smith Cemtek Group Inc. and Ken Greaves Cemtek Instruments Inc. Background Cemtek is researching
Target Insertion Flowmeter
 Principle of Operation Flow is measured in terms of dynamic force acting on a target (solid disk) in the flow stream. Hermetically sealed, bonded strain gages in a bridge circuit configuration mounted
Laboratory Validation of Ozone Sampling with Spill-Proof Impingers
 Laboratory Validation of Ozone Sampling with Spill-Proof Impingers Laboratory Validation of Ozone Sampling with Spill-Proof Impingers Research performed by the Southern Research Institutes, Birmingham,
 DEPARTMENT OF ELECTRONICS AND INSTRUMENTATION ENGINEERING SRM NAGAR, KATTANKULATHUR-603203 EI 2302 ANALYTICAL INSTRUMENTS QUESTION BANK UNIT I COLORIMETRY AND SPECTROPHOTOMETRY Part A 1. State Lambert
Services, inc. Re: Report on Yorktown Units 1 & 2 Operations Pursuant to Order Nos and
 Services, inc ~ Dominion 120 Tredegar Street, Richmond, VA 23219 ~ Energy Damn onenergycom The Honorable James Richard Perry Secretary of the Energy United States Department of Energy 1000 Independence
Approval Block. Prepared by: Signature Date Evan Parnell 08 NOV Reviewed by: Signature Date. Approved by: Signature Date
 ATS-SOI-3660 Page: 1 of 6 Approval Block Prepared by: Signature Date Evan Parnell 08 NOV 2013 Reviewed by: Signature Date Brian Flynn 08 NOV 2013 Approved by: Signature Date Kristal Jewell 08 NOV 2013
ISA QATAR : 90 th Seminar
 ANALYTICAL INSTRUMENTATION & MAINTENANCE SYSTEMS (AIMS) ISA QATAR : 90 th Seminar UTILIZATION OF LASERS IN THE FIELD OF GAS ANALYZERS Presenter: ZAHEER JUDDY Electromagnetic Spectrum Electromagnetic Spectrum
ABB MEASUREMENT & ANALYTICS DATA SHEET. PGC5000 Temperature programmed gas chromatograph
 ABB MEASUREMENT & ANALYTICS DATA SHEET PGC5000 Temperature programmed gas chromatograph 2 P G C 5 0 0 0 T E M P E R AT U R E P R O G R A M M E D D S/ P G C 5 0 0 0 T P - E N Measurement & Analytics The
Fusion UV/Persulfate TOC Analyzer
 www.ietltd.com Proudly serving laboratories worldwide since 1979 CALL +847.913.0777 for Refurbished & Certified Lab Equipment Fusion UV/Persulfate TOC Analyzer The Fusion Total Organic Carbon (TOC) Analyzer
Major Point/Area Sources Name Type Major Emissions Distance (m) Direction CFB Cold Lake Air Force Base NOx, PM, HC, TRS 3km to aircraft West
 Direction CFB Cold Lake Air Force Base NOx, PM, HC, TRS 3km to aircraft West") Page 1 of 11 Site Documentation: Cold Lake South Continuous Monitoring Station General Site Information Item Description Site ID (CASA ID) LICA01 Station Name Cold Lake South Continuous Monitoring Station
Page 1 of 11 Site Documentation: Cold Lake South Continuous Monitoring Station General Site Information Item Description Site ID (CASA ID) LICA01 Station Name Cold Lake South Continuous Monitoring Station
About this document. This document contains screenshots of software available from Cheresources.com. You can find this title in our online store at:
 About this document This document contains screenshots of software available from Cheresources.com. You can find this title in our online store at: http://www.cheresources.com/cheplusstore/catalogue.php
Topsøe Catalysis Forum 2009
 Mercury Behaviour in Combustion Flue Gases Topsøe Catalysis Forum 9 Munkerupgaard 7 th -8 th of August 9 Dr. Harald Thorwarth Energie braucht Impulse Introduction clean gas Cr Co Ni Cd As Cu Pb Hg Input
Reflectec Thermal Fabric & Reflectec Fiberboard
 MODIFIED ASTM E 1354 CONE CALORIMETER THERMAL RESPONSE TEST (Final Report) TEST REPORT Reflectec Thermal Fabric & Reflectec Fiberboard Project No. 16723-113972 April 22, 2003 Prepared for: John W. Mallette
Applied Fluid Mechanics
 Applied Fluid Mechanics 1. The Nature of Fluid and the Study of Fluid Mechanics 2. Viscosity of Fluid 3. Pressure Measurement 4. Forces Due to Static Fluid 5. Buoyancy and Stability 6. Flow of Fluid and
Convert cubic inches to cubic feet: Cubic inches 1728 (12 x 12 x12 = 1728)
") Interior Volume of the Kiln: Sprung or Roman Arch: 12.5 CF = W x L x ( H Side wall + 2/3 of the arch rise) 37.5 Test kiln=? 31.5 Convert cubic inches to cubic feet: Cubic inches 1728 (12 x 12 x12 = 1728)
Interior Volume of the Kiln: Sprung or Roman Arch: 12.5 CF = W x L x ( H Side wall + 2/3 of the arch rise) 37.5 Test kiln=? 31.5 Convert cubic inches to cubic feet: Cubic inches 1728 (12 x 12 x12 = 1728)
C (s) + O 2 (g) CO 2 (g) S (s) + O 2 (g) SO 2 (g)
 + O 2 (g) CO 2 (g) S (s) + O 2 (g) SO 2 (g)") Combustion The rapid combination of oxygen with a substance. A major type of chemical reaction. When elemental carbon or carbon-containing compounds burn in air, oxygen combines with the carbon to form
Combustion The rapid combination of oxygen with a substance. A major type of chemical reaction. When elemental carbon or carbon-containing compounds burn in air, oxygen combines with the carbon to form
The Claviature of Gas Analysis
 The Claviature of Gas Analysis Mass spectrometric gas analysis for quality assurance of gases and gas mixtures High purity and special gases are becoming increasingly important in the development of modern
Applied Fluid Mechanics
 Applied Fluid Mechanics 1. The Nature of Fluid and the Study of Fluid Mechanics 2. Viscosity of Fluid 3. Pressure Measurement 4. Forces Due to Static Fluid 5. Buoyancy and Stability 6. Flow of Fluid and
TI 226H Calibration of Flow Check Devices using Positive Displacement Flow Meter
 Page 1 of 9 TI 226H Calibration of Flow Check Devices using Positive Displacement Flow Meter TABLE OF CONTENTS 1. PURPOSE AND APPLICABILITY... 2 2. RESPONSIBILITIES... 2 2.1. Field Specialist... 2 2.2.
DUST CONTROL PLAN. Rawhide Energy Station 2700 East County Road 82 Wellington, Colorado 80549
 DUST CONTROL PLAN 2700 East County Road 82 Wellington, Colorado 80549 November 2015 REVISION HISTORY Revision Revision Section Summary of Revisions Number Date Revised 0 10/19/2015 Initial plan developed
SSi Super Systems Inc.
 Model DPC2530 Continuous Digital Dew Point Analyzer For measurement of: Endothermic Atmosphere Exothermic Atmosphere Nitrogen / Hydrogen Atmosphere Plant Air Systems SPECIFICATIONS Measurement Range: -50
EXECUTIVE SUMMARY. especially in last 50 years. Industries, especially power industry, are the large anthropogenic
 EXECUTIVE SUMMARY Introduction The concentration of CO 2 in atmosphere has increased considerably in last 100 years, especially in last 50 years. Industries, especially power industry, are the large anthropogenic
Humidity Calibration Solutions
 Instruments Humidity Solutions www.michell.com Instruments Humidity Solutions The Importance of Regular The reliable operation of a hygrometer and indeed any measuring instrument, can only be verified
DM70 Hand-Held Dewpoint Meter for Spot-Checking Applications
 DM70 Hand-Held Dewpoint Meter for Spot-Checking Applications The Vaisala DRYCAP Hand-Held Dewpoint Meter DM70 offers accurate and fast measurement for industrial dewpoint applications, such as compressed
Meteorological QA/QC
 Meteorological QA/QC Howard Schmidt, MS, MBA US EPA Region 3 Air Protection Division Air Monitoring Quality Assurance Workshop June 26, 2014 Overview Current state of R3 agency met monitoring Why? Where?
Certificate: / 29 April 2014
 Test report: 936/21218896/A of 20 September 2013 Initial certification: 01 April 2014 Date of expiry: 31 March 2019 Publication: BAnz AT 01 April 2014 B12, chapter IV, No. 5.1 Approved application The
Method 323 Measurement of Formaldehyde Emissions From Natural Gas-Fired Stationary Sources Acetyl Acetone Derivitization Method
 While we have taken steps to ensure the accuracy of this Internet version of the document, it is not the official version. Please refer to the official version in the FR publication, which appears on the
Solar Flat Plate Thermal Collector
 Solar Flat Plate Thermal Collector INTRODUCTION: Solar heater is one of the simplest and basic technologies in the solar energy field. Collector is the heart of any solar heating system. It absorbs and
FUNDAMENTAL STUDIES OF THE CATALYTIC IGNITION PROCESS
 FUNDAMENTAL STUDIES OF THE CATALYTIC IGNITION PROCESS Final Report KLK411 N08-03 National Institute for Advanced Transportation Technology University of Idaho Robert Lounsbury; Katrina Leichliter; and
FVBSS fixed volume bottle
 N FVBSS fixed volume bottle Sampling System The SENSOR Fixed Volume Bottle Sampling System (FVBSS) provides a repeatable fixed volume of sample during each sampling process without stopping flow of the
Controlled Environment Testing Report
 Client: Controlled Environment Testing Report Services Conducted: Product Testing Project Contact: Stefan Hocom Project Manager: Stefan E. Hocom 323 Spreckels Drive, Ste. B Aptos, CA 95003 The final approval
Wet FGD Chemistry and Performance Factors
 Wet FGD Chemistry and Performance Factors Gordon Maller URS Corporation Presented at: 2008 Power Gen Conference December 1, 2008 Presentation Outline FGD Chemistry Overview Effect of Key Process Variables
Analysis for Natural Gas and Similar Gaseous Mixtures by Gas Chromatography
 GPA Standard 2261-13 Analysis for Natural Gas and Similar Gaseous Mixtures by Gas Chromatography Adopted as Tentative Standard, 1961 Revised and Adopted as a Standard, 1964 Revised 1972, 1986, 1989, 1990,
2012 Parts Catalog Phone (919) URG
 URG") 2012 Parts Catalog Phone (919)942-2753 www.urgcorp.com 5 URG Air Samplers Ambient Ion Monitor Time Resolved Direct Measurement of Nitrate, Sulfate and Ammonium State-of-the-Art Sampler with the Ability
2012 Parts Catalog Phone (919)942-2753 www.urgcorp.com 5 URG Air Samplers Ambient Ion Monitor Time Resolved Direct Measurement of Nitrate, Sulfate and Ammonium State-of-the-Art Sampler with the Ability
Hydrated Lime for HCl Mitigation Benefits of High Reactivity Hydrate
 Hydrated Lime for HCl Mitigation Benefits of High Reactivity Hydrate July 18, 2013 Utility Focus - Support of Technical Advancement Support of key industry events WPCA member Sponsor of 2013 APC Conference
RECORD AND ANALYSE THE PRESSURE-ENTHALPY DIAGRAM FOR A COMPRESSION HEAT PUMP
 Thermodynamics Heat cycles Heat Pump RECORD AND ANALYSE THE PRESSURE-ENTHALPY DIAGRAM FOR A COMPRESSION HEAT PUMP Demonstrate how an electric compression heat pump works Quantitatively investigate of the
Introduction to Gas Phase FTIR Spectroscopy
 Introduction to Gas Phase FTIR Spectroscopy Introduction to FTIR spectroscopy FTIR stands for Fourier transform infrared, the preferred method of infrared spectroscopy. In infrared (IR) spectroscopy, radiation
PREVIEW COPY. Generating Steam in the Power Plant. Table of Contents. Transforming Energy Into Work...3. Combustion and How It Works...
 Generating Steam in the Power Plant Table of Contents Lesson One Lesson Two Lesson Three Lesson Four Lesson Five Transforming Energy Into Work...3 Boiler Operation...19 Boiler Maintenance...37 Combustion
Overview of the Thunderbird Micronet
 Fall 2004 Dr. Petra Klein Sean Arms Overview of the Thunderbird Micronet Introduction The Lake Thunderbird Micronet is a micrometeorological measurement network intended to obtain data on fine-scale spatial
Be prepared to discuss the quantitative comparison method in the oral exam.
 Subject: Ring Experiment III 8 Shell and Tube Heat Exchanger Control The shell and Tube Heat Exchanger has two control valves: one on the process fluid flowing to the tubes and one on the cooling water
Public Outreach Meeting. Proposed Revision of Onshore Orders 3, 4, and 5
 Public Outreach Meeting Proposed Revision of Onshore Orders 3, 4, and 5 December 1st, 3rd, and 8th, 2015 Outline Why are these regulations important? Why are we revising these Orders? Changes proposed
Development of an organometallic flow chemistry. reaction at pilot plant scale for the manufacture of
 Supporting Information Development of an organometallic flow chemistry reaction at pilot plant scale for the manufacture of verubecestat David A. Thaisrivongs*, John R. Naber*, Nicholas J. Rogus, and Glenn
UV3000. Accurate, precise, and portable ambient gas point analyzer
 UV3000 Accurate, precise, and portable ambient gas point analyzer The Cerex UV3000 is a multifunction analyzer designed to detect part per billion (ppb) to percent level concentrations of multiple gases
FTIR measurement of NH 3, HCN, SO 2, H 2 S and COS in pulverized lignite oxy-fuel flames Daniel Fleig, Stefan Hjärtstam and Daniel Kühnemuth
 FTIR measurement of NH 3, HCN, SO 2, H 2 S and COS in pulverized lignite oxy-fuel flames Daniel Fleig, Stefan Hjärtstam and Daniel Kühnemuth Abstract Nitrogen and sulphur compounds are investigated in
TCEQ Directed Assistance Module (DAM) No. 5: Understanding and Controlling the Chloramination Process
 No. 5: Understanding and Controlling the Chloramination Process") TCEQ Directed Assistance Module (DAM) No. 5: Understanding and Controlling the Chloramination Process Presented at the West Harris County Regional Water Authority Chloramines 101 Workshop July 10, 2008
TCEQ Directed Assistance Module (DAM) No. 5: Understanding and Controlling the Chloramination Process Presented at the West Harris County Regional Water Authority Chloramines 101 Workshop July 10, 2008
NON-METHANE ORGANIC CARBON ANALYZER (NMOC Method 25)
") Gas Chromatography NON-METHANE ORGANIC CARBON ANALYZER (NMOC Method 25) The Non-Methane Organic Compounds (NMOC) Analyzer is a gas chromatograph configured for analyzing gaseous samples for total organic
Gas Chromatography NON-METHANE ORGANIC CARBON ANALYZER (NMOC Method 25) The Non-Methane Organic Compounds (NMOC) Analyzer is a gas chromatograph configured for analyzing gaseous samples for total organic
Carbon (Organic, and Inorganic)
") DATE: January 2011 Carbon (Organic, and Inorganic) 1. Application This method covers the determination of total organic carbon (TOC), and inorganic carbon (IC) concentrations in soil, plant tissues and
DATE: January 2011 Carbon (Organic, and Inorganic) 1. Application This method covers the determination of total organic carbon (TOC), and inorganic carbon (IC) concentrations in soil, plant tissues and
Worldwide Pollution Control Association
 Worldwide Pollution Control Association WPCA- Southern Company Mercury Seminar October 30-31, 2012 All presentations posted on this website are copyrighted by the Worldwide Pollution Control Association
DESIGN AND CONSTRUCTION OF A WATER TUNNEL. Stephen C. Ko
 i DESGN AND CONSTRUCTON OF A WATER TUNNEL By Stephen C. Ko This work has been carried out as a part of a grant from the National Science Foundation for the development of fluid mechanics laboratory equipments
Turbine Meter TRZ 03 PRODUCT INFORMATION. Reliable Measurement of Gas
 Turbine Meter TRZ 0 PRODUCT INFORMATION Reliable Measurement of Gas TURBINE METER TRZ 0 Method of operation, Construction Method of operation The TRZ 0 turbine meter is a flow meter suitable for gas measurement
TEST METHOD FOR STILL- AND FORCED-AIR JUNCTION-TO- AMBIENT THERMAL RESISTANCE MEASUREMENTS OF INTEGRATED CIRCUIT PACKAGES
 SEMI G38-0996 N/A SEMI 1987, 1996 TEST METHOD FOR STILL- AND FORCED-AIR JUNCTION-TO- AMBIENT THERMAL RESISTANCE MEASUREMENTS OF INTEGRATED CIRCUIT PACKAGES 1 Purpose The purpose of this test is to determine
Standard Operating Procedure for the Analysis of Dissolved Inorganic Carbon CCAL 21A.1
 Standard Operating Procedure for the Analysis of Dissolved Inorganic Carbon CCAL 21A.1 Cooperative Chemical Analytical Laboratory College of Forestry Oregon State University 321 Richardson Hall Corvallis,
CHLORINE RECOVERY FROM HYDROGEN CHLORIDE
 CHLORINE RECOVERY FROM HYDROGEN CHLORIDE The Project A plant is to be designed for the production of 10,000 metric tons per year of chlorine by the catalytic oxidation of HCl gas. Materials Available 1.
AE 3051, Lab #16. Investigation of the Ideal Gas State Equation. By: George P. Burdell. Group E3
 AE 3051, Lab #16 Investigation of the Ideal Gas State Equation By: George P. Burdell Group E3 Summer Semester 000 Abstract The validity of the ideal gas equation of state was experimentally tested for
Technical Data Sheet DPT & DPIT-4005 SERIES DIFFERENTIAL PRESSURE TRANSDUCERS. Features. Description
 Technical Data Sheet DPT & DPIT-4005 SERIES DIFFERENTIAL PRESSURE TRANSDUCERS Description The 4005 series of differential pressure transducers include Models DPT-4005 and DPIT-4005-M. The 4005 series differential
Table of Contents. Chapter: Atmosphere. Section 1: Earth's Atmosphere. Section 2: Energy Transfer in the Atmosphere. Section 3: Air Movement
 Table of Contents Chapter: Atmosphere Section 1: Earth's Atmosphere Section 2: Energy Transfer in the Atmosphere Section 3: Air Movement Table of Contents Chapter: Atmosphere Section 2: Energy Transfer