Geog183: Cartographic Design and Geovisualization Spring Quarter 2018 Lecture 11: Dasymetric and isarithmic mapping
|
|
|
- Philip Garrett
- 6 years ago
- Views:
Transcription


1 Geog183: Cartographic Design and Geovisualization Spring Quarter 2018 Lecture 11: Dasymetric and isarithmic mapping
2 Discrete vs. continuous revisited Choropleth suited to discrete areal, but suffers from MAUP unless standardized Dots can work for discrete points, but can be ineffective Dasymetric mapping allows discrete data to be supplemented with additional information about distributions Isarithmic methods work for continuous field variables, and are mostly derived from terrain mapping Isarithmic mapping often abused, on web commonly called heat mapping

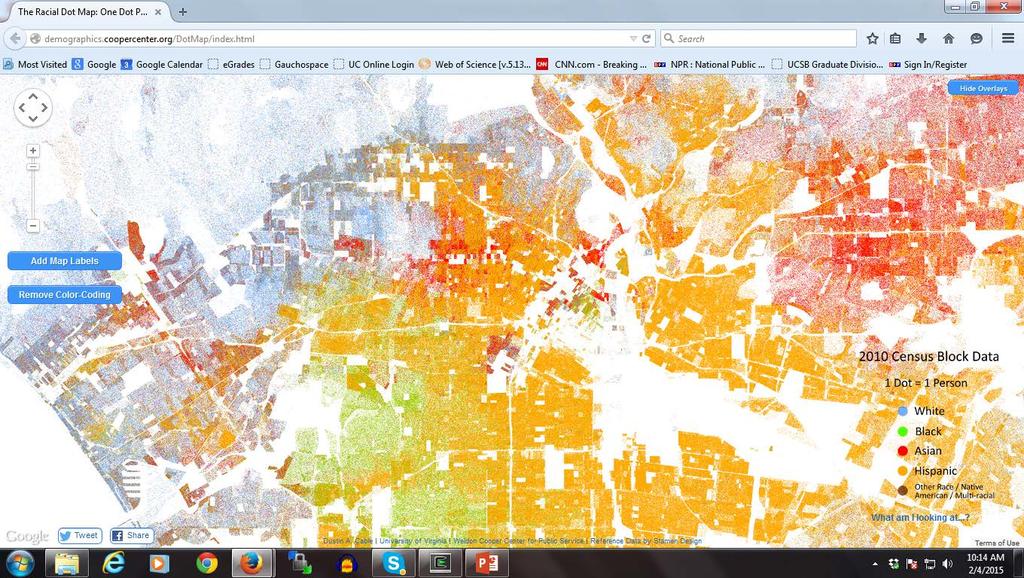
3 Dot mapping
4
5

6

7

8

9 Dasymetric: Note the blank areas Overlay land use and other data Move dots to where they are most likely to reside Can compute quantities from proportions in overlay Example of data fusion
10
11 Dasymetric Method of thematic mapping, which uses areal symbols to spatially classify volumetric data Developed and named in 1911 by Benjamin Petrovich Semenov-Tyan- Shansky Popularized by J.K. Wright in a 1936 map of Cape Cod Cartographers use dasymetric mapping for population density over other methods because of its ability to realistically place data over geography Now possible to use land use, imagery, many other information sources

12 J. K. Wright Geographical Review 1936
13 Start with the counts for the choropleth map Adjust each area using land use to exclude areas that are uninhabited Adjust the remaining area and recompute the density Remap densities within each land use class, e.g. urban, rural

14 Adjustments to density
15 Overlapping zones

16 Landscan: Global Population (Eastview)

17

18 Landscan Data Sources Census Administrative boundaries Land cover Elevation and slope Coastlines Imagery Nighttime lights

19 NASA: Global Rural-Urban Mapping Project Distributed via CEISIN:

20

21
 Generating and mapping population density surfaces within a geographical")
22 Langford, M. and Unwin, D. (1994) Generating and mapping population density surfaces within a geographical information system. The Cartographic Journal. 31,

23 Software Use standard map overlay, e.g. in ArcGIS Using imagery: ecognition Schneider s code in R at UCSB Mashups

24 USGS Western Mapping Center Plans to update tool for ArcGIS 10

25 Astoria, Oregon Rachel Sleeter and Michael Gould
26 Isarithmic mapping Includes contour maps Any map showing lines joining points of equal value Can shade or use colors for areas between lines Can use many terrain-based methods, such as shading Based on assumption of continuity When data at points (or area centroids) are used, need to use interpolation Interpolation methods and models are many Longley et al. Contrast interpolation and kernel density function Can use optimal interpolation, e.g. kriging


27 Isarithmic maps using isopleths
28 Planar Map Transformations on Points - Centroids Multiple point or line or area to be transformed to single point Point can be "real" or representative Can use weightings or populations Mean center simple to compute but may fall outside point cluster or polygon Can use point-in-polygon to test for inclusion
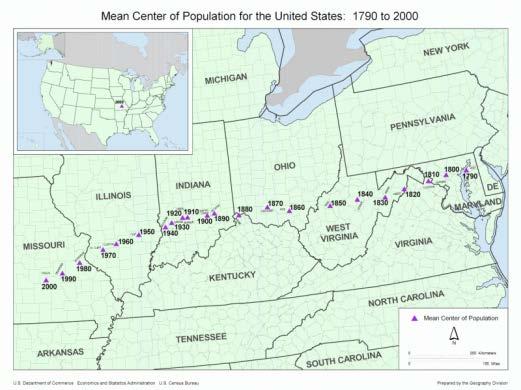
29


30 Mean point vs. centroid

31 The interpolation problem

32 Southern California
33 Interpolation to a Grid Given a set of point elevations (x, y, z) generate a new set of points at the nodes of a regular grid so that the interpolated surface is a reasonable representation of the surface sampled by the points. Imposes a model of the true surface on the sample "Model" is a mathematical model of the neighborhood relationship Influence of a single point = f(1/d) Can be constrained to fit all points Should contain z extremes, and local extrema Most models are algorithmic local operators Work cell-to-cell. Operative cell = kernel


34 Smooth and Abrupt landscapes: Surface derivative

35 Regular vs. Irregular Point Distribution
36 Aligned Sparse Dense Missing from edges

37 Planar Map Transformations Based on Areas - Theissen Polygons Often called proximal regions or Voronoi diagrams Often used for contouring terrain, climate, interpolation, etc cneel/pointsetreconstruction.html


38 Kernel density maps Image source: Jochen Albrecht
39 Weighting Methods Impose z = f (1/d^n) Computationally rather intensive e.g. 200 x 200 cells 1000 points = 40 x 10^6 distance calculations If all points are used and sorted by distance, called "brute force" method Possible to use sorted search and tiling (Hodgson, ERDAS) Distance can be weighted and powered by n = friction of distance Can be refined with break lines Use cos (angle) to prevent shadowing
40 Inverse Distance Weighting Z=height D=distance P=1.R n=?
41 Search Patterns Many possible ways to define interpolated "region" R Can use # points or distance Problems in Sparse areas Dense areas Edges Bias can be reduced by changing search strategy

42 Search patterns
43 Kriging "Optimal interpolation method" by D.G. Krige Origin in geology (geostatistics, gold mining) Spatial variation = f(drift, random-correlated, random noise) To use Kriging Model and extract drift Compute variogram Model variogram Compute expected variance at d, and so best estimate of local mean Several alternative methods Universal Kriging best when local trends are well defined Kriging produces best estimate and estimate of variance at all places on map
44 Variogram


45 Algorithm matters: IDW (5) vs. Splines (12, 0.1)

46 Interpolation methods
47 Summary Discrete vs. continuous (Choropleth, Dasymetric, Isarithmic) Dots useful, but aggregate Dasymetric mapping effective, good data not so good software Isarithmic maps; many symbolization methods to choose among Conversion to surface an issue: points, density, model Interpolation a problem: heuristics vs optimal methods Must assume surface model, search pattern, neighborhood and method
Geog183: Cartographic Design and Geovisualization Winter Quarter 2017 Lecture 6: Map types and Data types
 Geog183: Cartographic Design and Geovisualization Winter Quarter 2017 Lecture 6: Map types and Data types Data types Data dimension: Point, Line, Area, Volume (Text) Data continuity: Discrete, Point, Polygon:
Spatial Analysis II. Spatial data analysis Spatial analysis and inference
 Spatial Analysis II Spatial data analysis Spatial analysis and inference Roadmap Spatial Analysis I Outline: What is spatial analysis? Spatial Joins Step 1: Analysis of attributes Step 2: Preparing for
GEOGRAPHY 350/550 Final Exam Fall 2005 NAME:
 1) A GIS data model using an array of cells to store spatial data is termed: a) Topology b) Vector c) Object d) Raster 2) Metadata a) Usually includes map projection, scale, data types and origin, resolution
Lecture 5 Geostatistics
 Lecture 5 Geostatistics Lecture Outline Spatial Estimation Spatial Interpolation Spatial Prediction Sampling Spatial Interpolation Methods Spatial Prediction Methods Interpolating Raster Surfaces with
POPULAR CARTOGRAPHIC AREAL INTERPOLATION METHODS VIEWED FROM A GEOSTATISTICAL PERSPECTIVE
 CO-282 POPULAR CARTOGRAPHIC AREAL INTERPOLATION METHODS VIEWED FROM A GEOSTATISTICAL PERSPECTIVE KYRIAKIDIS P. University of California Santa Barbara, MYTILENE, GREECE ABSTRACT Cartographic areal interpolation
Spatial analysis. 0 move the objects and the results change
 0 Outline: Roadmap 0 What is spatial analysis? 0 Transformations 0 Introduction to spatial interpolation 0 Classification of spatial interpolation methods 0 Interpolation methods 0 Areal interpolation
ENGRG Introduction to GIS
 ENGRG 59910 Introduction to GIS Michael Piasecki October 13, 2017 Lecture 06: Spatial Analysis Outline Today Concepts What is spatial interpolation Why is necessary Sample of interpolation (size and pattern)
Deriving Spatially Refined Consistent Small Area Estimates over Time Using Cadastral Data
 Deriving Spatially Refined Consistent Small Area Estimates over Time Using Cadastral Data H. Zoraghein 1,*, S. Leyk 1, M. Ruther 2, B. P. Buttenfield 1 1 Department of Geography, University of Colorado,
Lecture 8. Spatial Estimation
 Lecture 8 Spatial Estimation Lecture Outline Spatial Estimation Spatial Interpolation Spatial Prediction Sampling Spatial Interpolation Methods Spatial Prediction Methods Interpolating Raster Surfaces
Overview of Statistical Analysis of Spatial Data
 Overview of Statistical Analysis of Spatial Data Geog 2C Introduction to Spatial Data Analysis Phaedon C. Kyriakidis www.geog.ucsb.edu/ phaedon Department of Geography University of California Santa Barbara
Improving Spatial Data Interoperability
 Improving Spatial Data Interoperability A Framework for Geostatistical Support-To To-Support Interpolation Michael F. Goodchild, Phaedon C. Kyriakidis, Philipp Schneider, Matt Rice, Qingfeng Guan, Jordan
Dasymetric Mapping for Disaggregating Coarse Resolution Population Data
 Dasymetric Mapping for Disaggregating Coarse Resolution Population Data Jeremy Mennis and Torrin Hultgren Department of Geography and Urban Studies, Temple University Department of Geography, University
What should you consider concerning colors in maps in order to illustrate qualitative data, and quantitative data, respectively? Exemplify.
 1, Cartography, 10 p (HA) _ When doing a map based on quantitative data you have for example to decide upon the classification. Three common classifications are Equal interval, Quantiles (percentiles)
Spatial analysis. Spatial descriptive analysis. Spatial inferential analysis:
 Spatial analysis Spatial descriptive analysis Point pattern analysis (minimum bounding box, mean center, weighted mean center, standard distance, nearest neighbor analysis) Spatial clustering analysis
Overview key concepts and terms (based on the textbook Chang 2006 and the practical manual)
") Introduction Geo-information Science (GRS-10306) Overview key concepts and terms (based on the textbook 2006 and the practical manual) Introduction Chapter 1 Geographic information system (GIS) Geographically
Introduction Geo-information Science (GRS-10306) Overview key concepts and terms (based on the textbook 2006 and the practical manual) Introduction Chapter 1 Geographic information system (GIS) Geographically
Chapter 7: Making Maps with GIS. 7.1 The Parts of a Map 7.2 Choosing a Map Type 7.3 Designing the Map
 Chapter 7: Making Maps with GIS 7.1 The Parts of a Map 7.2 Choosing a Map Type 7.3 Designing the Map What is a map? A graphic depiction of all or part of a geographic realm in which the real-world features
Areal Interpolation Methods using Land Cover and Street Data. Jeff Bourdier GIS Master s s Project Summer 2006
 Areal Interpolation Methods using Land Cover and Street Data Jeff Bourdier GIS Master s s Project Summer 2006 Objective The areal interpolation problem Some variable (here, population) is known in a given
Summary thematic point techniques
 Summary thematic point techniques Dot maps Graduated symbols Bar linear (1D) proportional symbol Circle 2D proportional symbol (and other shapes) Range graded symbols classed by size Segmented symbols
CHAPTER 9 DATA DISPLAY AND CARTOGRAPHY
 CHAPTER 9 DATA DISPLAY AND CARTOGRAPHY 9.1 Cartographic Representation 9.1.1 Spatial Features and Map Symbols 9.1.2 Use of Color 9.1.3 Data Classification 9.1.4 Generalization Box 9.1 Representations 9.2
SPATIAL ANALYSIS. Transformation. Cartogram Central. 14 & 15. Query, Measurement, Transformation, Descriptive Summary, Design, and Inference
 14 & 15. Query, Measurement, Transformation, Descriptive Summary, Design, and Inference Geographic Information Systems and Science SECOND EDITION Paul A. Longley, Michael F. Goodchild, David J. Maguire,
Lecture 10 Mapping Quantities: Dot Density Maps
 Lecture 10 Mapping Quantities: Dot Density Maps Introduction Creating maps of features based on quantity are some of the most common and important types of maps. In order to create maps that show quantity
Luc Anselin Spatial Analysis Laboratory Dept. Agricultural and Consumer Economics University of Illinois, Urbana-Champaign
 GIS and Spatial Analysis Luc Anselin Spatial Analysis Laboratory Dept. Agricultural and Consumer Economics University of Illinois, Urbana-Champaign http://sal.agecon.uiuc.edu Outline GIS and Spatial Analysis
Introduction to GIS I
 Introduction to GIS Introduction How to answer geographical questions such as follows: What is the population of a particular city? What are the characteristics of the soils in a particular land parcel?
Spatial Analyst. By Sumita Rai
 ArcGIS Extentions Spatial Analyst By Sumita Rai Overview What does GIS do? How does GIS work data models Extension to GIS Spatial Analyst Spatial Analyst Tasks & Tools Surface Analysis Surface Creation
SPATIAL ANALYSIS OF STATISTICS (WITH SPECIAL REFERENCE TO QATAR CENSUS 2010)
") SPATIAL ANALYSIS OF STATISTICS (WITH SPECIAL REFERENCE TO QATAR CENSUS 2010) Mohamad Saoud Al Boainain Ministry of Development Planning & Statistics State of Qatar Spatial Analysis of Statistics Overview
SPATIAL ANALYSIS OF STATISTICS (WITH SPECIAL REFERENCE TO QATAR CENSUS 2010) Mohamad Saoud Al Boainain Ministry of Development Planning & Statistics State of Qatar Spatial Analysis of Statistics Overview
Spatial Analysis and Modeling (GIST 4302/5302) Guofeng Cao Department of Geosciences Texas Tech University
 Guofeng Cao Department of Geosciences Texas Tech University") Spatial Analysis and Modeling (GIST 4302/5302) Guofeng Cao Department of Geosciences Texas Tech University TTU Graduate Certificate Geographic Information Science and Technology (GIST) 3 Core Courses and
Spatial Analysis and Modeling (GIST 4302/5302) Guofeng Cao Department of Geosciences Texas Tech University TTU Graduate Certificate Geographic Information Science and Technology (GIST) 3 Core Courses and
Gridding of precipitation and air temperature observations in Belgium. Michel Journée Royal Meteorological Institute of Belgium (RMI)
") Gridding of precipitation and air temperature observations in Belgium Michel Journée Royal Meteorological Institute of Belgium (RMI) Gridding of meteorological data A variety of hydrologic, ecological,
Gridding of precipitation and air temperature observations in Belgium Michel Journée Royal Meteorological Institute of Belgium (RMI) Gridding of meteorological data A variety of hydrologic, ecological,
Representation of Geographic Data
 GIS 5210 Week 2 The Nature of Spatial Variation Three principles of the nature of spatial variation: proximity effects are key to understanding spatial variation issues of geographic scale and level of
Interpolating Raster Surfaces
 Interpolating Raster Surfaces You can use interpolation to model the surface of a feature or a phenomenon all you need are sample points, an interpolation method, and an understanding of the feature or
Intro to GIS Summer 2012 Data Visualization
 Intro to GIS Summer 2012 Data Visualization UNDERSTANDING YOUR MAP DATA Qualitative vs. Quantitative Data Qualitative Data classified by category e.g. Soil types, Animal Species Quantitative Data grouped
Identifying Residential Land in Rural Areas to Improve Dasymetric Mapping
 Identifying Residential Land in Rural Areas to Improve Dasymetric Mapping Stefan Leyk*, Matthew Ruther*, Barbara P. Buttenfield*, Nicholas N. Nagle** and Alexander K. Stum* * Geography Department, University
Department of Geography, University of Connecticut, Storrs, CT, USA. Online publication date: 28 March 2011 PLEASE SCROLL DOWN FOR ARTICLE
 This article was downloaded by: [University of Connecticut] On: 28 March 2011 Access details: Access Details: [subscription number 784375807] Publisher Taylor & Francis Informa Ltd Registered in England
ENVIRONMENTAL VULNERABILITY INDICATORS OF THE COASTAL SLOPES OF SÃO PAULO, BRAZIL *
 ENVIRONMENTAL VULNERABILITY INDICATORS OF THE COASTAL SLOPES OF SÃO PAULO, BRAZIL * D ANTONA, Álvaro de O. (FCA, NEPO-Unicamp, Brazil) BUENO, Maria do Carmo D. (IBGE; IFCH-Unicamp, Brazil) IWAMA, Allan
Geog 469 GIS Workshop. Data Analysis
 Geog 469 GIS Workshop Data Analysis Outline 1. What kinds of need-to-know questions can be addressed using GIS data analysis? 2. What is a typology of GIS operations? 3. What kinds of operations are useful
Concepts and Applications of Kriging
 2013 Esri International User Conference July 8 12, 2013 San Diego, California Technical Workshop Concepts and Applications of Kriging Eric Krause Konstantin Krivoruchko Outline Intro to interpolation Exploratory
MODELING DAYTIME AND NIGHTTIME POPULATION DISTRIBUTIONS IN PORTUGAL USING GEOGRAPHIC INFORMATION SYSTEMS. C2007 Sérgio Manuel Carneiro Freire
 MODELING DAYTIME AND NIGHTTIME POPULATION DISTRIBUTIONS IN PORTUGAL USING GEOGRAPHIC INFORMATION SYSTEMS BY C2007 Sérgio Manuel Carneiro Freire Submitted to the graduate degree program in Geography and
An Introduction to Geographic Information System
 An Introduction to Geographic Information System PROF. Dr. Yuji MURAYAMA Khun Kyaw Aung Hein 1 July 21,2010 GIS: A Formal Definition A system for capturing, storing, checking, Integrating, manipulating,
Making Maps With GIS. Making Maps With GIS
 Making Maps With GIS Getting Started with GIS Chapter 7 Making Maps With GIS 7.1 The Parts of a Map 7.2 Choosing a Map Type 7.3 Designing the Map 1 What is a map? Map is the communication tool for the
Class 9. Query, Measurement & Transformation; Spatial Buffers; Descriptive Summary, Design & Inference
 Class 9 Query, Measurement & Transformation; Spatial Buffers; Descriptive Summary, Design & Inference Spatial Analysis Turns raw data into useful information by adding greater informative content and value
GED 554 IT & GIS. Lecture 6 Exercise 5. May 10, 2013
 GED 554 IT & GIS Lecture 6 Exercise 5 May 10, 2013 Free GIS data sources ******************* Mapping numerical data & Symbolization ******************* Exercise: Making maps for presentation GIS DATA SOFTWARE
Gridded population data for the UK redistribution models and applications
 Gridded population data for the UK redistribution models and applications David Martin 1 1 School of Geography, University of Southampton, Southampton, SO17 1BJ, UK e- mail: D.J.Martin@soton.ac.uk Abstract
Intro to GIS In Review
 Intro to GIS In Review GIS Analysis Winter 2016 GIS A quarter in review Geographic data types Acquiring GIS data Projections / Coordinate systems Working with attribute tables Data classification Map design
GIST 4302/5302: Spatial Analysis and Modeling
 GIST 4302/5302: Spatial Analysis and Modeling Review Guofeng Cao www.gis.ttu.edu/starlab Department of Geosciences Texas Tech University guofeng.cao@ttu.edu Spring 2016 Course Outlines Spatial Point Pattern
A GEOSTATISTICAL APPROACH TO PREDICTING A PHYSICAL VARIABLE THROUGH A CONTINUOUS SURFACE
 Katherine E. Williams University of Denver GEOG3010 Geogrpahic Information Analysis April 28, 2011 A GEOSTATISTICAL APPROACH TO PREDICTING A PHYSICAL VARIABLE THROUGH A CONTINUOUS SURFACE Overview Data
Chapter 02 Maps. Multiple Choice Questions
 Chapter 02 Maps Multiple Choice Questions 1. Every projection has some degree of distortion because A. a curved surface cannot be represented on a flat surface without distortion. B. parallels and meridians
Geographic Systems and Analysis
 Geographic Systems and Analysis New York University Robert F. Wagner Graduate School of Public Service Instructor Stephanie Rosoff Contact: stephanie.rosoff@nyu.edu Office hours: Mondays by appointment
Display and analysis of weather data from NCDC using ArcGIS
 Display and analysis of weather data from NCDC using ArcGIS Helen M. Cox Associate Professor Geography Department California State University, Northridge and Stephen Krug Graduate Student Geography Department
Chapter 6. Fundamentals of GIS-Based Data Analysis for Decision Support. Table 6.1. Spatial Data Transformations by Geospatial Data Types
 Chapter 6 Fundamentals of GIS-Based Data Analysis for Decision Support FROM: Points Lines Polygons Fields Table 6.1. Spatial Data Transformations by Geospatial Data Types TO: Points Lines Polygons Fields
Object Based Imagery Exploration with. Outline
 Object Based Imagery Exploration with Dan Craver Portland State University June 11, 2007 Outline Overview Getting Started Processing and Derivatives Object-oriented classification Literature review Demo
Geog183: Cartographic Design and Geovisualization Spring Quarter 2016 Lecture 15: Dealing with Uncertainty
 Geog183: Cartographic Design and Geovisualization Spring Quarter 2016 Lecture 15: Dealing with Uncertainty All maps are distortions It s not easy to lie with maps, it s essential...to present a useful
A Framework for Interpolating the Population Surface at the Residential-Housing-Unit Level
 A Framework for Interpolating the Population Surface at the Residential-Housing-Unit Level Zhixiao Xie 1 Geosciences Department, Florida Atlantic University, 777 Glades Road, Boca Raton, Florida 33431
Geography 4203 GIS 2: Modeling Applications
 Geography 4203 GIS 2: Modeling Applications Lectures: M/W/F 11-11:50pm, Gugg 6 (KESDA) Labs: M 1-3:50 or F 8-10:50am, Gugg 6 (KESDA) Instructor: Galen Maclaurin TA: Jessie Hong galen.maclaurin@colorado.edu
Concepts and Applications of Kriging. Eric Krause Konstantin Krivoruchko
 Concepts and Applications of Kriging Eric Krause Konstantin Krivoruchko Outline Introduction to interpolation Exploratory spatial data analysis (ESDA) Using the Geostatistical Wizard Validating interpolation
Comparison of rainfall distribution method
 Team 6 Comparison of rainfall distribution method In this section different methods of rainfall distribution are compared. METEO-France is the French meteorological agency, a public administrative institution
GIST 4302/5302: Spatial Analysis and Modeling
 GIST 4302/5302: Spatial Analysis and Modeling Lecture 2: Review of Map Projections and Intro to Spatial Analysis Guofeng Cao http://thestarlab.github.io Department of Geosciences Texas Tech University
GIST 4302/5302: Spatial Analysis and Modeling Lecture 2: Review of Map Projections and Intro to Spatial Analysis
 GIST 4302/5302: Spatial Analysis and Modeling Lecture 2: Review of Map Projections and Intro to Spatial Analysis Guofeng Cao http://www.spatial.ttu.edu Department of Geosciences Texas Tech University guofeng.cao@ttu.edu
LandScan Global Population Database
 LandScan Global Population Database The World s Finest Population Distribution Data Uncommon information. Extraordinary places. LandScan Global Population Database East View Cartographic is now offering
Urban Growth Analysis: Calculating Metrics to Quantify Urban Sprawl
 Urban Growth Analysis: Calculating Metrics to Quantify Urban Sprawl Jason Parent jason.parent@uconn.edu Academic Assistant GIS Analyst Daniel Civco Professor of Geomatics Center for Land Use Education
Workbook Exercises for Statistical Problem Solving in Geography
 Workbook Exercises for Statistical Problem Solving in Geography Arthur J. Lembo, Jr. This workbook is for use with the popular textbook Introduction to Statistical Problem Solving in Geography, and includes
DRAFT RURAL-URBAN POPULATION CHANGE IN PUERTO RICO, 1990 TO 2000
 DRAFT RURAL-URBAN POPULATION CHANGE IN PUERTO RICO, 1990 TO 2000 Mei-Ling Freeman Geographic Standards and Criteria Branch Geography Division US Census Bureau For presentation at the Western Regional Science
Concepts and Applications of Kriging
 Esri International User Conference San Diego, California Technical Workshops July 24, 2012 Concepts and Applications of Kriging Konstantin Krivoruchko Eric Krause Outline Intro to interpolation Exploratory
Geography 360 Principles of Cartography. April 17, 2006
 Geography 360 Principles of Cartography April 17, 2006 Outlines Cartographic design principles Enhancing visual hierarchies on maps Kinds of numerical data and color scheme What is proportional symbol
An Information Model for Maps: Towards Cartographic Production from GIS Databases
 An Information Model for s: Towards Cartographic Production from GIS Databases Aileen Buckley, Ph.D. and Charlie Frye Senior Cartographic Researchers, ESRI Barbara Buttenfield, Ph.D. Professor, University
Assessing the impact of seasonal population fluctuation on regional flood risk management
 Assessing the impact of seasonal population fluctuation on regional flood risk management Alan Smith *1, Andy Newing 2, Niall Quinn 3, David Martin 1 and Samantha Cockings 1 1 Geography and Environment,
Michael Harrigan Office hours: Fridays 2:00-4:00pm Holden Hall
 Announcement New Teaching Assistant Michael Harrigan Office hours: Fridays 2:00-4:00pm Holden Hall 209 Email: michael.harrigan@ttu.edu Guofeng Cao, Texas Tech GIST4302/5302, Lecture 2: Review of Map Projection
Lecture 5. Representing Spatial Phenomena. GIS Coordinates Multiple Map Layers. Maps and GIS. Why Use Maps? Putting Maps in GIS
 Lecture 5 Putting Maps in GIS GIS responds to three fundamental questions by automating spatial data: What is where? Why is it there? GIS reveals linkages unevenly distributed social, economic and environmental
Exploring Digital Welfare data using GeoTools and Grids
 Exploring Digital Welfare data using GeoTools and Grids Hodkinson, S.N., Turner, A.G.D. School of Geography, University of Leeds June 20, 2014 Summary As part of the Digital Welfare project [1] a Java
ADVANCE GIS ANALYSIS ON ZONAL URBAN PLAN PROJECT
 Journal of Young Scientist, Volume II, 2014 ISSN 2344-1283; ISSN CD-ROM 2344-1291; ISSN Online 2344-1305; ISSN-L 2344 1283 ADVANCE GIS ANALYSIS ON ZONAL URBAN PLAN PROJECT Andrei-Șerban TOMPEA 1 Scientific
EEOS Spatial Databases and GIS Applications
 EEOS 381 - Spatial Databases and GIS Applications Lecture 7 Spatial Analysis What is Spatial Analysis? The crux of GIS, Real GIS Methods of turning spatial data into usable information Answers questions
Topographic Maps and Landforms Geology Lab
 Topographic Maps and Landforms Geology Lab Ray Rector: Instructor Today s Lab Activities 1) Discussion of Last Week s Lab 2) Lecture on Topo Maps and Elevation Contours 3) Construct Topographic Maps and
DASYMETRIC MAPPING TECHNIQUES FOR THE SAN FRANCISCO BAY REGION, CALIFORNIA
 DASYMETRIC MAPPING TECHNIQUES FOR THE SAN FRANCISCO BAY REGION, CALIFORNIA Rachel Sleeter U.S. Geological Survey Western Geographic Science Center 345 Middlefield Rd. Menlo Park, CA. 94025 rsleeter@usgs.gov
Nature of Spatial Data. Outline. Spatial Is Special
 Nature of Spatial Data Outline Spatial is special Bad news: the pitfalls of spatial data Good news: the potentials of spatial data Spatial Is Special Are spatial data special? Why spatial data require
Space Informatics Lab - University of Cincinnati
 Space Informatics Lab - University of Cincinnati USER GUIDE SocScape V 1.0 September 2014 1. Introduction SocScape (Social Landscape) is a GeoWeb-based tool for exploration of patterns in high resolution
Spatial Analysis with ArcGIS Pro STUDENT EDITION
 Spatial Analysis with ArcGIS Pro STUDENT EDITION Copyright 2018 Esri All rights reserved. Course version 2.0. Version release date November 2018. Printed in the United States of America. The information
Chapter 3 METHODS. The primary goal of this section is to explore different methods in which populations of
 Chapter 3 METHODS 3.0 Data 3.1 Overview and Goals The primary goal of this section is to explore different methods in which populations of urban spaces can be visualized in new ways at various scales.
Concepts and Applications of Kriging. Eric Krause
 Concepts and Applications of Kriging Eric Krause Sessions of note Tuesday ArcGIS Geostatistical Analyst - An Introduction 8:30-9:45 Room 14 A Concepts and Applications of Kriging 10:15-11:30 Room 15 A
The Cadastral-based Expert Dasymetric System (CEDS) for Mapping Population Distribution and Vulnerability in New York City
 for Mapping Population Distribution and Vulnerability in New York City") The Cadastral-based Expert Dasymetric System (CEDS) for Mapping Population Distribution and Vulnerability in New York City Juliana Astrud Maantay Andrew R. Maroko (1) (2) (3) (1) (2) (1) Lehman College,
The Cadastral-based Expert Dasymetric System (CEDS) for Mapping Population Distribution and Vulnerability in New York City Juliana Astrud Maantay Andrew R. Maroko (1) (2) (3) (1) (2) (1) Lehman College,
ArcGIS ArcMap: Making Professional Quality Thematic Maps Charlie Frye, ESRI Redlands Aileen Buckley, ESRI Redlands
 ArcGIS ArcMap: Making Professional Quality Thematic Maps Charlie Frye, ESRI Redlands Aileen Buckley, ESRI Redlands 1 ArcGIS ArcMap: Making Professional Quality Thematic Maps Charlie Frye, ESRI Redlands
Gridded population. redistribution models and applications. David Martin 20 February 2009
 Gridded population data for the UK redistribution models and applications David Martin 20 February 2009 Overview UK gridded data history (brief!) Small area data availability Grid-based modelling responses
COAL EXPLORATION AND GEOSTATISTICS. Moving from the 2003 Guidelines to the 2014 Guidelines for the Estimation and Classification of Coal Resources
 COAL EXPLORATION AND GEOSTATISTICS Moving from the 2003 Guidelines to the 2014 Guidelines for the Estimation and Classification of Coal Resources Britmindo Australia Pty Ltd 35 Bottlebrush Street, Heathwood
An Evaluation of Land Parcel-Weighted Areal Interpolation in Small Area Estimates
 An Evaluation of Land Parcel-Weighted Areal Interpolation in Small Area Estimates Kyle Reese-Cassal Washington State Office of Financial Management Forecasting Division Manuscript prepared for presentation
Report on Kriging in Interpolation
 Tabor Reedy ENVS421 3/12/15 Report on Kriging in Interpolation In this project I explored use of the geostatistical analyst extension and toolbar in the process of creating an interpolated surface through
GIS for ChEs Introduction to Geographic Information Systems
 GIS for ChEs Introduction to Geographic Information Systems AIChE Webinar John Cirucci 1 GIS for ChEs Introduction to Geographic Information Systems What is GIS? Tools and Methods Applications Examples
Gravity and Magnetic Anomalies Compared to Moho Depth throughout the State of Texas
 Gravity and Magnetic Anomalies Compared to Moho Depth throughout the State of Texas Taylor Borgfeldt Introduction My Master s thesis is to improve and create additional crustal seismic velocity models
GIS and Forest Engineering Applications FE 257 Lecture and laboratory, 3 credits
 GIS and Forest Engineering Applications FE 257 Lecture and laboratory, 3 credits Instructor: Michael Wing Associate Professor Forest Engineering, Resources, and Management Oregon State University Crop
8.9 Geographical Information Systems Advantages of GIS
 8.9 Geographical Information Systems A Geographic Information System (GIS) is a computer-based system that is used in input, storage, analysis manipulation, retrieval, and output, of spatial data. These
Snowden Cartography 1 GEOG 315:001 Cartography Thursdays 4:00 6:30PM F375 Fall 2010 Dr. Snowden Course Description
 Snowden Cartography 1 www.drksnowden.com GEOG 315:001 Cartography Thursdays 4:00 6:30PM F375 Fall 2010 Dr. Snowden Course Description Principles and theory of basic map design, layout, and communication.
Statistical Perspectives on Geographic Information Science. Michael F. Goodchild University of California Santa Barbara
 Statistical Perspectives on Geographic Information Science Michael F. Goodchild University of California Santa Barbara Statistical geometry Geometric phenomena subject to chance spatial phenomena emphasis
The Use of GIS in Exploring Settlement Patterns of the Ethnic Groups in Nan, Thailand. Pannee Cheewinsiriwat.
 The Use of GIS in Exploring Settlement Patterns of the Ethnic Groups in Nan, Thailand Pannee Cheewinsiriwat pannee.ch@chula.ac.th Department of Geography, Faculty of Arts, Chulalongkorn University, Bangkok
Introduction to Geographic Information Systems (GIS): Environmental Science Focus
: Environmental Science Focus") Introduction to Geographic Information Systems (GIS): Environmental Science Focus September 9, 2013 We will begin at 9:10 AM. Login info: Username:!cnrguest Password: gocal_bears Instructor: Domain: CAMPUS
Introduction to Geographic Information Systems (GIS): Environmental Science Focus September 9, 2013 We will begin at 9:10 AM. Login info: Username:!cnrguest Password: gocal_bears Instructor: Domain: CAMPUS
High resolution population grid for the entire United States
 High resolution population grid for the entire United States A. Dmowska, T. F. Stepinski Space Informatics Lab, Department of Geography, University of Cincinnati, Cincinnati, OH 45221-0131, USA Telephone:
Types of spatial data. The Nature of Geographic Data. Types of spatial data. Spatial Autocorrelation. Continuous spatial data: geostatistics
 The Nature of Geographic Data Types of spatial data Continuous spatial data: geostatistics Samples may be taken at intervals, but the spatial process is continuous e.g. soil quality Discrete data Irregular:
Raster Data Model. Examples of raster data Remotely sensed imagery (BV, DN) DEM (elevation) DRG (color) Raster Database
 DEM (elevation) DRG (color) Raster Database") Raster Data Model Why use a raster data model? Raster data representations Cell value Measurement, average, majority, significance Cell-based vs. point-based Raster data components Cells, Pixels, Grid
Raster Data Model Why use a raster data model? Raster data representations Cell value Measurement, average, majority, significance Cell-based vs. point-based Raster data components Cells, Pixels, Grid
2.6 Two-dimensional continuous interpolation 3: Kriging - introduction to geostatistics. References - geostatistics. References geostatistics (cntd.
 .6 Two-dimensional continuous interpolation 3: Kriging - introduction to geostatistics Spline interpolation was originally developed or image processing. In GIS, it is mainly used in visualization o spatial
MAPPING POTENTIAL LAND DEGRADATION IN BHUTAN
 MAPPING POTENTIAL LAND DEGRADATION IN BHUTAN Moe Myint, Geoinformatics Consultant Rue du Midi-8, CH-1196, Gland, Switzerland moemyint@bluewin.ch Pema Thinley, GIS Analyst Renewable Natural Resources Research
Terms GIS GPS Vector Data Model Raster Data Model Feature Attribute Table Point Line Polygon Pixel RGB Overlay Function
 FINAL REVIEW FOR GIS (2016) PRACTICAL COMPONENT The first 40 mins of the exam will be open book and will require you to make a map using all the techniques learned over the semester. This map will be e-mailed
Section C: Management of the Built Environment GIS As A Tool: Technical Aspects of Basic GIS
 Section C: Management of the Built Environment GIS As A Tool: Technical Aspects of Basic GIS This lecture covers five topics: 1.Scale, 2.Framework data, 3.Generalisation, 4.Aggregation, 5.Modifiable unit
Introduction To Raster Based GIS Dr. Zhang GISC 1421 Fall 2016, 10/19
 Introduction To Raster Based GIS Dr. Zhang GISC 1421 Fall 2016, 10/19 Model of the course Using and making maps Navigating GIS maps Map design Working with spatial data Geoprocessing Spatial data infrastructure
Spatial Data Analysis in Archaeology Anthropology 589b. Kriging Artifact Density Surfaces in ArcGIS
 Spatial Data Analysis in Archaeology Anthropology 589b Fraser D. Neiman University of Virginia 2.19.07 Spring 2007 Kriging Artifact Density Surfaces in ArcGIS 1. The ingredients. -A data file -- in.dbf
The Nature of Geographic Data
 4 The Nature of Geographic Data OVERVIEW Elaborates on the spatial is special theme Focuses on how phenomena vary across space and the general nature of geographic variation Describes the main principles