Identification of Regional Subcenters Using Spatial Data Analysis for Estimating Traffic Volume
|
|
|
- Tracey Sherman
- 6 years ago
- Views:
Transcription
1 Identification of Regional Subcenters Using Spatial Data Analysis for Estimating Traffic Volume Fang Zhao and Nokil Park Lehman Center for Transportation Research Department of Civil & Env.. Engineering Florida International University Miami, FL
2 Introduction To predict traffic volume, a roadway s function, local land use pattern, and spatial patterns of land use should be considered Significant activity centers such as CBD or population centers influence traffic volume It is difficult to determine urban population and employment centers Previous methods for identifying subcenters require detailed local knowledge
3 Objectives Develop a systematic method to determine activity centers or subcenters Develop regional accessibility measures based on the subcenters identified
4 Background Dividing an area into zones and defining a subcenter as a zone whose measure of employment concentration (gross employment density or employment-population population ratio, with employment) is higher than adjacent zones (McDonald 1987). A contiguous set of zones, each with an employment > 10 employees per acre, and together with a minimum of 10,000 employees (Giuliano( and Small 1991) Population and employment regional centers estimated based on distribution and density maps and three- dimensional surface maps of population and employment at TAZ level, and contour maps generated from the surface map (Zhao and Chung 2001).
5 About This Study Define subcenters based on Moran s s I and LISA GIS tool Replace original accessibility measure with the new one Calibrate regression model using both accessibility measures Compare regression models with different regional subcenters Broward County, FL as the study area - urbanized with about 1.5 million population

6 Study Area
7 Moran Scatter Plot Moran s I reflects the level of the spatial autocorrelation Moran scatterplot helpful to visualize four types of spatial autocorrelation in a quadrant of the scatterplot. Quadrant HH (LL) refers to an observation with high (low) value surrounded by observations with high (low) values Quadrant LH (HL) refers to an observation with low (high) value surrounded by observation with high (low) values
8 Local Indicators of Spatial Association (LISA) LISA statistics (Anselin( 1995) was introduced to assess the significance of spatial autocorrelation LISA indicates the level of spatial autocorrelation at the local scale LISA refers to the local version of Moran s I A positive value for LISA indicates spatial clustering of similar values (can be high or low) A negative value indicates spatial clustering of dissimilar values between a observation and those in its neighborhood.
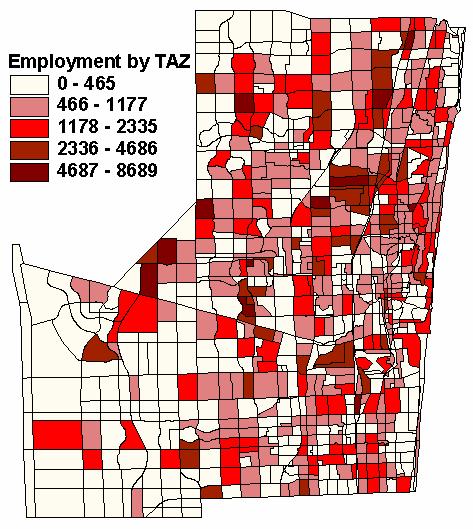
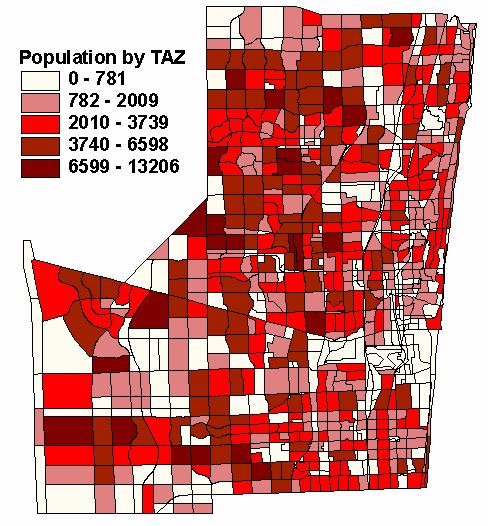
9 Population and Employment Distribution
10 Moran Significance Map and Moran Scatter Plot for Population
11 Moran Significance Map and Moran Scatter Plot for Population Density

12 Moran Significance Map and Moran Scatter Plot for Employment
13 Moran Significance Map and Moran Scatter Plot for Employment Density
14 Processes for Identification of Subcenters 1. Selecte TAZs with significant HH spatial association for both population/employment and population/employment density variables 2. Determined the cut-off value : population/employment of TAZ to include more than 50% of the total population/employment of County 3. Merge the contiguous TAZs that have at least one common side 4. Create geographical centers of the polygon
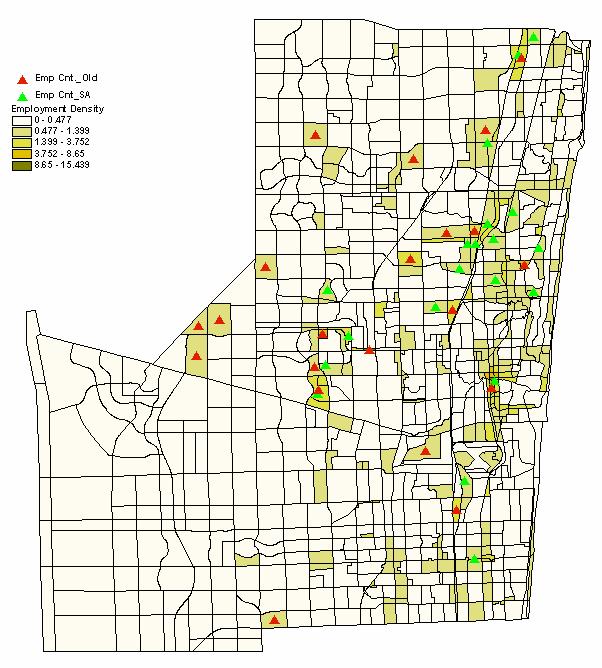

15 Population and Employment Subcenters
16 Regional Accessibility Regional accessibility to population and employment centers (RPEAccess( ) NP NE tki k i j i= 1 j= t RPEAccess Pe E e = kj *P i,e j = the population/employment of i, j-th population/employment center *t ki,t kj = the network travel time from count station k to the i, j-th population/ employment center *N P,N E = the number of population/ employment centers

17 AADT and Functional Classification
18 Data Compilation and Processing Dependent Variable AADT 723 for model development 145 on principal arterials, 2352 on minor arterials, 289 on collectors, 54 on local roads Predictors roadway characteristics (number of lanes) land uses (population, employment) Accessibility to subcenters
19 Land Uses Population (POPBUF( ) and employmente (EMPBUF ) size around a count station Location Principal Arterial Buffer Size (miles) Minor Arterial Collector Local / Undefined East Central Central West West
20 Expressway Accessibility Direct access to expressway (DIRECTAC) as a binary variable 1 for a count station on a road that connects to an expressway, 0 otherwise
21 Estimation Models Model_Old AADT = LANE DIRECTAC EMPBUF POPBUF RPEAccess_Old Model_SA AADT = LANE DIRECTAC EMPBUF POPBUF RPEAccess_SA
22 Model Performance Model Model_Old Model_SA R-square Adj R-square MSE Mean Error(%) Total Error(%) Total Error = (SumPredt. SumADT)/SumADT*
23 Conclusions New method is systematic and automatic Spatial Autocorrelation is a useful tool to identify regional subcenters Model_SA is able to better explain the variation in the data than Model_Old
Finding Hot Spots in ArcGIS Online: Minimizing the Subjectivity of Visual Analysis. Nicholas M. Giner Esri Parrish S.
 Finding Hot Spots in ArcGIS Online: Minimizing the Subjectivity of Visual Analysis Nicholas M. Giner Esri Parrish S. Henderson FBI Agenda The subjectivity of maps What is Hot Spot Analysis? Why do Hot
Expanding the GSATS Model Area into
 Appendix A Expanding the GSATS Model Area into North Carolina Jluy, 2011 Table of Contents LONG-RANGE TRANSPORTATION PLAN UPDATE 1. Introduction... 1 1.1 Background... 1 1.2 Existing Northern Extent of
The effects of impact fees on urban form and congestion in Florida
 The effects of impact fees on urban form and congestion in Florida Principal Investigators: Andres G. Blanco Ruth Steiner Presenters: Hyungchul Chung Jeongseob Kim Urban and Regional Planning Contents
TRAVEL DEMAND MODEL. Chapter 6
 Chapter 6 TRAVEL DEMAND MODEL As a component of the Teller County Transportation Plan development, a computerized travel demand model was developed. The model was utilized for development of the Transportation
Updating the Urban Boundary and Functional Classification of New Jersey Roadways using 2010 Census data
 Updating the Urban Boundary and Functional Classification of New Jersey Roadways using 2010 Census data By: Glenn Locke, GISP, PMP 1 GIS-T May, 2013 Presentation Overview Purpose of Project Methodology
Traffic Demand Forecast
 Chapter 5 Traffic Demand Forecast One of the important objectives of traffic demand forecast in a transportation master plan study is to examine the concepts and policies in proposed plans by numerically
PLEASE SCROLL DOWN FOR ARTICLE
 This article was downloaded by: [Zhong, Ming] On: 8 October 2009 Access details: Access Details: [subscription number 915732211] Publisher Routledge Informa Ltd Registered in England and Wales Registered
Use of Spatial Interpolation to Estimate Interurban Traffic Flows from Traffic Counts
 Use of Spatial Interpolation to Estimate Interurban Traffic Flows from Traffic Counts NATMEC: Improving Traffic Data Collection, Analysis, and Use June 29 July 2, 2014 Swissôtel Chicago Chicago, Illinois
Finding Hot Spots in ArcGIS Online: Minimizing the Subjectivity of Visual Analysis. Nicholas M. Giner Esri Parrish S.
 Finding Hot Spots in ArcGIS Online: Minimizing the Subjectivity of Visual Analysis Nicholas M. Giner Esri Parrish S. Henderson - FBI Agenda The subjectivity of maps What is Hot Spot Analysis? What is Outlier
SPACE Workshop NSF NCGIA CSISS UCGIS SDSU. Aldstadt, Getis, Jankowski, Rey, Weeks SDSU F. Goodchild, M. Goodchild, Janelle, Rebich UCSB
 SPACE Workshop NSF NCGIA CSISS UCGIS SDSU Aldstadt, Getis, Jankowski, Rey, Weeks SDSU F. Goodchild, M. Goodchild, Janelle, Rebich UCSB August 2-8, 2004 San Diego State University Some Examples of Spatial
3.0 ANALYSIS OF FUTURE TRANSPORTATION NEEDS
 3.0 ANALYSIS OF FUTURE TRANSPORTATION NEEDS In order to better determine future roadway expansion and connectivity needs, future population growth and land development patterns were analyzed as part of
FHWA Planning Data Resources: Census Data Planning Products (CTPP) HEPGIS Interactive Mapping Portal
 HEPGIS Interactive Mapping Portal") FHWA Planning Data Resources: Census Data Planning Products (CTPP) HEPGIS Interactive Mapping Portal Jeremy Raw, P.E. FHWA, Office of Planning, Systems Planning and Analysis August 2017 Outline Census
FHWA Planning Data Resources: Census Data Planning Products (CTPP) HEPGIS Interactive Mapping Portal Jeremy Raw, P.E. FHWA, Office of Planning, Systems Planning and Analysis August 2017 Outline Census
Spatial Analysis I. Spatial data analysis Spatial analysis and inference
 Spatial Analysis I Spatial data analysis Spatial analysis and inference Roadmap Outline: What is spatial analysis? Spatial Joins Step 1: Analysis of attributes Step 2: Preparing for analyses: working with
Douglas County/Carson City Travel Demand Model
 Douglas County/Carson City Travel Demand Model FINAL REPORT Nevada Department of Transportation Douglas County Prepared by Parsons May 2007 May 2007 CONTENTS 1. INTRODUCTION... 1 2. DEMOGRAPHIC INFORMATION...
Outline ESDA. Exploratory Spatial Data Analysis ESDA. Luc Anselin
 Exploratory Spatial Data Analysis ESDA Luc Anselin University of Illinois, Urbana-Champaign http://www.spacestat.com Outline ESDA Exploring Spatial Patterns Global Spatial Autocorrelation Local Spatial
Keywords: Air Quality, Environmental Justice, Vehicle Emissions, Public Health, Monitoring Network
 NOTICE: this is the author s version of a work that was accepted for publication in Transportation Research Part D: Transport and Environment. Changes resulting from the publishing process, such as peer
APPENDIX IV MODELLING
 APPENDIX IV MODELLING Kingston Transportation Master Plan Final Report, July 2004 Appendix IV: Modelling i TABLE OF CONTENTS Page 1.0 INTRODUCTION... 1 2.0 OBJECTIVE... 1 3.0 URBAN TRANSPORTATION MODELLING
2015 Grand Forks East Grand Forks TDM
 GRAND FORKS EAST GRAND FORKS 2015 TRAVEL DEMAND MODEL UPDATE DRAFT REPORT To the Grand Forks East Grand Forks MPO October 2017 Diomo Motuba, PhD & Muhammad Asif Khan (PhD Candidate) Advanced Traffic Analysis
Appendixx C Travel Demand Model Development and Forecasting Lubbock Outer Route Study June 2014
 Appendix C Travel Demand Model Development and Forecasting Lubbock Outer Route Study June 2014 CONTENTS List of Figures-... 3 List of Tables... 4 Introduction... 1 Application of the Lubbock Travel Demand
SASI Spatial Analysis SSC Meeting Aug 2010 Habitat Document 5
 OBJECTIVES The objectives of the SASI Spatial Analysis were to (1) explore the spatial structure of the asymptotic area swept (z ), (2) define clusters of high and low z for each gear type, (3) determine
Wesley Chapel Area Roadway Needs Study Build-Out Analysis (Beardsley Dr/Oldwoods Ave Need Study) Project Progress Meeting 1
 Project Progress Meeting 1") Build-Out Analysis (Beardsley Dr/Oldwoods Ave Need Study) Project Progress Meeting 1 9:30 AM Pasco County Development Services Conference Room 1. Welcome/Introductions 2. Project Overview Purpose Major
Build-Out Analysis (Beardsley Dr/Oldwoods Ave Need Study) Project Progress Meeting 1 9:30 AM Pasco County Development Services Conference Room 1. Welcome/Introductions 2. Project Overview Purpose Major
Luc Anselin Spatial Analysis Laboratory Dept. Agricultural and Consumer Economics University of Illinois, Urbana-Champaign
 GIS and Spatial Analysis Luc Anselin Spatial Analysis Laboratory Dept. Agricultural and Consumer Economics University of Illinois, Urbana-Champaign http://sal.agecon.uiuc.edu Outline GIS and Spatial Analysis
APPENDIX I: Traffic Forecasting Model and Assumptions
 APPENDIX I: Traffic Forecasting Model and Assumptions Appendix I reports on the assumptions and traffic model specifications that were developed to support the Reaffirmation of the 2040 Long Range Plan.
1 2 SPATIAL PREDICTION OF AADT IN UNMEASURED LOCATIONS 3 BY UNIVERSAL KRIGING 4 5 Brent Selby 6 Graduate Student Researcher 7 The University of Texas
 1 2 SPATIAL PREDICTION OF AADT IN UNMEASURED LOCATIONS 3 BY UNIVERSAL KRIGING 4 5 Brent Selby 6 Graduate Student Researcher 7 The University of Texas at Austin. 8 6.9 E. Cockrell Jr. Hall 9 Austin, TX
2040 MTP and CTP Socioeconomic Data
 SE Data 6-1 24 MTP and CTP Socioeconomic Data Purpose of Socioeconomic Data The socioeconomic data (SE Data) shows the location of the population and employment, median household income and other demographic
Measures of Spatial Dependence
 Measures of Spatial Dependence Carlos Hurtado Department of Economics University of Illinois at Urbana-Champaign hrtdmrt2@illinois.edu Junel 30th, 2016 C. Hurtado (UIUC - Economics) Spatial Econometrics
Appendix B. Land Use and Traffic Modeling Documentation
 Appendix B Land Use and Traffic Modeling Documentation Technical Memorandum Planning Level Traffic for Northridge Sub-Area Study Office of Statewide Planning and Research Modeling & Forecasting Section
GIS TOOLS TO ESTIMATE AVERAGE ANNUAL DAILY TRAFFIC
 GIS TOOLS TO ESTIMATE AVERAGE ANNUAL DAILY TRAFFIC Final Report KLK725 N12-03 National Institute for Advanced Transportation Technology University of Idaho Michael Lowry and Michael Dixon June 2012 DISCLAIMER
Chapter 6. Fundamentals of GIS-Based Data Analysis for Decision Support. Table 6.1. Spatial Data Transformations by Geospatial Data Types
 Chapter 6 Fundamentals of GIS-Based Data Analysis for Decision Support FROM: Points Lines Polygons Fields Table 6.1. Spatial Data Transformations by Geospatial Data Types TO: Points Lines Polygons Fields
Mapping and Analysis for Spatial Social Science
 Mapping and Analysis for Spatial Social Science Luc Anselin Spatial Analysis Laboratory Dept. Agricultural and Consumer Economics University of Illinois, Urbana-Champaign http://sal.agecon.uiuc.edu Outline
VHD Daily Totals. Population 14.5% change. VMT Daily Totals Suffolk 24-hour VMT. 49.3% change. 14.4% change VMT
 6.9 Suffolk 6-54 VMT Population and Travel Characteristics Population 14.5% change 2014 1,529,202 VHD Daily Totals 2014 251,060 49.3% change 2040 1,788,175 2040 374,850 VMT Daily Totals 2014 39,731,990
III. FORECASTED GROWTH
 III. FORECASTED GROWTH In order to properly identify potential improvement projects that will be required for the transportation system in Milliken, it is important to first understand the nature and volume
Xiaoguang Wang, Assistant Professor, Department of Geography, Central Michigan University Chao Liu,
 Xiaoguang Wang, Email: wang9x@cmich.edu Assistant Professor, Department of Geography, Central Michigan University Chao Liu, Email: cliu8@umd.edu Research Associate, National Center for Smart Growth, Research
TRAFFIC FORECAST METHODOLOGY
 CHAPTER 5 TRAFFIC FORECAST METHODOLOGY Introduction Need for County-Level Traffic Forecasting 2030 HC-TSP Model Methodology Model Calibration Future Traffic Forecasts Hennepin County Transportation Systems
Table 3-1 Gallatin County Population and Employment Trends ( )
") 3.1 INTRODUCTION The method and process used to predict growth in the Bozeman area up to the year 030 is contained in this chapter of the Transportation Plan. By using population, employment and other
3.1 INTRODUCTION The method and process used to predict growth in the Bozeman area up to the year 030 is contained in this chapter of the Transportation Plan. By using population, employment and other
Spatial Autocorrelation (2) Spatial Weights
 Spatial Weights") Spatial Autocorrelation (2) Spatial Weights Luc Anselin Spatial Analysis Laboratory Dept. Agricultural and Consumer Economics University of Illinois, Urbana-Champaign http://sal.agecon.uiuc.edu Outline
Spatial Autocorrelation (2) Spatial Weights Luc Anselin Spatial Analysis Laboratory Dept. Agricultural and Consumer Economics University of Illinois, Urbana-Champaign http://sal.agecon.uiuc.edu Outline
Goodlette/Pine Ridge Commercial Infill Subdistrict. Exhibit IV.B Amendment Language. Revise the FUTURE LAND USE ELEMENT
 Revise the FUTURE LAND USE ELEMENT TABLE OF CONTENTS * FUTURE LAND USE MAP SERIES * Future Land Use Map * Mixed Use & Interchange Activity Centers Maps * Properties Consistent by Policy (5.9, 5.10, 5.11,
Traffic Impact Study
 Traffic Impact Study Statham DRI One University Parkway Prepared for: Barrow County Prepared by: October 2012 Table of Contents Executive Summary i Section 1. Introduction 1 Project Description 1 Methodology
2014 Certification Review Regional Data & Modeling
 2014 Certification Review Regional Data & Modeling July 22, 2014 Regional Data Census Program Coordination PAG works with and for member agencies to ensure full participation in all Census Bureau programs
ALTERNATIVES FOR ESTIMATING SEASONAL FACTORS ON RURAL AND URBAN ROADS IN FLORIDA
 ALTERNATIVES FOR ESTIMATING SEASONAL FACTORS ON RURAL AND URBAN ROADS IN FLORIDA Final Report Contract No. BD015-03 Prepared for Research Office Florida Department of Transportation Prepared by Lehman
SBCAG Travel Model Upgrade Project 3rd Model TAC Meeting. Jim Lam, Stewart Berry, Srini Sundaram, Caliper Corporation December.
 SBCAG Travel Model Upgrade Project 3rd Model TAC Meeting Jim Lam, Stewart Berry, Srini Sundaram, Caliper Corporation December. 7, 2011 1 Outline Model TAZs Highway and Transit Networks Land Use Database
Hillsborough County MPO Transit Study. Technical Team August 23, 2007
 Hillsborough County MPO Transit Study Technical Team August 23, 2007 Meeting Agenda Technology Choices Needs and Opportunities Transit Concepts Comparative Land Use Analysis Measures of Effectiveness System
GIS for the Non-Expert
 GIS for the Non-Expert Ann Forsyth University of Minnesota February 2006 GIS for the Non-Expert 1. Definitions and problems 2. Measures being tested in Twin Cities Walking Study Basic approach, data, variables
APPENDIX C-6 - TRAFFIC MODELING REPORT, SRF CONSULTING GROUP
 APPENDIX C-6 - TRAFFIC MODELING REPORT, SRF CONSULTING GROUP Scott County 2030 Comprehensive Plan Update Appendix C Scott County Traffic Model Final Report and Documentation March 2008 Prepared for: Scott
Chapter 3 Geographic Location Systems
 Chapter 3 Geographic Location Systems In this chapter you will learn about: Latitude and longitude Universal Transverse Mercator (UTM) U.S. Public Land Survey Other geographic location systems Geographic
Exploratory Spatial Data Analysis of Regional Economic Disparities in Beijing during the Preparation Period of the 2008 Olympic Games
 Exploratory Spatial Data Analysis of Regional Economic Disparities in Beijing during the Preparation Period of the 2008 Olympic Games Xiaoyi Ma, Tao Pei Thursday, May 27, 2010 The State Key Laboratory
In matrix algebra notation, a linear model is written as
 DM3 Calculation of health disparity Indices Using Data Mining and the SAS Bridge to ESRI Mussie Tesfamicael, University of Louisville, Louisville, KY Abstract Socioeconomic indices are strongly believed
StanCOG Transportation Model Program. General Summary
 StanCOG Transportation Model Program Adopted By the StanCOG Policy Board March 17, 2010 What are Transportation Models? General Summary Transportation Models are technical planning and decision support
Identifying Megaregions in the US: Implications for Infrastructure Investment
 7. 10. 2 0 08 Identifying Megaregions in the US: Implications for Infrastructure Investment Dr. Myungje Woo Dr. Catherine L. Ross Jason Barringer Harry West Jessica Lynn Harbour Doyle Center for Quality
A Spatial Econometric Approach to Model the Growth of Tourism Flows to China Cities
 April 15, 2010 AAG 2010 Conference, Washington DC A Spatial Econometric Approach to Model the Growth of Tourism Flows to China Cities Yang Yang University of Florida Kevin. K.F. Wong The Hong Kong Polytechnic
Guilty of committing ecological fallacy?
 GIS: Guilty of committing ecological fallacy? David W. Wong Professor Geography and GeoInformation Science George Mason University dwong2@gmu.edu Ecological Fallacy (EF) Many slightly different definitions
GIS Spatial Statistics for Public Opinion Survey Response Rates
 GIS Spatial Statistics for Public Opinion Survey Response Rates July 22, 2015 Timothy Michalowski Senior Statistical GIS Analyst Abt SRBI - New York, NY t.michalowski@srbi.com www.srbi.com Introduction
Market Street PDP. Nassau County, Florida. Transportation Impact Analysis. VHB/Vanasse Hangen Brustlin, Inc. Nassau County Growth Management
 Transportation Impact Analysis Market Street PDP Nassau County, Florida Submitted to Nassau County Growth Management Prepared for TerraPointe Services, Inc. Prepared by VHB/Vanasse Hangen Brustlin, Inc.
A Method to Reduce the Modifiable Areal Unit Problem in Measuring Urban Form Metrics
 A Method to Reduce the Modifiable Areal Unit Problem in Measuring Urban Form Metrics Dr. Abdul Naser Arafat Keywords: urban, modifiable Areal Unit Problem, Transportation planning, GIS ABSTRACT The relationship
The Implementation of Autocorrelation-Based Regioclassification in ArcMap Using ArcObjects
 140 The Implementation of Autocorrelation-Based Regioclassification in ArcMap Using ArcObjects Christoph MAYRHOFER Abstract Conventional methods for cartographic classification are often solely based on
Using Tourism-Based Travel Demand Model to Estimate Traffic Volumes on Low-Volume Roads
 International Journal of Traffic and Transportation Engineering 2018, 7(4): 71-77 DOI: 10.5923/j.ijtte.20180704.01 Using Tourism-Based Travel Demand Model to Estimate Traffic Volumes on Low-Volume Roads
Comparative Analysis of Zonal Systems for Macro-level Crash Modeling: Census Tracts, Traffic Analysis Zones, and Traffic Analysis Districts
 Comparative Analysis of Zonal Systems for Macro-level Crash Modeling: Census Tracts, Traffic Analysis Zones, and Traffic Analysis Districts Qing Cai* Mohamed Abdel-Aty Jaeyoung Lee Naveen Eluru Department
HUMAN CAPITAL CATEGORY INTERACTION PATTERN TO ECONOMIC GROWTH OF ASEAN MEMBER COUNTRIES IN 2015 BY USING GEODA GEO-INFORMATION TECHNOLOGY DATA
 International Journal of Civil Engineering and Technology (IJCIET) Volume 8, Issue 11, November 2017, pp. 889 900, Article ID: IJCIET_08_11_089 Available online at http://http://www.iaeme.com/ijciet/issues.asp?jtype=ijciet&vtype=8&itype=11
Factors Impacting Link Travel Speed Reliability: A Case Study at Cairo, Egypt
 Factors Impacting Link Travel Speed Reliability: A Case Study at Cairo, Egypt Akram Sabry Nile University, Giza, Egypt Email: akramsabry@hotmail.com Hoda Talaat Faculty of Engineering, Cairo University,
WOODRUFF ROAD CORRIDOR ORIGIN-DESTINATION ANALYSIS
 2018 WOODRUFF ROAD CORRIDOR ORIGIN-DESTINATION ANALYSIS Introduction Woodruff Road is the main road to and through the commercial area in Greenville, South Carolina. Businesses along the corridor have
APPENDIX I - AREA PLANS
 ROUTE 37 WEST LAND USE PLAN ROUTE 37 WEST LAND USE PLAN Recent land use decisions and development trends have drawn attention to the land within the Route 37 western by-pass area between Route 50 and
HORIZON 2030: Land Use & Transportation November 2005
 PROJECTS Land Use An important component of the Horizon transportation planning process involved reviewing the area s comprehensive land use plans to ensure consistency between them and the longrange transportation
Using GIS to Identify Pedestrian- Vehicle Crash Hot Spots and Unsafe Bus Stops
 Using GIS to Identify Pedestrian-Vehicle Crash Hot Spots and Unsafe Bus Stops Using GIS to Identify Pedestrian- Vehicle Crash Hot Spots and Unsafe Bus Stops Long Tien Truong and Sekhar V. C. Somenahalli
Locational Error Impacts on Local Spatial Autocorrelation Indices: A Syracuse Soil Sample Pb-level Data Case Study
 Locational Error Impacts on Local Spatial Autocorrelation Indices: A Syracuse Soil Sample Pb-level Data Case Study Daniel A. Griffith *1, Yongwan Chun 1, and Monghyeon Lee 1 1 University of Texas at Dallas,
Tracey Farrigan Research Geographer USDA-Economic Research Service
 Rural Poverty Symposium Federal Reserve Bank of Atlanta December 2-3, 2013 Tracey Farrigan Research Geographer USDA-Economic Research Service Justification Increasing demand for sub-county analysis Policy
Basics of Geographic Analysis in R
 Basics of Geographic Analysis in R Spatial Autocorrelation and Spatial Weights Yuri M. Zhukov GOV 2525: Political Geography February 25, 2013 Outline 1. Introduction 2. Spatial Data and Basic Visualization
Migration Clusters in Brazil: an Analysis of Areas of Origin and Destination Ernesto Friedrich Amaral
 1 Migration Clusters in Brazil: an Analysis of Areas of Origin and Destination Ernesto Friedrich Amaral Research question and data The main goal of this research is to analyze whether the pattern of concentration
Accessing and Using Indiana Traffic Data
 Accessing and Using Indiana Traffic Data Purdue Road School March 6, 2013 Presented by: Gregory Katter, PE Asset Planning Indiana Traffic Data 1. Overview of Traffic Data Collection Program 2. Accessing
Improving the Model s Sensitivity to Land Use Policies and Nonmotorized Travel
 Improving the Model s Sensitivity to Land Use Policies and Nonmotorized Travel presented to MWCOG/NCRTPB Travel Forecasting Subcommittee presented by John (Jay) Evans, P.E., AICP Cambridge Systematics,
Daniel Fuller Lise Gauvin Yan Kestens
 Examining the spatial distribution and relationship between support for policies aimed at active living in transportation and transportation behavior Daniel Fuller Lise Gauvin Yan Kestens Introduction
Spatial Variation in Local Road Pedestrian and Bicycle Crashes
 2015 Esri International User Conference July 20 24, 2015 San Diego, California Spatial Variation in Local Road Pedestrian and Bicycle Crashes Musinguzi, Abram, Graduate Research Assistant Chimba,Deo, PhD.,
Regional Performance Measures
 G Performance Measures Regional Performance Measures Introduction This appendix highlights the performance of the MTP/SCS for 2035. The performance of the Revenue Constrained network also is compared to
Introduction to Spatial Statistics and Modeling for Regional Analysis
 Introduction to Spatial Statistics and Modeling for Regional Analysis Dr. Xinyue Ye, Assistant Professor Center for Regional Development (Department of Commerce EDA University Center) & School of Earth,
Taming the Modeling Monster
 Taming the Modeling Monster Starring: Ellen Greenberg Scott McCarey Jim Charlier Audience Poll, part 1 Elected Officials Board Members Public Staff Consultants Journalists Other Audience Poll, part 2 Modeling
FSUTMS Framework for Integrating Land Use Modeling
 FSUTMS Framework for Integrating Land Use Modeling presented to MTF Data Committee presented by Wade L. White, Whitehouse Group Walter Anderson, Whitehouse Group March 6, 2012 Agenda Background Previous
Maricopa County Department of Transportation (MCDOT) GIS Innovations in Transportation Asset Management
 GIS Innovations in Transportation Asset Management") Maricopa County Department of Transportation (MCDOT) GIS Innovations in Transportation Asset Management Presented By Steve Hossack, GIS Database Administrator 2018 ITE/IMSA Spring Conference Maricopa County
Maricopa County Department of Transportation (MCDOT) GIS Innovations in Transportation Asset Management Presented By Steve Hossack, GIS Database Administrator 2018 ITE/IMSA Spring Conference Maricopa County
ch02.pdf chap2.pdf chap02.pdf
 Introduction to Geographic Information Systems 8th Edition Karl Solutions Manual Full Download: http://testbanklive.com/download/introduction-to-geographic-information-systems-8th-edition-karl-solutions-manu
An Indicator Model of the Spatial Quantification and Pattern Analysis of Urban Sustainability: A Case Study of Cincinnati, Ohio
 Current Urban Studies, 2015, 3, 231-240 Published Online September 2015 in SciRes. http://www.scirp.org/journal/cus http://dx.doi.org/10.4236/cus.2015.33019 An Indicator Model of the Spatial Quantification
JCRD501: RURAL COUNTY ROADWAY SPECIFICATIONS
 Typical ADT (Average Daily Traffic) UAL COUNTY OADWAY STANDADS AND SPECIFICATIONS Local oad A Local oad B Local oad C Minor Collector Major Collector Arterial 0-120 120-600 600-1,500 1,250-5,000 >4,500
APPENDIX C-3 Equitable Target Areas (ETA) Technical Analysis Methodology
 Technical Analysis Methodology") APPENDIX C-3 Equitable Target Areas (ETA) Technical Analysis Methodology Contents Introduction... 1 ETA Index Methodology... 1 ETA Index Development... 1 Other EJ Measures... 4 The Limited English Proficiency
APPENDIX C-3 Equitable Target Areas (ETA) Technical Analysis Methodology Contents Introduction... 1 ETA Index Methodology... 1 ETA Index Development... 1 Other EJ Measures... 4 The Limited English Proficiency
Louisiana Transportation Engineering Conference. Monday, February 12, 2007
 Louisiana Transportation Engineering Conference Monday, February 12, 2007 Agenda Project Background Goal of EIS Why Use GIS? What is GIS? How used on this Project Other site selection tools I-69 Corridor
Lecture 3: Exploratory Spatial Data Analysis (ESDA) Prof. Eduardo A. Haddad
 Prof. Eduardo A. Haddad") Lecture 3: Exploratory Spatial Data Analysis (ESDA) Prof. Eduardo A. Haddad Key message Spatial dependence First Law of Geography (Waldo Tobler): Everything is related to everything else, but near things
Lecture 3: Exploratory Spatial Data Analysis (ESDA) Prof. Eduardo A. Haddad Key message Spatial dependence First Law of Geography (Waldo Tobler): Everything is related to everything else, but near things
TREASURE COAST REGIONAL PLANNING COUNCIL M E M O R A N D U M. To: Council Members AGENDA ITEM 4B10
 TREASURE COAST REGIONAL PLANNING COUNCIL M E M O R A N D U M To: Council Members AGENDA ITEM 4B10 From: Date: Subject: Staff December 14, 2018 Council Meeting Local Government Comprehensive Plan Review
The Sunland Park flyover ramp is set to close the week of March 19 until early summer
 March 2, 2018 The Sunland Park flyover ramp is set to close the week of March 19 until early summer GO 10 is targeting the week of March 19 to close the Sunland Park Drive flyover entrance ramp to I 10
Measuring Urban Form and Examining Its Impact on Traffic Congestion in Florida
 Measuring Urban Form and Examining Its Impact on Traffic Congestion in Florida By Vince Wang Chair: Ruth Steiner Co-Chair: Andres Blanco March 04, 2011 Department of Urban and Regional Planning Overview
SPATIAL HUMAN CAPITAL INTERACTION PATTERN TO INDONESIAN ECONOMIC GROWTH
 International Journal of Civil Engineering and Technology (IJCIET) Volume 9, Issue 1, January 2018, pp. 713 727, Article ID: IJCIET_09_01_069 Available online at http://www.iaeme.com/ijciet/issues.asp?jtype=ijciet&vtype=9&itype=1
Statewide State Roads Layer Michigan Geographic Framework Field Definitions
 Statewide State Roads Layer Michigan Geographic Framework Field Definitions (Shapefile Attribute Table) (June 1, 2012 Version 12b) The following field definitions make up the shapefile attribute table
Spatial Analysis of Population Distribution by Employment Sectors in Tokyo Metropolitan Area
 1 Spatial Analysis of Population Distribution by Employment Sectors in Tokyo Metropolitan Area MONZUR, Tawhid Abstract This research is focused on analyzing the urban spatial structure of the Tokyo metropolitan
Modeling Land Use Change Using an Eigenvector Spatial Filtering Model Specification for Discrete Response
 Modeling Land Use Change Using an Eigenvector Spatial Filtering Model Specification for Discrete Response Parmanand Sinha The University of Tennessee, Knoxville 304 Burchfiel Geography Building 1000 Phillip
VALIDATING THE RELATIONSHIP BETWEEN URBAN FORM AND TRAVEL BEHAVIOR WITH VEHICLE MILES TRAVELLED. A Thesis RAJANESH KAKUMANI
 VALIDATING THE RELATIONSHIP BETWEEN URBAN FORM AND TRAVEL BEHAVIOR WITH VEHICLE MILES TRAVELLED A Thesis by RAJANESH KAKUMANI Submitted to the Office of Graduate Studies of Texas A&M University in partial
Local Spatial Autocorrelation Clusters
 Local Spatial Autocorrelation Clusters Luc Anselin http://spatial.uchicago.edu LISA principle local Moran local G statistics issues and interpretation LISA Principle Clustering vs Clusters global spatial
Nature of Spatial Data. Outline. Spatial Is Special
 Nature of Spatial Data Outline Spatial is special Bad news: the pitfalls of spatial data Good news: the potentials of spatial data Spatial Is Special Are spatial data special? Why spatial data require
Jin Guk Kim Korea Institute of Civil Engineering and Building Technology KICT, South Korea January 21, 2016
 Locational priority of fixed automated spray technology (FAST) using analytic hierarchy process Jin Guk Kim Korea Institute of Civil Engineering and Building Technology KICT, South Korea January 21, 2016
Using GIS to Determine Goodness of Fit for Functional Classification. Eric Foster NWMSU MoDOT
 Using GIS to Determine Goodness of Fit for Functional Classification Eric Foster NWMSU MoDOT Northwest Missouri State Masters of GIScience Degree Program University All Online Coursework Missouri Department
Urban land value, Accessibility and Night Light Data: A Case Study in China
 309-Paper Urban land value, Accessibility and Night Light Data: A Case Study in China Sumeeta Srinivasan, and Deng Yu Abstract In this paper, we use night light imagery data at two scales the city and
KAAF- GE_Notes GIS APPLICATIONS LECTURE 3
 GIS APPLICATIONS LECTURE 3 SPATIAL AUTOCORRELATION. First law of geography: everything is related to everything else, but near things are more related than distant things Waldo Tobler Check who is sitting
CENTER FOR MULTIMODAL SOLUTIONS FOR CONGESTION MITIGATION (CMS)
") Final Report to the CENTER FOR MULTIMODAL SOLUTIONS FOR CONGESTION MITIGATION (CMS) CMS Project Number: 2011-019 Modeling the effect of accessibility and congestion in location choice Prepared by: Ruth
Final Report to the CENTER FOR MULTIMODAL SOLUTIONS FOR CONGESTION MITIGATION (CMS) CMS Project Number: 2011-019 Modeling the effect of accessibility and congestion in location choice Prepared by: Ruth
THE FUTURE OF FORECASTING AT METROPOLITAN COUNCIL. CTS Research Conference May 23, 2012
 THE FUTURE OF FORECASTING AT METROPOLITAN COUNCIL CTS Research Conference May 23, 2012 Metropolitan Council forecasts Regional planning agency and MPO for Twin Cities metropolitan area Operates regional
Introduction GeoXp : an R package for interactive exploratory spatial data analysis. Illustration with a data set of schools in Midi-Pyrénées.
 Presentation of Presentation of Use of Introduction : an R package for interactive exploratory spatial data analysis. Illustration with a data set of schools in Midi-Pyrénées. Authors of : Christine Thomas-Agnan,
March 31, diversity. density. 4 D Model Development. submitted to: design. submitted by: destination
 March 31, 2010 diversity density 4 D Model Development submitted to: design submitted by: destination 4 D Model Development Team SANDAG: Mike Calandra Rick Curry Rob Rundle Parsons Brinckerhoff: Bill Davidson