Outline ESDA. Exploratory Spatial Data Analysis ESDA. Luc Anselin
|
|
|
- Cassandra Linda Bryant
- 6 years ago
- Views:
Transcription
1 Exploratory Spatial Data Analysis ESDA Luc Anselin University of Illinois, Urbana-Champaign Outline ESDA Exploring Spatial Patterns Global Spatial Autocorrelation Local Spatial Autocorrelation ESDA 1
» examples: county tax rates, state")
2 Classes of Spatial Data (Cressie) Point Patterns points on a map Geostatistical Data points as sample locations Lattice/Regional Data polygons or points (centroids) Lattice or Regional Data Spatial Process index set D is fixed collection of countably many points in R d finite, discrete spatial units Data fixed points or discrete locations (regions)» examples: county tax rates, state unemployment Research Question interest focuses on statistical inference patterns, estimation, specification tests WV Housing Values (1990) counties, county centroids, Thiessen polygons 2
3 EDA and Space EDA = Discover Potentially Explicable Patterns (Good) Data Visualization (Buja) Interactive View Manipulation» focusing individual views» linking multiple views» arranging many views No Role for Explicit Treatment of Space Exploratory Spatial Data Analysis EDA + Describe Spatial Distributions spatial trends, spatial means Identify Atypical Observations spatial outliers Discover Patterns of Spatial Association spatial clusters Suggest Spatial Regimes spatial non-stationarity ESDA Functionality Dynamic Graphics linking and brushing statistical plots and map Visualizing Spatial Distributions spatial box map smoothing rates Visualizing Spatial Autocorrelation spatial lag pie charts and bar charts Moran scatterplot and map, LISA maps 3
 on others highlighted geographic brushing: map as a view of data")
4 Exploring Spatial Patterns Dynamically Linked Windows Dynamic Graphics different views of data: histogram, box plot, scatterplot, list views dynamically linked: click on one, corresponding points (areas) on others highlighted geographic brushing: map as a view of data 4

5 Global Spatial Autocorrelation 5
6 Spatial Association Null Hypothesis: No Spatial Association values observed at a location do not depend on values observed at neighboring locations observed spatial pattern of values is equally likely as any other spatial pattern the location of values may be altered without affecting the information content of the data Observed (left) and randomized (right) distribution for Columbus Crime Randomization polyid 1 became 14 polyid 2 became 20 polyid 3 became Observed (left) and randomized (right) distribution for Columbus Crime Moran s I = Moran s I =
7 Alternative Hypotheses of SA Positive Spatial Association like values tend to cluster in space neighbors are similar Negative Spatial Association neighbors are dissimilar checkerboard pattern Moran s I Spatial Autocorrelation Statistic Moran s I cross-product statistic I = (N/S 0 ) Σ i Σ j w ij.z i.z j / Σ i z i 2 with z i = x i - µ=and S 0 = Σ i Σ j w ij Inference normal distribution randomization permutation Interpretation of Moran s I Positive Spatial Autocorrelation I > -1/(n-1), or z > 0 spatial clustering of high and/or low values» no distinction between high or low Negative Spatial Autocorrelation I < -1/(n-1), or z < 0 checkerboard pattern, competition 7
 i as proportions of pie (x > 0 only) Spatial Lag Bar Chart x i and (Wx) i as bars Ww_hoval")
8 Spatial Lag Chart Spatial Lag Visualization value at i compared to weighted average of neighbors: x i relative to (Wx) i similar values = positive SA dissimilar values = negative SA Spatial Lag Pie Chart x i and (Wx) i as proportions of pie (x > 0 only) Spatial Lag Bar Chart x i and (Wx) i as bars Ww_hoval Hoval 8


9 Moran Scatterplot Linear Spatial Association linear association between value at i and weighted average of neighbors: Σ j w ij y j vs. y i, or Wy vs y four quadrants» high-high, low-low = spatial clusters» high-low, low-high = spatial outliers Moran s I slope of linear scatterplot smoother I = z Wz / z z 9

10 Use of Moran Scatterplot Classification of Spatial Association Local Nonstationarity outliers high leverage points sensitivity to boundary values Regimes nonlinear association» different slopes in subsets of the data 10
11 Local Spatial Autocorrelation LISA Definition (Anselin 1995) Local Indicators of Spatial Association LISA satisfies two requirements indicate significant spatial clustering for each location sum of LISA proportional to a global indicator of spatial association LISA Forms of Global Statistics local Moran, local Geary, local Gamma Use of LISA Identify Hot Spots significant local clusters in the absence of global association significant local outliers» high surrounded by low and vice versa Indicate Local Instability local deviations from global pattern of spatial association 11
12 Local Moran Local Moran Statistic I i = (z i / m 2 )Σ j w ij.z j Σ i I i = N.I Inference randomization assumption conditional permutation local dependence or heterogeneity? Visualization LISA map and Moran Significance Map 12
Mapping and Analysis for Spatial Social Science
 Mapping and Analysis for Spatial Social Science Luc Anselin Spatial Analysis Laboratory Dept. Agricultural and Consumer Economics University of Illinois, Urbana-Champaign http://sal.agecon.uiuc.edu Outline
Luc Anselin Spatial Analysis Laboratory Dept. Agricultural and Consumer Economics University of Illinois, Urbana-Champaign
 GIS and Spatial Analysis Luc Anselin Spatial Analysis Laboratory Dept. Agricultural and Consumer Economics University of Illinois, Urbana-Champaign http://sal.agecon.uiuc.edu Outline GIS and Spatial Analysis
Lecture 3: Exploratory Spatial Data Analysis (ESDA) Prof. Eduardo A. Haddad
 Prof. Eduardo A. Haddad") Lecture 3: Exploratory Spatial Data Analysis (ESDA) Prof. Eduardo A. Haddad Key message Spatial dependence First Law of Geography (Waldo Tobler): Everything is related to everything else, but near things
Lecture 3: Exploratory Spatial Data Analysis (ESDA) Prof. Eduardo A. Haddad Key message Spatial dependence First Law of Geography (Waldo Tobler): Everything is related to everything else, but near things
KAAF- GE_Notes GIS APPLICATIONS LECTURE 3
 GIS APPLICATIONS LECTURE 3 SPATIAL AUTOCORRELATION. First law of geography: everything is related to everything else, but near things are more related than distant things Waldo Tobler Check who is sitting
Exploratory Spatial Data Analysis Using GeoDA: : An Introduction
 Exploratory Spatial Data Analysis Using GeoDA: : An Introduction Prepared by Professor Ravi K. Sharma, University of Pittsburgh Modified for NBDPN 2007 Conference Presentation by Professor Russell S. Kirby,
Exploratory Spatial Data Analysis (And Navigating GeoDa)
") Exploratory Spatial Data Analysis (And Navigating GeoDa) June 9, 2006 Stephen A. Matthews Associate Professor of Sociology & Anthropology, Geography and Demography Director of the Geographic Information
Exploratory Spatial Data Analysis (And Navigating GeoDa) June 9, 2006 Stephen A. Matthews Associate Professor of Sociology & Anthropology, Geography and Demography Director of the Geographic Information
Geovisualization. Luc Anselin. Copyright 2016 by Luc Anselin, All Rights Reserved
 Geovisualization Luc Anselin http://spatial.uchicago.edu from EDA to ESDA from mapping to geovisualization mapping basics multivariate EDA primer From EDA to ESDA Exploratory Data Analysis (EDA) reaction
Local Spatial Autocorrelation Clusters
 Local Spatial Autocorrelation Clusters Luc Anselin http://spatial.uchicago.edu LISA principle local Moran local G statistics issues and interpretation LISA Principle Clustering vs Clusters global spatial
Exploratory Spatial Data Analysis and GeoDa
 Exploratory Spatial Data Analysis and GeoDa Luc Anselin Spatial Analysis Laboratory Dept. Agricultural and Consumer Economics University of Illinois, Urbana-Champaign http://sal.agecon.uiuc.edu Outline
Spatial Autocorrelation
 Spatial Autocorrelation Luc Anselin http://spatial.uchicago.edu spatial randomness positive and negative spatial autocorrelation spatial autocorrelation statistics spatial weights Spatial Randomness The
Measures of Spatial Dependence
 Measures of Spatial Dependence Carlos Hurtado Department of Economics University of Illinois at Urbana-Champaign hrtdmrt2@illinois.edu Junel 30th, 2016 C. Hurtado (UIUC - Economics) Spatial Econometrics
Outline. Introduction to SpaceStat and ESTDA. ESTDA & SpaceStat. Learning Objectives. Space-Time Intelligence System. Space-Time Intelligence System
 Outline I Data Preparation Introduction to SpaceStat and ESTDA II Introduction to ESTDA and SpaceStat III Introduction to time-dynamic regression ESTDA ESTDA & SpaceStat Learning Objectives Activities
Spatial Regression. 1. Introduction and Review. Luc Anselin. Copyright 2017 by Luc Anselin, All Rights Reserved
 Spatial Regression 1. Introduction and Review Luc Anselin http://spatial.uchicago.edu matrix algebra basics spatial econometrics - definitions pitfalls of spatial analysis spatial autocorrelation spatial
SASI Spatial Analysis SSC Meeting Aug 2010 Habitat Document 5
 OBJECTIVES The objectives of the SASI Spatial Analysis were to (1) explore the spatial structure of the asymptotic area swept (z ), (2) define clusters of high and low z for each gear type, (3) determine
Rate Maps and Smoothing
 Rate Maps and Smoothing Luc Anselin Spatial Analysis Laboratory Dept. Agricultural and Consumer Economics University of Illinois, Urbana-Champaign http://sal.agecon.uiuc.edu Outline Mapping Rates Risk
Global Spatial Autocorrelation Clustering
 Global Spatial Autocorrelation Clustering Luc Anselin http://spatial.uchicago.edu join count statistics Moran s I Moran scatter plot non-parametric spatial autocorrelation Join Count Statistics Recap -
Spatial Autocorrelation (2) Spatial Weights
 Spatial Weights") Spatial Autocorrelation (2) Spatial Weights Luc Anselin Spatial Analysis Laboratory Dept. Agricultural and Consumer Economics University of Illinois, Urbana-Champaign http://sal.agecon.uiuc.edu Outline
Spatial Autocorrelation (2) Spatial Weights Luc Anselin Spatial Analysis Laboratory Dept. Agricultural and Consumer Economics University of Illinois, Urbana-Champaign http://sal.agecon.uiuc.edu Outline
Geographical Information Systems Institute. Center for Geographic Analysis, Harvard University. GeoDa: Spatial Autocorrelation
 Geographical Information Systems Institute, A. Background From geodacenter.asu.edu: GeoDa is a free software program that serves as an introduction to spatial data analysis. OpenGeoDa is the cross-platform,
Construction Engineering. Research Laboratory. Approaches Towards the Identification of Patterns in Violent Events, Baghdad, Iraq ERDC/CERL CR-09-1
 ERDC/CERL CR-09-1 Approaches Towards the Identification of Patterns in Violent Events, Baghdad, Iraq Luc Anselin and Gianfranco Piras May 2009 Construction Engineering Research Laboratory Approved for
Exploratory Spatial Data Analysis of Regional Economic Disparities in Beijing during the Preparation Period of the 2008 Olympic Games
 Exploratory Spatial Data Analysis of Regional Economic Disparities in Beijing during the Preparation Period of the 2008 Olympic Games Xiaoyi Ma, Tao Pei Thursday, May 27, 2010 The State Key Laboratory
SPACE Workshop NSF NCGIA CSISS UCGIS SDSU. Aldstadt, Getis, Jankowski, Rey, Weeks SDSU F. Goodchild, M. Goodchild, Janelle, Rebich UCSB
 SPACE Workshop NSF NCGIA CSISS UCGIS SDSU Aldstadt, Getis, Jankowski, Rey, Weeks SDSU F. Goodchild, M. Goodchild, Janelle, Rebich UCSB August 2-8, 2004 San Diego State University Some Examples of Spatial
Soc/Anth 597 Spatial Demography March 14, GeoDa 0.95i Exercise A. Stephen A. Matthews. Outline. 1. Background
 Soc/Anth 597 Spatial Demography March 14, 2006 GeoDa 0.95i Exercise A Stephen A. Matthews Outline 1. Background 2. Data set introduced (GDANEPAL.SHP) 3. GeoDa introduced Task 1: Start GeoDa Task 2: Open
Introduction to Spatial Statistics and Modeling for Regional Analysis
 Introduction to Spatial Statistics and Modeling for Regional Analysis Dr. Xinyue Ye, Assistant Professor Center for Regional Development (Department of Commerce EDA University Center) & School of Earth,
Exploratory Spatial Data Analysis (ESDA)
") Exploratory Spatial Data Analysis (ESDA) VANGHR s method of ESDA follows a typical geospatial framework of selecting variables, exploring spatial patterns, and regression analysis. The primary software
Exploratory Spatial Data Analysis (ESDA) VANGHR s method of ESDA follows a typical geospatial framework of selecting variables, exploring spatial patterns, and regression analysis. The primary software
Spatial Tools for Econometric and Exploratory Analysis
 Spatial Tools for Econometric and Exploratory Analysis Michael F. Goodchild University of California, Santa Barbara Luc Anselin University of Illinois at Urbana-Champaign http://csiss.org Outline A Quick
Temporal vs. Spatial Data
 Temporal vs. Spatial Data Temporal 1 dimensional Units: day, week, month Lag: t, t-1, t-2 Durbin-Watson Spatial 2-3 dimensional Units: county, mile, region Lag: near neighbor, networks (?) Moran s I Differencing
Spatial Analysis 2. Spatial Autocorrelation
 Spatial Analysis 2 Spatial Autocorrelation Spatial Autocorrelation a relationship between nearby spatial units of the same variable If, for every pair of subareas i and j in the study region, the drawings
OPEN GEODA WORKSHOP / CRASH COURSE FACILITATED BY M. KOLAK
 OPEN GEODA WORKSHOP / CRASH COURSE FACILITATED BY M. KOLAK WHAT IS GEODA? Software program that serves as an introduction to spatial data analysis Free Open Source Source code is available under GNU license
EXPLORATORY SPATIAL DATA ANALYSIS OF BUILDING ENERGY IN URBAN ENVIRONMENTS. Food Machinery and Equipment, Tianjin , China
 EXPLORATORY SPATIAL DATA ANALYSIS OF BUILDING ENERGY IN URBAN ENVIRONMENTS Wei Tian 1,2, Lai Wei 1,2, Pieter de Wilde 3, Song Yang 1,2, QingXin Meng 1 1 College of Mechanical Engineering, Tianjin University
Spatial Analysis 1. Introduction
 Spatial Analysis 1 Introduction Geo-referenced Data (not any data) x, y coordinates (e.g., lat., long.) ------------------------------------------------------ - Table of Data: Obs. # x y Variables -------------------------------------
Geometric Algorithms in GIS
 Geometric Algorithms in GIS GIS Software Dr. M. Gavrilova GIS System What is a GIS system? A system containing spatially referenced data that can be analyzed and converted to new information for a specific
Spatial Analysis I. Spatial data analysis Spatial analysis and inference
 Spatial Analysis I Spatial data analysis Spatial analysis and inference Roadmap Outline: What is spatial analysis? Spatial Joins Step 1: Analysis of attributes Step 2: Preparing for analyses: working with
The Use of Local Moran s I in Determining the Effectiveness of Location for Gas Extraction
 Lauren Heller GIS and GPS Applications in Earth Science December 7, 2009 The Use of Local Moran s I in Determining the Effectiveness of Location for Gas Extraction The base map of gas production in Yuma
VISUALIZING MULTIVARIATE SPATIAL CORRELATION WITH DYNAMICALLY LINKED WINDOWS
 The Regional Economics Applications Laboratory (REAL) is a cooperative venture between the University of Illinois and the Federal Reserve Bank of Chicago focusing on the development and use of analytical
Spatial Regression. 10. Specification Tests (2) Luc Anselin. Copyright 2017 by Luc Anselin, All Rights Reserved
 Luc Anselin. Copyright 2017 by Luc Anselin, All Rights Reserved") Spatial Regression 10. Specification Tests (2) Luc Anselin http://spatial.uchicago.edu 1 robust LM tests higher order tests 2SLS residuals specification search 2 Robust LM Tests 3 Recap and Notation LM-Error
Spatial Regression 10. Specification Tests (2) Luc Anselin http://spatial.uchicago.edu 1 robust LM tests higher order tests 2SLS residuals specification search 2 Robust LM Tests 3 Recap and Notation LM-Error
EXPLORATORY SPATIAL DATA ANALYSIS IN A GEOCOMPUTATIONAL ENVIRONMENT
 EXPLORATORY SPATIAL DATA ANALYSIS IN A GEOCOMPUTATIONAL ENVIRONMENT Luc Anselin Regional Research Institute and Department of Economics West Virginia University P.O. Box 6825 Morgantown, WV 26506 lanselin@wvu.edu
A Local Indicator of Multivariate Spatial Association: Extending Geary s c.
 A Local Indicator of Multivariate Spatial Association: Extending Geary s c. Luc Anselin Center for Spatial Data Science University of Chicago anselin@uchicago.edu November 9, 2017 This research was funded
Spatial Clusters of Rates
 Spatial Clusters of Rates Luc Anselin http://spatial.uchicago.edu concepts EBI local Moran scan statistics Concepts Rates as Risk from counts (spatially extensive) to rates (spatially intensive) rate =
Attribute Data. ArcGIS reads DBF extensions. Data in any statistical software format can be
 This hands on application is intended to introduce you to the foundational methods of spatial data analysis available in GeoDa. We will undertake an exploratory spatial data analysis, of 1,387 southern
This lab exercise will try to answer these questions using spatial statistics in a geographic information system (GIS) context.
 context.") by Introduction Problem Do the patterns of forest fires change over time? Do forest fires occur in clusters, and do the clusters change over time? Is this information useful in fighting forest fires? This
by Introduction Problem Do the patterns of forest fires change over time? Do forest fires occur in clusters, and do the clusters change over time? Is this information useful in fighting forest fires? This
Finding Hot Spots in ArcGIS Online: Minimizing the Subjectivity of Visual Analysis. Nicholas M. Giner Esri Parrish S.
 Finding Hot Spots in ArcGIS Online: Minimizing the Subjectivity of Visual Analysis Nicholas M. Giner Esri Parrish S. Henderson FBI Agenda The subjectivity of maps What is Hot Spot Analysis? Why do Hot
Creating and Managing a W Matrix
 Creating and Managing a W Matrix Carlos Hurtado Department of Economics University of Illinois at Urbana-Champaign hrtdmrt2@illinois.edu Junel 22th, 2016 C. Hurtado (UIUC - Economics) Spatial Econometrics
Basics of Geographic Analysis in R
 Basics of Geographic Analysis in R Spatial Autocorrelation and Spatial Weights Yuri M. Zhukov GOV 2525: Political Geography February 25, 2013 Outline 1. Introduction 2. Spatial Data and Basic Visualization
The GeoDa Book. Exploring Spatial Data. Luc Anselin
 The GeoDa Book Exploring Spatial Data Luc Anselin Copyright 2017 by GeoDa Press LLC All rights reserved. ISBN: 0-9863421-2-2 ISBN-13: 978-0-9863421-2-7 GeoDa Press LLC, Chicago, IL GeoDa TM is a trade
An Introduction to Pattern Statistics
 An Introduction to Pattern Statistics Nearest Neighbors The CSR hypothesis Clark/Evans and modification Cuzick and Edwards and controls All events k function Weighted k function Comparative k functions
Experimental Design and Data Analysis for Biologists
 Experimental Design and Data Analysis for Biologists Gerry P. Quinn Monash University Michael J. Keough University of Melbourne CAMBRIDGE UNIVERSITY PRESS Contents Preface page xv I I Introduction 1 1.1
Geographical Information Systems Institute. Center for Geographic Analysis, Harvard University. GeoDa: Exploratory Spatial Data Analysis
 Geographical Information Systems Institute, A. Background GeoDa: Exploratory Spatial Data Analysis From geodacenter.asu.edu: GeoDa is a free software program that serves as an introduction to spatial data
CSISS Tools and Spatial Analysis Software
 CSISS Tools and Spatial Analysis Software June 5, 2006 Stephen A. Matthews Associate Professor of Sociology & Anthropology, Geography and Demography Director of the Geographic Information Analysis Core
2/7/2018. Module 4. Spatial Statistics. Point Patterns: Nearest Neighbor. Spatial Statistics. Point Patterns: Nearest Neighbor
 Spatial Statistics Module 4 Geographers are very interested in studying, understanding, and quantifying the patterns we can see on maps Q: What kinds of map patterns can you think of? There are so many
Spatial Pattern Analysis: Mapping Trends and Clusters
 Esri International User Conference San Diego, California Technical Workshops July 24, 2012 Spatial Pattern Analysis: Mapping Trends and Clusters Lauren M. Scott, PhD Lauren Rosenshein Bennett, MS Presentation
Spatial autocorrelation: robustness of measures and tests
 Spatial autocorrelation: robustness of measures and tests Marie Ernst and Gentiane Haesbroeck University of Liege London, December 14, 2015 Spatial Data Spatial data : geographical positions non spatial
Working Paper No Introduction to Spatial Econometric Modelling. William Mitchell 1. April 2013
 Working Paper No. 01-13 Introduction to Spatial Econometric Modelling William Mitchell 1 April 2013 Centre of Full Employment and Equity The University of Newcastle, Callaghan NSW 2308, Australia Home
Any of 27 linear and nonlinear models may be fit. The output parallels that of the Simple Regression procedure.
 STATGRAPHICS Rev. 9/13/213 Calibration Models Summary... 1 Data Input... 3 Analysis Summary... 5 Analysis Options... 7 Plot of Fitted Model... 9 Predicted Values... 1 Confidence Intervals... 11 Observed
Introduction GeoXp : an R package for interactive exploratory spatial data analysis. Illustration with a data set of schools in Midi-Pyrénées.
 Presentation of Presentation of Use of Introduction : an R package for interactive exploratory spatial data analysis. Illustration with a data set of schools in Midi-Pyrénées. Authors of : Christine Thomas-Agnan,
Spatial Data Mining. Regression and Classification Techniques
 Spatial Data Mining Regression and Classification Techniques 1 Spatial Regression and Classisfication Discrete class labels (left) vs. continues quantities (right) measured at locations (2D for geographic
Concepts and Applications of Kriging. Eric Krause Konstantin Krivoruchko
 Concepts and Applications of Kriging Eric Krause Konstantin Krivoruchko Outline Introduction to interpolation Exploratory spatial data analysis (ESDA) Using the Geostatistical Wizard Validating interpolation
Spatial Data, Spatial Analysis and Spatial Data Science
 Spatial Data, Spatial Analysis and Spatial Data Science Luc Anselin http://spatial.uchicago.edu 1 spatial thinking in the social sciences spatial analysis spatial data science spatial data types and research
Spatial correlation and demography.
 Spatial correlation and demography. Sébastien Oliveau, Christophe Guilmoto To cite this version: Sébastien Oliveau, Christophe Guilmoto. Spatial correlation and demography.: Exploring India s demographic
STARS: Space-Time Analysis of Regional Systems
 STARS: Space-Time Analysis of Regional Systems Sergio J. Rey Mark V. Janikas April 27, 2004 Abstract Space-Time Analysis of Regional Systems (STARS) is an open source package designed for dynamic exploratory
I don t have much to say here: data are often sampled this way but we more typically model them in continuous space, or on a graph
 Spatial analysis Huge topic! Key references Diggle (point patterns); Cressie (everything); Diggle and Ribeiro (geostatistics); Dormann et al (GLMMs for species presence/abundance); Haining; (Pinheiro and
Identification of Regional Subcenters Using Spatial Data Analysis for Estimating Traffic Volume
 Identification of Regional Subcenters Using Spatial Data Analysis for Estimating Traffic Volume Fang Zhao and Nokil Park Lehman Center for Transportation Research Department of Civil & Env.. Engineering
Spatial Pattern Analysis: Mapping Trends and Clusters. Lauren M. Scott, PhD Lauren Rosenshein Bennett, MS
 Spatial Pattern Analysis: Mapping Trends and Clusters Lauren M. Scott, PhD Lauren Rosenshein Bennett, MS Presentation Outline Spatial statistics overview Describing spatial patterns Quantifying spatial
Concepts and Applications of Kriging. Eric Krause
 Concepts and Applications of Kriging Eric Krause Sessions of note Tuesday ArcGIS Geostatistical Analyst - An Introduction 8:30-9:45 Room 14 A Concepts and Applications of Kriging 10:15-11:30 Room 15 A
Kriging Luc Anselin, All Rights Reserved
 Kriging Luc Anselin Spatial Analysis Laboratory Dept. Agricultural and Consumer Economics University of Illinois, Urbana-Champaign http://sal.agecon.uiuc.edu Outline Principles Kriging Models Spatial Interpolation
Outline. Geographic Information Analysis & Spatial Data. Spatial Analysis is a Key Term. Lecture #1
 Geographic Information Analysis & Spatial Data Lecture #1 Outline Introduction Spatial Data Types: Objects vs. Fields Scale of Attribute Measures GIS and Spatial Analysis Spatial Analysis is a Key Term
Spatial and Temporal Geovisualisation and Data Mining of Road Traffic Accidents in Christchurch, New Zealand
 166 Spatial and Temporal Geovisualisation and Data Mining of Road Traffic Accidents in Christchurch, New Zealand Clive E. SABEL and Phil BARTIE Abstract This paper outlines the development of a method
DIFFERENT INFLUENCES OF SOCIOECONOMIC FACTORS ON THE HUNTING AND FISHING LICENSE SALES IN COOK COUNTY, IL
 DIFFERENT INFLUENCES OF SOCIOECONOMIC FACTORS ON THE HUNTING AND FISHING LICENSE SALES IN COOK COUNTY, IL Xiaohan Zhang and Craig Miller Illinois Natural History Survey University of Illinois at Urbana
Finding Hot Spots in ArcGIS Online: Minimizing the Subjectivity of Visual Analysis. Nicholas M. Giner Esri Parrish S.
 Finding Hot Spots in ArcGIS Online: Minimizing the Subjectivity of Visual Analysis Nicholas M. Giner Esri Parrish S. Henderson - FBI Agenda The subjectivity of maps What is Hot Spot Analysis? What is Outlier
Lecture 4. Spatial Statistics
 Lecture 4 Spatial Statistics Lecture 4 Outline Statistics in GIS Spatial Metrics Cell Statistics Neighborhood Functions Neighborhood and Zonal Statistics Mapping Density (Density surfaces) Hot Spot Analysis
GIS and Spatial Statistics: One World View or Two? Michael F. Goodchild University of California Santa Barbara
 GIS and Spatial Statistics: One World View or Two? Michael F. Goodchild University of California Santa Barbara Location as attribute The data table Census summary table What value is location as an explanatory
Tracey Farrigan Research Geographer USDA-Economic Research Service
 Rural Poverty Symposium Federal Reserve Bank of Atlanta December 2-3, 2013 Tracey Farrigan Research Geographer USDA-Economic Research Service Justification Increasing demand for sub-county analysis Policy
Lecture 6: Hypothesis Testing
 Lecture 6: Hypothesis Testing Mauricio Sarrias Universidad Católica del Norte November 6, 2017 1 Moran s I Statistic Mandatory Reading Moran s I based on Cliff and Ord (1972) Kelijan and Prucha (2001)
The Use of Spatial Weights Matrices and the Effect of Geometry and Geographical Scale
 The Use of Spatial Weights Matrices and the Effect of Geometry and Geographical Scale António Manuel RODRIGUES 1, José António TENEDÓRIO 2 1 Research fellow, e-geo Centre for Geography and Regional Planning,
Lecture 1: Introduction to Spatial Econometric
 Lecture 1: Introduction to Spatial Econometric Professor: Mauricio Sarrias Universidad Católica del Norte September 7, 2017 1 Introduction to Spatial Econometric Mandatory Reading Why do We Need Spatial
Concepts and Applications of Kriging
 Esri International User Conference San Diego, California Technical Workshops July 24, 2012 Concepts and Applications of Kriging Konstantin Krivoruchko Eric Krause Outline Intro to interpolation Exploratory
A GEOSTATISTICAL APPROACH TO PREDICTING A PHYSICAL VARIABLE THROUGH A CONTINUOUS SURFACE
 Katherine E. Williams University of Denver GEOG3010 Geogrpahic Information Analysis April 28, 2011 A GEOSTATISTICAL APPROACH TO PREDICTING A PHYSICAL VARIABLE THROUGH A CONTINUOUS SURFACE Overview Data
Sensitivity Analysis of Boundary Detection on Spatial Features of Heterogeneous Landscape
 ISPRS SIPT IGU UCI CIG ACSG Table of contents Table des matières Authors index Index des auteurs Search Recherches Exit Sortir Sensitivity Analysis of Boundary Detection on Spatial Features of Heterogeneous
Where to Invest Affordable Housing Dollars in Polk County?: A Spatial Analysis of Opportunity Areas
 Resilient Neighborhoods Technical Reports and White Papers Resilient Neighborhoods Initiative 6-2014 Where to Invest Affordable Housing Dollars in Polk County?: A Spatial Analysis of Opportunity Areas
Spatial Regression. 6. Specification Spatial Heterogeneity. Luc Anselin.
 Spatial Regression 6. Specification Spatial Heterogeneity Luc Anselin http://spatial.uchicago.edu 1 homogeneity and heterogeneity spatial regimes spatially varying coefficients spatial random effects 2
Outline. 15. Descriptive Summary, Design, and Inference. Descriptive summaries. Data mining. The centroid
 Outline 15. Descriptive Summary, Design, and Inference Geographic Information Systems and Science SECOND EDITION Paul A. Longley, Michael F. Goodchild, David J. Maguire, David W. Rhind 2005 John Wiley
Glossary for the Triola Statistics Series
 Glossary for the Triola Statistics Series Absolute deviation The measure of variation equal to the sum of the deviations of each value from the mean, divided by the number of values Acceptance sampling
GIS Spatial Statistics for Public Opinion Survey Response Rates
 GIS Spatial Statistics for Public Opinion Survey Response Rates July 22, 2015 Timothy Michalowski Senior Statistical GIS Analyst Abt SRBI - New York, NY t.michalowski@srbi.com www.srbi.com Introduction
Spatial Analysis II. Spatial data analysis Spatial analysis and inference
 Spatial Analysis II Spatial data analysis Spatial analysis and inference Roadmap Spatial Analysis I Outline: What is spatial analysis? Spatial Joins Step 1: Analysis of attributes Step 2: Preparing for
Overview of Statistical Analysis of Spatial Data
 Overview of Statistical Analysis of Spatial Data Geog 2C Introduction to Spatial Data Analysis Phaedon C. Kyriakidis www.geog.ucsb.edu/ phaedon Department of Geography University of California Santa Barbara
11. Kriging. ACE 492 SA - Spatial Analysis Fall 2003
 11. Kriging ACE 492 SA - Spatial Analysis Fall 2003 c 2003 by Luc Anselin, All Rights Reserved 1 Objectives The goal of this lab is to further familiarize yourself with ESRI s Geostatistical Analyst, extending
The Analysis of Sustainability Development of Eastern and South Eastern Europe in the Post Socialist Period
 The Analysis of Sustainability Development of Eastern and South Eastern Europe in the Post Socialist Period Fatih Çelebioğlu Dumlupınar University, Faculty of Economics and Administrative Sciences, Department
Institute of Actuaries of India
 Institute of Actuaries of India Subject CT3 Probability and Mathematical Statistics For 2018 Examinations Subject CT3 Probability and Mathematical Statistics Core Technical Syllabus 1 June 2017 Aim The
In matrix algebra notation, a linear model is written as
 DM3 Calculation of health disparity Indices Using Data Mining and the SAS Bridge to ESRI Mussie Tesfamicael, University of Louisville, Louisville, KY Abstract Socioeconomic indices are strongly believed
Map your way to deeper insights
 Map your way to deeper insights Target, forecast and plan by geographic region Highlights Apply your data to pre-installed map templates and customize to meet your needs. Select from included map files
Prentice Hall Stats: Modeling the World 2004 (Bock) Correlated to: National Advanced Placement (AP) Statistics Course Outline (Grades 9-12)
 Correlated to: National Advanced Placement (AP) Statistics Course Outline (Grades 9-12)") National Advanced Placement (AP) Statistics Course Outline (Grades 9-12) Following is an outline of the major topics covered by the AP Statistics Examination. The ordering here is intended to define the
National Advanced Placement (AP) Statistics Course Outline (Grades 9-12) Following is an outline of the major topics covered by the AP Statistics Examination. The ordering here is intended to define the
Mapcube and Mapview. Two Web-based Spatial Data Visualization and Mining Systems. C.T. Lu, Y. Kou, H. Wang Dept. of Computer Science Virginia Tech
 Mapcube and Mapview Two Web-based Spatial Data Visualization and Mining Systems C.T. Lu, Y. Kou, H. Wang Dept. of Computer Science Virginia Tech S. Shekhar, P. Zhang, R. Liu Dept. of Computer Science University
Concepts and Applications of Kriging
 2013 Esri International User Conference July 8 12, 2013 San Diego, California Technical Workshop Concepts and Applications of Kriging Eric Krause Konstantin Krivoruchko Outline Intro to interpolation Exploratory
Local Indicators of Spatial Association-LISA
 Luc Amelin Local Indicators of Spatial Association-LISA The capabilities for uisualization, rapid data retrieual, and manipulation in geographic informution systems (GIS) haue created the need for new
Testing for global spatial autocorrelation in Stata
 Testing for global spatial autocorrelation in Stata Keisuke Kondo March 31, 2018 (moransi: version 1.00) Abstract This paper introduces the new Stata command moransi, which computes Moran s I statistic
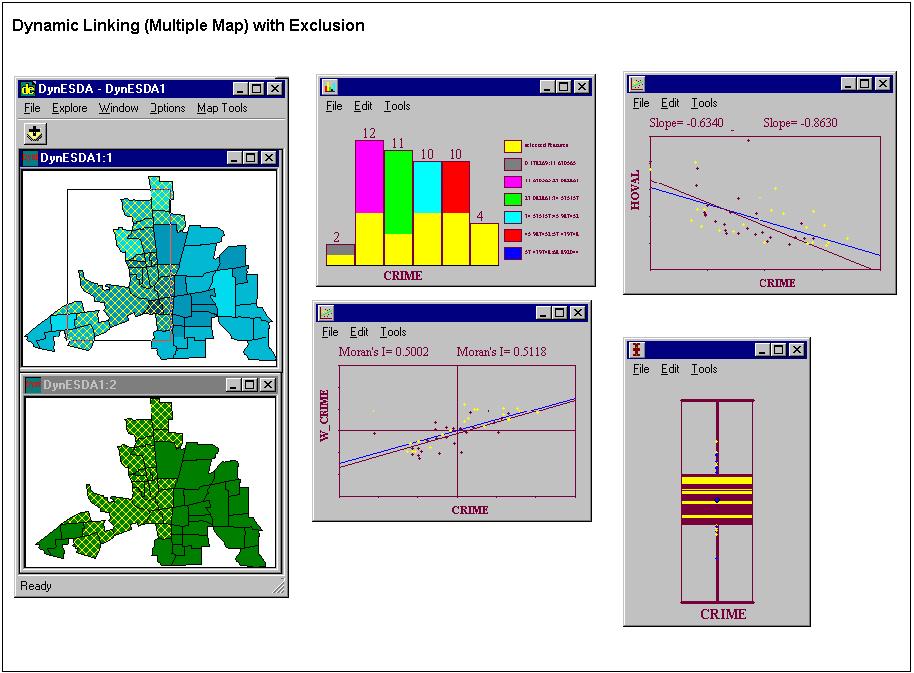
VISUALIZING SPATIAL AUTOCORRELATION WITH DYNAMICALLY LINKED WINDOWS by Luc Anselin, Ibnu Syabri, Oleg Smirnov and Yanqui Ren
 The Regional Economics Applications Laboratory (REAL) is a cooperative venture between the University of Illinois and the Federal Reserve Bank of Chicago focusing on the development and use of analytical
Spatial Investigation of Mineral Transportation Characteristics in the State of Washington
 Khachatryan, Jessup 1 Spatial Investigation of Mineral Transportation Characteristics in the State of Washington Hayk Khachatryan Graduate Student Email: hkhachatryan@wsu.edu Eric L. Jessup Assistant Professor
I L L I N O I S UNIVERSITY OF ILLINOIS AT URBANA-CHAMPAIGN
 Introduction Edps/Psych/Stat/ 584 Applied Multivariate Statistics Carolyn J Anderson Department of Educational Psychology I L L I N O I S UNIVERSITY OF ILLINOIS AT URBANA-CHAMPAIGN c Board of Trustees,
Identification of local multivariate outliers
 Noname manuscript No. (will be inserted by the editor) Identification of local multivariate outliers Peter Filzmoser Anne Ruiz-Gazen Christine Thomas-Agnan Received: date / Accepted: date Abstract The
Trendlines Simple Linear Regression Multiple Linear Regression Systematic Model Building Practical Issues
 Trendlines Simple Linear Regression Multiple Linear Regression Systematic Model Building Practical Issues Overfitting Categorical Variables Interaction Terms Non-linear Terms Linear Logarithmic y = a +