Spatial Autocorrelation (2) Spatial Weights
|
|
|
- Harry Greene
- 5 years ago
- Views:
Transcription
1 Spatial Autocorrelation (2) Spatial Weights Luc Anselin Spatial Analysis Laboratory Dept. Agricultural and Consumer Economics University of Illinois, Urbana-Champaign
2 Outline Concepts Contiguity Weights Other Spatial Weights Spatial Lag Operator
3 Concepts
4 Why Spatial Weights? Spatial Correlation Cov[y i.y h ] 0, for i h Structure of Correlation which i, h interact? N observations to estimate N(N-1)/2 interactions impose structure in terms of what are the neighbors for each location

5 Example: N=6 contiguity = common boundary
6 contiguity as a graph link between nodes = contiguity
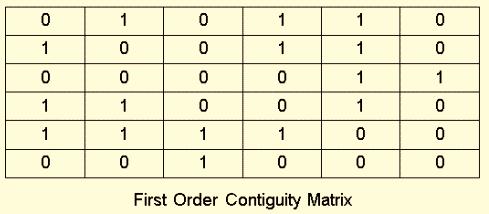
7
8 Spatial Weights Matrix Definition N by N positive matrix W, with elements w ij Simplest Form: Binary Contiguity w ij = 1 for i and j neighbors (e.g. d ij < critical distance) w ij = 0 otherwise, w ii = 0 by convention Row Standardization averaging of neighboring values w s ij = w ij / Σ j w ij such that Σ j ws ij = 1 spatial parameters comparable
9 How to Construct Weights Contiguity common boundary Distance distance band k-nearest neighbors General social distance complex distance decay functions
10 Contiguity Weights
11 Contiguity Regular Grid Regular Grid rook 2, 4, 6, 8 bishop 1, 3, 7, 9 queen both

12 Regular Grid Polygons


13 Contiguity and GIS Precision The regular grid in the top picture is actually misaligned at the corners The grid on the bottom picture has the proper contiguity

14 Contiguity Irregular Units Irregular Units common border rook common vertex 039 and 067 queen
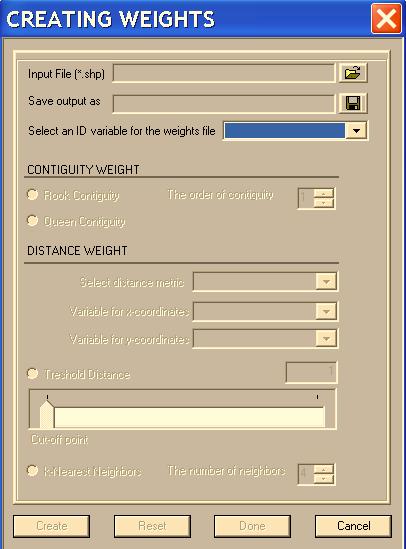
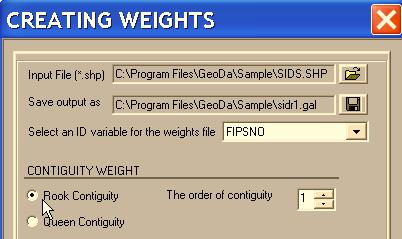
15 Contiguity Weights in GeoDa
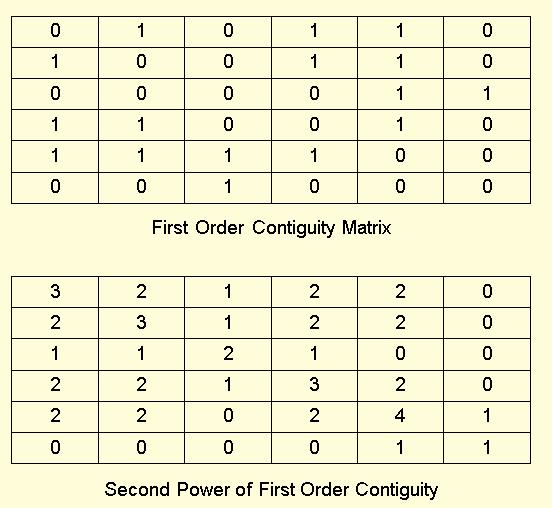
16 Higher Order Contiguity Recursive Definition j contiguous to i of order p: j first order contiguous to k k contiguous to i of order p-1 i and j not already contiguous of lower order Spatial Weights Matrix representation of network or graph

17 contiguity as a graph link between nodes = contiguity
18 Circularity and Redundancy in Higher Order Weights Powering of the Weights Matrix standard approach invalid for contiguity Removing Circularity and Redundancy sparse network representation of weights modified Dijkstra algorithm to identify number of steps between nearest neighbors (Anselin and Smirnov) number of steps = order of contiguity
19
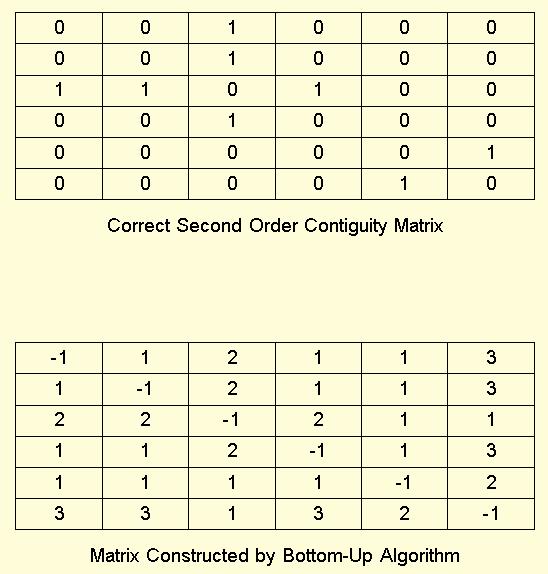
20
21 Other Spatial Weights
22 Distance-Based Weights Distance Band w ij = 1 for d ij < distance cut-off K-Nearest Neighbor Weights k neighbors, irrespective of actual distance warps space

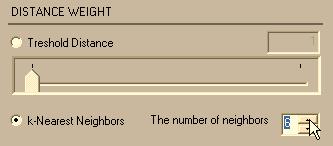
23 Distance Based Weights
24 General Spatial Weights Cliff-Ord Weights w ij to reflect potential spatial interaction between i and j w ij = [d ij ] -a.[b ij ] b with d ij as distance between i and j b ij as share of common boundary between i and j in perimeter of i
25 General Spatial Weights (continued) Weights May Contain Parameters inverse distance weights w ij = 1 / d ij α estimated from data or chosen a priori in practice: second power (gravity model) identification problems in nonlinear weights interaction is multiplicative: ρ. w ij = ρ (1 / d ijα ) parameters ρ and α not separately identified
26 General Spatial Weights (continued) Economic Weights (Case) block structure, state effect w ij = 1 for all i, j in block economic distance r i - r j economic weight = 1/ r i - r j e.g., r = total employment
27 Characteristics of Spatial Weights Measures of Overall Connectedness percent nonzero weights (sparseness) average weight average number of links principal eigenvalue Location-Specific Measures most/least connected observations unconnected observations = islands

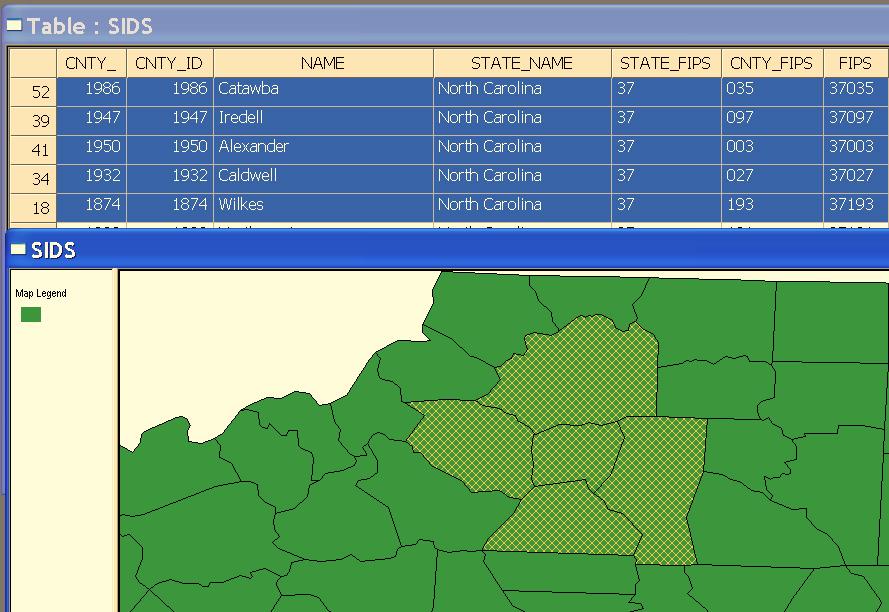
28 NC Counties with 4 Neighbors
29 Spatial Lag Operator
30 Spatial Shift No Direct Counterpart to Time Series Shift Operator time series: L k = y t-k spatial series: which h are shifted by k from location i? on regular lattice: east, west, north, south (i - 1, j) (i + 1, j) (i, j - 1) (i, j + 1) arbitrary for irregular lattice different number of neighbors by observation
31 Spatial Lag Operator Distributed Lag row-standardized weights Σ j w ij = 1 spatial lag is weighted average of neighboring values Σ j w ij.y j, for each i vector Wy spatial lag does not contain y i spatial lag is a smoother not a window average
$50,200 + (1/4)$64,600 + (1/4)$45,000 + (1/4)$34,200 =")
32 value y i = $42,300 4 neighbors values for neighbors: $50,200, $64,600, $45,000, $34,200 spatial lag = (1/4)$50,200 + (1/4)$64,600 + (1/4)$45,000 + (1/4)$34,200 = $48,500
33

34 Spatial Lags in GeoDa Table
35
Spatial Autocorrelation
 Spatial Autocorrelation Luc Anselin http://spatial.uchicago.edu spatial randomness positive and negative spatial autocorrelation spatial autocorrelation statistics spatial weights Spatial Randomness The
Spatial Regression. 1. Introduction and Review. Luc Anselin. Copyright 2017 by Luc Anselin, All Rights Reserved
 Spatial Regression 1. Introduction and Review Luc Anselin http://spatial.uchicago.edu matrix algebra basics spatial econometrics - definitions pitfalls of spatial analysis spatial autocorrelation spatial
Using AMOEBA to Create a Spatial Weights Matrix and Identify Spatial Clusters, and a Comparison to Other Clustering Algorithms
 Using AMOEBA to Create a Spatial Weights Matrix and Identify Spatial Clusters, and a Comparison to Other Clustering Algorithms Arthur Getis* and Jared Aldstadt** *San Diego State University **SDSU/UCSB
Basics of Geographic Analysis in R
 Basics of Geographic Analysis in R Spatial Autocorrelation and Spatial Weights Yuri M. Zhukov GOV 2525: Political Geography February 25, 2013 Outline 1. Introduction 2. Spatial Data and Basic Visualization
Rate Maps and Smoothing
 Rate Maps and Smoothing Luc Anselin Spatial Analysis Laboratory Dept. Agricultural and Consumer Economics University of Illinois, Urbana-Champaign http://sal.agecon.uiuc.edu Outline Mapping Rates Risk
Exploratory Spatial Data Analysis and GeoDa
 Exploratory Spatial Data Analysis and GeoDa Luc Anselin Spatial Analysis Laboratory Dept. Agricultural and Consumer Economics University of Illinois, Urbana-Champaign http://sal.agecon.uiuc.edu Outline
Luc Anselin Spatial Analysis Laboratory Dept. Agricultural and Consumer Economics University of Illinois, Urbana-Champaign
 GIS and Spatial Analysis Luc Anselin Spatial Analysis Laboratory Dept. Agricultural and Consumer Economics University of Illinois, Urbana-Champaign http://sal.agecon.uiuc.edu Outline GIS and Spatial Analysis
Outline ESDA. Exploratory Spatial Data Analysis ESDA. Luc Anselin
 Exploratory Spatial Data Analysis ESDA Luc Anselin University of Illinois, Urbana-Champaign http://www.spacestat.com Outline ESDA Exploring Spatial Patterns Global Spatial Autocorrelation Local Spatial
Creating and Managing a W Matrix
 Creating and Managing a W Matrix Carlos Hurtado Department of Economics University of Illinois at Urbana-Champaign hrtdmrt2@illinois.edu Junel 22th, 2016 C. Hurtado (UIUC - Economics) Spatial Econometrics
Kriging Luc Anselin, All Rights Reserved
 Kriging Luc Anselin Spatial Analysis Laboratory Dept. Agricultural and Consumer Economics University of Illinois, Urbana-Champaign http://sal.agecon.uiuc.edu Outline Principles Kriging Models Spatial Interpolation
Mapping and Analysis for Spatial Social Science
 Mapping and Analysis for Spatial Social Science Luc Anselin Spatial Analysis Laboratory Dept. Agricultural and Consumer Economics University of Illinois, Urbana-Champaign http://sal.agecon.uiuc.edu Outline
SPACE Workshop NSF NCGIA CSISS UCGIS SDSU. Aldstadt, Getis, Jankowski, Rey, Weeks SDSU F. Goodchild, M. Goodchild, Janelle, Rebich UCSB
 SPACE Workshop NSF NCGIA CSISS UCGIS SDSU Aldstadt, Getis, Jankowski, Rey, Weeks SDSU F. Goodchild, M. Goodchild, Janelle, Rebich UCSB August 2-8, 2004 San Diego State University Some Examples of Spatial
Exploratory Spatial Data Analysis Using GeoDA: : An Introduction
 Exploratory Spatial Data Analysis Using GeoDA: : An Introduction Prepared by Professor Ravi K. Sharma, University of Pittsburgh Modified for NBDPN 2007 Conference Presentation by Professor Russell S. Kirby,
Spatial Tools for Econometric and Exploratory Analysis
 Spatial Tools for Econometric and Exploratory Analysis Michael F. Goodchild University of California, Santa Barbara Luc Anselin University of Illinois at Urbana-Champaign http://csiss.org Outline A Quick
Spatial Analysis 2. Spatial Autocorrelation
 Spatial Analysis 2 Spatial Autocorrelation Spatial Autocorrelation a relationship between nearby spatial units of the same variable If, for every pair of subareas i and j in the study region, the drawings
Areal Unit Data Regular or Irregular Grids or Lattices Large Point-referenced Datasets
 Areal Unit Data Regular or Irregular Grids or Lattices Large Point-referenced Datasets Is there spatial pattern? Chapter 3: Basics of Areal Data Models p. 1/18 Areal Unit Data Regular or Irregular Grids
OPEN GEODA WORKSHOP / CRASH COURSE FACILITATED BY M. KOLAK
 OPEN GEODA WORKSHOP / CRASH COURSE FACILITATED BY M. KOLAK WHAT IS GEODA? Software program that serves as an introduction to spatial data analysis Free Open Source Source code is available under GNU license
Spatial Trends of unpaid caregiving in Ireland
 Spatial Trends of unpaid caregiving in Ireland Stamatis Kalogirou 1,*, Ronan Foley 2 1. NCG Affiliate, Thoukididi 20, Drama, 66100, Greece; Tel: +30 6977 476776; Email: skalogirou@gmail.com; Web: http://www.gisc.gr.
Temporal vs. Spatial Data
 Temporal vs. Spatial Data Temporal 1 dimensional Units: day, week, month Lag: t, t-1, t-2 Durbin-Watson Spatial 2-3 dimensional Units: county, mile, region Lag: near neighbor, networks (?) Moran s I Differencing
Lecture 3: Exploratory Spatial Data Analysis (ESDA) Prof. Eduardo A. Haddad
 Prof. Eduardo A. Haddad") Lecture 3: Exploratory Spatial Data Analysis (ESDA) Prof. Eduardo A. Haddad Key message Spatial dependence First Law of Geography (Waldo Tobler): Everything is related to everything else, but near things
Lecture 3: Exploratory Spatial Data Analysis (ESDA) Prof. Eduardo A. Haddad Key message Spatial dependence First Law of Geography (Waldo Tobler): Everything is related to everything else, but near things
EXPLORATORY SPATIAL DATA ANALYSIS OF BUILDING ENERGY IN URBAN ENVIRONMENTS. Food Machinery and Equipment, Tianjin , China
 EXPLORATORY SPATIAL DATA ANALYSIS OF BUILDING ENERGY IN URBAN ENVIRONMENTS Wei Tian 1,2, Lai Wei 1,2, Pieter de Wilde 3, Song Yang 1,2, QingXin Meng 1 1 College of Mechanical Engineering, Tianjin University
The Study on Trinary Join-Counts for Spatial Autocorrelation
 Proceedings of the 8th International Symposium on Spatial Accuracy Assessment in Natural Resources and Environmental Sciences Shanghai, P. R. China, June 5-7, 008, pp. -8 The Study on Trinary Join-Counts
2015 JOURNAL OF ASFMRA
 How Spatially Clustered are State-level Farmland Values? By Terry Griffin, Gregg Ibendahl, and Tyler Mark ABSTRACT Farmland values are influenced by productivity levels, prices of pertinent crops, farm
Introduction to Spatial Statistics and Modeling for Regional Analysis
 Introduction to Spatial Statistics and Modeling for Regional Analysis Dr. Xinyue Ye, Assistant Professor Center for Regional Development (Department of Commerce EDA University Center) & School of Earth,
Measures of Spatial Dependence
 Measures of Spatial Dependence Carlos Hurtado Department of Economics University of Illinois at Urbana-Champaign hrtdmrt2@illinois.edu Junel 30th, 2016 C. Hurtado (UIUC - Economics) Spatial Econometrics
Areal data. Infant mortality, Auckland NZ districts. Number of plant species in 20cm x 20 cm patches of alpine tundra. Wheat yield
 Areal data Reminder about types of data Geostatistical data: Z(s) exists everyhere, varies continuously Can accommodate sudden changes by a model for the mean E.g., soil ph, two soil types with different
Lecture 1: Introduction to Spatial Econometric
 Lecture 1: Introduction to Spatial Econometric Professor: Mauricio Sarrias Universidad Católica del Norte September 7, 2017 1 Introduction to Spatial Econometric Mandatory Reading Why do We Need Spatial
Finding Hot Spots in ArcGIS Online: Minimizing the Subjectivity of Visual Analysis. Nicholas M. Giner Esri Parrish S.
 Finding Hot Spots in ArcGIS Online: Minimizing the Subjectivity of Visual Analysis Nicholas M. Giner Esri Parrish S. Henderson FBI Agenda The subjectivity of maps What is Hot Spot Analysis? Why do Hot
The Use of Spatial Weights Matrices and the Effect of Geometry and Geographical Scale
 The Use of Spatial Weights Matrices and the Effect of Geometry and Geographical Scale António Manuel RODRIGUES 1, José António TENEDÓRIO 2 1 Research fellow, e-geo Centre for Geography and Regional Planning,
Spatial Effects and Externalities
 Spatial Effects and Externalities Philip A. Viton November 5, Philip A. Viton CRP 66 Spatial () Externalities November 5, / 5 Introduction If you do certain things to your property for example, paint your
CHAPTER 3 APPLICATION OF MULTIVARIATE TECHNIQUE SPATIAL ANALYSIS ON RURAL POPULATION UNDER POVERTYLINE FROM OFFICIAL STATISTICS, THE WORLD BANK
 CHAPTER 3 APPLICATION OF MULTIVARIATE TECHNIQUE SPATIAL ANALYSIS ON RURAL POPULATION UNDER POVERTYLINE FROM OFFICIAL STATISTICS, THE WORLD BANK 3.1 INTRODUCTION: In regional science, space is a central
Construction Engineering. Research Laboratory. Approaches Towards the Identification of Patterns in Violent Events, Baghdad, Iraq ERDC/CERL CR-09-1
 ERDC/CERL CR-09-1 Approaches Towards the Identification of Patterns in Violent Events, Baghdad, Iraq Luc Anselin and Gianfranco Piras May 2009 Construction Engineering Research Laboratory Approved for
Local Spatial Autocorrelation Clusters
 Local Spatial Autocorrelation Clusters Luc Anselin http://spatial.uchicago.edu LISA principle local Moran local G statistics issues and interpretation LISA Principle Clustering vs Clusters global spatial
Spatial Analysis I. Spatial data analysis Spatial analysis and inference
 Spatial Analysis I Spatial data analysis Spatial analysis and inference Roadmap Outline: What is spatial analysis? Spatial Joins Step 1: Analysis of attributes Step 2: Preparing for analyses: working with
Outline. Overview of Issues. Spatial Regression. Luc Anselin
 Spatial Regression Luc Anselin University of Illinois, Urbana-Champaign http://www.spacestat.com Outline Overview of Issues Spatial Regression Specifications Space-Time Models Spatial Latent Variable Models
Variables and Variable De nitions
 APPENDIX A Variables and Variable De nitions All demographic county-level variables have been drawn directly from the 1970, 1980, and 1990 U.S. Censuses of Population, published by the U.S. Department
Lesson 9 Exploring Graphs of Quadratic Functions
 Exploring Graphs of Quadratic Functions Graph the following system of linear inequalities: { y > 1 2 x 5 3x + 2y 14 a What are three points that are solutions to the system of inequalities? b Is the point
Identification of Economic Clusters Using ArcGIS Spatial Statistics. Joseph Frizado Bruce Smith Michael Carroll
 Identification of Economic Clusters Using ArcGIS Spatial Statistics Joseph Frizado Bruce Smith Michael Carroll ABSTRACT Geographic proximity (co-location) is necessary for potential clustering activity.
Under the hood Issues in the specification and interpretation of spatial regression models
 AGRICULTURAL ECONOMICS ELSEVIER Agricultural Economics 27 (2002) 247-267 www.elsevier.com/locate/agecon Under the hood Issues in the specification and interpretation of spatial regression models Luc Anselin
W-BASED VS LATENT VARIABLES SPATIAL AUTOREGRESSIVE MODELS: EVIDENCE FROM MONTE CARLO SIMULATIONS
 1 W-BASED VS LATENT VARIABLES SPATIAL AUTOREGRESSIVE MODELS: EVIDENCE FROM MONTE CARLO SIMULATIONS An Liu University of Groningen Henk Folmer University of Groningen Wageningen University Han Oud Radboud
Introduction to GIS - 2
 Introduction to GIS - 2 Outline Using GIS Representation of spatial objects in GIS Prof. D. Nagesh Kumar Department of Civil Engineering Indian Institute of Science Bangalore 560 012, India http://www.civil.iisc.ernet.in/~nagesh
2/7/2018. Module 4. Spatial Statistics. Point Patterns: Nearest Neighbor. Spatial Statistics. Point Patterns: Nearest Neighbor
 Spatial Statistics Module 4 Geographers are very interested in studying, understanding, and quantifying the patterns we can see on maps Q: What kinds of map patterns can you think of? There are so many
Geographical Information Systems Institute. Center for Geographic Analysis, Harvard University. GeoDa: Spatial Autocorrelation
 Geographical Information Systems Institute, A. Background From geodacenter.asu.edu: GeoDa is a free software program that serves as an introduction to spatial data analysis. OpenGeoDa is the cross-platform,
Community Health Needs Assessment through Spatial Regression Modeling
 Community Health Needs Assessment through Spatial Regression Modeling Glen D. Johnson, PhD CUNY School of Public Health glen.johnson@lehman.cuny.edu Objectives: Assess community needs with respect to particular
Identification of Regional Subcenters Using Spatial Data Analysis for Estimating Traffic Volume
 Identification of Regional Subcenters Using Spatial Data Analysis for Estimating Traffic Volume Fang Zhao and Nokil Park Lehman Center for Transportation Research Department of Civil & Env.. Engineering
Exploratory Spatial Data Analysis (And Navigating GeoDa)
") Exploratory Spatial Data Analysis (And Navigating GeoDa) June 9, 2006 Stephen A. Matthews Associate Professor of Sociology & Anthropology, Geography and Demography Director of the Geographic Information
Exploratory Spatial Data Analysis (And Navigating GeoDa) June 9, 2006 Stephen A. Matthews Associate Professor of Sociology & Anthropology, Geography and Demography Director of the Geographic Information
Computing the Jacobian in Gaussian spatial models: an illustrated comparison of available methods
 Computing the Jacobian in Gaussian spatial models: an illustrated comparison of available methods 1 1 1 1 1 1 Abstract When fitting spatial regression models by maximum likelihood using spatial weights
SPATIAL DEPENDENCE AND REGIONAL CONVERGENCE IN BRAZIL
 The Regional Economics Applications Laboratory (REAL) is a cooperative venture between the University of Illinois and the Federal Reserve Bank of Chicago focusing on the development and use of analytical
DIFFUSION AND DYNAMIC TREND OF SPATIAL DEPENDENCE
 Congreso de la Asociación Española de Ciencia Regional (XXX Reunión de Estudios Regionales) DIFFUSION AND DYNAMIC TREND OF SPATIAL DEPENDENCE LÓPEZ, F.A. (*) and C. CHASCO (**) (*) Department of Quantitative
Spatial fluctuation on speed-density relationship of pedestrian dynamics
 2017/03/13 ETHZ-IVT Spatial fluctuation on speed-density relationship of pedestrian dynamics NAKANISHI, Wataru Specially Appointed Assistant Professor, Tokyo Institute of Technology nakanishi [at] plan.cv.titech.ac.jp
Nature of Spatial Data. Outline. Spatial Is Special
 Nature of Spatial Data Outline Spatial is special Bad news: the pitfalls of spatial data Good news: the potentials of spatial data Spatial Is Special Are spatial data special? Why spatial data require
Global Spatial Autocorrelation Clustering
 Global Spatial Autocorrelation Clustering Luc Anselin http://spatial.uchicago.edu join count statistics Moran s I Moran scatter plot non-parametric spatial autocorrelation Join Count Statistics Recap -
Types of spatial data. The Nature of Geographic Data. Types of spatial data. Spatial Autocorrelation. Continuous spatial data: geostatistics
 The Nature of Geographic Data Types of spatial data Continuous spatial data: geostatistics Samples may be taken at intervals, but the spatial process is continuous e.g. soil quality Discrete data Irregular:
Working Paper
 Working Paper 2008-12 Dynamic Manipulation of Spatial Weights Using Web Services Sergio J. Rey, Luc Anselin, and Myunghwa Hwang Dynamic Manipulation of Spatial Weights Using Web Services Sergio J. Rey
On A Comparison between Two Measures of Spatial Association
 Journal of Modern Applied Statistical Methods Volume 9 Issue Article 3 5--00 On A Comparison beteen To Measures of Spatial Association Faisal G. Khamis Al-Zaytoonah University of Jordan, faisal_alshamari@yahoo.com
The Improbable Nature of the Implied Correlation Matrix from Spatial Regression Models
 Preliminary Version and Not to be quoted The Improbable Nature of the Implied Correlation Matrix from Spatial Regression Models Monalisa Sen 1 and Anil K. Bera 2 Department of Economics University of Illinois
Points. Luc Anselin. Copyright 2017 by Luc Anselin, All Rights Reserved
 Points Luc Anselin http://spatial.uchicago.edu 1 classic point pattern analysis spatial randomness intensity distance-based statistics points on networks 2 Classic Point Pattern Analysis 3 Classic Examples
RAO s SCORE TEST IN SPATIAL ECONOMETRICS
 RAO s SCORE TEST IN SPATIAL ECONOMETRICS Luc Anselin Regional Economics Applications Laboratory (REAL) and Department of Agricultural and Consumer Economics University of Illinois, Urbana-Champaign Urbana,
Finite Math - J-term Section Systems of Linear Equations in Two Variables Example 1. Solve the system
 Finite Math - J-term 07 Lecture Notes - //07 Homework Section 4. - 9, 0, 5, 6, 9, 0,, 4, 6, 0, 50, 5, 54, 55, 56, 6, 65 Section 4. - Systems of Linear Equations in Two Variables Example. Solve the system
Spatial Regression. 11. Spatial Two Stage Least Squares. Luc Anselin. Copyright 2017 by Luc Anselin, All Rights Reserved
 Spatial Regression 11. Spatial Two Stage Least Squares Luc Anselin http://spatial.uchicago.edu 1 endogeneity and instruments spatial 2SLS best and optimal estimators HAC standard errors 2 Endogeneity and
Spatial Analysis II. Spatial data analysis Spatial analysis and inference
 Spatial Analysis II Spatial data analysis Spatial analysis and inference Roadmap Spatial Analysis I Outline: What is spatial analysis? Spatial Joins Step 1: Analysis of attributes Step 2: Preparing for
Discrete Spatial Distributions Responsible persons: Claude Collet, Dominique Schneuwly, Regis Caloz
 Geographic Information Technology Training Alliance (GITTA) presents: Discrete Spatial Distributions Responsible persons: Claude Collet, Dominique Schneuwly, Regis Caloz Table Of Content 1. Discrete Spatial
Data Mining and Analysis: Fundamental Concepts and Algorithms
 : Fundamental Concepts and Algorithms dataminingbook.info Mohammed J. Zaki 1 Wagner Meira Jr. 2 1 Department of Computer Science Rensselaer Polytechnic Institute, Troy, NY, USA 2 Department of Computer
Lecture 6: Hypothesis Testing
 Lecture 6: Hypothesis Testing Mauricio Sarrias Universidad Católica del Norte November 6, 2017 1 Moran s I Statistic Mandatory Reading Moran s I based on Cliff and Ord (1972) Kelijan and Prucha (2001)
Centrality Measures. Leonid E. Zhukov
 Centrality Measures Leonid E. Zhukov School of Data Analysis and Artificial Intelligence Department of Computer Science National Research University Higher School of Economics Network Science Leonid E.
Introduction. Spatial Processes & Spatial Patterns
 Introduction Spatial data: set of geo-referenced attribute measurements: each measurement is associated with a location (point) or an entity (area/region/object) in geographical (or other) space; the domain
Spatial Investigation of Mineral Transportation Characteristics in the State of Washington
 Khachatryan, Jessup 1 Spatial Investigation of Mineral Transportation Characteristics in the State of Washington Hayk Khachatryan Graduate Student Email: hkhachatryan@wsu.edu Eric L. Jessup Assistant Professor
Visualize and interactively design weight matrices
 Visualize and interactively design weight matrices Angelos Mimis *1 1 Department of Economic and Regional Development, Panteion University of Athens, Greece Tel.: +30 6936670414 October 29, 2014 Summary
SPATIAL PANEL ECONOMETRICS
 Chapter 18 SPATIAL PANEL ECONOMETRICS Luc Anselin University of Illinois, Urbana-Champaign Julie Le Gallo Universit«e Montesquieu-Bordeaux IV Hubert Jayet Universit«e de Lille 1. Introduction Spatial econometrics
USA Mathematical Talent Search Round 2 Solutions Year 27 Academic Year
 1/2/27. In the grid to the right, the shortest path through unit squares between the pair of 2 s has length 2. Fill in some of the unit squares in the grid so that (i) exactly half of the squares in each
Invited presentation at the 2018 Southern Agricultural Economics Association Annual Meeting, February 2-6, 2018, Jacksonville, Florida
 Invited presentation at the 2018 Southern Agricultural Economics Association Annual Meeting, February 2-6, 2018, Jacksonville, Florida Copyright 2018 by Author(s). All rights reserved. Readers may make
Technical Vignette 5: Understanding intrinsic Gaussian Markov random field spatial models, including intrinsic conditional autoregressive models
 Technical Vignette 5: Understanding intrinsic Gaussian Markov random field spatial models, including intrinsic conditional autoregressive models Christopher Paciorek, Department of Statistics, University
Jointly Clustering Rows and Columns of Binary Matrices: Algorithms and Trade-offs
 Jointly Clustering Rows and Columns of Binary Matrices: Algorithms and Trade-offs Jiaming Xu Joint work with Rui Wu, Kai Zhu, Bruce Hajek, R. Srikant, and Lei Ying University of Illinois, Urbana-Champaign
QR FACTORIZATIONS USING A RESTRICTED SET OF ROTATIONS
 QR FACTORIZATIONS USING A RESTRICTED SET OF ROTATIONS DIANNE P. O LEARY AND STEPHEN S. BULLOCK Dedicated to Alan George on the occasion of his 60th birthday Abstract. Any matrix A of dimension m n (m n)
Analyzing spatial autoregressive models using Stata
 Analyzing spatial autoregressive models using Stata David M. Drukker StataCorp Summer North American Stata Users Group meeting July 24-25, 2008 Part of joint work with Ingmar Prucha and Harry Kelejian
Algorithms for Picture Analysis. Lecture 07: Metrics. Axioms of a Metric
 Axioms of a Metric Picture analysis always assumes that pictures are defined in coordinates, and we apply the Euclidean metric as the golden standard for distance (or derived, such as area) measurements.
Spatial Data Mining. Regression and Classification Techniques
 Spatial Data Mining Regression and Classification Techniques 1 Spatial Regression and Classisfication Discrete class labels (left) vs. continues quantities (right) measured at locations (2D for geographic
EE/ACM Applications of Convex Optimization in Signal Processing and Communications Lecture 18
 EE/ACM 150 - Applications of Convex Optimization in Signal Processing and Communications Lecture 18 Andre Tkacenko Signal Processing Research Group Jet Propulsion Laboratory May 31, 2012 Andre Tkacenko
This lab exercise will try to answer these questions using spatial statistics in a geographic information system (GIS) context.
 context.") by Introduction Problem Do the patterns of forest fires change over time? Do forest fires occur in clusters, and do the clusters change over time? Is this information useful in fighting forest fires? This
by Introduction Problem Do the patterns of forest fires change over time? Do forest fires occur in clusters, and do the clusters change over time? Is this information useful in fighting forest fires? This
Types of Spatial Data
 Spatial Data Types of Spatial Data Point pattern Point referenced geostatistical Block referenced Raster / lattice / grid Vector / polygon Point Pattern Data Interested in the location of points, not their
Tests forspatial Lag Dependence Based onmethodof Moments Estimation
 1 Tests forspatial Lag Dependence Based onmethodof Moments Estimation by Luz A. Saavedra* Department of Economics University of South Florida 4202 East Fowler Ave. BSN 3111 Tampa, FL 33620-5524 lsaavedr@coba.usf.edu
Franck Nadaud-CIRED Mário Jorge Mendonca- IPEA
 The Structural Dynamic Model of Land Use in Brazilian Amazon Franck Nadaud-CIRED Mário Jorge Mendonca- IPEA Objective This article investigates the dynamic of land use in Brazilian Amazon. We adopt the
Modeling the Ecology of Urban Inequality in Space and Time
 Modeling the Ecology of Urban Inequality in Space and Time Corina Graif PhD Candidate, Department Of Sociology Harvard University Presentation for the Workshop on Spatial and Temporal Modeling, Center
Network data in regression framework
 13-14 July 2009 University of Salerno (Italy) Network data in regression framework Maria ProsperinaVitale Department of Economics and Statistics University of Salerno (Italy) mvitale@unisa.it - Theoretical
The Retreating Glaciers of Mt. Jefferson, Oregon. Using EET Methods in Student Research Projects
 The Retreating Glaciers of Mt. Jefferson, Oregon Using EET Methods in Student Research Projects Image Hemphill, 2006 Earth Exploration Toolbook: Chapters Used Measuring Distance and Area in Satellite Images
Laplacian Eigenmaps for Dimensionality Reduction and Data Representation
 Laplacian Eigenmaps for Dimensionality Reduction and Data Representation Neural Computation, June 2003; 15 (6):1373-1396 Presentation for CSE291 sp07 M. Belkin 1 P. Niyogi 2 1 University of Chicago, Department
Metrics: Growth, dimension, expansion
 Metrics: Growth, dimension, expansion Social and Technological Networks Rik Sarkar University of Edinburgh, 2017. Metric A distance measure d is a metric if: d(u,v) 0 d(u,v) = 0 iff u=v d(u,v) = d(u,v)
The SLX model: Extensions and the sensitivity of spatial spillovers to W
 The SLX model: Extensions and the sensitivity of spatial spillovers to W J. Paul Elhorst a and Solmaria Halleck Vega a,b Elhorst J.P., Halleck Vega S.M (2017, English translation) The SLX model: Extensions
Time Series Classification
 Distance Measures Classifiers DTW vs. ED Further Work Questions August 31, 2017 Distance Measures Classifiers DTW vs. ED Further Work Questions Outline 1 2 Distance Measures 3 Classifiers 4 DTW vs. ED
SASI Spatial Analysis SSC Meeting Aug 2010 Habitat Document 5
 OBJECTIVES The objectives of the SASI Spatial Analysis were to (1) explore the spatial structure of the asymptotic area swept (z ), (2) define clusters of high and low z for each gear type, (3) determine
INTRODUCTION TO GEOGRAPHIC INFORMATION SYSTEM By Reshma H. Patil
 INTRODUCTION TO GEOGRAPHIC INFORMATION SYSTEM By Reshma H. Patil ABSTRACT:- The geographical information system (GIS) is Computer system for capturing, storing, querying analyzing, and displaying geospatial
Modelling Network Interdependencies of Regional Economies using Spatial Econometric Techniques 1
 STUDIES Modelling Network Interdependencies of Regional Economies using Spatial Econometric Techniques 1 Péter Járosi Regional Research Institute West Virginia University E-mail: peter.jarosi@mail.wvu.edu
Soc/Anth 597 Spatial Demography March 14, GeoDa 0.95i Exercise A. Stephen A. Matthews. Outline. 1. Background
 Soc/Anth 597 Spatial Demography March 14, 2006 GeoDa 0.95i Exercise A Stephen A. Matthews Outline 1. Background 2. Data set introduced (GDANEPAL.SHP) 3. GeoDa introduced Task 1: Start GeoDa Task 2: Open
Proceedings of the 8th WSEAS International Conference on APPLIED MATHEMATICS, Tenerife, Spain, December 16-18, 2005 (pp )
") Proceedings of the 8th WSEAS International Conference on APPLIED MATHEMATICS, Tenerife, Spain, December 16-18, 005 (pp159-164) Spatial Econometrics Modeling of Poverty FERDINAND J. PARAGUAS 1 AND ANTON
Proceedings of the 8th WSEAS International Conference on APPLIED MATHEMATICS, Tenerife, Spain, December 16-18, 005 (pp159-164) Spatial Econometrics Modeling of Poverty FERDINAND J. PARAGUAS 1 AND ANTON
Kasetsart University Workshop. Multigrid methods: An introduction
 Kasetsart University Workshop Multigrid methods: An introduction Dr. Anand Pardhanani Mathematics Department Earlham College Richmond, Indiana USA pardhan@earlham.edu A copy of these slides is available
A SPATIAL CLIFF-ORD-TYPE MODEL WITH HETEROSKEDASTIC INNOVATIONS: SMALL AND LARGE SAMPLE RESULTS
 JOURNAL OF REGIONAL SCIENCE, VOL. 50, NO. 2, 2010, pp. 592 614 A SPATIAL CLIFF-ORD-TYPE MODEL WITH HETEROSKEDASTIC INNOVATIONS: SMALL AND LARGE SAMPLE RESULTS Irani Arraiz Inter-American Development Bank,
CHAPTER 3 LOW DENSITY PARITY CHECK CODES
 62 CHAPTER 3 LOW DENSITY PARITY CHECK CODES 3. INTRODUCTION LDPC codes were first presented by Gallager in 962 [] and in 996, MacKay and Neal re-discovered LDPC codes.they proved that these codes approach
Review on Spatial Data
 Week 12 Lecture: Spatial Autocorrelation and Spatial Regression Introduction to Programming and Geoprocessing Using R GEO6938 4172 GEO4938 4166 Point data Review on Spatial Data Area/lattice data May be
GEO-DATA INPUT AND CONVERSION. Christos G. Karydas,, Dr. Lab of Remote Sensing and GIS Director: Prof. N. Silleos
 Christos G. Karydas,, Dr. xkarydas@agro.auth.gr http://users.auth.gr/xkarydas Lab of Remote Sensing and GIS Director: Prof. N. Silleos School of Agriculture Aristotle University of Thessaloniki, GR 1 0.