Spatial Analysis 2. Spatial Autocorrelation
|
|
|
- Iris Underwood
- 5 years ago
- Views:
Transcription
1 Spatial Analysis 2 Spatial Autocorrelation
2 Spatial Autocorrelation a relationship between nearby spatial units of the same variable If, for every pair of subareas i and j in the study region, the drawings which yield x i and x j are correlated, then we say that there is spatial autocorrelation in the region.
3 Spatial Autocorrelation Spatially located data (georeferenced data) in region R. Given: Variable X A realization of X in area i of R is x i The set of values, { x i }, that are related over space are spatially autocorrelated
4 Spatial Autocorrelation Given a set S containing n geographical units, spatial autocorrelation refers to the relationship between some variable observed in each of the n localities and a measure of geographical proximity defined for all n(n -1) pairs chosen from n. Hubert, Golledge and Costanza, 1981
5 Representations of Spatial Autocorrelation Moran s I (global covariance) Geary s c (global differences) Γ (cross product) Ripley s K (cumulative pairs over distance) ρ, λ (autoregressive coefficients in various regression formulations) Getis and Ord s G i and G i * (local clustering) Anselin s I i and c i (local indicators of spatial association (LISA)) Ord and Getis O (a local representation taking into account global autocorrelation) 1/γ (inverse of the semivariogram; i.e., the correlogram)
6 Advantages of the Study of Spatial Autocorrelation Provides tests on model misspecification; Determines the strength of the spatial effects on any variable in the model; Allows for tests on assumptions of spatial stationarity and spatial heterogeneity; Finds the possible dependent relationship that a realization of a variable may have on other realizations; Identifies the role that distance decay or spatial interaction might have on any spatial autoregressive model; Helps to recognize the influence that the geometry of spatial units under study might have on the realizations of a variable; Allows us to identify the strength of associations among realizations of a variable between spatial units; Gives us the means to test hypotheses about spatial relationships; Gives us the opportunity to weigh the importance of temporal effects; Provides a focus on a spatial unit to better understand the effect that it might have on other units and vice versa ( local spatial autocorrelation ); Helps in the study of outliers.
7 Global Statistics Nearest Neighbor k-function Global Autocorrelation Statistics Moran s I Geary s c Semivariance Spatial Autocorrelation coefficient(s) Semi-variance
8 Representation of Spatial Autocorrelation: WY Cross Product W The Spatial Weights Matrix The Spatial Association of All Sites to All Other Sites d, d 2, 1/0, 1/d Y The Attribute Association Matrix The Association of the Attributes at Each Site to the Attributes at All Other Sites +,-,/,x
9 The Spatial Weights Matrix W is the formal expression of the spatial association between objects (it is the pair-wise geometry of objects being studied).
10 Spatial Configuration (W matrix) 1 or 0 (1 for some defined aspect of the geometry of the region being studied and 0 otherwise) 1/d α (a distance decay representation) s/p (a common boundary representation s is length of side in common, p is perimeter) d 2 -d 1 (a difference in distance representation) G i, I i (a local statistics representation)
11
12 Commentators on W Dacey: varying results given schemes Cliff and Ord: rook s and queen s cases Griffith: better under-specified Florax & Rey: over-specification reduces power Kooijman: maximize Moran s Openshaw: computer search for best model Bartels: binary defensible Hammersley-Clifford: near neighbors in Markov Tiefelsdorf, Griffith, Boots: standardization Florax and Graff: bias due to matrix sparseness Getis and Aldstadt: minimize AIC
13 Some New W Schemes Fotheringham, Brunsdon, and Charlton s bandwidth distance decay (1996) LeSage s Gaussian distance decline (1999) McMillen s tri-cube distance decline (1998) Getis and Aldstadt s local statistics model (2001, 2002) Aldstadt and Getis AMOEBA (2003) Folmer subsume in model (2007)
14 The Attribute Matrix Y The variable under study. One variable at a time. Interval scale (other scales under special conditions). For examples: residuals from regression; a socio-economic variable (number of crimes, household income, number of artifacts, etc.)
15 1 [ 12] 2 [ 10 ] [ 5 ] [ 2 1 ] 3 4
16 WY: Covariance Set W to preferred spatial weights matrix (rooks, queens, distance decline, etc.) Set Y to (y i - µ) (y j -µ) Set scale to n/ W [Σ(y i -µ) 2 ] I = n Σ Σ w ij (y i - µ) (y j -µ)/ W Σ(y i -µ) 2 where W is sum of all w ij and i j This is Moran s I.
17 WY: Additive Set W to 1/0 spatial weights matrix 1 within d; 0 outside of d Set Y to (y i +y j ) Set scale to Σ W ij (d) / Σ (y i ) G(d) = Σ W ij (d) (y i +y j ) / Σ (y i ) and i j This is Getis and Ord s G.
18 WY: Difference Set W to preferred spatial weights matrix Set Y to (y i -y j ) 2 Set scale to (n-1)/2wσ(y i -µ) 2 c = (n - 1) Σ Σ W ij (y i -y i) ) 2 / 2WΣ(y i -µ) 2 where W is sum of all W ij and i j. This is Geary s c.
19 WY: Difference Set W to 1/0 weights matrix; 1 within ad and 0 otherwise; a is an integer; d is a constant distance Set Y to (y i -y j ) 2 Set scale to 1/2 γ(ad) = 1/2 Σ Σ W ij (y i -y j) ) 2 This is the semivariance
20 Attribute Relationships Y Types of Relationships Additive association (clustering): (Y i + Y j ) Multiplicative association (product): (Y i Y j ) Covariation (correlation): (Y i - Ῡ)(Y j - Ῡ) Differences (homogeneity/heterogeneity): (Y i -Y j ) Inverse (relativity): (Y i /Y j ) All Relationships Subject to Mathematical Manipulation (power, logs, abs, etc.)
21 Local Statistics Focus on a site i To what extent are values at sites in vicinity of i associated with i Anselin s LISA: Moran s, Geary s local Getis and Ord s G i * (A clustering statistic)
22 The I i Statistic (A LISA Statistic): Local Indicator of Spatial Association The I i statistic is local, that is, it is focused on a site and is normally distributed. It is designed to yield a measure of pattern that can be translated into standard normal variates. A covariance statistic. A measure of similarity (differences). Well-suited for study of residuals from regression Indicates the extent to which a location (site) is surrounded to a distance d (or by contiguity) by a cluster of high or low values (H-H, L-L, H-L). Can identify clusters of H-H, L-L, H-L.
23

24
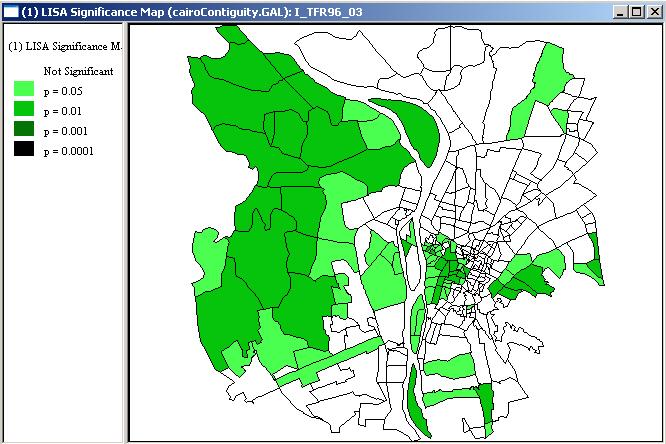
25
26 Local G i* Statistic [Σ j w ij (d)x j - W j * X ] G i *(d) = s{[ns 1j *-W j2 *]/(N-1)} 1/2 all j w ij (d) is element of 1/0 spatial weights matrix where 1 within d of i, 0 otherwise W j * = Σ w ij (d) S 1j * = Σ j w ij 2 (all j) Statistic distributed normally [G i *(d) = Z score]
27 The G i *, G i Statistic The G * i statistic is local, that is, it is focused on sites and is normally distributed. It is designed to yield a measure of pattern in standard normal variates. Indicates the extent to which a location (site) is surrounded to a distance d by a cluster of high or low values. Usually, the user specifies maximum search distance and number of increments. The output is a listing of the G i* (d) value for the sample point at a specified distance (d).
28


29
30 K Function Analysis: A Global Statistic L(d) = {(A[ΣΣ K(d ij )]/ π N(N-1) } ½ where K(d ij ) is the number of pairs of points within d of i, and A is the area of the region under study. Used to discern the clustering pattern of the specified variable within the entire study area. The output file gives a table showing L values for each distance (d) increment. E[L(d)] in a random distribution is d.
31 o o o o o o o o o o
32 The Random Expectation of K Random Expectation of K Observed L* (d) Distance (meters)
33 K-function for Aedes aegypti Pupae, by Household, Iquitos, Peru Pups CI (min) CI (max) Random House K-func Distance
Using AMOEBA to Create a Spatial Weights Matrix and Identify Spatial Clusters, and a Comparison to Other Clustering Algorithms
 Using AMOEBA to Create a Spatial Weights Matrix and Identify Spatial Clusters, and a Comparison to Other Clustering Algorithms Arthur Getis* and Jared Aldstadt** *San Diego State University **SDSU/UCSB
Temporal vs. Spatial Data
 Temporal vs. Spatial Data Temporal 1 dimensional Units: day, week, month Lag: t, t-1, t-2 Durbin-Watson Spatial 2-3 dimensional Units: county, mile, region Lag: near neighbor, networks (?) Moran s I Differencing
An Introduction to Pattern Statistics
 An Introduction to Pattern Statistics Nearest Neighbors The CSR hypothesis Clark/Evans and modification Cuzick and Edwards and controls All events k function Weighted k function Comparative k functions
SPACE Workshop NSF NCGIA CSISS UCGIS SDSU. Aldstadt, Getis, Jankowski, Rey, Weeks SDSU F. Goodchild, M. Goodchild, Janelle, Rebich UCSB
 SPACE Workshop NSF NCGIA CSISS UCGIS SDSU Aldstadt, Getis, Jankowski, Rey, Weeks SDSU F. Goodchild, M. Goodchild, Janelle, Rebich UCSB August 2-8, 2004 San Diego State University Some Examples of Spatial
Constructing the Spatial Weights Matrix Using a Local Statistic
 Arthur Getis Jared Aldstadt Constructing the Spatial Weights Matrix Using a Local Statistic Spatial weights matrices are necesa y elements in most regression models where a representation of spatial structure
Spatial Analysis 1. Introduction
 Spatial Analysis 1 Introduction Geo-referenced Data (not any data) x, y coordinates (e.g., lat., long.) ------------------------------------------------------ - Table of Data: Obs. # x y Variables -------------------------------------
Lab #3 Background Material Quantifying Point and Gradient Patterns
 Lab #3 Background Material Quantifying Point and Gradient Patterns Dispersion metrics Dispersion indices that measure the degree of non-randomness Plot-based metrics Distance-based metrics First-order
Introduction to Spatial Statistics and Modeling for Regional Analysis
 Introduction to Spatial Statistics and Modeling for Regional Analysis Dr. Xinyue Ye, Assistant Professor Center for Regional Development (Department of Commerce EDA University Center) & School of Earth,
Lecture 3: Exploratory Spatial Data Analysis (ESDA) Prof. Eduardo A. Haddad
 Prof. Eduardo A. Haddad") Lecture 3: Exploratory Spatial Data Analysis (ESDA) Prof. Eduardo A. Haddad Key message Spatial dependence First Law of Geography (Waldo Tobler): Everything is related to everything else, but near things
Lecture 3: Exploratory Spatial Data Analysis (ESDA) Prof. Eduardo A. Haddad Key message Spatial dependence First Law of Geography (Waldo Tobler): Everything is related to everything else, but near things
Spatial Autocorrelation (2) Spatial Weights
 Spatial Weights") Spatial Autocorrelation (2) Spatial Weights Luc Anselin Spatial Analysis Laboratory Dept. Agricultural and Consumer Economics University of Illinois, Urbana-Champaign http://sal.agecon.uiuc.edu Outline
Spatial Autocorrelation (2) Spatial Weights Luc Anselin Spatial Analysis Laboratory Dept. Agricultural and Consumer Economics University of Illinois, Urbana-Champaign http://sal.agecon.uiuc.edu Outline
Spatial Regression. 10. Specification Tests (2) Luc Anselin. Copyright 2017 by Luc Anselin, All Rights Reserved
 Luc Anselin. Copyright 2017 by Luc Anselin, All Rights Reserved") Spatial Regression 10. Specification Tests (2) Luc Anselin http://spatial.uchicago.edu 1 robust LM tests higher order tests 2SLS residuals specification search 2 Robust LM Tests 3 Recap and Notation LM-Error
Spatial Regression 10. Specification Tests (2) Luc Anselin http://spatial.uchicago.edu 1 robust LM tests higher order tests 2SLS residuals specification search 2 Robust LM Tests 3 Recap and Notation LM-Error
Lecture 3: Exploratory Spatial Data Analysis (ESDA) Prof. Eduardo A. Haddad
 Prof. Eduardo A. Haddad") Lecture 3: Exploratory Spatial Data Analysis (ESDA) Prof. Eduardo A. Haddad Key message Spatial dependence First Law of Geography (Waldo Tobler): Everything is related to everything else, but near things
Lecture 3: Exploratory Spatial Data Analysis (ESDA) Prof. Eduardo A. Haddad Key message Spatial dependence First Law of Geography (Waldo Tobler): Everything is related to everything else, but near things
Outline ESDA. Exploratory Spatial Data Analysis ESDA. Luc Anselin
 Exploratory Spatial Data Analysis ESDA Luc Anselin University of Illinois, Urbana-Champaign http://www.spacestat.com Outline ESDA Exploring Spatial Patterns Global Spatial Autocorrelation Local Spatial
Measures of Spatial Dependence
 Measures of Spatial Dependence Carlos Hurtado Department of Economics University of Illinois at Urbana-Champaign hrtdmrt2@illinois.edu Junel 30th, 2016 C. Hurtado (UIUC - Economics) Spatial Econometrics
Performance of W-AMOEBA and W-Contiguity matrices in Spatial Lag Model
 PROCEEDING OF 3 RD INTERNATIONAL CONFERENCE ON RESEARCH, IMPLEMENTATION AND EDUCATION OF MATHEMATICS AND SCIENCE YOGYAKARTA, 16 17 MAY 2016 Performance of W-AMOEBA and W-Contiguity matrices in Spatial
A History of the Concept of Spatial Autocorrelation: A Geographer s Perspective
 Geographical Analysis ISSN 0016-7363 A History of the Concept of Spatial Autocorrelation: A Geographer s Perspective Arthur Getis Department of Geography, San Diego State University, San Diego, California
Areal Unit Data Regular or Irregular Grids or Lattices Large Point-referenced Datasets
 Areal Unit Data Regular or Irregular Grids or Lattices Large Point-referenced Datasets Is there spatial pattern? Chapter 3: Basics of Areal Data Models p. 1/18 Areal Unit Data Regular or Irregular Grids
Spatial Statistics For Real Estate Data 1
 1 Key words: spatial heterogeneity, spatial autocorrelation, spatial statistics, geostatistics, Geographical Information System SUMMARY: The paper presents spatial statistics tools in application to real
Exploratory Spatial Data Analysis (ESDA)
") Exploratory Spatial Data Analysis (ESDA) VANGHR s method of ESDA follows a typical geospatial framework of selecting variables, exploring spatial patterns, and regression analysis. The primary software
Exploratory Spatial Data Analysis (ESDA) VANGHR s method of ESDA follows a typical geospatial framework of selecting variables, exploring spatial patterns, and regression analysis. The primary software
Areal data. Infant mortality, Auckland NZ districts. Number of plant species in 20cm x 20 cm patches of alpine tundra. Wheat yield
 Areal data Reminder about types of data Geostatistical data: Z(s) exists everyhere, varies continuously Can accommodate sudden changes by a model for the mean E.g., soil ph, two soil types with different
Spatial Modeling, Regional Science, Arthur Getis Emeritus, San Diego State University March 1, 2016
 Spatial Modeling, Regional Science, and UCSB Arthur Getis Emeritus, San Diego State University March 1, 2016 My Link to UCSB The 1980s at UCSB (summers and sabbatical) Problems within Geography: The Quantitative
Global Spatial Autocorrelation Clustering
 Global Spatial Autocorrelation Clustering Luc Anselin http://spatial.uchicago.edu join count statistics Moran s I Moran scatter plot non-parametric spatial autocorrelation Join Count Statistics Recap -
Basics of Geographic Analysis in R
 Basics of Geographic Analysis in R Spatial Autocorrelation and Spatial Weights Yuri M. Zhukov GOV 2525: Political Geography February 25, 2013 Outline 1. Introduction 2. Spatial Data and Basic Visualization
SPATIAL ECONOMETRICS: METHODS AND MODELS
 SPATIAL ECONOMETRICS: METHODS AND MODELS STUDIES IN OPERATIONAL REGIONAL SCIENCE Folmer, H., Regional Economic Policy. 1986. ISBN 90-247-3308-1. Brouwer, F., Integrated Environmental Modelling: Design
Points. Luc Anselin. Copyright 2017 by Luc Anselin, All Rights Reserved
 Points Luc Anselin http://spatial.uchicago.edu 1 classic point pattern analysis spatial randomness intensity distance-based statistics points on networks 2 Classic Point Pattern Analysis 3 Classic Examples
Spatial Data Mining. Regression and Classification Techniques
 Spatial Data Mining Regression and Classification Techniques 1 Spatial Regression and Classisfication Discrete class labels (left) vs. continues quantities (right) measured at locations (2D for geographic
Identification of Local Clusters for Count Data: A. Model-Based Moran s I Test
 Identification of Local Clusters for Count Data: A Model-Based Moran s I Test Tonglin Zhang and Ge Lin Purdue University and West Virginia University February 14, 2007 Department of Statistics, Purdue
Nonparametric Estimation of the Spatial Connectivity Matrix Using Spatial Panel Data
 Geographical Analysis (2012), Nonparametric Estimation of the Spatial Connectivity Matrix Using Spatial Panel Data Michael Beenstock 1, Daniel Felsenstein 2 1 Department of Economics, Hebrew University
Finding Hot Spots in ArcGIS Online: Minimizing the Subjectivity of Visual Analysis. Nicholas M. Giner Esri Parrish S.
 Finding Hot Spots in ArcGIS Online: Minimizing the Subjectivity of Visual Analysis Nicholas M. Giner Esri Parrish S. Henderson FBI Agenda The subjectivity of maps What is Hot Spot Analysis? Why do Hot
SPATIAL AUTOCORRELATION (i.e., spatial dependence)
") An Evaluation of Spatial Autocorrelation and Heterogeneity in the Residuals of Six Regression Models Lianjun Zhang, Zhihai Ma, and Luo Guo Abstract: Spatial effects include spatial autocorrelation and
An Evaluation of Spatial Autocorrelation and Heterogeneity in the Residuals of Six Regression Models Lianjun Zhang, Zhihai Ma, and Luo Guo Abstract: Spatial effects include spatial autocorrelation and
BAYESIAN MODEL FOR SPATIAL DEPENDANCE AND PREDICTION OF TUBERCULOSIS
 BAYESIAN MODEL FOR SPATIAL DEPENDANCE AND PREDICTION OF TUBERCULOSIS Srinivasan R and Venkatesan P Dept. of Statistics, National Institute for Research Tuberculosis, (Indian Council of Medical Research),
I don t have much to say here: data are often sampled this way but we more typically model them in continuous space, or on a graph
 Spatial analysis Huge topic! Key references Diggle (point patterns); Cressie (everything); Diggle and Ribeiro (geostatistics); Dormann et al (GLMMs for species presence/abundance); Haining; (Pinheiro and
International Journal of Remote Sensing, in press, 2006.
 International Journal of Remote Sensing, in press, 2006. Parameter Selection for Region-Growing Image Segmentation Algorithms using Spatial Autocorrelation G. M. ESPINDOLA, G. CAMARA*, I. A. REIS, L. S.
Modeling Spatial Dependence and Spatial Heterogeneity in. County Yield Forecasting Models
 Modeling Spatial Dependence and Spatial Heterogeneity in County Yield Forecasting Models August 1, 2000 AAEA Conference Tampa, Summer 2000 Session 8 Cassandra DiRienzo Paul Fackler Barry K. Goodwin North
Geographically weighted regression approach for origin-destination flows
 Geographically weighted regression approach for origin-destination flows Kazuki Tamesue 1 and Morito Tsutsumi 2 1 Graduate School of Information and Engineering, University of Tsukuba 1-1-1 Tennodai, Tsukuba,
Exploratory Spatial Data Analysis (And Navigating GeoDa)
") Exploratory Spatial Data Analysis (And Navigating GeoDa) June 9, 2006 Stephen A. Matthews Associate Professor of Sociology & Anthropology, Geography and Demography Director of the Geographic Information
Exploratory Spatial Data Analysis (And Navigating GeoDa) June 9, 2006 Stephen A. Matthews Associate Professor of Sociology & Anthropology, Geography and Demography Director of the Geographic Information
GIS CONFERENCE MAKING PLACE MATTER Decoding Health Data with Spatial Statistics
 esri HEALTH AND HUMAN SERVICES GIS CONFERENCE MAKING PLACE MATTER Decoding Health Data with Spatial Statistics Flora Vale Jenora D Acosta Wait a minute Wait a minute Where is Lauren?? Wait a minute Where
The Cost of Transportation : Spatial Analysis of US Fuel Prices
 The Cost of Transportation : Spatial Analysis of US Fuel Prices J. Raimbault 1,2, A. Bergeaud 3 juste.raimbault@polytechnique.edu 1 UMR CNRS 8504 Géographie-cités 2 UMR-T IFSTTAR 9403 LVMT 3 Paris School
Nature of Spatial Data. Outline. Spatial Is Special
 Nature of Spatial Data Outline Spatial is special Bad news: the pitfalls of spatial data Good news: the potentials of spatial data Spatial Is Special Are spatial data special? Why spatial data require
NONPARAMETRIC ESTIMATION OF THE SPATIAL CONNECTIVITY MATRIX BY THE METHOD OF MOMENTS USING SPATIAL PANEL DATA
 NONPARAMETRIC ESTIMATION OF THE SPATIAL CONNECTIVITY MATRIX BY THE METHOD OF MOMENTS USING SPATIAL PANEL DATA Michael Beenstock Nadav ben Zeev Department of Economics Hebrew University of Jerusalem Daniel
Spatial Analysis I. Spatial data analysis Spatial analysis and inference
 Spatial Analysis I Spatial data analysis Spatial analysis and inference Roadmap Outline: What is spatial analysis? Spatial Joins Step 1: Analysis of attributes Step 2: Preparing for analyses: working with
Output: -Observed Mean Distance -Expected Mean Distance - Nearest Neighbor Index -Graphic report - Test variables:
 Clustering: global indexes (to measure the global degree of clustering for the whole set of events) -> methods based on quadrats (joint count) vs. on distances AVERAGE NEAREST NEIGHBOUR: the distance between
Rethinking the Migration Effects of Natural Amenities: Part II
 Rethinking the Migration Effects of Natural Amenities: Part II Guangqing Chi Department of Sociology and Social Science Research Center Mississippi State University PO Box C, Mississippi State, MS 39762
Spatial interaction and spatial autocorrelation: a crossproduct
 Environment and Planning A, 1991, volume 23, pages 1269-1277 Spatial interaction and spatial autocorrelation: a crossproduct approach A Getis Department of Geography, San Diego State University, San Diego,
Context-dependent spatial analysis: A role for GIS?
 J Geograph Syst (2000) 2:71±76 ( Springer-Verlag 2000 Context-dependent spatial analysis: A role for GIS? A. Stewart Fotheringham Department of Geography, University of Newcastle, Newcastle-upon-Tyne NE1
SIMULATION AND APPLICATION OF THE SPATIAL AUTOREGRESSIVE GEOGRAPHICALLY WEIGHTED REGRESSION MODEL (SAR-GWR)
") SIMULATION AND APPLICATION OF THE SPATIAL AUTOREGRESSIVE GEOGRAPHICALLY WEIGHTED REGRESSION MODEL (SAR-GWR) I. Gede Nyoman Mindra Jaya 1, Budi Nurani Ruchjana 2, Bertho Tantular 1, Zulhanif 1 and Yudhie
SIMULATION AND APPLICATION OF THE SPATIAL AUTOREGRESSIVE GEOGRAPHICALLY WEIGHTED REGRESSION MODEL (SAR-GWR) I. Gede Nyoman Mindra Jaya 1, Budi Nurani Ruchjana 2, Bertho Tantular 1, Zulhanif 1 and Yudhie
Spatial Autocorrelation
 Spatial Autocorrelation Luc Anselin http://spatial.uchicago.edu spatial randomness positive and negative spatial autocorrelation spatial autocorrelation statistics spatial weights Spatial Randomness The
Advances in Spatial Science
 Advances in Spatial Science Editorial Board Manfred M. Fischer Geoffrey J.D. Hewings Peter Nijkamp Folke Snickars (Coordinating Editor) For further volumes: http://www.springer.com/series/3302 Arthur Getis
The Use of Spatial Weights Matrices and the Effect of Geometry and Geographical Scale
 The Use of Spatial Weights Matrices and the Effect of Geometry and Geographical Scale António Manuel RODRIGUES 1, José António TENEDÓRIO 2 1 Research fellow, e-geo Centre for Geography and Regional Planning,
Areal data models. Spatial smoothers. Brook s Lemma and Gibbs distribution. CAR models Gaussian case Non-Gaussian case
 Areal data models Spatial smoothers Brook s Lemma and Gibbs distribution CAR models Gaussian case Non-Gaussian case SAR models Gaussian case Non-Gaussian case CAR vs. SAR STAR models Inference for areal
Spatial Regression. 1. Introduction and Review. Luc Anselin. Copyright 2017 by Luc Anselin, All Rights Reserved
 Spatial Regression 1. Introduction and Review Luc Anselin http://spatial.uchicago.edu matrix algebra basics spatial econometrics - definitions pitfalls of spatial analysis spatial autocorrelation spatial
Introduction. Semivariogram Cloud
 Introduction Data: set of n attribute measurements {z(s i ), i = 1,, n}, available at n sample locations {s i, i = 1,, n} Objectives: Slide 1 quantify spatial auto-correlation, or attribute dissimilarity
Time: the late arrival at the Geocomputation party and the need for considered approaches to spatio- temporal analyses
 Time: the late arrival at the Geocomputation party and the need for considered approaches to spatio- temporal analyses Alexis Comber 1, Paul Harris* 2, Narumasa Tsutsumida 3 1 School of Geography, University
What s special about spatial data?
 What s special about spatial data? Road map Geographic Information analysis The need to develop spatial thinking Some fundamental geographic concepts (PBCS) What are the effects of space? Spatial autocorrelation
Local Spatial Autocorrelation Clusters
 Local Spatial Autocorrelation Clusters Luc Anselin http://spatial.uchicago.edu LISA principle local Moran local G statistics issues and interpretation LISA Principle Clustering vs Clusters global spatial
Analyzing spatial autoregressive models using Stata
 Analyzing spatial autoregressive models using Stata David M. Drukker StataCorp Summer North American Stata Users Group meeting July 24-25, 2008 Part of joint work with Ingmar Prucha and Harry Kelejian
Modeling the Ecology of Urban Inequality in Space and Time
 Modeling the Ecology of Urban Inequality in Space and Time Corina Graif PhD Candidate, Department Of Sociology Harvard University Presentation for the Workshop on Spatial and Temporal Modeling, Center
Spatial groupwise heteroskedasticity and the SCAN approach
 Spatial groupwise heteroskedasticity and the SCAN approach Coro Chasco, Julie Le Gallo, Fernando A. López and Jesús Mur (*) Universidad Autónoma de Madrid. email: coro.chasco@uam.es (**) Université Bourgogne
Spatial correlation and demography.
 Spatial correlation and demography. Sébastien Oliveau, Christophe Guilmoto To cite this version: Sébastien Oliveau, Christophe Guilmoto. Spatial correlation and demography.: Exploring India s demographic
Network data in regression framework
 13-14 July 2009 University of Salerno (Italy) Network data in regression framework Maria ProsperinaVitale Department of Economics and Statistics University of Salerno (Italy) mvitale@unisa.it - Theoretical
2/7/2018. Module 4. Spatial Statistics. Point Patterns: Nearest Neighbor. Spatial Statistics. Point Patterns: Nearest Neighbor
 Spatial Statistics Module 4 Geographers are very interested in studying, understanding, and quantifying the patterns we can see on maps Q: What kinds of map patterns can you think of? There are so many
Parameter selection for region-growing image segmentation algorithms using spatial autocorrelation
 International Journal of Remote Sensing Vol. 27, No. 14, 20 July 2006, 3035 3040 Parameter selection for region-growing image segmentation algorithms using spatial autocorrelation G. M. ESPINDOLA, G. CAMARA*,
Luc Anselin Spatial Analysis Laboratory Dept. Agricultural and Consumer Economics University of Illinois, Urbana-Champaign
 GIS and Spatial Analysis Luc Anselin Spatial Analysis Laboratory Dept. Agricultural and Consumer Economics University of Illinois, Urbana-Champaign http://sal.agecon.uiuc.edu Outline GIS and Spatial Analysis
Mapping and Analysis for Spatial Social Science
 Mapping and Analysis for Spatial Social Science Luc Anselin Spatial Analysis Laboratory Dept. Agricultural and Consumer Economics University of Illinois, Urbana-Champaign http://sal.agecon.uiuc.edu Outline
ESRI 2008 Health GIS Conference
 ESRI 2008 Health GIS Conference An Exploration of Geographically Weighted Regression on Spatial Non- Stationarity and Principal Component Extraction of Determinative Information from Robust Datasets A
Construction Engineering. Research Laboratory. Approaches Towards the Identification of Patterns in Violent Events, Baghdad, Iraq ERDC/CERL CR-09-1
 ERDC/CERL CR-09-1 Approaches Towards the Identification of Patterns in Violent Events, Baghdad, Iraq Luc Anselin and Gianfranco Piras May 2009 Construction Engineering Research Laboratory Approved for
Spatial inference. Spatial inference. Accounting for spatial correlation. Multivariate normal distributions
 Spatial inference I will start with a simple model, using species diversity data Strong spatial dependence, Î = 0.79 what is the mean diversity? How precise is our estimate? Sampling discussion: The 64
A two-step approach to account for unobserved spatial heterogeneity 1
 A two-step approach to account for unobserved spatial heterogeneity 1 Anna Gloria Billé ᵃ*, Roberto Benedetti b, Paolo Postiglione b ᵃ Department of Economics and Finance, University of Rome Tor Vergata
Optimum Spatial Weighted in Small Area Estimation
 Global Journal of Pure and Applied Mathematics. ISSN 0973-1768 Volume 12, Number 5 (2016), pp. 3977-3989 Research India Publications http://www.ripublication.com/gjpam.htm Optimum Spatial Weighted in Small
A Local Indicator of Multivariate Spatial Association: Extending Geary s c.
 A Local Indicator of Multivariate Spatial Association: Extending Geary s c. Luc Anselin Center for Spatial Data Science University of Chicago anselin@uchicago.edu November 9, 2017 This research was funded
SPATIAL DEPENDENCE AND REGIONAL CONVERGENCE IN BRAZIL
 The Regional Economics Applications Laboratory (REAL) is a cooperative venture between the University of Illinois and the Federal Reserve Bank of Chicago focusing on the development and use of analytical
Spatial autocorrelation: robustness of measures and tests
 Spatial autocorrelation: robustness of measures and tests Marie Ernst and Gentiane Haesbroeck University of Liege London, December 14, 2015 Spatial Data Spatial data : geographical positions non spatial
Spatial Trends of unpaid caregiving in Ireland
 Spatial Trends of unpaid caregiving in Ireland Stamatis Kalogirou 1,*, Ronan Foley 2 1. NCG Affiliate, Thoukididi 20, Drama, 66100, Greece; Tel: +30 6977 476776; Email: skalogirou@gmail.com; Web: http://www.gisc.gr.
Spatial Investigation of Mineral Transportation Characteristics in the State of Washington
 Khachatryan, Jessup 1 Spatial Investigation of Mineral Transportation Characteristics in the State of Washington Hayk Khachatryan Graduate Student Email: hkhachatryan@wsu.edu Eric L. Jessup Assistant Professor
Neighborhood effects in demography: measuring scales and patterns
 Neighborhood effects in demography: measuring scales and patterns Sébastien Oliveau, Aix-Marseille University, UMR ESPACE Sebastien.oliveau@univ-amu.fr Yoann Doignon, Aix-Marseille University, UMR ESPACE
Using Spatial Statistics Social Service Applications Public Safety and Public Health
 Using Spatial Statistics Social Service Applications Public Safety and Public Health Lauren Rosenshein 1 Regression analysis Regression analysis allows you to model, examine, and explore spatial relationships,
Application of eigenvector-based spatial filtering approach to. a multinomial logit model for land use data
 Presented at the Seventh World Conference of the Spatial Econometrics Association, the Key Bridge Marriott Hotel, Washington, D.C., USA, July 10 12, 2013. Application of eigenvector-based spatial filtering
CHAPTER 3 APPLICATION OF MULTIVARIATE TECHNIQUE SPATIAL ANALYSIS ON RURAL POPULATION UNDER POVERTYLINE FROM OFFICIAL STATISTICS, THE WORLD BANK
 CHAPTER 3 APPLICATION OF MULTIVARIATE TECHNIQUE SPATIAL ANALYSIS ON RURAL POPULATION UNDER POVERTYLINE FROM OFFICIAL STATISTICS, THE WORLD BANK 3.1 INTRODUCTION: In regional science, space is a central
Lecture 1: Introduction to Spatial Econometric
 Lecture 1: Introduction to Spatial Econometric Professor: Mauricio Sarrias Universidad Católica del Norte September 7, 2017 1 Introduction to Spatial Econometric Mandatory Reading Why do We Need Spatial
W-BASED VS LATENT VARIABLES SPATIAL AUTOREGRESSIVE MODELS: EVIDENCE FROM MONTE CARLO SIMULATIONS
 1 W-BASED VS LATENT VARIABLES SPATIAL AUTOREGRESSIVE MODELS: EVIDENCE FROM MONTE CARLO SIMULATIONS An Liu University of Groningen Henk Folmer University of Groningen Wageningen University Han Oud Radboud
Modeling Spatial Relationships Using Regression Analysis
 Esri International User Conference San Diego, California Technical Workshops July 24, 2012 Modeling Spatial Relationships Using Regression Analysis Lauren M. Scott, PhD Lauren Rosenshein Bennett, MS Answering
Development of Integrated Spatial Analysis System Using Open Sources. Hisaji Ono. Yuji Murayama
 Development of Integrated Spatial Analysis System Using Open Sources Hisaji Ono PASCO Corporation 1-1-2, Higashiyama, Meguro-ku, TOKYO, JAPAN; Telephone: +81 (03)3421 5846 FAX: +81 (03)3421 5846 Email:
Working Paper No Introduction to Spatial Econometric Modelling. William Mitchell 1. April 2013
 Working Paper No. 01-13 Introduction to Spatial Econometric Modelling William Mitchell 1 April 2013 Centre of Full Employment and Equity The University of Newcastle, Callaghan NSW 2308, Australia Home
Variables and Variable De nitions
 APPENDIX A Variables and Variable De nitions All demographic county-level variables have been drawn directly from the 1970, 1980, and 1990 U.S. Censuses of Population, published by the U.S. Department
Detection of temporal changes in the spatial distribution of cancer rates using local Moran s I and geostatistically simulated spatial neutral models
 J Geograph Syst (2005) 7:137 159 DOI: 10.1007/s10109-005-0154-7 Detection of temporal changes in the spatial distribution of cancer rates using local Moran s I and geostatistically simulated spatial neutral
W-BASED VS LATENT VARIABLES SPATIAL AUTOREGRESSIVE MODELS: EVIDENCE FROM MONTE CARLO SIMULATIONS
 W-BASED VS LATENT VARIABLES SPATIAL AUTOREGRESSIVE MODELS: EVIDENCE FROM MONTE CARLO SIMULATIONS. Introduction When it coes to applying econoetric odels to analyze georeferenced data, researchers are well
Spatial Regression Models for Demographic Analysis
 Popul Res Policy Rev (2008) 27:17 42 DOI 10.1007/s11113-007-9051-8 Spatial Regression Models for Demographic Analysis Guangqing Chi Æ Jun Zhu Published online: 27 September 2007 Ó Springer Science+Business
Daniel Fuller Lise Gauvin Yan Kestens
 Examining the spatial distribution and relationship between support for policies aimed at active living in transportation and transportation behavior Daniel Fuller Lise Gauvin Yan Kestens Introduction
Types of Spatial Data
 Spatial Data Types of Spatial Data Point pattern Point referenced geostatistical Block referenced Raster / lattice / grid Vector / polygon Point Pattern Data Interested in the location of points, not their
The Saddlepoint Approximation of Moran s I s and Local Moran s I i s Reference Distributions and Their Numerical Evaluation
 Michael Tiefelsdorf The Saddlepoint Approximation of Moran s I s and Local Moran s I i s Reference Distributions and Their Numerical Evaluation Global Moran s I and local Moran s I i are the most commonly
The role of topological outliers in the spatial analysis of georeferenced social media data
 06 April 2017 The role of topological outliers in the spatial analysis of georeferenced social media data René Westerholt, Heidelberg University Seminar on Spatial urban analytics: big data, methodologies,
SASI Spatial Analysis SSC Meeting Aug 2010 Habitat Document 5
 OBJECTIVES The objectives of the SASI Spatial Analysis were to (1) explore the spatial structure of the asymptotic area swept (z ), (2) define clusters of high and low z for each gear type, (3) determine
Spatial filtering and eigenvector stability : space-time model for German unemployment data
 R. Patuelli, D.A. Griffith, M. Tiefelsdorf, P. Nijkamp Spatial filtering and eigenvector stability : space-time model for German unemployment data Quaderno N. 09-02 Decanato della Facoltà di Scienze economiche
Community Health Needs Assessment through Spatial Regression Modeling
 Community Health Needs Assessment through Spatial Regression Modeling Glen D. Johnson, PhD CUNY School of Public Health glen.johnson@lehman.cuny.edu Objectives: Assess community needs with respect to particular
Intensity Analysis of Spatial Point Patterns Geog 210C Introduction to Spatial Data Analysis
 Intensity Analysis of Spatial Point Patterns Geog 210C Introduction to Spatial Data Analysis Chris Funk Lecture 5 Topic Overview 1) Introduction/Unvariate Statistics 2) Bootstrapping/Monte Carlo Simulation/Kernel
Spatial Regression. 6. Specification Spatial Heterogeneity. Luc Anselin.
 Spatial Regression 6. Specification Spatial Heterogeneity Luc Anselin http://spatial.uchicago.edu 1 homogeneity and heterogeneity spatial regimes spatially varying coefficients spatial random effects 2
Spatial nonstationarity and autoregressive models
 Environment and Planning A 1998, volume 30, pages 957-973 Spatial nonstationarity and autoregressive models C Brunsdon Department of Town and Country Planning, University of Newcastle, Newcastle upon Tyne
Spatial Econometrics and Political Science
 Spatial Econometrics and Political Science David Darmofal Department of Political Science University of South Carolina 350 Gambrell Hall Columbia, SC 29208 Phone: (803) 777-5440 Email: darmofal@gwm.sc.edu
ENGRG Introduction to GIS
 ENGRG 59910 Introduction to GIS Michael Piasecki October 13, 2017 Lecture 06: Spatial Analysis Outline Today Concepts What is spatial interpolation Why is necessary Sample of interpolation (size and pattern)
1Department of Demography and Organization Studies, University of Texas at San Antonio, One UTSA Circle, San Antonio, TX
 Well, it depends on where you're born: A practical application of geographically weighted regression to the study of infant mortality in the U.S. P. Johnelle Sparks and Corey S. Sparks 1 Introduction Infant