The Cost of Transportation : Spatial Analysis of US Fuel Prices
|
|
|
- Charlotte Cain
- 6 years ago
- Views:
Transcription
1 The Cost of Transportation : Spatial Analysis of US Fuel Prices J. Raimbault 1,2, A. Bergeaud 3 juste.raimbault@polytechnique.edu 1 UMR CNRS 8504 Géographie-cités 2 UMR-T IFSTTAR 9403 LVMT 3 Paris School of Economics EWGT Budapest Session 10B: Transport Economics and Financing September 6th, 2017


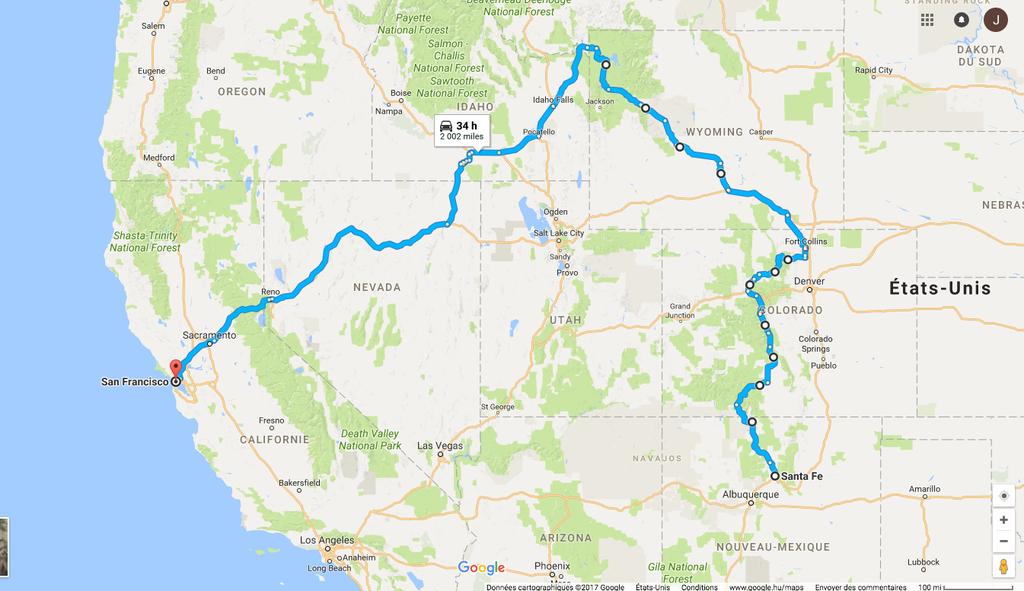


2 Road Trippin : Californication
3 Geography and Fuel prices In the US you fuel your (necessary big) car everywhere and everyday, and directly feel the strong variability of prices! Spatio-temporal variability of Fuel Price captures geographical properties of a particular energy market, of the transportation system, of interactions between transportation and territories. Diverse approaches mostly by economists : [Rietveld et al., 2001] cross-border variability [Gregg et al., 2009] influence on carbon emissions [Combes and Lafourcade, 2005] effective transportation costs [Gautier and Saout, 2015] from crude oil price to retail price
4 Exploratory Spatial analysis Research Objective : Construction and Exploratory analysis of a large and detailed dataset of US fuel retail price, focusing on spatio-temporal variability Focus on geographical patterns and structures Complementarity of spatial analysis methods Interdisciplinary point of view on a fundamentally heterogenous system
5 Dataset Construction Crowdsourced Big Data as a new way to unveil structure of complex sociotechnical systems Construction of a large scale dataset covering most of US fuel stations on two month Requirements : Flexibility, performance and anonymity Architecture : Pool of proxy tasks to pipe requests through tor; manager monitors and launches collection tasks; subtasks crawl and parse target webpages. Dataset available upon request, grey area of semi-open data.
6 Dataset Summary unique observations, between January and March ,204,398 gas station - day observations for main purchase mode and regular fuel, used in the analysis, aggregated at the county level Socio-economic data from US Census Bureau Table: Descriptive statistics on Fuel Price ($ per gallon) Mean Std. Dev. p10 p25 p50 p75 p

7 Data Exploration Interactive web-application for spatio-temporal exploration


8 Spatio-temporal correlations Variability in space and time of Moran spatial auto-correlation index unveils strong non-stationnarity
9 Geographically Weighted Regression Geographically Weighted Regression (GWR) [Brunsdon et al., 1996] to tackle spatial non-stationarity : capturing a variable influence in space of explicative variables for prices Multi-modeling using corrected AIC for model selection : find the best model and the best bandwidth controlling for overfitting Best model : price = β (income, wage, percapjobs) with an optimal bandwidth around 75km (22 neighbors with adaptive bandwidth), interpreted as spatial stationarity scale of price processes in relation to economic agents.

10 Geographically Weighted Regression : Results Fitted coefficients and R 2 for the best model
11 Multi-level Regression Fixed effect regression at the level of the state : multi-level modeling to capture spatial effect of administrative boundaries log(x i ) = β 0 + X i β 1 + β s(i) + ε i, (1) Clustering of standard error at the state level motivated by the strong spatial autocorrelation: capture county-level variation controlling for State fixed effect Regressing the log of price on a state fixed-effect explains 74% of the variance influence of taxes: regressing the log of oil price on the level of state tax gives a R-squared of 0.33%
12 Multi-level Regression : results (1) (2) (3) (4) (5) Density 0.016*** 0.016*** 0.016*** 0.015*** (0.002) (0.001) (0.001) (0.001) Population (log) *** *** *** *** (0.001) (0.011) (0.011) (0.010) Total Income (log) 0.031*** 0.031*** 0.027*** (0.010) (0.010) (0.009) Unemployment (0.001) (0.001) (0.001) Poverty ** *** ** (0.011) (0.011) (0.011) Percentage Black 0.000*** (0.000) (0.000) Vote GOP *** (0.015) R-squared N 3,066 3,011 3,011 3,011 3,011
13 Multi-level Regression : summary Strong influence of state-level tax Dense urban counties have higher fuel price, but price decreases with population Fuel price increases with total income, decreases with poverty It decreases with the extent to which a county has voted for a Republican candidate: suggests a circular link Overall, local socio-economic features have explanatory power when removing State fixed effect
14 Implications Methodological Complementarity of Spatial analysis and econometrics methods : towards integrated approaches to territorial systems Practical Possible design of territory-targeted car-regulation policies, allowing both sustainability and territorial equity
15 Possible Developments Microscopic data analysis (requires precise geocoding) Longer time series (collection in progress) and time-series modeling Parametrization of a large-scale ABM of the spatialized fuel market : investigation of adaptive policies effects at the local and global level Scales and ontologies to study relations between network and territories
16 Conclusion A novel insight into spatio-temporal dynamics of fuel price and their determinants thanks to big data harvesting Complementary approaches and conclusions through GWR and multi-level modeling Fundamental role of spatio-temporal non-stationarity and existence of typical stationarity scales - All code available at - Raw dataset available upon request - Paper preprint available at
17 References I Brunsdon, C., Fotheringham, A. S., and Charlton, M. E. (1996). Geographically weighted regression: a method for exploring spatial nonstationarity. Geographical analysis, 28(4): Combes, P.-P. and Lafourcade, M. (2005). Transport costs: measures, determinants, and regional policy implications for france. Journal of Economic Geography, 5(3): Gautier, E. and Saout, R. L. (2015). The dynamics of gasoline prices: Evidence from daily french micro data. Journal of Money, Credit and Banking, 47(6):
18 References II Gregg, J. S., Losey, L. M., Andres, R. J., Blasing, T., and Marland, G. (2009). The temporal and spatial distribution of carbon dioxide emissions from fossil-fuel use in north america. Journal of Applied Meteorology and Climatology, 48(12): Rietveld, P., Bruinsma, F., and Van Vuuren, D. (2001). Spatial graduation of fuel taxes; consequences for cross-border and domestic fuelling. Transportation Research Part A: Policy and Practice, 35(5):
19 Spatial Heterogeneity Spatial Autocorrelation as an index of spatial variability, for link i ρ i = 1 K w ij (c i c)(c j c) (2) i j ( ) dij with spatial weights w ij = exp d 0
20 GWR Residuals
21 High dimensional fixed effects With x i,s,c,t the fuel price in day t, in gas station i, in state s and in county c, we start by running high dimensional fixed effect regressions x i,s,c,t = β s + ε i,s,c,t (3) x i,s,c,t = β c + ε i,s,c,t (4) x i,s,c,t = β i + ε i,s,c,t (5) Where ε i,s,c,t contains an idiosyncratic error and a day fixed effect. It confirms that most of the variance can be explained by a state fixed effect and that integrating more accurate levels has only small effect on the fit of our model as measured by the R-squared. (6)
arxiv: v1 [stat.ap] 22 Jun 2017
![arxiv: v1 [stat.ap] 22 Jun 2017](/thumbs/89/99195838.jpg "arxiv: v1 [stat.ap] 22 Jun 2017") Available online at www.sciencedirect.com Transportation Research Procedia 00 (2017) 000 000 www.elsevier.com/locate/procedia arxiv:1706.07467v1 [stat.ap] 22 Jun 2017 20th EURO Working Group on Transportation
Available online at www.sciencedirect.com Transportation Research Procedia 00 (2017) 000 000 www.elsevier.com/locate/procedia arxiv:1706.07467v1 [stat.ap] 22 Jun 2017 20th EURO Working Group on Transportation
The Cost of Transportation : Spatial Analysis of US Fuel Prices
 The Cost of Transportation : Spatial Analysis of US Fuel Prices Juste Raimbault, Antonin Bergeaud To cite this version: Juste Raimbault, Antonin Bergeaud. The Cost of Transportation : Spatial Analysis
Investigating the Empirical Existence of Static User Equilibrium
 Investigating the Empirical Existence of Static User Equilibrium J. Raimbault 1,2 juste.raimbault@parisgeo.cnrs.fr 1 UMR CNRS 8504 Géographie-cités 2 UMR-T IFSTTAR 9403 LVMT EWGT 2016 - Istanbul Session
Structural Segregation: Assessing the impact of South African Apartheid on Underlying Dynamics of Interactions between Networks and Territories
 Structural Segregation: Assessing the impact of South African Apartheid on Underlying Dynamics of Interactions between Networks and Territories J. Raimbault 1,2, and S. Baffi 1,3 juste.raimbault@polytechnique.edu
Geographically weighted regression approach for origin-destination flows
 Geographically weighted regression approach for origin-destination flows Kazuki Tamesue 1 and Morito Tsutsumi 2 1 Graduate School of Information and Engineering, University of Tsukuba 1-1-1 Tennodai, Tsukuba,
Evaluating sustainable transportation offers through housing price: a comparative analysis of Nantes urban and periurban/rural areas (France)
") Evaluating sustainable transportation offers through housing price: a comparative analysis of Nantes urban and periurban/rural areas (France) Julie Bulteau, UVSQ-CEARC-OVSQ Thierry Feuillet, Université
Evaluating sustainable transportation offers through housing price: a comparative analysis of Nantes urban and periurban/rural areas (France) Julie Bulteau, UVSQ-CEARC-OVSQ Thierry Feuillet, Université
A Space-Time Model for Computer Assisted Mass Appraisal
 RICHARD A. BORST, PHD Senior Research Scientist Tyler Technologies, Inc. USA Rich.Borst@tylertech.com A Space-Time Model for Computer Assisted Mass Appraisal A Computer Assisted Mass Appraisal System (CAMA)
Exploratory Spatial Data Analysis (ESDA)
") Exploratory Spatial Data Analysis (ESDA) VANGHR s method of ESDA follows a typical geospatial framework of selecting variables, exploring spatial patterns, and regression analysis. The primary software
Exploratory Spatial Data Analysis (ESDA) VANGHR s method of ESDA follows a typical geospatial framework of selecting variables, exploring spatial patterns, and regression analysis. The primary software
Migration Modelling using Global Population Projections
 Migration Modelling using Global Population Projections Bryan Jones CUNY Institute for Demographic Research Workshop on Data and Methods for Modelling Migration Associated with Climate Change 5 December
Time: the late arrival at the Geocomputation party and the need for considered approaches to spatio- temporal analyses
 Time: the late arrival at the Geocomputation party and the need for considered approaches to spatio- temporal analyses Alexis Comber 1, Paul Harris* 2, Narumasa Tsutsumida 3 1 School of Geography, University
DIFFERENT INFLUENCES OF SOCIOECONOMIC FACTORS ON THE HUNTING AND FISHING LICENSE SALES IN COOK COUNTY, IL
 DIFFERENT INFLUENCES OF SOCIOECONOMIC FACTORS ON THE HUNTING AND FISHING LICENSE SALES IN COOK COUNTY, IL Xiaohan Zhang and Craig Miller Illinois Natural History Survey University of Illinois at Urbana
ESRI 2008 Health GIS Conference
 ESRI 2008 Health GIS Conference An Exploration of Geographically Weighted Regression on Spatial Non- Stationarity and Principal Component Extraction of Determinative Information from Robust Datasets A
Spatial Analysis 1. Introduction
 Spatial Analysis 1 Introduction Geo-referenced Data (not any data) x, y coordinates (e.g., lat., long.) ------------------------------------------------------ - Table of Data: Obs. # x y Variables -------------------------------------
1Department of Demography and Organization Studies, University of Texas at San Antonio, One UTSA Circle, San Antonio, TX
 Well, it depends on where you're born: A practical application of geographically weighted regression to the study of infant mortality in the U.S. P. Johnelle Sparks and Corey S. Sparks 1 Introduction Infant
Temporal vs. Spatial Data
 Temporal vs. Spatial Data Temporal 1 dimensional Units: day, week, month Lag: t, t-1, t-2 Durbin-Watson Spatial 2-3 dimensional Units: county, mile, region Lag: near neighbor, networks (?) Moran s I Differencing
This report details analyses and methodologies used to examine and visualize the spatial and nonspatial
 Analysis Summary: Acute Myocardial Infarction and Social Determinants of Health Acute Myocardial Infarction Study Summary March 2014 Project Summary :: Purpose This report details analyses and methodologies
Spatial Analysis 2. Spatial Autocorrelation
 Spatial Analysis 2 Spatial Autocorrelation Spatial Autocorrelation a relationship between nearby spatial units of the same variable If, for every pair of subareas i and j in the study region, the drawings
Administrative Data Research Facility Linked HMDA and ACS Database
 University of Pennsylvania ScholarlyCommons 2017 ADRF Network Research Conference Presentations ADRF Network Research Conference Presentations 11-2017 Administrative Data Research Facility Linked HMDA
Spatial Temporal Models for Retail Credit
 Spatial Temporal Models for Retail Credit Bob Stine The School, University of Pennsylvania stat.wharton.upenn.edu/~stine Introduction Exploratory analysis Trends and maps Outline Measuring spatial association
Daniel Fuller Lise Gauvin Yan Kestens
 Examining the spatial distribution and relationship between support for policies aimed at active living in transportation and transportation behavior Daniel Fuller Lise Gauvin Yan Kestens Introduction
GeoDa-GWR Results: GeoDa-GWR Output (portion only): Program began at 4/8/2016 4:40:38 PM
: Program began at 4/8/2016 4:40:38 PM") New Mexico Health Insurance Coverage, 2009-2013 Exploratory, Ordinary Least Squares, and Geographically Weighted Regression Using GeoDa-GWR, R, and QGIS Larry Spear 4/13/2016 (Draft) A dataset consisting
New Mexico Health Insurance Coverage, 2009-2013 Exploratory, Ordinary Least Squares, and Geographically Weighted Regression Using GeoDa-GWR, R, and QGIS Larry Spear 4/13/2016 (Draft) A dataset consisting
3rd International Workshop on Empirical Methods in Energy Economics (EMEE2010)
") 3rd International Workshop on Empirical Methods in Energy Economics (EMEE200 Surrey Energy Economics Centre (SEEC University of Surrey, UK 24 th 25 th June 200 NOTE: The following Abstract and/or Paper
3rd International Workshop on Empirical Methods in Energy Economics (EMEE200 Surrey Energy Economics Centre (SEEC University of Surrey, UK 24 th 25 th June 200 NOTE: The following Abstract and/or Paper
Spatial Heterogeneity in Production Functions Models
 4th AIEAA Conference - June 11th - 12th, 2015, Ancona (Italy) Innovation, productivity and growth: towards sustainable agri-food production Spatial Heterogeneity in Production Functions Models Salvioni
WRF Webcast. Improving the Accuracy of Short-Term Water Demand Forecasts
 No part of this presentation may be copied, reproduced, or otherwise utilized without permission. WRF Webcast Improving the Accuracy of Short-Term Water Demand Forecasts August 29, 2017 Presenters Maureen
How does Transport Infrastructure Affect Dwelling Prices in Athens?
 How does Transport Infrastructure Affect Dwelling Prices in Athens? Dimitrios Efthymiou* School of Rural and Surveying Engineering, National Technical University of Athens, Greece Constantinos Antoniou
Improving rural statistics. Defining rural territories and key indicators of rural development
 Improving rural statistics Defining rural territories and key indicators of rural development Improving rural statistics Improving Rural Statistics In 2016, the Global Strategy to improve Agricultural
Spatial Regression. 6. Specification Spatial Heterogeneity. Luc Anselin.
 Spatial Regression 6. Specification Spatial Heterogeneity Luc Anselin http://spatial.uchicago.edu 1 homogeneity and heterogeneity spatial regimes spatially varying coefficients spatial random effects 2
The challenge of globalization for Finland and its regions: The new economic geography perspective
 The challenge of globalization for Finland and its regions: The new economic geography perspective Prepared within the framework of study Finland in the Global Economy, Prime Minister s Office, Helsinki
A Joint Tour-Based Model of Vehicle Type Choice and Tour Length
 A Joint Tour-Based Model of Vehicle Type Choice and Tour Length Ram M. Pendyala School of Sustainable Engineering & the Built Environment Arizona State University Tempe, AZ Northwestern University, Evanston,
Geographically Weighted Regression as a Statistical Model
 Geographically Weighted Regression as a Statistical Model Chris Brunsdon Stewart Fotheringham Martin Charlton October 6, 2000 Spatial Analysis Research Group Department of Geography University of Newcastle-upon-Tyne
Spatial Trends of unpaid caregiving in Ireland
 Spatial Trends of unpaid caregiving in Ireland Stamatis Kalogirou 1,*, Ronan Foley 2 1. NCG Affiliate, Thoukididi 20, Drama, 66100, Greece; Tel: +30 6977 476776; Email: skalogirou@gmail.com; Web: http://www.gisc.gr.
Introduction. Introduction (Contd.) Market Equilibrium and Spatial Variability in the Value of Housing Attributes. Urban location theory.
 Market Equilibrium and Spatial Variability in the Value of Housing Attributes. Urban location theory.") Forestry, Wildlife, and Fisheries Graduate Seminar Market Equilibrium and Spatial Variability in the Value of Housing Attributes Seung Gyu Kim Wednesday, 12 March 2008 1 Introduction Urban location theory
Forestry, Wildlife, and Fisheries Graduate Seminar Market Equilibrium and Spatial Variability in the Value of Housing Attributes Seung Gyu Kim Wednesday, 12 March 2008 1 Introduction Urban location theory
Urban GIS for Health Metrics
 Urban GIS for Health Metrics Dajun Dai Department of Geosciences, Georgia State University Atlanta, Georgia, United States Presented at International Conference on Urban Health, March 5 th, 2014 People,
Using Spatial Statistics Social Service Applications Public Safety and Public Health
 Using Spatial Statistics Social Service Applications Public Safety and Public Health Lauren Rosenshein 1 Regression analysis Regression analysis allows you to model, examine, and explore spatial relationships,
CHAPTER 3 APPLICATION OF MULTIVARIATE TECHNIQUE SPATIAL ANALYSIS ON RURAL POPULATION UNDER POVERTYLINE FROM OFFICIAL STATISTICS, THE WORLD BANK
 CHAPTER 3 APPLICATION OF MULTIVARIATE TECHNIQUE SPATIAL ANALYSIS ON RURAL POPULATION UNDER POVERTYLINE FROM OFFICIAL STATISTICS, THE WORLD BANK 3.1 INTRODUCTION: In regional science, space is a central
GIS Spatial Statistics for Public Opinion Survey Response Rates
 GIS Spatial Statistics for Public Opinion Survey Response Rates July 22, 2015 Timothy Michalowski Senior Statistical GIS Analyst Abt SRBI - New York, NY t.michalowski@srbi.com www.srbi.com Introduction
Explorative Spatial Analysis of Coastal Community Incomes in Setiu Wetlands: Geographically Weighted Regression
 Explorative Spatial Analysis of Coastal Community Incomes in Setiu Wetlands: Geographically Weighted Regression Z. Syerrina 1, A.R. Naeim, L. Muhamad Safiih 3 and Z. Nuredayu 4 1,,3,4 School of Informatics
Regression Analysis. A statistical procedure used to find relations among a set of variables.
 Regression Analysis A statistical procedure used to find relations among a set of variables. Understanding relations Mapping data enables us to examine (describe) where things occur (e.g., areas where
Modeling Spatial Relationships Using Regression Analysis
 Esri International User Conference San Diego, California Technical Workshops July 24, 2012 Modeling Spatial Relationships Using Regression Analysis Lauren M. Scott, PhD Lauren Rosenshein Bennett, MS Answering
Integration for Informed Decision Making
 Geospatial and Statistics Policy Intervention: Integration for Informed Decision Making Greg Scott Global Geospatial Information Management United Nations Statistics Division Department of Economic and
Spatial Data, Spatial Analysis and Spatial Data Science
 Spatial Data, Spatial Analysis and Spatial Data Science Luc Anselin http://spatial.uchicago.edu 1 spatial thinking in the social sciences spatial analysis spatial data science spatial data types and research
A geographically weighted regression
 The Spatial Distribution of Poverty A geographically weighted regression by Introduction Problem How can we explore the spatial distribution of poverty and determine its correlates? This exercise examines
Modeling Spatial Relationships using Regression Analysis
 Esri International User Conference San Diego, CA Technical Workshops July 2011 Modeling Spatial Relationships using Regression Analysis Lauren M. Scott, PhD Lauren Rosenshein, MS Mark V. Janikas, PhD Answering
Modeling Land Use Change Using an Eigenvector Spatial Filtering Model Specification for Discrete Response
 Modeling Land Use Change Using an Eigenvector Spatial Filtering Model Specification for Discrete Response Parmanand Sinha The University of Tennessee, Knoxville 304 Burchfiel Geography Building 1000 Phillip
Spatial analysis of changes in the unemployment rate: A countylevel analysis of the New England states
 Spatial analysis of changes in the unemployment rate: A countylevel analysis of the New England states ABSTRACT Zachary A. Smith Saint Leo University This research project examines the spatial dependence
OBESITY AND LOCATION IN MARION COUNTY, INDIANA MIDWEST STUDENT SUMMIT, APRIL Samantha Snyder, Purdue University
 OBESITY AND LOCATION IN MARION COUNTY, INDIANA MIDWEST STUDENT SUMMIT, APRIL 2008 Samantha Snyder, Purdue University Organization Introduction Literature and Motivation Data Geographic Distributions ib
Context-dependent spatial analysis: A role for GIS?
 J Geograph Syst (2000) 2:71±76 ( Springer-Verlag 2000 Context-dependent spatial analysis: A role for GIS? A. Stewart Fotheringham Department of Geography, University of Newcastle, Newcastle-upon-Tyne NE1
Running head: GEOGRAPHICALLY WEIGHTED REGRESSION 1. Geographically Weighted Regression. Chelsey-Ann Cu GEOB 479 L2A. University of British Columbia
 Running head: GEOGRAPHICALLY WEIGHTED REGRESSION 1 Geographically Weighted Regression Chelsey-Ann Cu 32482135 GEOB 479 L2A University of British Columbia Dr. Brian Klinkenberg 9 February 2018 GEOGRAPHICALLY
A Hybrid ARIMA and Neural Network Model to Forecast Particulate. Matter Concentration in Changsha, China
 A Hybrid ARIMA and Neural Network Model to Forecast Particulate Matter Concentration in Changsha, China Guangxing He 1, Qihong Deng 2* 1 School of Energy Science and Engineering, Central South University,
Tracey Farrigan Research Geographer USDA-Economic Research Service
 Rural Poverty Symposium Federal Reserve Bank of Atlanta December 2-3, 2013 Tracey Farrigan Research Geographer USDA-Economic Research Service Justification Increasing demand for sub-county analysis Policy
The Spatial Interactions between Public Transport Demand and Land Use Characteristics in the Sydney Greater Metropolitan Area
 The Spatial Interactions between Public Transport Demand and Land Use Characteristics in the Sydney Greater Metropolitan Area Authors: Chi-Hong Tsai (Corresponding Author) Institute of Transport and Logistics
Knowledge Spillovers, Spatial Dependence, and Regional Economic Growth in U.S. Metropolitan Areas. Up Lim, B.A., M.C.P.
 Knowledge Spillovers, Spatial Dependence, and Regional Economic Growth in U.S. Metropolitan Areas by Up Lim, B.A., M.C.P. DISSERTATION Presented to the Faculty of the Graduate School of The University
not for commercial-scale installations. Thus, there is a need to study the effects of snow on
 1. Problem Statement There is a great deal of uncertainty regarding the effects of snow depth on energy production from large-scale photovoltaic (PV) solar installations. The solar energy industry claims
The Geographic Diversity of U.S. Nonmetropolitan Growth Dynamics: A Geographically Weighted Regression Approach
 The Geographic Diversity of U.S. Nonmetropolitan Growth Dynamics: A Geographically Weighted Regression Approach by Mark Partridge, Ohio State University Dan Rickman, Oklahoma State Univeristy Kamar Ali
Luc Anselin and Nancy Lozano-Gracia
 Errors in variables and spatial effects in hedonic house price models of ambient air quality Luc Anselin and Nancy Lozano-Gracia Presented by Julia Beckhusen and Kosuke Tamura February 29, 2008 AGEC 691T:
Measuring The Benefits of Air Quality Improvement: A Spatial Hedonic Approach. Chong Won Kim, Tim Phipps, and Luc Anselin
 Measuring The Benefits of Air Quality Improvement: A Spatial Hedonic Approach Chong Won Kim, Tim Phipps, and Luc Anselin Paper prepared for presentation at the AAEA annual meetings, Salt Lake City, August,
Analysis of Bank Branches in the Greater Los Angeles Region
 Analysis of Bank Branches in the Greater Los Angeles Region Brian Moore Introduction The Community Reinvestment Act, passed by Congress in 1977, was written to address redlining by financial institutions.
Infill and the microstructure of urban expansion
 Infill and the microstructure of urban expansion Stephen Sheppard Williams College Homer Hoyt Advanced Studies Institute January 12, 2007 Presentations and papers available at http://www.williams.edu/economics/urbangrowth/homepage.htm
Neighborhood social characteristics and chronic disease outcomes: does the geographic scale of neighborhood matter? Malia Jones
 Neighborhood social characteristics and chronic disease outcomes: does the geographic scale of neighborhood matter? Malia Jones Prepared for consideration for PAA 2013 Short Abstract Empirical research
Innovation and Regional Growth in the European Union
 Riccardo Crescenzi Andres Rodriguez-Pose Innovation and Regional Growth in the European Union Springer Contents 1 Introduction 1 2 Theoretical Framework: A Spatial Perspective On Innovation and the Genesis
GIS in Locating and Explaining Conflict Hotspots in Nepal
 GIS in Locating and Explaining Conflict Hotspots in Nepal Lila Kumar Khatiwada Notre Dame Initiative for Global Development 1 Outline Brief background Use of GIS in conflict study Data source Findings
Spatial and Socioeconomic Analysis of Commuting Patterns in Southern California Using LODES, CTPP, and ACS PUMS
 Spatial and Socioeconomic Analysis of Commuting Patterns in Southern California Using LODES, CTPP, and ACS PUMS Census for Transportation Planning Subcommittee meeting TRB 95th Annual Meeting January 11,
Gis Based Analysis of Supply and Forecasting Piped Water Demand in Nairobi
 International Journal of Engineering Science Invention ISSN (Online): 2319 6734, ISSN (Print): 2319 6726 Volume 4 Issue 2 February 2015 PP.01-11 Gis Based Analysis of Supply and Forecasting Piped Water
Spatial Variation in Local Road Pedestrian and Bicycle Crashes
 2015 Esri International User Conference July 20 24, 2015 San Diego, California Spatial Variation in Local Road Pedestrian and Bicycle Crashes Musinguzi, Abram, Graduate Research Assistant Chimba,Deo, PhD.,
Application of eigenvector-based spatial filtering approach to. a multinomial logit model for land use data
 Presented at the Seventh World Conference of the Spatial Econometrics Association, the Key Bridge Marriott Hotel, Washington, D.C., USA, July 10 12, 2013. Application of eigenvector-based spatial filtering
A Comprehensive Method for Identifying Optimal Areas for Supermarket Development. TRF Policy Solutions April 28, 2011
 A Comprehensive Method for Identifying Optimal Areas for Supermarket Development TRF Policy Solutions April 28, 2011 Profile of TRF The Reinvestment Fund builds wealth and opportunity for lowwealth communities
Spatio-Temporal Modelling of Credit Default Data
 1/20 Spatio-Temporal Modelling of Credit Default Data Sathyanarayan Anand Advisor: Prof. Robert Stine The Wharton School, University of Pennsylvania April 29, 2011 2/20 Outline 1 Background 2 Conditional
A Diagnostic for Seasonality Based Upon Autoregressive Roots
 A Diagnostic for Seasonality Based Upon Autoregressive Roots Tucker McElroy (U.S. Census Bureau) 2018 Seasonal Adjustment Practitioners Workshop April 26, 2018 1 / 33 Disclaimer This presentation is released
Convergence and spatial interactions: evidence from Russian regions
 Convergence and spatial interactions: evidence from Russian regions Vera Ivanova NRU Higher School of Economics Vera Ivanova (NRU HSE) Convergence and spatial interactions September, 24th, 2012 1 / 37
A Spatial Multiple Discrete-Continuous Model
 A Spatial Multiple Discrete-Continuous Model Chandra R. Bhat 1,2 and Sebastian Astroza 1,3 1: The University of Texas at Austin 2: The Hong Kong Polytechnic University 3: Universidad de Concepción Outline
A Meta-Analysis of the Urban Wage Premium
 A Meta-Analysis of the Urban Wage Premium Ayoung Kim Dept. of Agricultural Economics, Purdue University kim1426@purdue.edu November 21, 2014 SHaPE seminar 2014 November 21, 2014 1 / 16 Urban Wage Premium
Frequency Domain Predictive Modeling with Aggregated Data
 Frequency Domain Predictive Modeling with Aggregated Data Sanmi Koyejo University of Illinois at Urbana-Champaign Joint work with Avradeep Bhowmik Joydeep Ghosh @University of Texas at Austin Images courtesy:
BUILDING SOUND AND COMPARABLE METRICS FOR SDGS: THE CONTRIBUTION OF THE OECD DATA AND TOOLS FOR CITIES AND REGIONS
 BUILDING SOUND AND COMPARABLE METRICS FOR SDGS: THE CONTRIBUTION OF THE OECD DATA AND TOOLS FOR CITIES AND REGIONS STATISTICAL CAPACITY BUILDING FOR MONITORING OF SUSTAINABLE DEVELOPMENT GOALS Lukas Kleine-Rueschkamp
Bengt Kjellson Chair of the Executive Committee UN-GGIM: Europe. 2 nd Joint UN-GGIM: Europe ESS Meeting 11 th March 2016, Luxembourg
 Bengt Kjellson Chair of the Executive Committee UN-GGIM: Europe 2 nd Joint UN-GGIM: Europe ESS Meeting 11 th March 2016, Luxembourg A global geospatial mandate At its 47th plenary in July 2011, ECOSOC,
Explaining Regional Differences in Environmental Inequality
 Explaining Regional Differences in Environmental Inequality A Multi-Level Assessment of German Cities Tobias Rüttenauer Department of Social Sciences TU Kaiserslautern November 22, 2017 Analytische Soziologie
The Geography of Social Change
 The Geography of Social Change Alessandra Fogli Stefania Marcassa VERY PRELIMINARY DRAFT Abstract We investigate how and when social change arises. We use data on the spatial diffusion of the fertility
Integrating geography and statistics, but what about earth observation?
 Integrating geography and statistics, but what about earth observation? 8 0 0 y 2 2 3 0 9 x 6 3 9 1 9 n 1 8 3 7 3 9 7 2 2 4 8 8 7 8 4 7 5 Ola Nordbeck Senior Advisor Ola.nordbeck@spacecentre.no Bridging
Geographically Weighted Panel Regression
 Geographically Weighted Panel Regression Fernando Bruna (f.bruna@udc.es) a Danlin Yu (yud@mail.montclair.edu) b a University of A Coruña, Economics and Business Department, Campus de Elviña s/n, 15071
GIS Analysis: Spatial Statistics for Public Health: Lauren M. Scott, PhD; Mark V. Janikas, PhD
 Some Slides to Go Along with the Demo Hot spot analysis of average age of death Section B DEMO: Mortality Data Analysis 2 Some Slides to Go Along with the Demo Do Economic Factors Alone Explain Early Death?
Invited presentation at the 2018 Southern Agricultural Economics Association Annual Meeting, February 2-6, 2018, Jacksonville, Florida
 Invited presentation at the 2018 Southern Agricultural Economics Association Annual Meeting, February 2-6, 2018, Jacksonville, Florida Copyright 2018 by Author(s). All rights reserved. Readers may make
Modeling Spatial Dependence and Spatial Heterogeneity in. County Yield Forecasting Models
 Modeling Spatial Dependence and Spatial Heterogeneity in County Yield Forecasting Models August 1, 2000 AAEA Conference Tampa, Summer 2000 Session 8 Cassandra DiRienzo Paul Fackler Barry K. Goodwin North
Carbon Dioxide (CO2) Emissions in Latin America: Looking for the Existence of Environmental Kuznets Curves
 Emissions in Latin America: Looking for the Existence of Environmental Kuznets Curves") Carbon Dioxide (CO2) Emissions in Latin America: Looking for the Existence of Environmental Kuznets Curves Krishna P. Paudel Hector Zapata Alejandro Diaz Department of Agricultural Economics and Agribusiness
Carbon Dioxide (CO2) Emissions in Latin America: Looking for the Existence of Environmental Kuznets Curves Krishna P. Paudel Hector Zapata Alejandro Diaz Department of Agricultural Economics and Agribusiness
Lecture 2 Differences and Commonalities among Developing Countries
 Lecture 2 Differences and Commonalities among Developing Countries Lecture Outline I-Defining the developing world: Indicators of development A-GDP per capita: nominal, real, PPP B-Human Development Index
Selection of small area estimation method for Poverty Mapping: A Conceptual Framework
 Selection of small area estimation method for Poverty Mapping: A Conceptual Framework Sumonkanti Das National Institute for Applied Statistics Research Australia University of Wollongong The First Asian
Simulating household location choice at different geographical levels with UrbanSim
 Simulating household location choice at different geographical levels with UrbanSim Laboratory of Transport Economics (LET) (CNRS, University of Lyon, ENTPE) Marko Kryvobokov, Dominique Bouf Nicolas Ovtracht,
The geography of domestic energy consumption
 The geography of domestic energy consumption Anastasia Ushakova PhD student at CDRC UCL Ellen Talbot PhD student at CDRC Liverpool Some important research questions How can we classify energy consumption
DEVELOPING DECISION SUPPORT TOOLS FOR THE IMPLEMENTATION OF BICYCLE AND PEDESTRIAN SAFETY STRATEGIES
 DEVELOPING DECISION SUPPORT TOOLS FOR THE IMPLEMENTATION OF BICYCLE AND PEDESTRIAN SAFETY STRATEGIES Deo Chimba, PhD., P.E., PTOE Associate Professor Civil Engineering Department Tennessee State University
Variables and Variable De nitions
 APPENDIX A Variables and Variable De nitions All demographic county-level variables have been drawn directly from the 1970, 1980, and 1990 U.S. Censuses of Population, published by the U.S. Department
How to make R, PostGIS and QGis cooperate for statistical modelling duties: a case study on hedonic regressions
 202 RESEARCH CONFERENCES How to make R, PostGIS and QGis cooperate for statistical modelling duties: a case study on hedonic regressions Author Olivier Bonin, Université Paris Est - IFSTTAR - LVMT, France
SPATIO-TEMPORAL REGRESSION MODELS FOR DEFORESTATION IN THE BRAZILIAN AMAZON
 SPATIO-TEMPORAL REGRESSION MODELS FOR DEFORESTATION IN THE BRAZILIAN AMAZON Giovana M. de Espindola a, Edzer Pebesma b,c1, Gilberto Câmara a a National institute for space research (INPE), Brazil b Institute
Conurbano s Atlas MALENA HOPP M A L H OO.COM. AR
 Conurbano s Atlas MALENA HOPP M A L ENAHOPP@YA H OO.COM. AR R ESEARCH GRO UP IN LIVING CONDITIONS IN BUENOS A I R ES CONURBANO. UNIVERSI DAD N ACIONAL DE AV E L L A N E DA Conurbano, an heterogeneous region
Compact guides GISCO. Geographic information system of the Commission
 Compact guides GISCO Geographic information system of the Commission What is GISCO? GISCO, the Geographic Information System of the COmmission, is a permanent service of Eurostat that fulfils the requirements
A DYNAMIC SPACE-TIME PANEL DATA MODEL OF STATE-LEVEL BEER CONSUMPTION
 A DYNAMIC SPACE-TIME PANEL DATA MODEL OF STATE-LEVEL BEER CONSUMPTION Thesis Supervisor: James P. LeSage, Ph.D. Fields Endowed Chair Department of Finance and Economics Approved: Heather C. Galloway, Ph.D.
Using AMOEBA to Create a Spatial Weights Matrix and Identify Spatial Clusters, and a Comparison to Other Clustering Algorithms
 Using AMOEBA to Create a Spatial Weights Matrix and Identify Spatial Clusters, and a Comparison to Other Clustering Algorithms Arthur Getis* and Jared Aldstadt** *San Diego State University **SDSU/UCSB
Financial Development and Economic Growth in Henan Province Based on Spatial Econometric Model
 International Journal of Contemporary Mathematical Sciences Vol. 12, 2017, no. 5, 209-216 HIKARI Ltd, www.m-hikari.com https://doi.org/10.12988/ijcms.2017.7727 Financial Development and Economic Growth
Finding Hot Spots in ArcGIS Online: Minimizing the Subjectivity of Visual Analysis. Nicholas M. Giner Esri Parrish S.
 Finding Hot Spots in ArcGIS Online: Minimizing the Subjectivity of Visual Analysis Nicholas M. Giner Esri Parrish S. Henderson FBI Agenda The subjectivity of maps What is Hot Spot Analysis? Why do Hot
Spatial Statistics For Real Estate Data 1
 1 Key words: spatial heterogeneity, spatial autocorrelation, spatial statistics, geostatistics, Geographical Information System SUMMARY: The paper presents spatial statistics tools in application to real
MOR CO Analysis of future residential and mobility costs for private households in Munich Region
 MOR CO Analysis of future residential and mobility costs for private households in Munich Region The amount of the household budget spent on mobility is rising dramatically. While residential costs can
The Spatial Analysis of Wind Power on Nodal Prices in New Zealand
 The Spatial Analysis of Wind Power on Nodal Prices in New Zealand Le Wen Research Fellow Energy Centre The University of Auckland l.wen@auckland.ac.nz 1974 1975 1976 1977 1978 1979 1980 1981 1982 1983
Online Appendix to The Political Economy of the U.S. Mortgage Default Crisis Not For Publication
 Online Appendix to The Political Economy of the U.S. Mortgage Default Crisis Not For Publication 1 Robustness of Constituent Interest Result Table OA1 shows that the e ect of mortgage default rates on