Using AMOEBA to Create a Spatial Weights Matrix and Identify Spatial Clusters, and a Comparison to Other Clustering Algorithms
|
|
|
- Lionel Stanley
- 5 years ago
- Views:
Transcription
1 Using AMOEBA to Create a Spatial Weights Matrix and Identify Spatial Clusters, and a Comparison to Other Clustering Algorithms Arthur Getis* and Jared Aldstadt** *San Diego State University **SDSU/UCSB Joint PhD Program Paper presented at the Regional Research Institute, West Virginia University Morgantown, West Virginia December 8, 25
2 AMOEBA A design for the construction of a spatial weights matrix using empirical data. Multidirectional: Searches for spatial association in all specified directions. Optimal: Optimum in the sense that the scale is local (the finest scale) and the analysis reveals all spatial association. Ecotope-Based: The ecotope is a specialized region (a particular habitat) within a larger region. Algorithm: The algorithm for finding the ecotope is based on an analytical system that often finds highly irregular (amoeba-like) sub-regions of spatial association.
3 The Issues Question 1 How does one create an appropriate spatial weights matrix? Question 2 Can we have confidence in the identification of spatial clusters?
4 Question 1 How does one create an appropriate spatial weights matrix?
5 The Spatial Weights Matrix In a regression context W is the formal expression of spatial dependence between spatial units (the spatial effects). Used in, for example: y = ρwy + Xβ + ε
6 The Typical W Matrix j > n i=1 w 11 w 12 w w 1n i=2 w 21 w 22 i=3 w 31 i=n w n1 w nn
7 Some Traditional W Schemes Contiguity Inverse Distances Lengths of Shared Borders, Perimeters n th Nearest Neighbor Distance All Centroids within d Ranked Distances Network Links
8 Commentators on W Anselin: Outlined the problem Dacey: varying results given schemes Cliff and Ord: rook s and queen s cases Griffith: better under-specified Florax & Rey: over-specification reduces power Kooijman: maximize Moran s Openshaw: computer search for best model Bartels: binary defensible Hammersley-Clifford: near neighbors in Markov Tiefelsdorf, Griffith, Boots: standardization Florax and Graff: bias due to matrix sparseness GEODA listserv
9 Some Recent W Schemes Fotheringham, Brunsdon, and Charlton s bandwidth distance decay (1996) LeSage s Gaussian distance decline (1999) McMillen s tri-cube distance decline (1998) Getis and Aldstadt s local statistics model (21, 22) Fotheringham, Charlton, Brunsdon s optimize bandwidth (22) LeSage s Bayesian approach (23) Aldstadt and Getis AMOEBA (23)
10 W Theory or Reality? Exogenous versus endogenous Estimation versus prediction Model driven versus data driven The AMOEBA approach
11 AMOEBA: Critical Number of Links Identification Local statistics values are computed around each observation as the number of links (d) increases. When the absolute values fail to rise, the cluster diameter is reached. First peak equals G i * dc Gi* Distance Links
12 AMOEBA: Weight Calculation When d c >, w ij w ij P( z Zd = P( z Z =, otherwise. c d ) P( z Z c ) P( z d ij Z ) ), for all j where d ij d c When d c =, for all j, w ij = P(z) is the cumulative probability associated with the standard variate of the normal distribution Weights vary between and 1.
13 AMOEBA: Links Designations d ij is the number of links from the focus spatial unit i to another spatial unit j d c is the critical number of links: the number of links from i beyond which no further autocorrelation exists.
14 AMOEBA as W and U in an Autoregressive Spatial Lag Model It is conceivable for rows of the weights matrix to be completely filled with zeroes indicating that there is no local spatial autocorrelation surrounding an observation. To compensate for the zero row effect, we create a dummy variable, U, that assigns a 1 for all observations with no dependence structure and otherwise. y = θwy + αu + Xβ + ε
15 AMOEBA as W and U in a Autoregressive Spatial Error Model y = αu + Xβ + (I - κw) -1 ε
16 AMOEBA: The non-spatial and spatial matrices U = W = w 2,1 w 3,1 w 4,1 w 7,1 w 8,1 w 9,1 w 11,1 w 12,1 w 14,1 w 1,2 w 3,2 w 4,2 w 7,2 w 8,2 w 9,2 w 11,2 w 12,2 w 14,2 w 1,3 w 2,3 w 4,3 w 7,3 w 8,3 w 9,3 w 11,3 w 12,3 w 14,3 w 1,4 w 2,4 w 3,4 w 7,4 w 8,4 w 9,4 w 11,4 w 12,4 w 14,4 w 1,5 w 2,5 w 3,5 w 4,5 w 7,5 w 8,5 w 9,5 w 11,5 w 12,5 w 14,5 w 1,6 w 2,6 w 3,6 w 4,6 w 7,6 w 8,6 w 9,6 w 11,6 w 12,6 w 14,6 w 1,7 w 2,7 w 3,7 w 4,7 w 8,7 w 9,7 w 11,7 w 12,7 w 14,7 w 1,8 w 2,8 w 3,8 w 4,8 w 7,8 w 9,8 w 11,8 w 12,8 w 14,8 w 1,9 w 2,9 w 3,9 w 4,9 w 7,9 w 8,9 w 11,9 w 12,9 w 14,9 w 1,1 w 2,1 w 3,1 w 4,1 w 7,1 w 8,1 w 9,1 w 11,1 w 12,1 w 1,11 w 2,11 w 3,11 w 4,11 w 7,11 w 8,11 w 9,11 w 12,11 w 1,12 w 2,12 w 3,12 w 4,12 w 7,12 w 8,12 w 9,12 w 11,12 w 1,13 w 2,13 w 3,13 w 4,13 w 7,13 w 8,13 w 9,13 w 1,13 w 11,14 w 12,13 w 14,1 w 14,11 w 14,12 w 14,13 w 1,14 w 2,14 w 3,14 w 4,14 w 7,14 w 8,14 w 9,14 w 12,14
17 Generalized AMOEBA Yc 1c Wcc Wc Yc ε c α ρ β Y = Y 1 ε
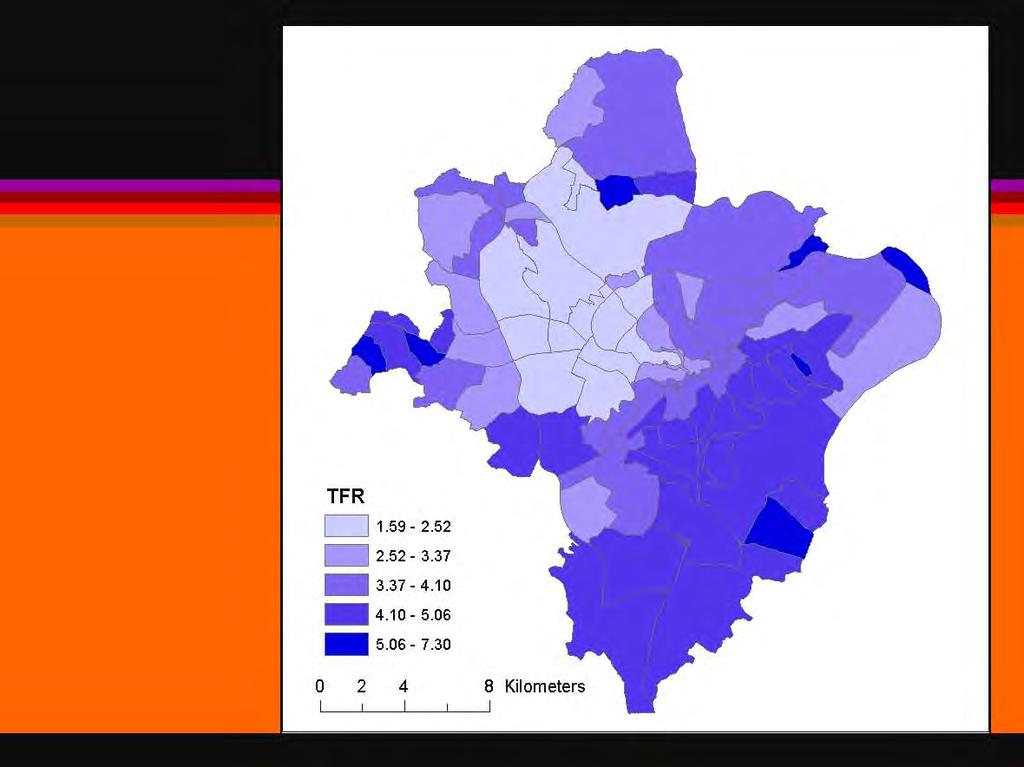
18 Total Fertility Rates Amman, Jordan An Example 1994 (data by census units)

19 Mediterranean Sea LEBANON SYRIA IRAQ Gaza PALESTINIAN AUTHORITY ISRAEL SAUDI ARABIA EGYPT
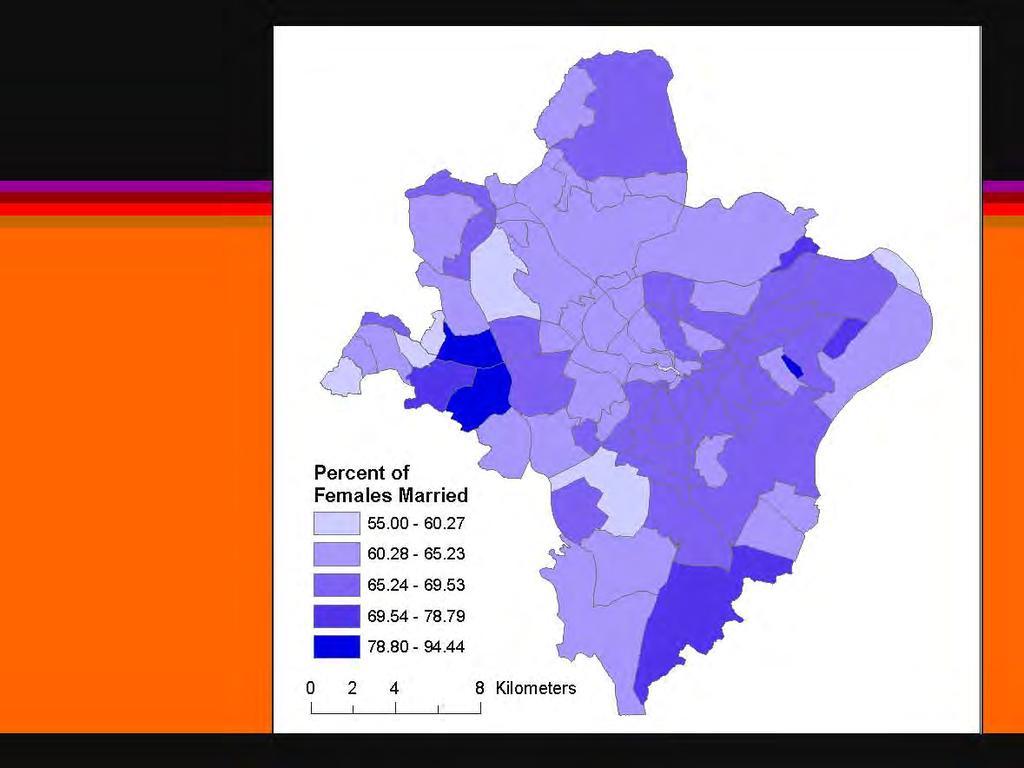
20 Explanatory Variables Regressor social variables 1. Percent of females with higher education (called hi-ed ) 2. Percent females married (called married )
21
22
23
24 Ordinary Least Squares No W or U AIC t VALUES constant hi-ed married 1.261
25 AMOEBA in Spatial Error Models A M O E B A Contiguity G i I i c i AIC t VALUES constant hi-ed married lambda non-spatial
26 Comparison of Spatial Contiguity and AMOEBA Spatial Error Model Spatial Error Model: G i AMOEBA has AIC much lower than contiguity ( to ). All AMOEBA models are an improvement over contiguity. G i AMOEBA has an extremely high lambda and nonspatial vector: good descriptor of spatial and nonspatial effects. G i AMOEBA shows social variables to be significant in explaining TFR.
27 AMOEBA in Spatial Lag Models A M O E B A Contiguity G i I i c i AIC t VALUES constant hi-ed married Rho Non-Spatial
28 Comparison of Spatial Contiguity and AMOEBA Spatial Lag Model Again all AMOEBA have lower AIC than contiguity; G i AMOEBA is best. All variables significant.
29 Question 2 Can we have confidence in the identification of spatial clusters?
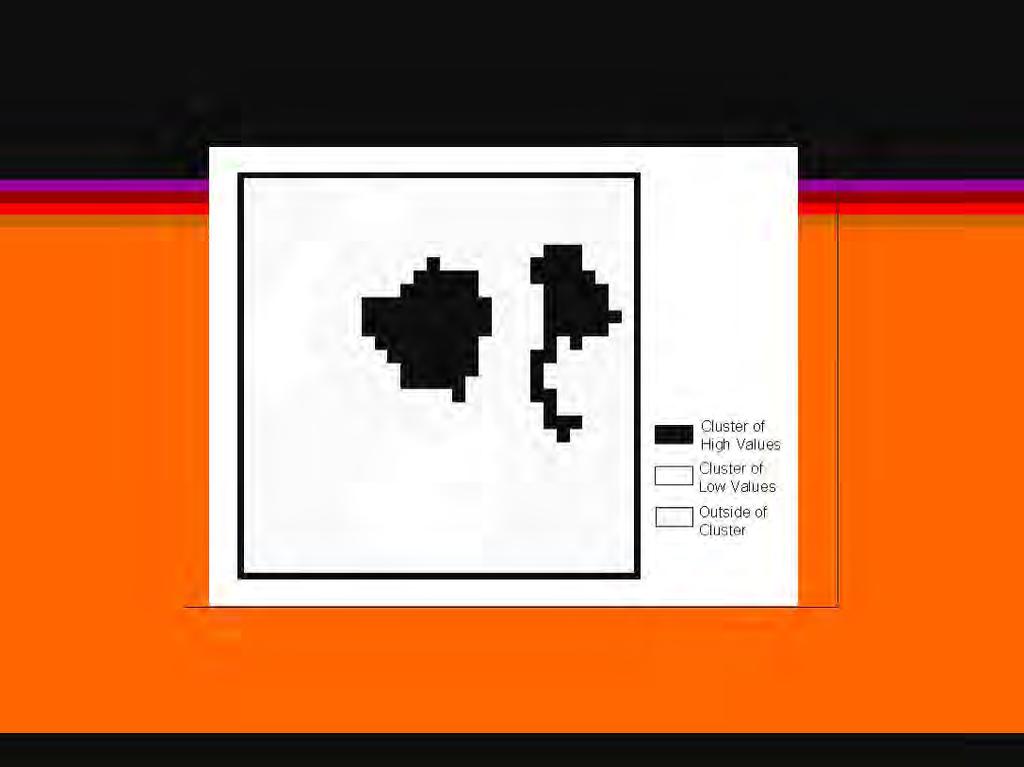
30 Problems with Spatial Clusters Not explicit (what is a cluster?) Are they statistically significant? (degree of confidence) What is the appropriate spatial scale? Often arbitrary, too general Over and under identification Appropriate shape (too circular, ellipsoidal) In general, the believability problem
31 AMOEBA Procedure I For each observation i, local statistics values (e.g., G i*, Z[I i ], Z[c i ]) are obtained for all combinations of near neighbors j of i within distance d of i. The set of j observations that maximizes the local statistic become members of the ecotope together with the i th observation.
32
33 AMOEBA Subsequent Procedures The procedure is repeated at increasing distances from i. At each distance d from i, only the j observations that are contiguous to the already existing ecotope are evaluated. Again, using the local statistic, all combinations together with the already existing ecotope members are evaluated. That new set of j observations that maximizes the local statistic become members of the ecotope.
34
35
36
37 mean = variance = 1 Hypothetical Clusters mean = variance = 1

38 AMOEBA Example 1 LSM AMOEBA G i AMOEBA I i AMOEBA c i
39 AMOEBA Example 2 LSM AMOEBA G i AMOEBA I i AMOEBA c i

40 AMOEBA Example 3 LSM AMOEBA G i AMOEBA I i AMOEBA c i
41 AMOEBA Example 4 LSM AMOEBA G i AMOEBA I i AMOEBA c i
42 AMOEBA Example 5 LSM AMOEBA G i AMOEBA I i AMOEBA c i
43 Heterogeneous Clusters This is like the data used in the GA paper.
 distribution.")
44 Homogeneous Clusters This is the same 6 clusters with radii 2,4, and 6. The high clusters have a mean of.5 and the low clusters have a mean of -.5. These means are added to random values from the Normal(,1) distribution.

45 Peaked Clusters
46
47
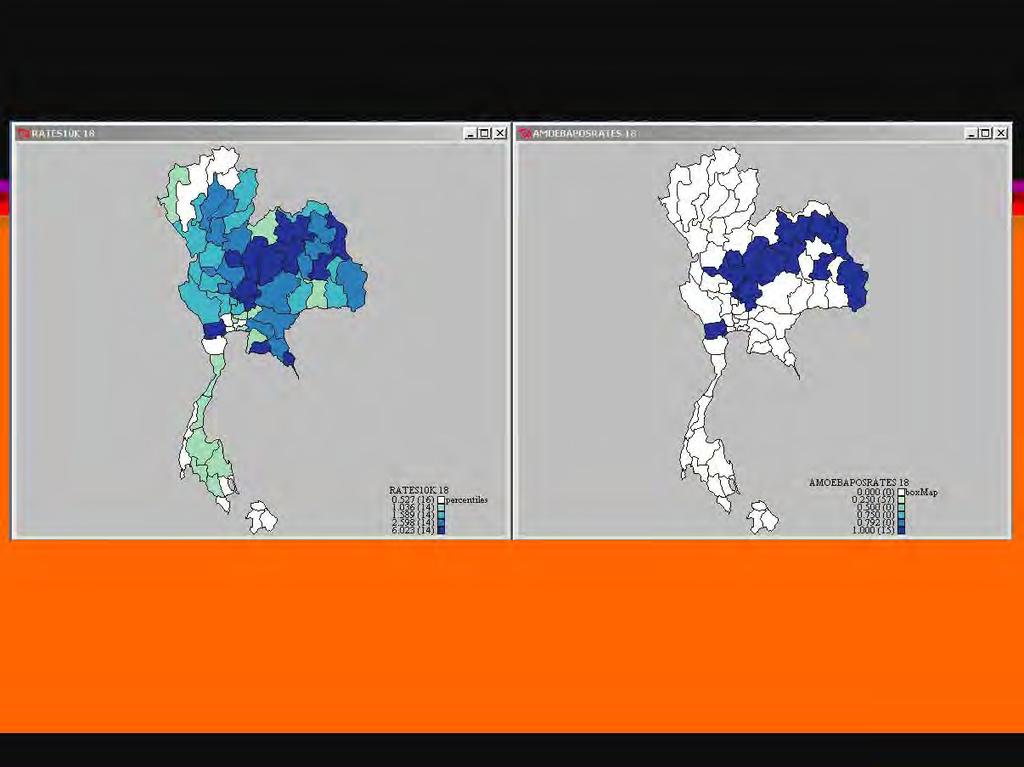
48 Real World Example Clustering of dengue hemorrhagic fever in Thailand by province and by month. 14 years data: 168 monthly observations
49 STARS: A GIS System Rey, Sergio. Space-Time Analysis of Regional Systems (STARS). Available as an open source program on the Internet.
50
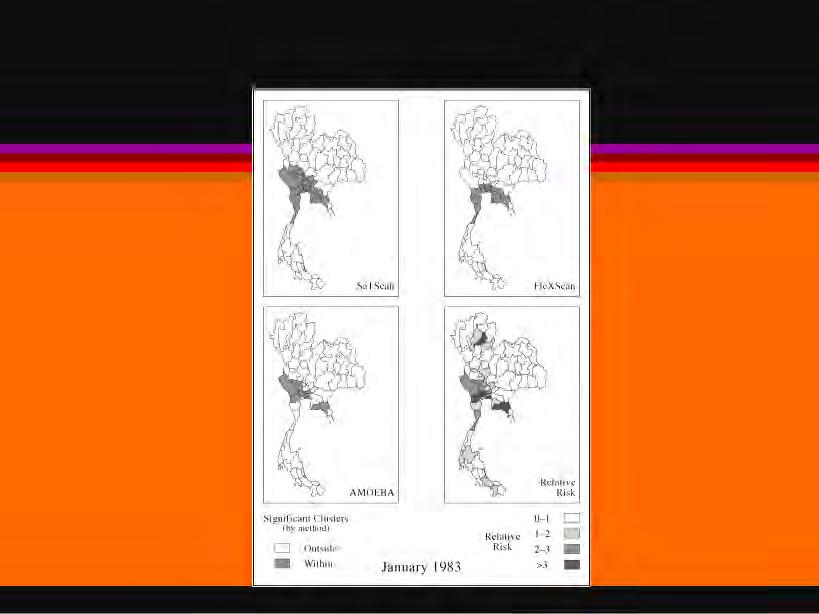
51 Other Clustering Algorithms SaTScan by Kulldorff (1997, v4. 24), (Communications in Statistics) FleXScan by Tango and Takahashi (24, 25) (International Journal of Health Geographics)
52 Bases of Clustering Methods AMOEBA SaTScan FleXScan Based on values of the Based on a moving Based on spatial scan local statistic as d circle of varying radii statistic used on increases in many searching for the circle irregularly shaped directions from an that is the least likely windows formed by index location. to have occurred by connecting adjacent chance. neighbors.
53 Clustering Methods Tests AMOEBA Ho: The sum of the observed values within ecotopes is greater (lesser) than expected by chance. The p value is calculated based on the location of the local statistic values of the observed ecotope within Monte Carlo permutations. SaTScan Ho: The sum of observed cases within the circular search region is proportional to the population size. The p value is calculated based on Poisson realizations using the global rate. FleXScan Ho and p: Same as SaTScan, but within the irregular search region.
54
55
56
57
58
59
60
61 Clustering Comparison High Risk Provinces Low Risk Provinces Cluster No Cluster Cluster No Cluster Relative Risk Expected AMOEBA SaTScan FleXScan
Spatial Analysis 2. Spatial Autocorrelation
 Spatial Analysis 2 Spatial Autocorrelation Spatial Autocorrelation a relationship between nearby spatial units of the same variable If, for every pair of subareas i and j in the study region, the drawings
SPACE Workshop NSF NCGIA CSISS UCGIS SDSU. Aldstadt, Getis, Jankowski, Rey, Weeks SDSU F. Goodchild, M. Goodchild, Janelle, Rebich UCSB
 SPACE Workshop NSF NCGIA CSISS UCGIS SDSU Aldstadt, Getis, Jankowski, Rey, Weeks SDSU F. Goodchild, M. Goodchild, Janelle, Rebich UCSB August 2-8, 2004 San Diego State University Some Examples of Spatial
Using AMOEBA to Create a Spatial Weights Matrix and Identify Spatial Clusters
 Geographical Analysis ISSN 6-76 Using AMOEBA to Create a Spatial Weights Matrix and Identify Spatial Clusters Jared Aldstadt,, Arthur Getis Department of Geography, San Diego State University, San Diego,
Spatial Autocorrelation (2) Spatial Weights
 Spatial Weights") Spatial Autocorrelation (2) Spatial Weights Luc Anselin Spatial Analysis Laboratory Dept. Agricultural and Consumer Economics University of Illinois, Urbana-Champaign http://sal.agecon.uiuc.edu Outline
Spatial Autocorrelation (2) Spatial Weights Luc Anselin Spatial Analysis Laboratory Dept. Agricultural and Consumer Economics University of Illinois, Urbana-Champaign http://sal.agecon.uiuc.edu Outline
Constructing the Spatial Weights Matrix Using a Local Statistic
 Arthur Getis Jared Aldstadt Constructing the Spatial Weights Matrix Using a Local Statistic Spatial weights matrices are necesa y elements in most regression models where a representation of spatial structure
Performance of W-AMOEBA and W-Contiguity matrices in Spatial Lag Model
 PROCEEDING OF 3 RD INTERNATIONAL CONFERENCE ON RESEARCH, IMPLEMENTATION AND EDUCATION OF MATHEMATICS AND SCIENCE YOGYAKARTA, 16 17 MAY 2016 Performance of W-AMOEBA and W-Contiguity matrices in Spatial
Spatial Analysis 1. Introduction
 Spatial Analysis 1 Introduction Geo-referenced Data (not any data) x, y coordinates (e.g., lat., long.) ------------------------------------------------------ - Table of Data: Obs. # x y Variables -------------------------------------
Introduction to Spatial Statistics and Modeling for Regional Analysis
 Introduction to Spatial Statistics and Modeling for Regional Analysis Dr. Xinyue Ye, Assistant Professor Center for Regional Development (Department of Commerce EDA University Center) & School of Earth,
Spatial Regression. 1. Introduction and Review. Luc Anselin. Copyright 2017 by Luc Anselin, All Rights Reserved
 Spatial Regression 1. Introduction and Review Luc Anselin http://spatial.uchicago.edu matrix algebra basics spatial econometrics - definitions pitfalls of spatial analysis spatial autocorrelation spatial
Exploratory Spatial Data Analysis (ESDA)
") Exploratory Spatial Data Analysis (ESDA) VANGHR s method of ESDA follows a typical geospatial framework of selecting variables, exploring spatial patterns, and regression analysis. The primary software
Exploratory Spatial Data Analysis (ESDA) VANGHR s method of ESDA follows a typical geospatial framework of selecting variables, exploring spatial patterns, and regression analysis. The primary software
Application of eigenvector-based spatial filtering approach to. a multinomial logit model for land use data
 Presented at the Seventh World Conference of the Spatial Econometrics Association, the Key Bridge Marriott Hotel, Washington, D.C., USA, July 10 12, 2013. Application of eigenvector-based spatial filtering
SIMULATION AND APPLICATION OF THE SPATIAL AUTOREGRESSIVE GEOGRAPHICALLY WEIGHTED REGRESSION MODEL (SAR-GWR)
") SIMULATION AND APPLICATION OF THE SPATIAL AUTOREGRESSIVE GEOGRAPHICALLY WEIGHTED REGRESSION MODEL (SAR-GWR) I. Gede Nyoman Mindra Jaya 1, Budi Nurani Ruchjana 2, Bertho Tantular 1, Zulhanif 1 and Yudhie
SIMULATION AND APPLICATION OF THE SPATIAL AUTOREGRESSIVE GEOGRAPHICALLY WEIGHTED REGRESSION MODEL (SAR-GWR) I. Gede Nyoman Mindra Jaya 1, Budi Nurani Ruchjana 2, Bertho Tantular 1, Zulhanif 1 and Yudhie
Modeling the Ecology of Urban Inequality in Space and Time
 Modeling the Ecology of Urban Inequality in Space and Time Corina Graif PhD Candidate, Department Of Sociology Harvard University Presentation for the Workshop on Spatial and Temporal Modeling, Center
Identification of Local Clusters for Count Data: A. Model-Based Moran s I Test
 Identification of Local Clusters for Count Data: A Model-Based Moran s I Test Tonglin Zhang and Ge Lin Purdue University and West Virginia University February 14, 2007 Department of Statistics, Purdue
Cluster Analysis using SaTScan. Patrick DeLuca, M.A. APHEO 2007 Conference, Ottawa October 16 th, 2007
 Cluster Analysis using SaTScan Patrick DeLuca, M.A. APHEO 2007 Conference, Ottawa October 16 th, 2007 Outline Clusters & Cluster Detection Spatial Scan Statistic Case Study 28 September 2007 APHEO Conference
Temporal vs. Spatial Data
 Temporal vs. Spatial Data Temporal 1 dimensional Units: day, week, month Lag: t, t-1, t-2 Durbin-Watson Spatial 2-3 dimensional Units: county, mile, region Lag: near neighbor, networks (?) Moran s I Differencing
An Introduction to Pattern Statistics
 An Introduction to Pattern Statistics Nearest Neighbors The CSR hypothesis Clark/Evans and modification Cuzick and Edwards and controls All events k function Weighted k function Comparative k functions
Spatial Modeling, Regional Science, Arthur Getis Emeritus, San Diego State University March 1, 2016
 Spatial Modeling, Regional Science, and UCSB Arthur Getis Emeritus, San Diego State University March 1, 2016 My Link to UCSB The 1980s at UCSB (summers and sabbatical) Problems within Geography: The Quantitative
Spatial Analysis I. Spatial data analysis Spatial analysis and inference
 Spatial Analysis I Spatial data analysis Spatial analysis and inference Roadmap Outline: What is spatial analysis? Spatial Joins Step 1: Analysis of attributes Step 2: Preparing for analyses: working with
Lattice Data. Tonglin Zhang. Spatial Statistics for Point and Lattice Data (Part III)
") Title: Spatial Statistics for Point Processes and Lattice Data (Part III) Lattice Data Tonglin Zhang Outline Description Research Problems Global Clustering and Local Clusters Permutation Test Spatial
Title: Spatial Statistics for Point Processes and Lattice Data (Part III) Lattice Data Tonglin Zhang Outline Description Research Problems Global Clustering and Local Clusters Permutation Test Spatial
Community Health Needs Assessment through Spatial Regression Modeling
 Community Health Needs Assessment through Spatial Regression Modeling Glen D. Johnson, PhD CUNY School of Public Health glen.johnson@lehman.cuny.edu Objectives: Assess community needs with respect to particular
Spatial Clusters of Rates
 Spatial Clusters of Rates Luc Anselin http://spatial.uchicago.edu concepts EBI local Moran scan statistics Concepts Rates as Risk from counts (spatially extensive) to rates (spatially intensive) rate =
Spatial Statistics For Real Estate Data 1
 1 Key words: spatial heterogeneity, spatial autocorrelation, spatial statistics, geostatistics, Geographical Information System SUMMARY: The paper presents spatial statistics tools in application to real
Rob Baller Department of Sociology University of Iowa. August 17, 2003
 Applying a Spatial Perspective to the Study of Violence: Lessons Learned Rob Baller Department of Sociology University of Iowa August 17, 2003 Much of this work was funded by the National Consortium on
Lecture 3: Exploratory Spatial Data Analysis (ESDA) Prof. Eduardo A. Haddad
 Prof. Eduardo A. Haddad") Lecture 3: Exploratory Spatial Data Analysis (ESDA) Prof. Eduardo A. Haddad Key message Spatial dependence First Law of Geography (Waldo Tobler): Everything is related to everything else, but near things
Lecture 3: Exploratory Spatial Data Analysis (ESDA) Prof. Eduardo A. Haddad Key message Spatial dependence First Law of Geography (Waldo Tobler): Everything is related to everything else, but near things
Spatial Econometric STAR Models: Lagrange Multiplier Tests and Monte Carlo Simulations
 Spatial Econometric STAR Models: Lagrange Multiplier Tests and Monte Carlo Simulations Valerien O. Pede Department of Agricultural Economics, Purdue University West Lafayette, IN 47907, USA, vpede@purdue.edu
Lecture 3: Exploratory Spatial Data Analysis (ESDA) Prof. Eduardo A. Haddad
 Prof. Eduardo A. Haddad") Lecture 3: Exploratory Spatial Data Analysis (ESDA) Prof. Eduardo A. Haddad Key message Spatial dependence First Law of Geography (Waldo Tobler): Everything is related to everything else, but near things
Lecture 3: Exploratory Spatial Data Analysis (ESDA) Prof. Eduardo A. Haddad Key message Spatial dependence First Law of Geography (Waldo Tobler): Everything is related to everything else, but near things
CHAPTER 3 APPLICATION OF MULTIVARIATE TECHNIQUE SPATIAL ANALYSIS ON RURAL POPULATION UNDER POVERTYLINE FROM OFFICIAL STATISTICS, THE WORLD BANK
 CHAPTER 3 APPLICATION OF MULTIVARIATE TECHNIQUE SPATIAL ANALYSIS ON RURAL POPULATION UNDER POVERTYLINE FROM OFFICIAL STATISTICS, THE WORLD BANK 3.1 INTRODUCTION: In regional science, space is a central
Basics of Geographic Analysis in R
 Basics of Geographic Analysis in R Spatial Autocorrelation and Spatial Weights Yuri M. Zhukov GOV 2525: Political Geography February 25, 2013 Outline 1. Introduction 2. Spatial Data and Basic Visualization
Areal data models. Spatial smoothers. Brook s Lemma and Gibbs distribution. CAR models Gaussian case Non-Gaussian case
 Areal data models Spatial smoothers Brook s Lemma and Gibbs distribution CAR models Gaussian case Non-Gaussian case SAR models Gaussian case Non-Gaussian case CAR vs. SAR STAR models Inference for areal
Cluster Analysis using SaTScan
 Cluster Analysis using SaTScan Summary 1. Statistical methods for spatial epidemiology 2. Cluster Detection What is a cluster? Few issues 3. Spatial and spatio-temporal Scan Statistic Methods Probability
Modeling Spatial Dependence and Spatial Heterogeneity in. County Yield Forecasting Models
 Modeling Spatial Dependence and Spatial Heterogeneity in County Yield Forecasting Models August 1, 2000 AAEA Conference Tampa, Summer 2000 Session 8 Cassandra DiRienzo Paul Fackler Barry K. Goodwin North
Variables and Variable De nitions
 APPENDIX A Variables and Variable De nitions All demographic county-level variables have been drawn directly from the 1970, 1980, and 1990 U.S. Censuses of Population, published by the U.S. Department
Outline. Overview of Issues. Spatial Regression. Luc Anselin
 Spatial Regression Luc Anselin University of Illinois, Urbana-Champaign http://www.spacestat.com Outline Overview of Issues Spatial Regression Specifications Space-Time Models Spatial Latent Variable Models
Testing Random Effects in Two-Way Spatial Panel Data Models
 Testing Random Effects in Two-Way Spatial Panel Data Models Nicolas Debarsy May 27, 2010 Abstract This paper proposes an alternative testing procedure to the Hausman test statistic to help the applied
ESRI 2008 Health GIS Conference
 ESRI 2008 Health GIS Conference An Exploration of Geographically Weighted Regression on Spatial Non- Stationarity and Principal Component Extraction of Determinative Information from Robust Datasets A
Spatial correlation and demography.
 Spatial correlation and demography. Sébastien Oliveau, Christophe Guilmoto To cite this version: Sébastien Oliveau, Christophe Guilmoto. Spatial correlation and demography.: Exploring India s demographic
NONPARAMETRIC ESTIMATION OF THE SPATIAL CONNECTIVITY MATRIX BY THE METHOD OF MOMENTS USING SPATIAL PANEL DATA
 NONPARAMETRIC ESTIMATION OF THE SPATIAL CONNECTIVITY MATRIX BY THE METHOD OF MOMENTS USING SPATIAL PANEL DATA Michael Beenstock Nadav ben Zeev Department of Economics Hebrew University of Jerusalem Daniel
Spatial Autocorrelation
 Spatial Autocorrelation Luc Anselin http://spatial.uchicago.edu spatial randomness positive and negative spatial autocorrelation spatial autocorrelation statistics spatial weights Spatial Randomness The
Network data in regression framework
 13-14 July 2009 University of Salerno (Italy) Network data in regression framework Maria ProsperinaVitale Department of Economics and Statistics University of Salerno (Italy) mvitale@unisa.it - Theoretical
Finding Hot Spots in ArcGIS Online: Minimizing the Subjectivity of Visual Analysis. Nicholas M. Giner Esri Parrish S.
 Finding Hot Spots in ArcGIS Online: Minimizing the Subjectivity of Visual Analysis Nicholas M. Giner Esri Parrish S. Henderson FBI Agenda The subjectivity of maps What is Hot Spot Analysis? Why do Hot
ON THE NEGATION OF THE UNIFORMITY OF SPACE RESEARCH ANNOUNCEMENT
 MIDWEST STUDENT SUMMIT ON SPACE, HEALTH AND POPULATION ECONOMICS APRIL 18-19, 2007 PURDUE UNIVERSITY ON THE NEGATION OF THE UNIFORMITY OF SPACE RESEARCH ANNOUNCEMENT Benoit Delbecq Agricultural Economics
Spatial Regression. 10. Specification Tests (2) Luc Anselin. Copyright 2017 by Luc Anselin, All Rights Reserved
 Luc Anselin. Copyright 2017 by Luc Anselin, All Rights Reserved") Spatial Regression 10. Specification Tests (2) Luc Anselin http://spatial.uchicago.edu 1 robust LM tests higher order tests 2SLS residuals specification search 2 Robust LM Tests 3 Recap and Notation LM-Error
Spatial Regression 10. Specification Tests (2) Luc Anselin http://spatial.uchicago.edu 1 robust LM tests higher order tests 2SLS residuals specification search 2 Robust LM Tests 3 Recap and Notation LM-Error
Kazuhiko Kakamu Department of Economics Finance, Institute for Advanced Studies. Abstract
 Bayesian Estimation of A Distance Functional Weight Matrix Model Kazuhiko Kakamu Department of Economics Finance, Institute for Advanced Studies Abstract This paper considers the distance functional weight
Empirical versus exogenous spatial weighting matrices: an entropy-based intermediate solution
 Empirical versus exogenous spatial weighting matrices: an entropy-based intermediate solution Esteban Fernández Vázquez Department of Applied Economics-University of Oviedo Phone: (+34)985105056; e-mail:
In matrix algebra notation, a linear model is written as
 DM3 Calculation of health disparity Indices Using Data Mining and the SAS Bridge to ESRI Mussie Tesfamicael, University of Louisville, Louisville, KY Abstract Socioeconomic indices are strongly believed
The Use of Spatial Weights Matrices and the Effect of Geometry and Geographical Scale
 The Use of Spatial Weights Matrices and the Effect of Geometry and Geographical Scale António Manuel RODRIGUES 1, José António TENEDÓRIO 2 1 Research fellow, e-geo Centre for Geography and Regional Planning,
W-BASED VS LATENT VARIABLES SPATIAL AUTOREGRESSIVE MODELS: EVIDENCE FROM MONTE CARLO SIMULATIONS
 1 W-BASED VS LATENT VARIABLES SPATIAL AUTOREGRESSIVE MODELS: EVIDENCE FROM MONTE CARLO SIMULATIONS An Liu University of Groningen Henk Folmer University of Groningen Wageningen University Han Oud Radboud
Local Spatial Autocorrelation Clusters
 Local Spatial Autocorrelation Clusters Luc Anselin http://spatial.uchicago.edu LISA principle local Moran local G statistics issues and interpretation LISA Principle Clustering vs Clusters global spatial
Lecture 7: Spatial Econometric Modeling of Origin-Destination flows
 Lecture 7: Spatial Econometric Modeling of Origin-Destination flows James P. LeSage Department of Economics University of Toledo Toledo, Ohio 43606 e-mail: jlesage@spatial-econometrics.com June 2005 The
Using Spatial Statistics Social Service Applications Public Safety and Public Health
 Using Spatial Statistics Social Service Applications Public Safety and Public Health Lauren Rosenshein 1 Regression analysis Regression analysis allows you to model, examine, and explore spatial relationships,
Spatial Effects and Externalities
 Spatial Effects and Externalities Philip A. Viton November 5, Philip A. Viton CRP 66 Spatial () Externalities November 5, / 5 Introduction If you do certain things to your property for example, paint your
Nonparametric Estimation of the Spatial Connectivity Matrix Using Spatial Panel Data
 Geographical Analysis (2012), Nonparametric Estimation of the Spatial Connectivity Matrix Using Spatial Panel Data Michael Beenstock 1, Daniel Felsenstein 2 1 Department of Economics, Hebrew University
Spatial Regression. 6. Specification Spatial Heterogeneity. Luc Anselin.
 Spatial Regression 6. Specification Spatial Heterogeneity Luc Anselin http://spatial.uchicago.edu 1 homogeneity and heterogeneity spatial regimes spatially varying coefficients spatial random effects 2
A SPATIAL ANALYSIS OF A RURAL LAND MARKET USING ALTERNATIVE SPATIAL WEIGHT MATRICES
 A Spatial Analysis of a Rural Land Market Using Alternative Spatial Weight Matrices A SPATIAL ANALYSIS OF A RURAL LAND MARKET USING ALTERNATIVE SPATIAL WEIGHT MATRICES Patricia Soto, Louisiana State University
W-BASED VS LATENT VARIABLES SPATIAL AUTOREGRESSIVE MODELS: EVIDENCE FROM MONTE CARLO SIMULATIONS
 W-BASED VS LATENT VARIABLES SPATIAL AUTOREGRESSIVE MODELS: EVIDENCE FROM MONTE CARLO SIMULATIONS. Introduction When it coes to applying econoetric odels to analyze georeferenced data, researchers are well
ESE 502: Assignments 6 & 7
 ESE 502: Assignments 6 & 7 Claire McLeod April 28, 2015 Many types of data are aggregated and recorded over a sub- region. Such areal data is particularly common in health and census data, where metrics
Optimum Spatial Weighted in Small Area Estimation
 Global Journal of Pure and Applied Mathematics. ISSN 0973-1768 Volume 12, Number 5 (2016), pp. 3977-3989 Research India Publications http://www.ripublication.com/gjpam.htm Optimum Spatial Weighted in Small
FleXScan User Guide. for version 3.1. Kunihiko Takahashi Tetsuji Yokoyama Toshiro Tango. National Institute of Public Health
 FleXScan User Guide for version 3.1 Kunihiko Takahashi Tetsuji Yokoyama Toshiro Tango National Institute of Public Health October 2010 http://www.niph.go.jp/soshiki/gijutsu/index_e.html User Guide version
Spatial Autocorrelation and Interactions between Surface Temperature Trends and Socioeconomic Changes
 Spatial Autocorrelation and Interactions between Surface Temperature Trends and Socioeconomic Changes Ross McKitrick Department of Economics University of Guelph December, 00 1 1 1 1 Spatial Autocorrelation
GIS and Spatial Statistics: One World View or Two? Michael F. Goodchild University of California Santa Barbara
 GIS and Spatial Statistics: One World View or Two? Michael F. Goodchild University of California Santa Barbara Location as attribute The data table Census summary table What value is location as an explanatory
An Introduction to SaTScan
 An Introduction to SaTScan Software to measure spatial, temporal or space-time clusters using a spatial scan approach Marilyn O Hara University of Illinois moruiz@illinois.edu Lecture for the Pre-conference
Geographically weighted regression approach for origin-destination flows
 Geographically weighted regression approach for origin-destination flows Kazuki Tamesue 1 and Morito Tsutsumi 2 1 Graduate School of Information and Engineering, University of Tsukuba 1-1-1 Tennodai, Tsukuba,
Exploratory Spatial Data Analysis Using GeoDA: : An Introduction
 Exploratory Spatial Data Analysis Using GeoDA: : An Introduction Prepared by Professor Ravi K. Sharma, University of Pittsburgh Modified for NBDPN 2007 Conference Presentation by Professor Russell S. Kirby,
Geographically Weighted Regression (GWR) Modelling with Weighted Fixed Gaussian Kernel and Queen Contiguity for Dengue Fever Case Data
 Modelling with Weighted Fixed Gaussian Kernel and Queen Contiguity for Dengue Fever Case Data") CAUCHY Jurnal Matematika Murni dan Aplikasi Volume 5(1)(017), Pages 15-19 p-issn: 086-038; e-issn: 477-3344 Geographically Weighted Regression (GWR) Modelling with Weighted Fixed Gaussian and Queen Grissila
CAUCHY Jurnal Matematika Murni dan Aplikasi Volume 5(1)(017), Pages 15-19 p-issn: 086-038; e-issn: 477-3344 Geographically Weighted Regression (GWR) Modelling with Weighted Fixed Gaussian and Queen Grissila
Spatial Trends of unpaid caregiving in Ireland
 Spatial Trends of unpaid caregiving in Ireland Stamatis Kalogirou 1,*, Ronan Foley 2 1. NCG Affiliate, Thoukididi 20, Drama, 66100, Greece; Tel: +30 6977 476776; Email: skalogirou@gmail.com; Web: http://www.gisc.gr.
Outline. Practical Point Pattern Analysis. David Harvey s Critiques. Peter Gould s Critiques. Global vs. Local. Problems of PPA in Real World
 Outline Practical Point Pattern Analysis Critiques of Spatial Statistical Methods Point pattern analysis versus cluster detection Cluster detection techniques Extensions to point pattern measures Multiple
Spatial heterogeneity in economic growth of European regions
 Spatial heterogeneity in economic growth of European regions Paolo Postiglione 1, M.Simona Andreano 2, Roberto Benedetti 3 Draft version (please do not cite) July 4, 2015 Abstract This paper describes
Measuring The Benefits of Air Quality Improvement: A Spatial Hedonic Approach. Chong Won Kim, Tim Phipps, and Luc Anselin
 Measuring The Benefits of Air Quality Improvement: A Spatial Hedonic Approach Chong Won Kim, Tim Phipps, and Luc Anselin Paper prepared for presentation at the AAEA annual meetings, Salt Lake City, August,
Focal Location Quotients: Specification and Applications
 Geographical Analysis (2012), Focal Location Quotients: Specification and Applications Robert G. Cromley, Dean M. Hanink Department of Geography, University of Connecticut, Storrs, CT, USA Location quotients
1Department of Demography and Organization Studies, University of Texas at San Antonio, One UTSA Circle, San Antonio, TX
 Well, it depends on where you're born: A practical application of geographically weighted regression to the study of infant mortality in the U.S. P. Johnelle Sparks and Corey S. Sparks 1 Introduction Infant
GeoDa and Spatial Regression Modeling
 GeoDa and Spatial Regression Modeling June 9, 2006 Stephen A. Matthews Associate Professor of Sociology & Anthropology, Geography and Demography Director of the Geographic Information Analysis Core Population
The Study on Trinary Join-Counts for Spatial Autocorrelation
 Proceedings of the 8th International Symposium on Spatial Accuracy Assessment in Natural Resources and Environmental Sciences Shanghai, P. R. China, June 5-7, 008, pp. -8 The Study on Trinary Join-Counts
Lab #3 Background Material Quantifying Point and Gradient Patterns
 Lab #3 Background Material Quantifying Point and Gradient Patterns Dispersion metrics Dispersion indices that measure the degree of non-randomness Plot-based metrics Distance-based metrics First-order
Bayesian Hierarchical Models
 Bayesian Hierarchical Models Gavin Shaddick, Millie Green, Matthew Thomas University of Bath 6 th - 9 th December 2016 1/ 34 APPLICATIONS OF BAYESIAN HIERARCHICAL MODELS 2/ 34 OUTLINE Spatial epidemiology
Lecture 5: Spatial probit models. James P. LeSage University of Toledo Department of Economics Toledo, OH
 Lecture 5: Spatial probit models James P. LeSage University of Toledo Department of Economics Toledo, OH 43606 jlesage@spatial-econometrics.com March 2004 1 A Bayesian spatial probit model with individual
Spatial autocorrelation: robustness of measures and tests
 Spatial autocorrelation: robustness of measures and tests Marie Ernst and Gentiane Haesbroeck University of Liege London, December 14, 2015 Spatial Data Spatial data : geographical positions non spatial
Finite Sample Properties of Moran s I Test for Spatial Autocorrelation in Probit and Tobit Models - Empirical Evidence
 Finite Sample Properties of Moran s I Test for Spatial Autocorrelation in Probit and Tobit Models - Empirical Evidence Pedro V. Amaral and Luc Anselin 2011 Working Paper Number 07 Finite Sample Properties
Combining Regressive and Auto-Regressive Models for Spatial-Temporal Prediction
 Combining Regressive and Auto-Regressive Models for Spatial-Temporal Prediction Dragoljub Pokrajac DPOKRAJA@EECS.WSU.EDU Zoran Obradovic ZORAN@EECS.WSU.EDU School of Electrical Engineering and Computer
Lecture 1: Introduction to Spatial Econometric
 Lecture 1: Introduction to Spatial Econometric Professor: Mauricio Sarrias Universidad Católica del Norte September 7, 2017 1 Introduction to Spatial Econometric Mandatory Reading Why do We Need Spatial
Spatial Regression Models for Demographic Analysis
 Popul Res Policy Rev (2008) 27:17 42 DOI 10.1007/s11113-007-9051-8 Spatial Regression Models for Demographic Analysis Guangqing Chi Æ Jun Zhu Published online: 27 September 2007 Ó Springer Science+Business
Local versus Global Convergence in Europe: A Bayesian Spatial Econometric Approach
 The Review of Regional Studies, Vol. 37, No. 1, 007, pp. 8 108 ISSN 1553-089 Local versus Global Convergence in Europe: A Bayesian Spatial Econometric Approach Cem Ertur Laboratoire d Economie d Orléans,
Areal Unit Data Regular or Irregular Grids or Lattices Large Point-referenced Datasets
 Areal Unit Data Regular or Irregular Grids or Lattices Large Point-referenced Datasets Is there spatial pattern? Chapter 3: Basics of Areal Data Models p. 1/18 Areal Unit Data Regular or Irregular Grids
Spatial inference. Spatial inference. Accounting for spatial correlation. Multivariate normal distributions
 Spatial inference I will start with a simple model, using species diversity data Strong spatial dependence, Î = 0.79 what is the mean diversity? How precise is our estimate? Sampling discussion: The 64
Spatial Investigation of Mineral Transportation Characteristics in the State of Washington
 Khachatryan, Jessup 1 Spatial Investigation of Mineral Transportation Characteristics in the State of Washington Hayk Khachatryan Graduate Student Email: hkhachatryan@wsu.edu Eric L. Jessup Assistant Professor
Spatial groupwise heteroskedasticity and the SCAN approach
 Spatial groupwise heteroskedasticity and the SCAN approach Coro Chasco, Julie Le Gallo, Fernando A. López and Jesús Mur (*) Universidad Autónoma de Madrid. email: coro.chasco@uam.es (**) Université Bourgogne
Departamento de Economía Universidad de Chile
 Departamento de Economía Universidad de Chile GRADUATE COURSE SPATIAL ECONOMETRICS November 14, 16, 17, 20 and 21, 2017 Prof. Henk Folmer University of Groningen Objectives The main objective of the course
Evaluating sustainable transportation offers through housing price: a comparative analysis of Nantes urban and periurban/rural areas (France)
") Evaluating sustainable transportation offers through housing price: a comparative analysis of Nantes urban and periurban/rural areas (France) Julie Bulteau, UVSQ-CEARC-OVSQ Thierry Feuillet, Université
Evaluating sustainable transportation offers through housing price: a comparative analysis of Nantes urban and periurban/rural areas (France) Julie Bulteau, UVSQ-CEARC-OVSQ Thierry Feuillet, Université
Proceedings of the 8th WSEAS International Conference on APPLIED MATHEMATICS, Tenerife, Spain, December 16-18, 2005 (pp )
") Proceedings of the 8th WSEAS International Conference on APPLIED MATHEMATICS, Tenerife, Spain, December 16-18, 005 (pp159-164) Spatial Econometrics Modeling of Poverty FERDINAND J. PARAGUAS 1 AND ANTON
Proceedings of the 8th WSEAS International Conference on APPLIED MATHEMATICS, Tenerife, Spain, December 16-18, 005 (pp159-164) Spatial Econometrics Modeling of Poverty FERDINAND J. PARAGUAS 1 AND ANTON
Ensemble Spatial Autoregressive Model on. the Poverty Data in Java
 Applied Mathematical Sciences, Vol. 9, 2015, no. 43, 2103-2110 HIKARI Ltd, www.m-hikari.com http://dx.doi.org/10.12988/ams.2015.4121034 Ensemble Spatial Autoregressive Model on the Poverty Data in Java
Spatial Regression. 11. Spatial Two Stage Least Squares. Luc Anselin. Copyright 2017 by Luc Anselin, All Rights Reserved
 Spatial Regression 11. Spatial Two Stage Least Squares Luc Anselin http://spatial.uchicago.edu 1 endogeneity and instruments spatial 2SLS best and optimal estimators HAC standard errors 2 Endogeneity and
GIS CONFERENCE MAKING PLACE MATTER Decoding Health Data with Spatial Statistics
 esri HEALTH AND HUMAN SERVICES GIS CONFERENCE MAKING PLACE MATTER Decoding Health Data with Spatial Statistics Flora Vale Jenora D Acosta Wait a minute Wait a minute Where is Lauren?? Wait a minute Where
Spatial Regression. 9. Specification Tests (1) Luc Anselin. Copyright 2017 by Luc Anselin, All Rights Reserved
 Luc Anselin. Copyright 2017 by Luc Anselin, All Rights Reserved") Spatial Regression 9. Specification Tests (1) Luc Anselin http://spatial.uchicago.edu 1 basic concepts types of tests Moran s I classic ML-based tests LM tests 2 Basic Concepts 3 The Logic of Specification
Spatial Regression 9. Specification Tests (1) Luc Anselin http://spatial.uchicago.edu 1 basic concepts types of tests Moran s I classic ML-based tests LM tests 2 Basic Concepts 3 The Logic of Specification
International Journal of Remote Sensing, in press, 2006.
 International Journal of Remote Sensing, in press, 2006. Parameter Selection for Region-Growing Image Segmentation Algorithms using Spatial Autocorrelation G. M. ESPINDOLA, G. CAMARA*, I. A. REIS, L. S.
Econometrics Honor s Exam Review Session. Spring 2012 Eunice Han
 Econometrics Honor s Exam Review Session Spring 2012 Eunice Han Topics 1. OLS The Assumptions Omitted Variable Bias Conditional Mean Independence Hypothesis Testing and Confidence Intervals Homoskedasticity
Spatial Data Mining. Regression and Classification Techniques
 Spatial Data Mining Regression and Classification Techniques 1 Spatial Regression and Classisfication Discrete class labels (left) vs. continues quantities (right) measured at locations (2D for geographic
Answer all questions from part I. Answer two question from part II.a, and one question from part II.b.
 B203: Quantitative Methods Answer all questions from part I. Answer two question from part II.a, and one question from part II.b. Part I: Compulsory Questions. Answer all questions. Each question carries
Reasons for Instability in Spatial Dependence Models
 1 Reasons for nstability in Spatial Dependence Models Jesús Mur () Fernando López () Ana Angulo () () Department of Economic Analysis University of Zaragoza Gran Vía, -4. (55). Zaragoza. Spain. e-mail:
ESTIMATION PROBLEMS IN MODELS WITH SPATIAL WEIGHTING MATRICES WHICH HAVE BLOCKS OF EQUAL ELEMENTS*
 JOURNAL OF REGIONAL SCIENCE, VOL. 46, NO. 3, 2006, pp. 507 515 ESTIMATION PROBLEMS IN MODELS WITH SPATIAL WEIGHTING MATRICES WHICH HAVE BLOCKS OF EQUAL ELEMENTS* Harry H. Kelejian Department of Economics,
COLUMN. Spatial Analysis in R: Part 2 Performing spatial regression modeling in R with ACS data
 Spatial Demography 2013 1(2): 219-226 http://spatialdemography.org OPEN ACCESS via Creative Commons 3.0 ISSN 2164-7070 (online) COLUMN Spatial Analysis in R: Part 2 Performing spatial regression modeling