Cluster Analysis using SaTScan
|
|
|
- Timothy Henry
- 5 years ago
- Views:
Transcription


1 Cluster Analysis using SaTScan
2 Summary 1. Statistical methods for spatial epidemiology 2. Cluster Detection What is a cluster? Few issues 3. Spatial and spatio-temporal Scan Statistic Methods Probability based models (Bernoulli & Poisson) Focused tests
3 Outline 1. Statistical methods for spatial epidemiology 2. Cluster Detection What is a cluster? Few issues 3. Spatial and spatio-temporal Scan Statistic
4 Spatial Epidemiology Knowledge about the spatial distribution: Are there areas with higher risk than others? Possible relationship with environmental factors: Is the spatial distribution of the disease somehow related to the spatial distribution of a risk factor measured at the same aggregation level? Location of the high risk areas: Are high risk areas geographically clustered or randomly spread?
5 Spatial Epidemiology Disease mapping. Ecological regression (geographical correlation studies). Assessment of risk in relation to a point source. Cluster detection.
6 Spatial Epidemiology: cluster detection Brooker, S et al. Spatial clustering of malaria and associated risk factors during an epidemic in a highland area of western Kenya. Trop Med Int Health Jul;9(7): The epidemiology of malaria over small areas remains poorly understood, and this is particularly true for malaria during epidemics in highland areas of Africa, where transmission intensity is low andcharacterized by acute within and between year variations. We report an analysis of the spatial distribution of clinical malaria during an epidemic and investigate putative risk factors. Active case surveillance was undertaken in three schools in Nandi District, Western Kenya for 10 weeks during a malaria outbreak in May July Household surveys of cases and age-matched controls were conducted to collect information on household construction, exposure factors and socio-economic status. Household geographical location and altitude were determined using a hand-held geographical positioning system and landcover types were determined using high spatial resolution satellite sensor data. Among 129 cases identified during the surveillance, which were matched to 155 controls, we identified significant spatial clusters of malaria cases as determined using the spatial scan statistic. Conditional multiple logistic regression analysis showed that the risk of malaria was higher in children who were underweight, who lived at lower altitudes, and who lived in households where drugs were not kept at home.
7 Outline 1. Statistical methods for spatial epidemiology 2. Cluster Detection What is a cluster? Few issues 3. Spatial and spatio-temporal Scan Statistic
8 What is a cluster?
9 What is a cluster? 1. An unusual collection of events. 2. Unusual aggregation of real or perceived health events. 3. Aggregation of relatively uncommon events or diseases in pace and/or time in amounts that are believed or perceived to be greater than could be expected by chance (Last, 2001) 4. A geographically and/or temporally bounded collection of occurrences: of a disease already known to occur typically in clusters, or of sufficient size and concentration to be unlikely to have occurred by chance, or related to each other through some social or biological mechanism, or having a common relationship with some other event or circumstance (Knox, 1989)
10 Cluster detection: Few issues Over what scale does any clustering occur? Are clusters merely a result of some obvious a priori heterogeneity in the study region? Are they associated with proximity to other features of interest, such as transport arteries or possible point sources of pollution? Are events that cluster in space also clustered in time?
11 Cluster detection: Global and Local Tests Global tests detect the presence or absence of clustering over the whole study region without specifying the spatial location. Local tests additionally specify the location and if extended to consider temporal patterns, can specify spatio-temporal clusters. A special case of local tests is the focused test which is used to detect raised incidence of disease around some pre-specified source, such as an pollutant source.
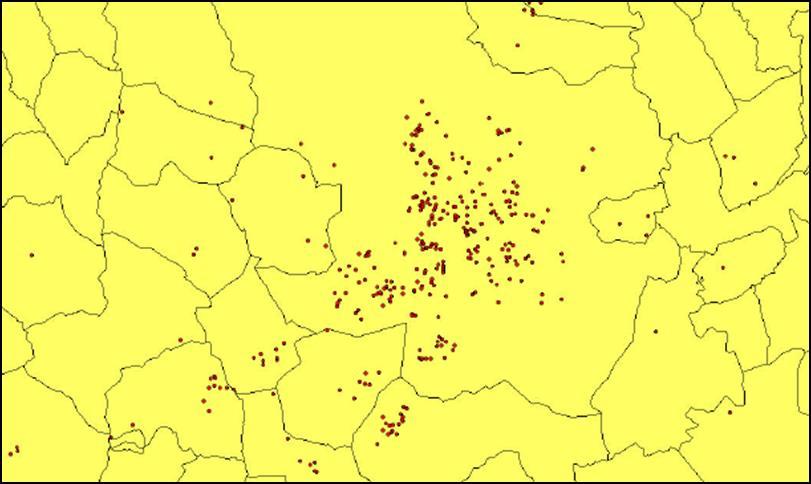
12 Cluster detection: Point data
13 Cluster detection: Area data (aggregated)
14 Cluster detection: Statistical Methods Global Measures Point based methods Ripley s K function (and its variants) Area based methods Moran s I Local Measures Kernel density estimation Kuldorff s spatial scan statistic Local Moran s I Kuldorff s spatial scan statistic
15 Outline 1. Statistical methods for spatial epidemiology 2. Cluster Detection 3. Spatial and spatio-temporal Scan Statistic Method Probability model based (Bernoulli & Poisson) Focused tests
16 SaTScan. Introduction Analyzes spatial, temporal and spatio-temporal data through a scan statistic Quick assessment of potential clusters Developed by Martin Kuldorff for the National Cancer Institute Freely available from
17 SatScan. Objectives To perform geographical surveillance of disease, to detect spatial or space-time disease clusters, and to see if they are statistically significant. To test whether a disease is randomly distributed over space, over time or over space and time. To evaluate reported spatial or space-time disease clusters, to see if they are statistically significant. To perform repeated time-periodic disease surveillance for the early detection of disease outbreaks.

18 SatScan. Co-ordinates for area data
19 SatScan. The method 1. A circular scanning window is placed at different coordinates with radii that vary from 0 to some set upper limit. 2. For each location and size of window: H A = elevated risk within window as compared to outside of window

20 SatScan. The method
21 SatScan. The method Likelihood function is created depending on model selected (more later..) Likelihood = hypothetical probability that an event that has already occurred would yield a specific outcome Function is maximized over all window locations and sizes The one with the maximum likelihood is most likely cluster (least likely to have occurred by chance) Likelihood ratio for this window becomes maximum likelihood ratio test statistic A p-value is obtained for the cluster by Monte Carlo hypothesis testing
22 SatScan. The method Indicates whether there is clustering Shows us where it is (text description) Evaluates its statistical significance Produces a relative risk for the cluster Which can be low or high risk Does not rely on a priori knowledge of any cluster

23 SatScan. The method Types of Analysis & Models
24 SatScan. Poisson models Should be used when background population reflects a certain risk mass such as total persons in an area Expected number of cases is directly proportional to the total number of persons Example # cases of cancer per 100,000 persons
25 SatScan. Poisson models Likelihood function: C = total number of cases c = observed number of cases in window E[c] = covariate adjusted expected number of cases in window I() = indicator function


26 SatScan. Poisson models Need to import this into a GIS for visualization

27 SatScan. Poisson models
28 SatScan. Bernoulli models Bernoulli process is a discrete-time stochastic process based on Bernoulli trials An experiment whose outcome is random and can be either of two possible outcomes, success and failure Values expressed as 0 or 1 (non-cases or cases)
29 SatScan. Bernoulli models
30 SatScan. Bernoulli models Scan similar to Poisson, visiting each event Likelihood function: C = total number of cases in dataset c = observed number of cases in window n = total # of cases and controls in window N = total number of cases and controls in dataset

31 SatScan. Focused tests Focused tests can be conducted by providing the coordinates of one or more point sources. In these instances, the scan will only evaluate clusters around these sources and bypass the rest of the coordinates
32 Summary 1. Statistical methods for spatial epidemiology 2. Cluster Detection What is a cluster? Few issues 3. Spatial and spatio-temporal Scan Statistic Methods Probability based models (Bernoulli & Poisson) Focused tests
33 Case Study 1. Legionella 2. Leukemia 3. TB 4. Hepatitis A Find space and spaciotemporal cluster. Give possible causes
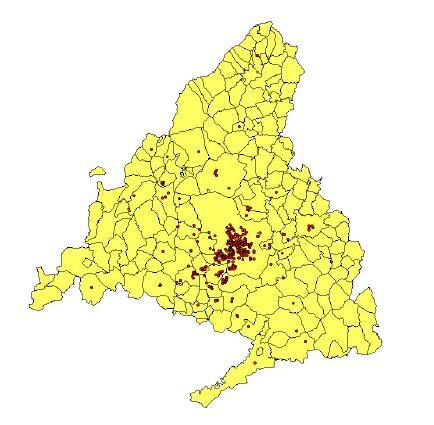
34 Case Study There are four scenarios to be analyzed The cases of disease have been simulated from the population of Madrid (Spain). The four diseases to be studied are legionella, leukemia, tuberculosis and hepatitis A. Each participant is expected to carry out a cluster analysis of just one of these diseases.
35 Case Study For each scenario, there is a folder containing the information required: centroid.txt contains the geographic coordinates population.txt contains the inhabitants of each census tract of Madrid aggregated_1.xls contains cases_1.xls contains Folder Shapes contains the files needed to map the area of study and the results obtained.
Cluster Analysis using SaTScan. Patrick DeLuca, M.A. APHEO 2007 Conference, Ottawa October 16 th, 2007
 Cluster Analysis using SaTScan Patrick DeLuca, M.A. APHEO 2007 Conference, Ottawa October 16 th, 2007 Outline Clusters & Cluster Detection Spatial Scan Statistic Case Study 28 September 2007 APHEO Conference
An Introduction to SaTScan
 An Introduction to SaTScan Software to measure spatial, temporal or space-time clusters using a spatial scan approach Marilyn O Hara University of Illinois moruiz@illinois.edu Lecture for the Pre-conference
Outline. Practical Point Pattern Analysis. David Harvey s Critiques. Peter Gould s Critiques. Global vs. Local. Problems of PPA in Real World
 Outline Practical Point Pattern Analysis Critiques of Spatial Statistical Methods Point pattern analysis versus cluster detection Cluster detection techniques Extensions to point pattern measures Multiple
USING CLUSTERING SOFTWARE FOR EXPLORING SPATIAL AND TEMPORAL PATTERNS IN NON-COMMUNICABLE DISEASES
 USING CLUSTERING SOFTWARE FOR EXPLORING SPATIAL AND TEMPORAL PATTERNS IN NON-COMMUNICABLE DISEASES Mariana Nagy "Aurel Vlaicu" University of Arad Romania Department of Mathematics and Computer Science
A spatial scan statistic for multinomial data
 A spatial scan statistic for multinomial data Inkyung Jung 1,, Martin Kulldorff 2 and Otukei John Richard 3 1 Department of Epidemiology and Biostatistics University of Texas Health Science Center at San
Spatial Analysis and Modeling (GIST 4302/5302) Guofeng Cao Department of Geosciences Texas Tech University
 Guofeng Cao Department of Geosciences Texas Tech University") Spatial Analysis and Modeling (GIST 4302/5302) Guofeng Cao Department of Geosciences Texas Tech University Outline of This Week Last week, we learned: Data representation: Object vs. Fieldbased approaches
Spatial Analysis and Modeling (GIST 4302/5302) Guofeng Cao Department of Geosciences Texas Tech University Outline of This Week Last week, we learned: Data representation: Object vs. Fieldbased approaches
Applications of GIS in Health Research. West Nile virus
 Applications of GIS in Health Research West Nile virus Outline Part 1. Applications of GIS in Health research or spatial epidemiology Disease Mapping Cluster Detection Spatial Exposure Assessment Assessment
Railway suicide clusters: how common are they and what predicts them? Lay San Too Jane Pirkis Allison Milner Lyndal Bugeja Matthew J.
 Railway suicide clusters: how common are they and what predicts them? Lay San Too Jane Pirkis Allison Milner Lyndal Bugeja Matthew J. Spittal Overview Background Aims Significance Methods Results Conclusions
Bayesian Hierarchical Models
 Bayesian Hierarchical Models Gavin Shaddick, Millie Green, Matthew Thomas University of Bath 6 th - 9 th December 2016 1/ 34 APPLICATIONS OF BAYESIAN HIERARCHICAL MODELS 2/ 34 OUTLINE Spatial epidemiology
FleXScan User Guide. for version 3.1. Kunihiko Takahashi Tetsuji Yokoyama Toshiro Tango. National Institute of Public Health
 FleXScan User Guide for version 3.1 Kunihiko Takahashi Tetsuji Yokoyama Toshiro Tango National Institute of Public Health October 2010 http://www.niph.go.jp/soshiki/gijutsu/index_e.html User Guide version
Multivariate Count Time Series Modeling of Surveillance Data
 Multivariate Count Time Series Modeling of Surveillance Data Leonhard Held 1 Michael Höhle 2 1 Epidemiology, Biostatistics and Prevention Institute, University of Zurich, Switzerland 2 Department of Mathematics,
Interactive GIS in Veterinary Epidemiology Technology & Application in a Veterinary Diagnostic Lab
 Interactive GIS in Veterinary Epidemiology Technology & Application in a Veterinary Diagnostic Lab Basics GIS = Geographic Information System A GIS integrates hardware, software and data for capturing,
SaTScan TM. User Guide. for version 7.0. By Martin Kulldorff. August
 SaTScan TM User Guide for version 7.0 By Martin Kulldorff August 2006 http://www.satscan.org/ Contents Introduction... 4 The SaTScan Software... 4 Download and Installation... 5 Test Run... 5 Sample Data
Inclusion of Non-Street Addresses in Cancer Cluster Analysis
 Inclusion of Non-Street Addresses in Cancer Cluster Analysis Sue-Min Lai, Zhimin Shen, Darin Banks Kansas Cancer Registry University of Kansas Medical Center KCR (Kansas Cancer Registry) KCR: population-based
Spatio-temporal modeling of weekly malaria incidence in children under 5 for early epidemic detection in Mozambique
 Spatio-temporal modeling of weekly malaria incidence in children under 5 for early epidemic detection in Mozambique Katie Colborn, PhD Department of Biostatistics and Informatics University of Colorado
Temporal and spatial mapping of hand, foot and mouth disease in Sarawak, Malaysia
 Geospatial Health 8(2), 2014, pp. 503-507 Temporal and spatial mapping of hand, foot and mouth disease in Sarawak, Malaysia Noraishah M. Sham 1, Isthrinayagy Krishnarajah 1,2, Noor Akma Ibrahim 1,2, Munn-Sann
Predicting Long-term Exposures for Health Effect Studies
 Predicting Long-term Exposures for Health Effect Studies Lianne Sheppard Adam A. Szpiro, Johan Lindström, Paul D. Sampson and the MESA Air team University of Washington CMAS Special Session, October 13,
Cluster investigations using Disease mapping methods International workshop on Risk Factors for Childhood Leukemia Berlin May
 Cluster investigations using Disease mapping methods International workshop on Risk Factors for Childhood Leukemia Berlin May 5-7 2008 Peter Schlattmann Institut für Biometrie und Klinische Epidemiologie
Lecture 4. Spatial Statistics
 Lecture 4 Spatial Statistics Lecture 4 Outline Statistics in GIS Spatial Metrics Cell Statistics Neighborhood Functions Neighborhood and Zonal Statistics Mapping Density (Density surfaces) Hot Spot Analysis
OUTBREAK INVESTIGATION AND SPATIAL ANALYSIS OF SURVEILLANCE DATA: CLUSTER DATA ANALYSIS. Preliminary Programme / Draft_2. Serbia, Mai 2013
 OUTBREAK INVESTIGATION AND SPATIAL ANALYSIS OF SURVEILLANCE DATA: CLUSTER DATA ANALYSIS Preliminary Programme / Draft_2 Serbia, 20-24 Mai 2013 1. Course presentation Outbreak investigation is one of the
Spatial Analysis I. Spatial data analysis Spatial analysis and inference
 Spatial Analysis I Spatial data analysis Spatial analysis and inference Roadmap Outline: What is spatial analysis? Spatial Joins Step 1: Analysis of attributes Step 2: Preparing for analyses: working with
Applied Spatial Analysis in Epidemiology
 Applied Spatial Analysis in Epidemiology COURSE DURATION This is an on-line, distance learning course and material will be available from: June 1 30, 2017 INSTRUCTOR Rena Jones, PhD, MS renajones@gmail.com
In matrix algebra notation, a linear model is written as
 DM3 Calculation of health disparity Indices Using Data Mining and the SAS Bridge to ESRI Mussie Tesfamicael, University of Louisville, Louisville, KY Abstract Socioeconomic indices are strongly believed
Spatio-Temporal Cluster Detection of Point Events by Hierarchical Search of Adjacent Area Unit Combinations
 Spatio-Temporal Cluster Detection of Point Events by Hierarchical Search of Adjacent Area Unit Combinations Ryo Inoue 1, Shiho Kasuya and Takuya Watanabe 1 Tohoku University, Sendai, Japan email corresponding
Applied Spatial Analysis in Epidemiology
 Applied Spatial Analysis in Epidemiology COURSE DURATION Course material will be available from: June 1- June 30, 2018 INSTRUCTOR Rena Jones, PhD MS rena.jones@yale.edu COURSE DESCRIPTION This course will
Everything is related to everything else, but near things are more related than distant things.
 SPATIAL ANALYSIS DR. TRIS ERYANDO, MA Everything is related to everything else, but near things are more related than distant things. (attributed to Tobler) WHAT IS SPATIAL DATA? 4 main types event data,
Statistical Analysis of Spatio-temporal Point Process Data. Peter J Diggle
 Statistical Analysis of Spatio-temporal Point Process Data Peter J Diggle Department of Medicine, Lancaster University and Department of Biostatistics, Johns Hopkins University School of Public Health
School on Modelling Tools and Capacity Building in Climate and Public Health April Point Event Analysis
 2453-12 School on Modelling Tools and Capacity Building in Climate and Public Health 15-26 April 2013 Point Event Analysis SA CARVALHO Marilia PROCC FIOCRUZ Avenida Brasil 4365 Rio De Janeiro 21040360
A nonparametric spatial scan statistic for continuous data
 DOI 10.1186/s12942-015-0024-6 METHODOLOGY Open Access A nonparametric spatial scan statistic for continuous data Inkyung Jung * and Ho Jin Cho Abstract Background: Spatial scan statistics are widely used
EpiMAN-TB, a decision support system using spatial information for the management of tuberculosis in cattle and deer in New Zealand
 EpiMAN-TB, a decision support system using spatial information for the management of tuberculosis in cattle and deer in New Zealand J.S. McKenzie 1, R.S. Morris 1, C.J. Tutty 2, D.U. Pfeiffer 1 Dept of
BAYESIAN MODEL FOR SPATIAL DEPENDANCE AND PREDICTION OF TUBERCULOSIS
 BAYESIAN MODEL FOR SPATIAL DEPENDANCE AND PREDICTION OF TUBERCULOSIS Srinivasan R and Venkatesan P Dept. of Statistics, National Institute for Research Tuberculosis, (Indian Council of Medical Research),
Clinical Trials. Olli Saarela. September 18, Dalla Lana School of Public Health University of Toronto.
 Introduction to Dalla Lana School of Public Health University of Toronto olli.saarela@utoronto.ca September 18, 2014 38-1 : a review 38-2 Evidence Ideal: to advance the knowledge-base of clinical medicine,
Detection of Clustering in Spatial Data
 Detection of Clustering in Spatial Data Lance A. Waller Department of Biostatistics Rollins School of Public Health Emory University 1518 Clifton Road NE Atlanta, GA 30322 E-mail: lwaller@sph.emory.edu
Rapid detection of spatiotemporal clusters
 Rapid detection of spatiotemporal clusters Markus Loecher, Berlin School of Economics and Law July 2nd, 2015 Table of contents Motivation Spatial Plots in R RgoogleMaps Spatial cluster detection Spatiotemporal
Spatial and Temporal Geovisualisation and Data Mining of Road Traffic Accidents in Christchurch, New Zealand
 166 Spatial and Temporal Geovisualisation and Data Mining of Road Traffic Accidents in Christchurch, New Zealand Clive E. SABEL and Phil BARTIE Abstract This paper outlines the development of a method
Detecting Emerging Space-Time Crime Patterns by Prospective STSS
 Detecting Emerging Space-Time Crime Patterns by Prospective STSS Tao Cheng Monsuru Adepeju {tao.cheng@ucl.ac.uk; monsuru.adepeju.11@ucl.ac.uk} SpaceTimeLab, Department of Civil, Environmental and Geomatic
THE EFFECT OF GEOGRAPHY ON SEXUALLY TRANSMITTED
 THE EFFECT OF GEOGRAPHY ON SEXUALLY TRANSMITTED INFECTIONS Tommi L. Gaines, Dr.P.H. University of California, San Diego Division of Global Public Health Geospatial Frontiers in Health and Social Environments
SPACE Workshop NSF NCGIA CSISS UCGIS SDSU. Aldstadt, Getis, Jankowski, Rey, Weeks SDSU F. Goodchild, M. Goodchild, Janelle, Rebich UCSB
 SPACE Workshop NSF NCGIA CSISS UCGIS SDSU Aldstadt, Getis, Jankowski, Rey, Weeks SDSU F. Goodchild, M. Goodchild, Janelle, Rebich UCSB August 2-8, 2004 San Diego State University Some Examples of Spatial
Core Courses for Students Who Enrolled Prior to Fall 2018
 Biostatistics and Applied Data Analysis Students must take one of the following two sequences: Sequence 1 Biostatistics and Data Analysis I (PHP 2507) This course, the first in a year long, two-course
Measurement Error in Spatial Modeling of Environmental Exposures
 Measurement Error in Spatial Modeling of Environmental Exposures Chris Paciorek, Alexandros Gryparis, and Brent Coull August 9, 2005 Department of Biostatistics Harvard School of Public Health www.biostat.harvard.edu/~paciorek
Spatial Variation in Hospitalizations for Cardiometabolic Ambulatory Care Sensitive Conditions Across Canada
 Spatial Variation in Hospitalizations for Cardiometabolic Ambulatory Care Sensitive Conditions Across Canada CRDCN Conference November 14, 2017 Martin Cooke Alana Maltby Sarah Singh Piotr Wilk Today s
Jun Tu. Department of Geography and Anthropology Kennesaw State University
 Examining Spatially Varying Relationships between Preterm Births and Ambient Air Pollution in Georgia using Geographically Weighted Logistic Regression Jun Tu Department of Geography and Anthropology Kennesaw
Using AMOEBA to Create a Spatial Weights Matrix and Identify Spatial Clusters, and a Comparison to Other Clustering Algorithms
 Using AMOEBA to Create a Spatial Weights Matrix and Identify Spatial Clusters, and a Comparison to Other Clustering Algorithms Arthur Getis* and Jared Aldstadt** *San Diego State University **SDSU/UCSB
Lecture 4: Generalized Linear Mixed Models
 Dankmar Böhning Southampton Statistical Sciences Research Institute University of Southampton, UK S 3 RI, 11-12 December 2014 An example with one random effect An example with two nested random effects
Extended Follow-Up and Spatial Analysis of the American Cancer Society Study Linking Particulate Air Pollution and Mortality
 Extended Follow-Up and Spatial Analysis of the American Cancer Society Study Linking Particulate Air Pollution and Mortality Daniel Krewski, Michael Jerrett, Richard T Burnett, Renjun Ma, Edward Hughes,
Shape and scale in detecting disease clusters
 University of Iowa Iowa Research Online Theses and Dissertations 2008 Shape and scale in detecting disease clusters Soumya Mazumdar University of Iowa Copyright 2008 Soumya Mazumdar This dissertation is
Agro Ecological Malaria Linkages in Uganda, A Spatial Probit Model:
 Agro Ecological Malaria Linkages in Uganda, A Spatial Probit Model: IFPRI Project Title: Environmental management options and delivery mechanisms to reduce malaria transmission in Uganda Spatial Probit
Geographical Information System (GIS)-based maps for monitoring of entomological risk factors affecting transmission of chikungunya in Sri Lanka
-based maps for monitoring of entomological risk factors affecting transmission of chikungunya in Sri Lanka") Geographical Information System (GIS)-based maps for monitoring of entomological risk factors affecting transmission of chikungunya in Sri Lanka M.D. Hapugoda 1, N.K. Gunewardena 1, P.H.D. Kusumawathie
Geographical Information System (GIS)-based maps for monitoring of entomological risk factors affecting transmission of chikungunya in Sri Lanka M.D. Hapugoda 1, N.K. Gunewardena 1, P.H.D. Kusumawathie
ARIC Manuscript Proposal # PC Reviewed: _9/_25_/06 Status: A Priority: _2 SC Reviewed: _9/_25_/06 Status: A Priority: _2
 ARIC Manuscript Proposal # 1186 PC Reviewed: _9/_25_/06 Status: A Priority: _2 SC Reviewed: _9/_25_/06 Status: A Priority: _2 1.a. Full Title: Comparing Methods of Incorporating Spatial Correlation in
Analyzing the Geospatial Rates of the Primary Care Physician Labor Supply in the Contiguous United States
 Analyzing the Geospatial Rates of the Primary Care Physician Labor Supply in the Contiguous United States By Russ Frith Advisor: Dr. Raid Amin University of W. Florida Capstone Project in Statistics April,
Long Island Breast Cancer Study and the GIS-H (Health)
") Long Island Breast Cancer Study and the GIS-H (Health) Edward J. Trapido, Sc.D. Associate Director Epidemiology and Genetics Research Program, DCCPS/NCI COMPREHENSIVE APPROACHES TO CANCER CONTROL September,
Long Island Breast Cancer Study and the GIS-H (Health) Edward J. Trapido, Sc.D. Associate Director Epidemiology and Genetics Research Program, DCCPS/NCI COMPREHENSIVE APPROACHES TO CANCER CONTROL September,
WHO lunchtime seminar Mapping child growth failure in Africa between 2000 and Professor Simon I. Hay March 12, 2018
 WHO lunchtime seminar Mapping child growth failure in Africa between 2000 and 2015 Professor Simon I. Hay March 12, 2018 Outline Local Burden of Disease (LBD) at IHME Child growth failure From global to
A SPACE-TIME SCAN STATISTIC FOR DETECTION OF TB OUTBREAKS IN THE SAN FRANCISCO HOMELESS POPULATION
 A SPACE-TIME SCAN STATISTIC FOR DETECTION OF TB OUTBREAKS IN THE SAN FRANCISCO HOMELESS POPULATION BRANDON W. HIGGS MITRE Corporation, 7515 Colshire Dr. McLean, VA, 22102 USA MOJDEH MOHTASHEMI MITRE Corporation,
ACCELERATING THE DETECTION VECTOR BORNE DISEASES
 NC State s Geospatial Analytics Forum October 22 2015 ACCELERATING THE DETECTION of SPACE-TIME CLUSTERS for VECTOR BORNE DISEASES Dr. Eric Delmelle Geography & Earth Sciences, University of North Carolina
Dengue Forecasting Project
 Dengue Forecasting Project In areas where dengue is endemic, incidence follows seasonal transmission patterns punctuated every few years by much larger epidemics. Because these epidemics are currently
Spatial Pattern Analysis: Mapping Trends and Clusters. Lauren M. Scott, PhD Lauren Rosenshein Bennett, MS
 Spatial Pattern Analysis: Mapping Trends and Clusters Lauren M. Scott, PhD Lauren Rosenshein Bennett, MS Presentation Outline Spatial statistics overview Describing spatial patterns Quantifying spatial
Geographical Visualization Approach to Perceive Spatial Scan Statistics: An Analysis of Dengue Fever Outbreaks in Delhi
 Geographical Visualization Approach to Perceive Spatial Scan Statistics: An Analysis of Dengue Fever Outbreaks in Delhi Student Name: Shuchi Mala IIIT-D-MTech-CS-DE-11-032 June 18, 2013 Indraprastha Institute
Detection of Clustering in Spatial Data
 Detection of Clustering in Spatial Data Lance A. Waller Department of Biostatistics Rollins School of Public Health Emory University 1518 Clifton Road NE Atlanta, GA 30322 E-mail: lwaller@sph.emory.edu
ESRI 2008 Health GIS Conference
 ESRI 2008 Health GIS Conference An Exploration of Geographically Weighted Regression on Spatial Non- Stationarity and Principal Component Extraction of Determinative Information from Robust Datasets A
Lecture 5: Sampling Methods
 Lecture 5: Sampling Methods What is sampling? Is the process of selecting part of a larger group of participants with the intent of generalizing the results from the smaller group, called the sample, to
Combining Incompatible Spatial Data
 Combining Incompatible Spatial Data Carol A. Gotway Crawford Office of Workforce and Career Development Centers for Disease Control and Prevention Invited for Quantitative Methods in Defense and National
BIOL 51A - Biostatistics 1 1. Lecture 1: Intro to Biostatistics. Smoking: hazardous? FEV (l) Smoke
 Smoke") BIOL 51A - Biostatistics 1 1 Lecture 1: Intro to Biostatistics Smoking: hazardous? FEV (l) 1 2 3 4 5 No Yes Smoke BIOL 51A - Biostatistics 1 2 Box Plot a.k.a box-and-whisker diagram or candlestick chart
BIOL 51A - Biostatistics 1 1 Lecture 1: Intro to Biostatistics Smoking: hazardous? FEV (l) 1 2 3 4 5 No Yes Smoke BIOL 51A - Biostatistics 1 2 Box Plot a.k.a box-and-whisker diagram or candlestick chart
Outline. 15. Descriptive Summary, Design, and Inference. Descriptive summaries. Data mining. The centroid
 Outline 15. Descriptive Summary, Design, and Inference Geographic Information Systems and Science SECOND EDITION Paul A. Longley, Michael F. Goodchild, David J. Maguire, David W. Rhind 2005 John Wiley
Pumps, Maps and Pea Soup: Spatio-temporal methods in environmental epidemiology
 Pumps, Maps and Pea Soup: Spatio-temporal methods in environmental epidemiology Gavin Shaddick Department of Mathematical Sciences University of Bath 2012-13 van Eeden lecture Thanks Constance van Eeden
Land Use/Cover Changes & Modeling Urban Expansion of Nairobi City
 Land Use/Cover Changes & Modeling Urban Expansion of Nairobi City Overview Introduction Objectives Land use/cover changes Modeling with Cellular Automata Conclusions Introduction Urban land use/cover types
Lecture 01: Introduction
 Lecture 01: Introduction Dipankar Bandyopadhyay, Ph.D. BMTRY 711: Analysis of Categorical Data Spring 2011 Division of Biostatistics and Epidemiology Medical University of South Carolina Lecture 01: Introduction
Modelling spatio-temporal patterns of disease
 Modelling spatio-temporal patterns of disease Peter J Diggle CHICAS combining health information, computation and statistics References AEGISS Brix, A. and Diggle, P.J. (2001). Spatio-temporal prediction
An Introduction to Pattern Statistics
 An Introduction to Pattern Statistics Nearest Neighbors The CSR hypothesis Clark/Evans and modification Cuzick and Edwards and controls All events k function Weighted k function Comparative k functions
College Of Science Engineering Health: GIS at UWF
 College Of Science Engineering Health: GIS at UWF GIS here on campus GeoData Center, Nathan McKinney + student lab assistants GIS Certificate, Dr. Zhiyong Hu, GA s helping with courses GIS Online Director,
DISCRETE PROBABILITY DISTRIBUTIONS
 DISCRETE PROBABILITY DISTRIBUTIONS REVIEW OF KEY CONCEPTS SECTION 41 Random Variable A random variable X is a numerically valued quantity that takes on specific values with different probabilities The
Michael Harrigan Office hours: Fridays 2:00-4:00pm Holden Hall
 Announcement New Teaching Assistant Michael Harrigan Office hours: Fridays 2:00-4:00pm Holden Hall 209 Email: michael.harrigan@ttu.edu Guofeng Cao, Texas Tech GIST4302/5302, Lecture 2: Review of Map Projection
MATH/STAT 395. Introduction to Probability Models. Jan 7, 2013
 MATH/STAT 395 Introduction to Probability Models Jan 7, 2013 1.0 Random Variables Definition: A random variable X is a measurable function from the sample space Ω to the real line R. X : Ω R Ω is the set
INTRODUCTION. In March 1998, the tender for project CT.98.EP.04 was awarded to the Department of Medicines Management, Keele University, UK.
 INTRODUCTION In many areas of Europe patterns of drug use are changing. The mechanisms of diffusion are diverse: introduction of new practices by new users, tourism and migration, cross-border contact,
GIS in Locating and Explaining Conflict Hotspots in Nepal
 GIS in Locating and Explaining Conflict Hotspots in Nepal Lila Kumar Khatiwada Notre Dame Initiative for Global Development 1 Outline Brief background Use of GIS in conflict study Data source Findings
Mapping Malaria Risk in Dakar, Senegal. Marion Borderon, Sébastien Oliveau
 Mapping Malaria Risk in Dakar, Senegal Marion Borderon, Sébastien Oliveau When entomology meets social sciences Framework of the research - ANR ACTU PALU - interdisciplinary project Data & method Social
Random Variable. Discrete Random Variable. Continuous Random Variable. Discrete Random Variable. Discrete Probability Distribution
 Random Variable Theoretical Probability Distribution Random Variable Discrete Probability Distributions A variable that assumes a numerical description for the outcome of a random eperiment (by chance).
Assessing the Regional Vulnerability of Large Scale Mining in Ghana: An Application of Multi Criteria Analysis
 Assessing the Regional Vulnerability of Large Scale Mining in Ghana: An Application of Multi Criteria Analysis Mukesh Subedee, GISDE 14 Arun Poojary, ES&P 13 Clark University April 29, 2013 Ghana: A case
This report details analyses and methodologies used to examine and visualize the spatial and nonspatial
 Analysis Summary: Acute Myocardial Infarction and Social Determinants of Health Acute Myocardial Infarction Study Summary March 2014 Project Summary :: Purpose This report details analyses and methodologies
PubH 7470: STATISTICS FOR TRANSLATIONAL & CLINICAL RESEARCH
 PubH 7470: STATISTICS FOR TRANSLATIONAL & CLINICAL RESEARCH The First Step: SAMPLE SIZE DETERMINATION THE ULTIMATE GOAL The most important, ultimate step of any of clinical research is to do draw inferences;
Roger S. Bivand Edzer J. Pebesma Virgilio Gömez-Rubio. Applied Spatial Data Analysis with R. 4:1 Springer
 Roger S. Bivand Edzer J. Pebesma Virgilio Gömez-Rubio Applied Spatial Data Analysis with R 4:1 Springer Contents Preface VII 1 Hello World: Introducing Spatial Data 1 1.1 Applied Spatial Data Analysis
M statistic commands: interpoint distance distribution analysis with Stata
 M statistic commands: interpoint distance distribution analysis with Stata Motivation: spatial distribution (1) In many situations we are interested in answering the following QUESTION: Is a certain phenomenon
Linkage Methods for Environment and Health Analysis General Guidelines
 Health and Environment Analysis for Decision-making Linkage Analysis and Monitoring Project WORLD HEALTH ORGANIZATION PUBLICATIONS Linkage Methods for Environment and Health Analysis General Guidelines
Temporal and Spatial Autocorrelation Statistics of Dengue Fever
 Temporal and Spatial Autocorrelation Statistics of Dengue Fever Kanchana Nakhapakorn a and Supet Jirakajohnkool b a Faculty of Environment and Resource Studies, Mahidol University, Salaya, Nakhonpathom
Local Likelihood Bayesian Cluster Modeling for small area health data. Andrew Lawson Arnold School of Public Health University of South Carolina
 Local Likelihood Bayesian Cluster Modeling for small area health data Andrew Lawson Arnold School of Public Health University of South Carolina Local Likelihood Bayesian Cluster Modelling for Small Area
Success scans in a sequence of trials
 Success scans in a sequence of trials Example 4.6: application in acceptance sampling. The most classical acceptance sampling is as follows. A supplier passes along a lot of products with a p probability
Fundamentals to Biostatistics. Prof. Chandan Chakraborty Associate Professor School of Medical Science & Technology IIT Kharagpur
 Fundamentals to Biostatistics Prof. Chandan Chakraborty Associate Professor School of Medical Science & Technology IIT Kharagpur Statistics collection, analysis, interpretation of data development of new
Spatial Pattern Analysis: Mapping Trends and Clusters
 2013 Esri International User Conference July 8 12, 2013 San Diego, California Technical Workshop Spatial Pattern Analysis: Mapping Trends and Clusters Lauren Rosenshein Bennett Brett Rose Presentation
Chapter 6 Spatial Analysis
 6.1 Introduction Chapter 6 Spatial Analysis Spatial analysis, in a narrow sense, is a set of mathematical (and usually statistical) tools used to find order and patterns in spatial phenomena. Spatial patterns
GIST 4302/5302: Spatial Analysis and Modeling
 GIST 4302/5302: Spatial Analysis and Modeling Basics of Statistics Guofeng Cao www.myweb.ttu.edu/gucao Department of Geosciences Texas Tech University guofeng.cao@ttu.edu Spring 2015 Outline of This Week
Applying Health Outcome Data to Improve Health Equity
 Applying Health Outcome Data to Improve Health Equity Devon Williford, MPH, Health GIS Specialist Lorraine Dixon-Jones, Policy Analyst CDPHE Health Equity and Environmental Justice Collaborative Mile High
GIST 4302/5302: Spatial Analysis and Modeling
 GIST 4302/5302: Spatial Analysis and Modeling Lecture 2: Review of Map Projections and Intro to Spatial Analysis Guofeng Cao http://thestarlab.github.io Department of Geosciences Texas Tech University
Temporal vs. Spatial Data
 Temporal vs. Spatial Data Temporal 1 dimensional Units: day, week, month Lag: t, t-1, t-2 Durbin-Watson Spatial 2-3 dimensional Units: county, mile, region Lag: near neighbor, networks (?) Moran s I Differencing
A Comparison of Three Exploratory Methods for Cluster Detection in Spatial Point Patterns
 A. Stewart Fotheringham and F. Benjamin Zhan A Comparison of Three Exploratory Methods for Cluster Detection in Spatial Point Patterns This paper compares the performances of three explorato y methods
Class Notes: Week 8. Probit versus Logit Link Functions and Count Data
 Ronald Heck Class Notes: Week 8 1 Class Notes: Week 8 Probit versus Logit Link Functions and Count Data This week we ll take up a couple of issues. The first is working with a probit link function. While
Using Geographic Information Systems for Exposure Assessment
 Using Geographic Information Systems for Exposure Assessment Ravi K. Sharma, PhD Department of Behavioral & Community Health Sciences, Graduate School of Public Health, University of Pittsburgh, Pittsburgh,
Lecture 14: Introduction to Poisson Regression
 Lecture 14: Introduction to Poisson Regression Ani Manichaikul amanicha@jhsph.edu 8 May 2007 1 / 52 Overview Modelling counts Contingency tables Poisson regression models 2 / 52 Modelling counts I Why
Modelling counts. Lecture 14: Introduction to Poisson Regression. Overview
 Modelling counts I Lecture 14: Introduction to Poisson Regression Ani Manichaikul amanicha@jhsph.edu Why count data? Number of traffic accidents per day Mortality counts in a given neighborhood, per week
15: Regression. Introduction
 15: Regression Introduction Regression Model Inference About the Slope Introduction As with correlation, regression is used to analyze the relation between two continuous (scale) variables. However, regression
Medical GIS: New Uses of Mapping Technology in Public Health. Peter Hayward, PhD Department of Geography SUNY College at Oneonta
 Medical GIS: New Uses of Mapping Technology in Public Health Peter Hayward, PhD Department of Geography SUNY College at Oneonta Invited research seminar presentation at Bassett Healthcare. Cooperstown,
Approach to identifying hot spots for NCDs in South Africa
 Approach to identifying hot spots for NCDs in South Africa HST Conference 6 May 2016 Noluthando Ndlovu, 1 Candy Day, 1 Benn Sartorius, 2 Karen Hofman, 3 Jens Aagaard-Hansen 3,4 1 Health Systems Trust,