Global Spatial Autocorrelation Clustering
|
|
|
- Amberly Montgomery
- 5 years ago
- Views:
Transcription

1 Global Spatial Autocorrelation Clustering Luc Anselin
2 join count statistics Moran s I Moran scatter plot non-parametric spatial autocorrelation
3 Join Count Statistics
4 Recap - Spatial Autocorrelation Statistic combination of attribute similarity and locational similarity f(x i, xj) and wij general form ΣiΣj f(xi,xj)wij
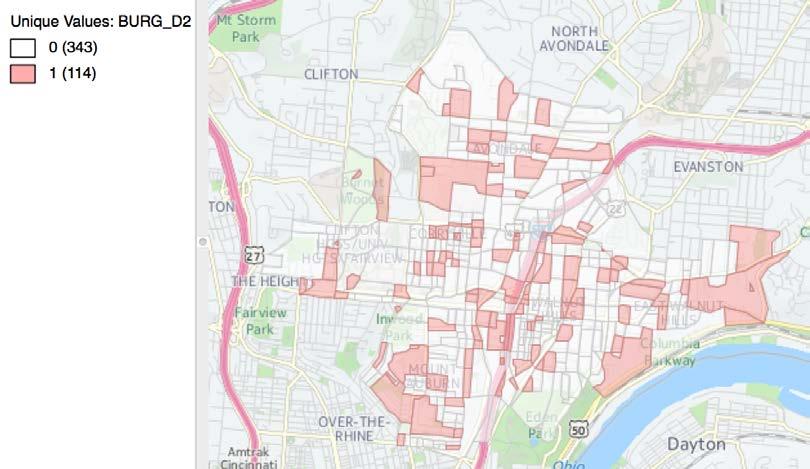
5 Spatial Autocorrelation for Binary Data only two values observed, e.g., presence and absence x i = 1, or B(lack) xi = 0, or W(hite) coding of 1 or 0 is arbitrary, typically choose 1 for the smaller category unlike event analysis (point patterns) all locations are observed with either 1 or 0 values
 Walnut Hills, Cincinnati,")
6 neighborhoods with burglaries (=1) Walnut Hills, Cincinnati, OH
7 Match Value-Location count the number of times similar values occur for neighbors = joins if x i = 1 and xj = 1 for i-j neighbors, count as a BB join if xi = 0 and xj = 0 for i-j neighbors, count as a WW join
8 Positive Spatial Autocorrelation similarity of neighbors BB = x ixj = 1 for a join, 0 otherwise WW = (1 - x i)(1 - xj) = 1 for a join, 0 otherwise
9 Negative Spatial Autocorrelation dissimilarity of neighbors BW = or (x i - xj) 2 = 1 for dissimilar neighbors 0 otherwise
10 Join Count Statistics binary spatial weights, w ij = 1 or 0 BB: (1/2) ΣiΣj wij.xi.xj WW: (1/2) ΣiΣj wij.(1-xi).(1-xj) BW: (1/2) ΣiΣj wij.(xi - xj) 2 BB + WW + BW = (1/2) S0 = (1/2) ΣiΣj wij

11 null hypothesis: spatial randomness
12 Actual Random 1 Random 2 BB WW BW Sum join count statistics - queen contiguity n = 457, S0 = 2968
13 Analytical Inference based on sampling theory binomial distribution, using sampling with replacement or without replacement moments (mean, variance, higher) can be computed uses a (poor) normal approximation Walnut Hills burglary BB = 130 E[BB] = 91.7, Var[BB] = 77.9 z-value = 4.34 p-value <
14 Permutation Inference recompute statistic (BB) builds a reference distribution reshuffle 0-1 values over locations compare observed statistic to reference distribution pseudo p-value = (M + 1)/(R + 1) M = values equal to or greater than statistic R = number of replications (e.g., 999)
15 reference distribution, BB = 130
16 reference distribution for spatially random values BB = 95
17 Moran s I 6
18 Moran s I the most commonly used of many spatial autocorrelation statistics I = [ Σi Σj wij zi.zj/s0 ]/[Σi zi 2 / N] with z i = yi - mx : deviations from mean cross product statistic (z i.zj) similar to a correlation coefficient value depends on weights (w ij)
19 Moran s I examined more closely scaling factors in numerator and denominator in numerator: S0 = Σi Σj wij the number of non-zero elements in the weights matrix, or the number of neighbor pairs (x2) in denominator: N the total number of observations
20 Inference how to assess whether computed value of Moran s I is significantly different from a value for a spatially random distribution compute analytically (assume normal distribution, etc.) computationally, compare value to a reference distribution obtained from a series of randomly permuted patterns
21 Approximate Inference assumes either normal distribution or randomization (each value equally likely to occur at any location) analytical derivation of moments (mean, variance) of the statistic under the null hypothesis (spatial randomness) z = (I - E[I]) / SD[I] approximate the resulting z-value by a standard normal distribution
22 Cleveland 2015 q4 house sales prices (in $1,000)
23 Normal Randomization MI E[MI] Var[MI] z-value p-value << << normal vs randomization inference for Moran s I queen weights
24 Queen K6 Distance MI E[MI] Var[MI] z-value p-value << << << Moran s I inference under randomization, different spatial weights
25 Permutation Approach as such, even a high Moran s I does not indicate significance need to construct a reference distribution randomly reshuffle observations and recompute Moran s I each time compare observed value to reference distribution
26 Standardized z-value standardize by subtracting mean and dividing by standard deviation, computed from the reference distribution z = [Observed I - Mean(I)] / Standard Deviation(I) z-values are comparable across variables and across spatial weights
27 999 permutations and reference distribution (queen weights) MI = Mean = s.d. = z-value = 7.15
28 Interpretation of Moran s I
29 Sign of Moran s I theoretical mean is - 1/(N - 1), essentially zero for large N positive and significant = clustering of like value NOT clustering of high or low could be either or a combination negative and significant = alternating values presence of spatial outliers spatial heterogeneity (checkerboard pattern)
30 Significance of Moran s I compute pseudo p-value compare standard z-value to standard normal (approximate only) only if Moran s I is significant is sign of coefficient meaningful
31 Comparing Moran s I Moran s I depends on spatial weights relative magnitude for same weights and different variables is meaningful but NOT for different spatial weights instead, use standardized z-value to compare
32 Queen K6 Distance MI E[MI] Var[MI] z-value p-value << << << Moran s I, different spatial weights MI is largest for K6, but z is largest for Distance
33 Clustering vs Clusters Moran s I is a global statistic, i.e., a single value for the whole spatial pattern Moran s I does NOT provide the location of clusters cluster detection requires a local statistic
34 True vs Apparent Contagion the indication of clustering does not provide an explanation for why the clustering occurs different processes can result in the same pattern true contagion: evidence of clustering due to spatial interaction (peer effects, mimicking, etc.) apparent contagion: evidence of clustering due to spatial heterogeneity (different spatial structures create local similarity)
35 Geary s c
36 Focus on Dissimilarity squared difference as measure of dissimilarity similar to notion of variogram (geostatistics) values between 0 and 2
37 Geary s c Statistic c = (N-1) Σi Σj wij (xi - xj) 2 / 2S0 Σ zi 2 alternatively c = [ Σi Σj wij (xi - xj) 2 / 2S0 ] / [ Σ zi 2 / (N-1) ] with z i in deviations from the mean S0 = Σi Σj wij sum of all the weights
38 Interpretation positive spatial autocorrelation c < 1 or z < 0 negative spatial autocorrelation c > 1 or z > 0 opposite sign of Moran s I
39 Inference same approach as for Moran s I analytical approximate (normal, randomization) permutation
40 Queen K6 Distance c E[c] Var[c] z-value p-value < << << geary s c inference under randomization, different spatial weights
41 999 permutations and reference distribution (queen weights) c = Mean = s.d. = z-value = -4.58
42 Moran Scatter Plot 6
43 Recap: Moran s I I = [ Σi Σj wij zi.zj/s0 ]/[Σi zi 2 / N] with z i = yi - mx : deviations from mean for row-standardized weights S0 = N I = Σi Σj wij zi.zj / Σi zi 2 = Σi zi (Σj wij.zj) / Σi zi 2 Moran s I is slope in a regression of Σj wij.zj on zi
44 Moran Scatter Plot scatter plot of [ zi, Σj wij.zj ] the value at i on the x-axis, its spatial lag (weighted average of neighboring values) on the y-axis slope of linear fit is Moran s I use local regression (Lowess) to identify possible structural breaks
45 outliers Moran scatter plot - Cleveland house prices - queen weights
")
46 outliers (in red)
47 Moran scatter plot without outliers
48 Categories of Local Spatial Autocorrelation four quadrants of the scatter plot upper right and lower left positive spatial autocorrelation clusters of like values locations are similar to their neighbors lower right and upper left negative spatial autocorrelation spatial outliers locations are different from their neighbors
49 Positive Spatial Autocorrelation all comparisons relative to the mean not absolute high or low high-high low-low
50 Negative Spatial Autocorrelation spatial outliers high-low low-high
51 Moran scatter plot with Lowess smoother
52 Nonparametric Spatial Covariance Function 6
53 Alternative Perspective - Nonparametric non-parametric approach no model for covariance let the data suggest the functional form based on sample autocorrelation covariance function must be positive definite
54 Sample Autocorrelation computed for each pair i, j ρij = ρ(zi,zj) = zi*zj* / (1/n) Σh (zh - zm) 2 z i* = zi - zm deviations from mean in practice, easier to use standardized zi incidental parameter problem one parameter for each pair i-j n(n-1)/2 individual values of ρij
55 Non-Parametric Principle spatial autocorrelation as an unspecified function of distance ρij = g(dij) how to fit the function? use kernel estimator
56 Kernel Estimator Hall-Patil (1994) ρ(d) = Σi Σj K(dij/h)(zi.zj) / Σi Σj K(dij/h) K is the kernel function (many choices) h is the bandwidth results depends critically on h, less so on K
57 Kernel Regression z izj = g(dij) local regression depends on choice of kernel function and bandwidth values of the estimated g(dij) do not necessarily result in a valid (positive semi-definite) variancecovariance matrix

58 correlogram - full distance range

59 correlogram - 20,000 ft max distance
60 Interpretation range of spatial autocorrelation alternative to specifying spatial weights sensitive to kernel fit may violate Tobler s law
Local Spatial Autocorrelation Clusters
 Local Spatial Autocorrelation Clusters Luc Anselin http://spatial.uchicago.edu LISA principle local Moran local G statistics issues and interpretation LISA Principle Clustering vs Clusters global spatial
Spatial Regression. 1. Introduction and Review. Luc Anselin. Copyright 2017 by Luc Anselin, All Rights Reserved
 Spatial Regression 1. Introduction and Review Luc Anselin http://spatial.uchicago.edu matrix algebra basics spatial econometrics - definitions pitfalls of spatial analysis spatial autocorrelation spatial
Spatial Autocorrelation
 Spatial Autocorrelation Luc Anselin http://spatial.uchicago.edu spatial randomness positive and negative spatial autocorrelation spatial autocorrelation statistics spatial weights Spatial Randomness The
Spatial Regression. 6. Specification Spatial Heterogeneity. Luc Anselin.
 Spatial Regression 6. Specification Spatial Heterogeneity Luc Anselin http://spatial.uchicago.edu 1 homogeneity and heterogeneity spatial regimes spatially varying coefficients spatial random effects 2
Construction Engineering. Research Laboratory. Approaches Towards the Identification of Patterns in Violent Events, Baghdad, Iraq ERDC/CERL CR-09-1
 ERDC/CERL CR-09-1 Approaches Towards the Identification of Patterns in Violent Events, Baghdad, Iraq Luc Anselin and Gianfranco Piras May 2009 Construction Engineering Research Laboratory Approved for
Outline ESDA. Exploratory Spatial Data Analysis ESDA. Luc Anselin
 Exploratory Spatial Data Analysis ESDA Luc Anselin University of Illinois, Urbana-Champaign http://www.spacestat.com Outline ESDA Exploring Spatial Patterns Global Spatial Autocorrelation Local Spatial
Basics of Geographic Analysis in R
 Basics of Geographic Analysis in R Spatial Autocorrelation and Spatial Weights Yuri M. Zhukov GOV 2525: Political Geography February 25, 2013 Outline 1. Introduction 2. Spatial Data and Basic Visualization
Lecture 3: Exploratory Spatial Data Analysis (ESDA) Prof. Eduardo A. Haddad
 Prof. Eduardo A. Haddad") Lecture 3: Exploratory Spatial Data Analysis (ESDA) Prof. Eduardo A. Haddad Key message Spatial dependence First Law of Geography (Waldo Tobler): Everything is related to everything else, but near things
Lecture 3: Exploratory Spatial Data Analysis (ESDA) Prof. Eduardo A. Haddad Key message Spatial dependence First Law of Geography (Waldo Tobler): Everything is related to everything else, but near things
Measures of Spatial Dependence
 Measures of Spatial Dependence Carlos Hurtado Department of Economics University of Illinois at Urbana-Champaign hrtdmrt2@illinois.edu Junel 30th, 2016 C. Hurtado (UIUC - Economics) Spatial Econometrics
Lab #3 Background Material Quantifying Point and Gradient Patterns
 Lab #3 Background Material Quantifying Point and Gradient Patterns Dispersion metrics Dispersion indices that measure the degree of non-randomness Plot-based metrics Distance-based metrics First-order
The Study on Trinary Join-Counts for Spatial Autocorrelation
 Proceedings of the 8th International Symposium on Spatial Accuracy Assessment in Natural Resources and Environmental Sciences Shanghai, P. R. China, June 5-7, 008, pp. -8 The Study on Trinary Join-Counts
KAAF- GE_Notes GIS APPLICATIONS LECTURE 3
 GIS APPLICATIONS LECTURE 3 SPATIAL AUTOCORRELATION. First law of geography: everything is related to everything else, but near things are more related than distant things Waldo Tobler Check who is sitting
Spatial Clusters of Rates
 Spatial Clusters of Rates Luc Anselin http://spatial.uchicago.edu concepts EBI local Moran scan statistics Concepts Rates as Risk from counts (spatially extensive) to rates (spatially intensive) rate =
Areal data. Infant mortality, Auckland NZ districts. Number of plant species in 20cm x 20 cm patches of alpine tundra. Wheat yield
 Areal data Reminder about types of data Geostatistical data: Z(s) exists everyhere, varies continuously Can accommodate sudden changes by a model for the mean E.g., soil ph, two soil types with different
SASI Spatial Analysis SSC Meeting Aug 2010 Habitat Document 5
 OBJECTIVES The objectives of the SASI Spatial Analysis were to (1) explore the spatial structure of the asymptotic area swept (z ), (2) define clusters of high and low z for each gear type, (3) determine
Spatial Regression. 9. Specification Tests (1) Luc Anselin. Copyright 2017 by Luc Anselin, All Rights Reserved
 Luc Anselin. Copyright 2017 by Luc Anselin, All Rights Reserved") Spatial Regression 9. Specification Tests (1) Luc Anselin http://spatial.uchicago.edu 1 basic concepts types of tests Moran s I classic ML-based tests LM tests 2 Basic Concepts 3 The Logic of Specification
Spatial Regression 9. Specification Tests (1) Luc Anselin http://spatial.uchicago.edu 1 basic concepts types of tests Moran s I classic ML-based tests LM tests 2 Basic Concepts 3 The Logic of Specification
Luc Anselin Spatial Analysis Laboratory Dept. Agricultural and Consumer Economics University of Illinois, Urbana-Champaign
 GIS and Spatial Analysis Luc Anselin Spatial Analysis Laboratory Dept. Agricultural and Consumer Economics University of Illinois, Urbana-Champaign http://sal.agecon.uiuc.edu Outline GIS and Spatial Analysis
Mapping and Analysis for Spatial Social Science
 Mapping and Analysis for Spatial Social Science Luc Anselin Spatial Analysis Laboratory Dept. Agricultural and Consumer Economics University of Illinois, Urbana-Champaign http://sal.agecon.uiuc.edu Outline
Spatial Analysis 2. Spatial Autocorrelation
 Spatial Analysis 2 Spatial Autocorrelation Spatial Autocorrelation a relationship between nearby spatial units of the same variable If, for every pair of subareas i and j in the study region, the drawings
2/7/2018. Module 4. Spatial Statistics. Point Patterns: Nearest Neighbor. Spatial Statistics. Point Patterns: Nearest Neighbor
 Spatial Statistics Module 4 Geographers are very interested in studying, understanding, and quantifying the patterns we can see on maps Q: What kinds of map patterns can you think of? There are so many
Nature of Spatial Data. Outline. Spatial Is Special
 Nature of Spatial Data Outline Spatial is special Bad news: the pitfalls of spatial data Good news: the potentials of spatial data Spatial Is Special Are spatial data special? Why spatial data require
OPEN GEODA WORKSHOP / CRASH COURSE FACILITATED BY M. KOLAK
 OPEN GEODA WORKSHOP / CRASH COURSE FACILITATED BY M. KOLAK WHAT IS GEODA? Software program that serves as an introduction to spatial data analysis Free Open Source Source code is available under GNU license
A Local Indicator of Multivariate Spatial Association: Extending Geary s c.
 A Local Indicator of Multivariate Spatial Association: Extending Geary s c. Luc Anselin Center for Spatial Data Science University of Chicago anselin@uchicago.edu November 9, 2017 This research was funded
Hypothesis Testing hypothesis testing approach
 Hypothesis Testing In this case, we d be trying to form an inference about that neighborhood: Do people there shop more often those people who are members of the larger population To ascertain this, we
Spatial Data Mining. Regression and Classification Techniques
 Spatial Data Mining Regression and Classification Techniques 1 Spatial Regression and Classisfication Discrete class labels (left) vs. continues quantities (right) measured at locations (2D for geographic
Introduction to Spatial Statistics and Modeling for Regional Analysis
 Introduction to Spatial Statistics and Modeling for Regional Analysis Dr. Xinyue Ye, Assistant Professor Center for Regional Development (Department of Commerce EDA University Center) & School of Earth,
Points. Luc Anselin. Copyright 2017 by Luc Anselin, All Rights Reserved
 Points Luc Anselin http://spatial.uchicago.edu 1 classic point pattern analysis spatial randomness intensity distance-based statistics points on networks 2 Classic Point Pattern Analysis 3 Classic Examples
Spatial Analysis I. Spatial data analysis Spatial analysis and inference
 Spatial Analysis I Spatial data analysis Spatial analysis and inference Roadmap Outline: What is spatial analysis? Spatial Joins Step 1: Analysis of attributes Step 2: Preparing for analyses: working with
Temporal vs. Spatial Data
 Temporal vs. Spatial Data Temporal 1 dimensional Units: day, week, month Lag: t, t-1, t-2 Durbin-Watson Spatial 2-3 dimensional Units: county, mile, region Lag: near neighbor, networks (?) Moran s I Differencing
Spatial autocorrelation: robustness of measures and tests
 Spatial autocorrelation: robustness of measures and tests Marie Ernst and Gentiane Haesbroeck University of Liege London, December 14, 2015 Spatial Data Spatial data : geographical positions non spatial
Finding Hot Spots in ArcGIS Online: Minimizing the Subjectivity of Visual Analysis. Nicholas M. Giner Esri Parrish S.
 Finding Hot Spots in ArcGIS Online: Minimizing the Subjectivity of Visual Analysis Nicholas M. Giner Esri Parrish S. Henderson FBI Agenda The subjectivity of maps What is Hot Spot Analysis? Why do Hot
Rate Maps and Smoothing
 Rate Maps and Smoothing Luc Anselin Spatial Analysis Laboratory Dept. Agricultural and Consumer Economics University of Illinois, Urbana-Champaign http://sal.agecon.uiuc.edu Outline Mapping Rates Risk
Introduction. Semivariogram Cloud
 Introduction Data: set of n attribute measurements {z(s i ), i = 1,, n}, available at n sample locations {s i, i = 1,, n} Objectives: Slide 1 quantify spatial auto-correlation, or attribute dissimilarity
Universitat Autònoma de Barcelona Facultat de Filosofia i Lletres Departament de Prehistòria Doctorat en arqueologia prehistòrica
 Universitat Autònoma de Barcelona Facultat de Filosofia i Lletres Departament de Prehistòria Doctorat en arqueologia prehistòrica FROM MICRO TO MACRO SPATIAL DYNAMICS IN THE VILLAGGIO DELLE MACINE BETWEEN
An Introduction to Pattern Statistics
 An Introduction to Pattern Statistics Nearest Neighbors The CSR hypothesis Clark/Evans and modification Cuzick and Edwards and controls All events k function Weighted k function Comparative k functions
An Introduction to Spatial Autocorrelation and Kriging
 An Introduction to Spatial Autocorrelation and Kriging Matt Robinson and Sebastian Dietrich RenR 690 Spring 2016 Tobler and Spatial Relationships Tobler s 1 st Law of Geography: Everything is related to
Spatial Regression. 11. Spatial Two Stage Least Squares. Luc Anselin. Copyright 2017 by Luc Anselin, All Rights Reserved
 Spatial Regression 11. Spatial Two Stage Least Squares Luc Anselin http://spatial.uchicago.edu 1 endogeneity and instruments spatial 2SLS best and optimal estimators HAC standard errors 2 Endogeneity and
Experimental Design and Data Analysis for Biologists
 Experimental Design and Data Analysis for Biologists Gerry P. Quinn Monash University Michael J. Keough University of Melbourne CAMBRIDGE UNIVERSITY PRESS Contents Preface page xv I I Introduction 1 1.1
EXAM PRACTICE. 12 questions * 4 categories: Statistics Background Multivariate Statistics Interpret True / False
 EXAM PRACTICE 12 questions * 4 categories: Statistics Background Multivariate Statistics Interpret True / False Stats 1: What is a Hypothesis? A testable assertion about how the world works Hypothesis
Chapter 16. Simple Linear Regression and dcorrelation
 Chapter 16 Simple Linear Regression and dcorrelation 16.1 Regression Analysis Our problem objective is to analyze the relationship between interval variables; regression analysis is the first tool we will
A Guide to Modern Econometric:
 A Guide to Modern Econometric: 4th edition Marno Verbeek Rotterdam School of Management, Erasmus University, Rotterdam B 379887 )WILEY A John Wiley & Sons, Ltd., Publication Contents Preface xiii 1 Introduction
Chapter 4: Regression Models
 Sales volume of company 1 Textbook: pp. 129-164 Chapter 4: Regression Models Money spent on advertising 2 Learning Objectives After completing this chapter, students will be able to: Identify variables,
Areal Unit Data Regular or Irregular Grids or Lattices Large Point-referenced Datasets
 Areal Unit Data Regular or Irregular Grids or Lattices Large Point-referenced Datasets Is there spatial pattern? Chapter 3: Basics of Areal Data Models p. 1/18 Areal Unit Data Regular or Irregular Grids
12 - Nonparametric Density Estimation
 ST 697 Fall 2017 1/49 12 - Nonparametric Density Estimation ST 697 Fall 2017 University of Alabama Density Review ST 697 Fall 2017 2/49 Continuous Random Variables ST 697 Fall 2017 3/49 1.0 0.8 F(x) 0.6
Spatial Autocorrelation (2) Spatial Weights
 Spatial Weights") Spatial Autocorrelation (2) Spatial Weights Luc Anselin Spatial Analysis Laboratory Dept. Agricultural and Consumer Economics University of Illinois, Urbana-Champaign http://sal.agecon.uiuc.edu Outline
Spatial Autocorrelation (2) Spatial Weights Luc Anselin Spatial Analysis Laboratory Dept. Agricultural and Consumer Economics University of Illinois, Urbana-Champaign http://sal.agecon.uiuc.edu Outline
Clusters. Unsupervised Learning. Luc Anselin. Copyright 2017 by Luc Anselin, All Rights Reserved
 Clusters Unsupervised Learning Luc Anselin http://spatial.uchicago.edu 1 curse of dimensionality principal components multidimensional scaling classical clustering methods 2 Curse of Dimensionality 3 Curse
Spatial Regression. 10. Specification Tests (2) Luc Anselin. Copyright 2017 by Luc Anselin, All Rights Reserved
 Luc Anselin. Copyright 2017 by Luc Anselin, All Rights Reserved") Spatial Regression 10. Specification Tests (2) Luc Anselin http://spatial.uchicago.edu 1 robust LM tests higher order tests 2SLS residuals specification search 2 Robust LM Tests 3 Recap and Notation LM-Error
Spatial Regression 10. Specification Tests (2) Luc Anselin http://spatial.uchicago.edu 1 robust LM tests higher order tests 2SLS residuals specification search 2 Robust LM Tests 3 Recap and Notation LM-Error
Spatial correlation and demography.
 Spatial correlation and demography. Sébastien Oliveau, Christophe Guilmoto To cite this version: Sébastien Oliveau, Christophe Guilmoto. Spatial correlation and demography.: Exploring India s demographic
Creating and Managing a W Matrix
 Creating and Managing a W Matrix Carlos Hurtado Department of Economics University of Illinois at Urbana-Champaign hrtdmrt2@illinois.edu Junel 22th, 2016 C. Hurtado (UIUC - Economics) Spatial Econometrics
Spatial interaction and spatial autocorrelation: a crossproduct
 Environment and Planning A, 1991, volume 23, pages 1269-1277 Spatial interaction and spatial autocorrelation: a crossproduct approach A Getis Department of Geography, San Diego State University, San Diego,
Bayesian inference for sample surveys. Roderick Little Module 2: Bayesian models for simple random samples
 Bayesian inference for sample surveys Roderick Little Module : Bayesian models for simple random samples Superpopulation Modeling: Estimating parameters Various principles: least squares, method of moments,
Review of Statistics
 Review of Statistics Topics Descriptive Statistics Mean, Variance Probability Union event, joint event Random Variables Discrete and Continuous Distributions, Moments Two Random Variables Covariance and
Correlation and simple linear regression S5
 Basic medical statistics for clinical and eperimental research Correlation and simple linear regression S5 Katarzyna Jóźwiak k.jozwiak@nki.nl November 15, 2017 1/41 Introduction Eample: Brain size and
Chapter 16. Simple Linear Regression and Correlation
 Chapter 16 Simple Linear Regression and Correlation 16.1 Regression Analysis Our problem objective is to analyze the relationship between interval variables; regression analysis is the first tool we will
HYPOTHESIS TESTING: THE CHI-SQUARE STATISTIC
 1 HYPOTHESIS TESTING: THE CHI-SQUARE STATISTIC 7 steps of Hypothesis Testing 1. State the hypotheses 2. Identify level of significant 3. Identify the critical values 4. Calculate test statistics 5. Compare
Geographical Information Systems Institute. Center for Geographic Analysis, Harvard University. GeoDa: Spatial Autocorrelation
 Geographical Information Systems Institute, A. Background From geodacenter.asu.edu: GeoDa is a free software program that serves as an introduction to spatial data analysis. OpenGeoDa is the cross-platform,
BAYESIAN MODEL FOR SPATIAL DEPENDANCE AND PREDICTION OF TUBERCULOSIS
 BAYESIAN MODEL FOR SPATIAL DEPENDANCE AND PREDICTION OF TUBERCULOSIS Srinivasan R and Venkatesan P Dept. of Statistics, National Institute for Research Tuberculosis, (Indian Council of Medical Research),
Lattice Data. Tonglin Zhang. Spatial Statistics for Point and Lattice Data (Part III)
") Title: Spatial Statistics for Point Processes and Lattice Data (Part III) Lattice Data Tonglin Zhang Outline Description Research Problems Global Clustering and Local Clusters Permutation Test Spatial
Title: Spatial Statistics for Point Processes and Lattice Data (Part III) Lattice Data Tonglin Zhang Outline Description Research Problems Global Clustering and Local Clusters Permutation Test Spatial
Relational Nonlinear FIR Filters. Ronald K. Pearson
 Relational Nonlinear FIR Filters Ronald K. Pearson Daniel Baugh Institute for Functional Genomics and Computational Biology Thomas Jefferson University Philadelphia, PA Moncef Gabbouj Institute of Signal
Point Pattern Analysis
 Point Pattern Analysis Nearest Neighbor Statistics Luc Anselin http://spatial.uchicago.edu principle G function F function J function Principle Terminology events and points event: observed location of
Glossary. The ISI glossary of statistical terms provides definitions in a number of different languages:
 Glossary The ISI glossary of statistical terms provides definitions in a number of different languages: http://isi.cbs.nl/glossary/index.htm Adjusted r 2 Adjusted R squared measures the proportion of the
6. Spatial analysis of multivariate ecological data
 Université Laval Analyse multivariable - mars-avril 2008 1 6. Spatial analysis of multivariate ecological data 6.1 Introduction 6.1.1 Conceptual importance Ecological models have long assumed, for simplicity,
Weighted Least Squares
 Weighted Least Squares The standard linear model assumes that Var(ε i ) = σ 2 for i = 1,..., n. As we have seen, however, there are instances where Var(Y X = x i ) = Var(ε i ) = σ2 w i. Here w 1,..., w
Sleep data, two drugs Ch13.xls
 Model Based Statistics in Biology. Part IV. The General Linear Mixed Model.. Chapter 13.3 Fixed*Random Effects (Paired t-test) ReCap. Part I (Chapters 1,2,3,4), Part II (Ch 5, 6, 7) ReCap Part III (Ch
Areal data models. Spatial smoothers. Brook s Lemma and Gibbs distribution. CAR models Gaussian case Non-Gaussian case
 Areal data models Spatial smoothers Brook s Lemma and Gibbs distribution CAR models Gaussian case Non-Gaussian case SAR models Gaussian case Non-Gaussian case CAR vs. SAR STAR models Inference for areal
Keller: Stats for Mgmt & Econ, 7th Ed July 17, 2006
 Chapter 17 Simple Linear Regression and Correlation 17.1 Regression Analysis Our problem objective is to analyze the relationship between interval variables; regression analysis is the first tool we will
Lecture 18. Models for areal data. Colin Rundel 03/22/2017
 Lecture 18 Models for areal data Colin Rundel 03/22/2017 1 areal / lattice data 2 Example - NC SIDS SID79 3 EDA - Moran s I If we have observations at n spatial locations s 1,... s n ) I = n i=1 n n j=1
FinQuiz Notes
 Reading 10 Multiple Regression and Issues in Regression Analysis 2. MULTIPLE LINEAR REGRESSION Multiple linear regression is a method used to model the linear relationship between a dependent variable
Minimum Hellinger Distance Estimation in a. Semiparametric Mixture Model
 Minimum Hellinger Distance Estimation in a Semiparametric Mixture Model Sijia Xiang 1, Weixin Yao 1, and Jingjing Wu 2 1 Department of Statistics, Kansas State University, Manhattan, Kansas, USA 66506-0802.
Introduction to Statistical Analysis
 Introduction to Statistical Analysis Changyu Shen Richard A. and Susan F. Smith Center for Outcomes Research in Cardiology Beth Israel Deaconess Medical Center Harvard Medical School Objectives Descriptive
UNIT 5:Random number generation And Variation Generation
 UNIT 5:Random number generation And Variation Generation RANDOM-NUMBER GENERATION Random numbers are a necessary basic ingredient in the simulation of almost all discrete systems. Most computer languages
Spatial Regression. 3. Review - OLS and 2SLS. Luc Anselin. Copyright 2017 by Luc Anselin, All Rights Reserved
 Spatial Regression 3. Review - OLS and 2SLS Luc Anselin http://spatial.uchicago.edu OLS estimation (recap) non-spatial regression diagnostics endogeneity - IV and 2SLS OLS Estimation (recap) Linear Regression
 STOCKHOLM UNIVERSITY Department of Economics Course name: Empirical Methods Course code: EC40 Examiner: Lena Nekby Number of credits: 7,5 credits Date of exam: Friday, June 5, 009 Examination time: 3 hours
Using AMOEBA to Create a Spatial Weights Matrix and Identify Spatial Clusters, and a Comparison to Other Clustering Algorithms
 Using AMOEBA to Create a Spatial Weights Matrix and Identify Spatial Clusters, and a Comparison to Other Clustering Algorithms Arthur Getis* and Jared Aldstadt** *San Diego State University **SDSU/UCSB
Luc Anselin and Nancy Lozano-Gracia
 Errors in variables and spatial effects in hedonic house price models of ambient air quality Luc Anselin and Nancy Lozano-Gracia Presented by Julia Beckhusen and Kosuke Tamura February 29, 2008 AGEC 691T:
Handbook of Regression Analysis
 Handbook of Regression Analysis Samprit Chatterjee New York University Jeffrey S. Simonoff New York University WILEY A JOHN WILEY & SONS, INC., PUBLICATION CONTENTS Preface xi PARTI THE MULTIPLE LINEAR
GIS and Spatial Statistics: One World View or Two? Michael F. Goodchild University of California Santa Barbara
 GIS and Spatial Statistics: One World View or Two? Michael F. Goodchild University of California Santa Barbara Location as attribute The data table Census summary table What value is location as an explanatory
Nonparametric Estimation of the Spatial Connectivity Matrix Using Spatial Panel Data
 Geographical Analysis (2012), Nonparametric Estimation of the Spatial Connectivity Matrix Using Spatial Panel Data Michael Beenstock 1, Daniel Felsenstein 2 1 Department of Economics, Hebrew University
Lecture 5: Sampling Methods
 Lecture 5: Sampling Methods What is sampling? Is the process of selecting part of a larger group of participants with the intent of generalizing the results from the smaller group, called the sample, to
Unit 10: Simple Linear Regression and Correlation
 Unit 10: Simple Linear Regression and Correlation Statistics 571: Statistical Methods Ramón V. León 6/28/2004 Unit 10 - Stat 571 - Ramón V. León 1 Introductory Remarks Regression analysis is a method for
Categorical Predictor Variables
 Categorical Predictor Variables We often wish to use categorical (or qualitative) variables as covariates in a regression model. For binary variables (taking on only 2 values, e.g. sex), it is relatively
TIME SERIES DATA ANALYSIS USING EVIEWS
 TIME SERIES DATA ANALYSIS USING EVIEWS I Gusti Ngurah Agung Graduate School Of Management Faculty Of Economics University Of Indonesia Ph.D. in Biostatistics and MSc. in Mathematical Statistics from University
Regression Models. Chapter 4. Introduction. Introduction. Introduction
 Chapter 4 Regression Models Quantitative Analysis for Management, Tenth Edition, by Render, Stair, and Hanna 008 Prentice-Hall, Inc. Introduction Regression analysis is a very valuable tool for a manager
SPACE Workshop NSF NCGIA CSISS UCGIS SDSU. Aldstadt, Getis, Jankowski, Rey, Weeks SDSU F. Goodchild, M. Goodchild, Janelle, Rebich UCSB
 SPACE Workshop NSF NCGIA CSISS UCGIS SDSU Aldstadt, Getis, Jankowski, Rey, Weeks SDSU F. Goodchild, M. Goodchild, Janelle, Rebich UCSB August 2-8, 2004 San Diego State University Some Examples of Spatial
Chapter 3: Regression Methods for Trends
 Chapter 3: Regression Methods for Trends Time series exhibiting trends over time have a mean function that is some simple function (not necessarily constant) of time. The example random walk graph from
Types of spatial data. The Nature of Geographic Data. Types of spatial data. Spatial Autocorrelation. Continuous spatial data: geostatistics
 The Nature of Geographic Data Types of spatial data Continuous spatial data: geostatistics Samples may be taken at intervals, but the spatial process is continuous e.g. soil quality Discrete data Irregular:
Practical Statistics
 Practical Statistics Lecture 1 (Nov. 9): - Correlation - Hypothesis Testing Lecture 2 (Nov. 16): - Error Estimation - Bayesian Analysis - Rejecting Outliers Lecture 3 (Nov. 18) - Monte Carlo Modeling -
Correlation 1. December 4, HMS, 2017, v1.1
 Correlation 1 December 4, 2017 1 HMS, 2017, v1.1 Chapter References Diez: Chapter 7 Navidi, Chapter 7 I don t expect you to learn the proofs what will follow. Chapter References 2 Correlation The sample
Intensity Analysis of Spatial Point Patterns Geog 210C Introduction to Spatial Data Analysis
 Intensity Analysis of Spatial Point Patterns Geog 210C Introduction to Spatial Data Analysis Chris Funk Lecture 4 Spatial Point Patterns Definition Set of point locations with recorded events" within study
Business Statistics. Lecture 10: Correlation and Linear Regression
 Business Statistics Lecture 10: Correlation and Linear Regression Scatterplot A scatterplot shows the relationship between two quantitative variables measured on the same individuals. It displays the Form
Chapter 4. Regression Models. Learning Objectives
 Chapter 4 Regression Models To accompany Quantitative Analysis for Management, Eleventh Edition, by Render, Stair, and Hanna Power Point slides created by Brian Peterson Learning Objectives After completing
EXPLORATORY SPATIAL DATA ANALYSIS OF BUILDING ENERGY IN URBAN ENVIRONMENTS. Food Machinery and Equipment, Tianjin , China
 EXPLORATORY SPATIAL DATA ANALYSIS OF BUILDING ENERGY IN URBAN ENVIRONMENTS Wei Tian 1,2, Lai Wei 1,2, Pieter de Wilde 3, Song Yang 1,2, QingXin Meng 1 1 College of Mechanical Engineering, Tianjin University
CS 5014: Research Methods in Computer Science
 Computer Science Clifford A. Shaffer Department of Computer Science Virginia Tech Blacksburg, Virginia Fall 2010 Copyright c 2010 by Clifford A. Shaffer Computer Science Fall 2010 1 / 207 Correlation and
Testing for Regime Switching in Singaporean Business Cycles
 Testing for Regime Switching in Singaporean Business Cycles Robert Breunig School of Economics Faculty of Economics and Commerce Australian National University and Alison Stegman Research School of Pacific
Bivariate Relationships Between Variables
 Bivariate Relationships Between Variables BUS 735: Business Decision Making and Research 1 Goals Specific goals: Detect relationships between variables. Be able to prescribe appropriate statistical methods
Business Economics BUSINESS ECONOMICS. PAPER No. : 8, FUNDAMENTALS OF ECONOMETRICS MODULE No. : 3, GAUSS MARKOV THEOREM
 Subject Business Economics Paper No and Title Module No and Title Module Tag 8, Fundamentals of Econometrics 3, The gauss Markov theorem BSE_P8_M3 1 TABLE OF CONTENTS 1. INTRODUCTION 2. ASSUMPTIONS OF
Spatial Statistics For Real Estate Data 1
 1 Key words: spatial heterogeneity, spatial autocorrelation, spatial statistics, geostatistics, Geographical Information System SUMMARY: The paper presents spatial statistics tools in application to real
Econ 2148, fall 2017 Instrumental variables I, origins and binary treatment case
 Econ 2148, fall 2017 Instrumental variables I, origins and binary treatment case Maximilian Kasy Department of Economics, Harvard University 1 / 40 Agenda instrumental variables part I Origins of instrumental
The Use of Spatial Weights Matrices and the Effect of Geometry and Geographical Scale
 The Use of Spatial Weights Matrices and the Effect of Geometry and Geographical Scale António Manuel RODRIGUES 1, José António TENEDÓRIO 2 1 Research fellow, e-geo Centre for Geography and Regional Planning,