An Introduction to Spatial Autocorrelation and Kriging
|
|
|
- Barrie Barber
- 6 years ago
- Views:
Transcription

1 An Introduction to Spatial Autocorrelation and Kriging Matt Robinson and Sebastian Dietrich RenR 690 Spring 2016
 Tobler W.")
2 Tobler and Spatial Relationships Tobler s 1 st Law of Geography: Everything is related to everything else, but near things are more related than distant things. 1 Simple but powerful concept Patterns exist across space Waldo R. Tobler Forms basic foundation for concepts related to spatial dependency (1) Tobler W., (1970) "A computer movie simulating urban growth in the Detroit region". Economic Geography, 46(2):
3 Spatial Autocorrelation (SAC) What is it? Autocorrelation: A variable is correlated with itself (literally!) Spatial Autocorrelation: Values of a random variable, at paired points, are more or less similar as a function of the distance between them 2 Closer Points more similar = Positive Autocorrelation Closer Points less similar = Negative Autocorrelation (2) Legendre P. Spatial Autocorrelation: Trouble or New Paradigm? Ecology Sep;74(6):
 Artifact of Experimental Design (sample sites not random) (2) Interaction of variables across space (see below) Parent Plant Univariate case")
 close to other plants (seeds fall and germinate close to parent).")
4 What causes Spatial Autocorrelation? (1) Artifact of Experimental Design (sample sites not random) (2) Interaction of variables across space (see below) Parent Plant Univariate case response variable is correlated with itself Eg. Plant abundance higher (clustered) close to other plants (seeds fall and germinate close to parent). Multivariate case interactions of response and predictor variables due to inherent properties of the variables Eg. Location of seed germination function of wind and preferred soil conditions Mechanisms underlying patterns will depend on study system!!
5 Why is it important? Presence of SAC can be good or bad (depends on your objectives) Good: If SAC exists, it may allow reliable estimation at nearby, non-sampled sites (interpolation). Bad: If SAC exists, observations are not independent (violates assumption of many statistical tests) Failure to recognize/account for SAC can lead to erroneous statistical results and conclusions
6 Structure Functions Spatial structure = spatial patterns in your data Structure Functions - mathematical functions that describe spatial autocorrelation and spatial structure 3 Include terms that account for distance between sites Most common structure functions based on variance (variogram) and covariance (correlogram) (3) Legendre P, Fortin MJ Spatial pattern and ecological analysis. Vegetation. 80(2):
7 Tests for SAC: Moran s I Moran s I (Moran s Index): Measures degree of correlation between sample/observation points based on both variable values and distance between points 4 Determines whether spatial pattern in data is random, clustered, or dispersed. (4) How Spatial Autocorrelation (Global Moran s I) works - (ArcGIS Desktop Help). Available from:
 5 Range: -1.0 (negative SAC) and 1.")
8 Moran s I - Explained Extension of Pearson s Correlation Coefficient, r Pearson s (r): Measures association between 2 different variables Moran s I: Measures degree of association of single variable with itself at different points in space as a function of distance between points (called a spatial lag) 5 Range: -1.0 (negative SAC) and 1.0 (positive SAC) Value close to zero indicates no/little SAC (5) Fortin, M.J., Dale, M.R. and Ver Hoef, J.M Spatial analysis in ecology. Encyclopedia of environment.
9 Math Behind Moran s I (1) Calculate Matrix of Inverse Distance Weights - defines spatial relationship between all sample point pairs within a specified area. Distance weight (from matrix) Variable x at points i and j Observed I S 0 = Sum of all weights (2) Calculate Observed and Expected Moran I Expected I (Under H 0 of No SAC) (3) Compare to Observed to Expected Moran s I (expected under H 0 of no SAC)
10 Source: Moran s I: In R (using package ape ) (1) Input dataframe Example Dataframe Response variable x and y coordinates (specify location of sample points to be tested) Station Av8top Lat Lon (3) Run Moran s I Function Moran.I(ozone$Av8top, ozone.dists.inv) (2) Calculate Inverse Distance Matrix zone.dists <- as.matrix(dist(cbind(ozone$lon, ozone$lat))) ozone.dists.inv <- 1/ozone.dists diag(ozone.dists.inv) <- 0 ozone.dists.inv[1:5, 1:5]
11 Source: Source: Moran s I: Output and Interpretation In R Moran s I is an Inferential Statistic - Must examine in Context of Null Hypothesis (No Spatial Autocorrelation) (1) Look at p-value Significant p-value: reject H 0 (Autocorrelation exists). (2) Examine Observed and Expected Moran s I Observed > Expected: values cluster spatially ( + autocorrelation) Observed < Expected values disperse spatially (- autocorrelation) Observed = Moran s I calculated from the data Output in R Expected = Moran s I expected under H 0 (no spatial autocorrelation) sd = standard deviation of Moran s I under H 0 p.value = p-value of the test of H 0 against H A
12 Other Autocorrelation Indices Geary s C (similar to Moran s) - more sensitive to differences in small spatial neighborhoods Moran s I global measurement; sensitive to extreme values Geary s C Result in similar conclusions, but Moran s generally preferred (more powerful) 5,6 For more information see: nvironmetrics.pdf (5) Cliff, AD and Ord, JK (1975). The choice of a test for spatial autocorrelation. In J. C. Davies and M. J. McCullagh (eds) Display and Analysis of Spatial Data, John Wiley and Sons, London, (6) Cliff, A. D. and Ord, J. K Spatial processes - models and applications. (London: Pion).


13 The Variogram Georges François Paul Marie Matheron December 2, 1930 August 7, 2000 French mathematician and geologist, known as the founder of geostatistics Georges Matheron Principles of geostatistics Economic Geology : Source:
14 Variogram continued All credit to / Source: The variogram in a more ecologic context: The experimental variogram allows the description of the overall spatial pattern and the estimation of spatial autocorrelation parameters: (a) the spatial range, a, where the variable is spatially influenced by the same underlying process; (b) the nugget effect, which is the estimate of the error inherent in the measurements (sampling design and sampling unit size) and environmental variability; and (c) the sill that quantifies the spatial pattern intensity Secondly we derive a theoretical variogram which can be used for prediction of values (kriging) All credit to / Source (good read!): Spatial analysis in ecology Marie-Josee Fortin, Mark R.T. Dale & Jay ver Hoef Volume 4, pp in Encyclopedia of Environmetrics

15 Suggested read Variogram: Variogram or Semivariogram? Variance or Semivariance? Allan Variance or Introducing a New Term? Martin Bachmaier, Matthias Backes Mathematical Geosciences August 2011, Volume 43, Issue 6, pp First online: 01 July 2011
, including Krige s variancesize of area relationship.")
16 The history of Kriging Some history: Method developed by Professor Daniel Gerhardus Krige The concept of Support is very basic to geostatistics and was first covered by Ross (1950) and further developed by Krige (1951), including Krige s variancesize of area relationship. 37 Spatial Structure and Variograms The corresponding correlograms or covariograms were used on a Simple Kriging basis for block evaluations Initially Professor Krige s regressed estimates were then still called weighted moving averages until Matheron s insistence in the mid s on the term Kriging in recognition of Professor Krige s pioneering work. Matheron, also then proposed the use of the variogram to define the spatial structure. This model is an extension and refinement of the concept covered by De Wijs (1951/3); (Source: emorial_lecture.pdf) The theoretical basis for the method was developed by the French mathematician Georges Matheron based on the Master's thesis of Danie G. Krige, the pioneering plotter of distance-weighted average gold grades at the Witwatersrand reef complex in South Africa. (Source:
17 Kriging what it does also known as BLUP (best linear unbiased prediction) returning the observed values at sampling locations interpolates values using the intensity and shape of the experimental and modeled variogram using a neighborhood and/or distance search radius provides the standard errors of the interpolated values All credit to / Source (good read!): Spatial analysis in ecology Marie-Josee Fortin, Mark R.T. Dale & Jay ver Hoef Volume 4, pp in Encyclopedia of Environmetrics
18 Kriging how it works Description: Kriging algorithm explained: To estimate the value of Cell 1 (C1) no data points are found within the range (note, the value of C2 has not been estimated yet). The range is governed by the variogram and indicates the point at which data shows no correlation (or where the semi-variance vs distance plot starts to flatten). Because no data exists whithin the range the average of all data points is used for the C1 cell. When the C2 cell is now visited the C1 cell and the other datapoints (two green and one yellow) are also used. Their relative weight is based on the variogram. The grey datapoint is only used to calculate the average, but is not used directly for estimating the point C1 and C2. All credit to / source:

19 Kriging visual output Kriging maps created with ArcGIS Spherical variogram model Not standardized Ideal for single site anlysis, but Challenging for interpretetation Solutions?! Solution: plot standardized kriging maps? Can for comparison different variogram models be used to derive kriging maps?


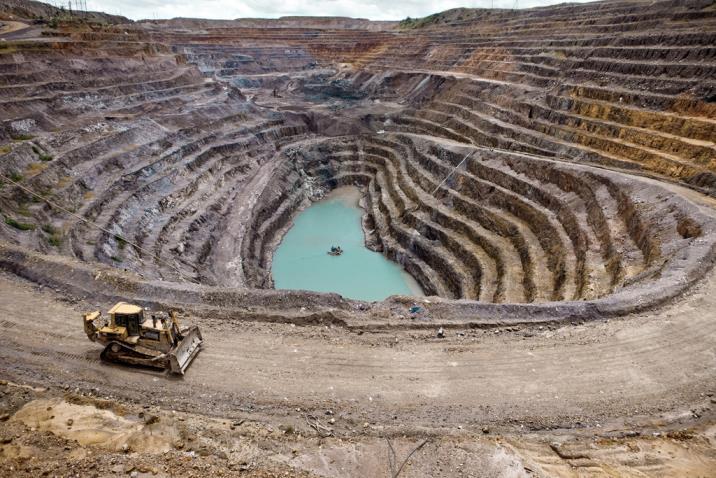

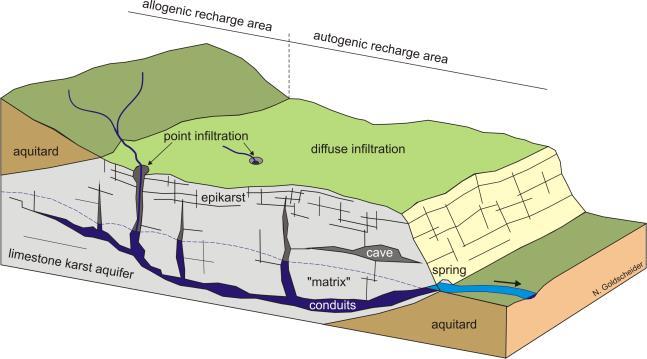
20 Kriging: Fields of application Hydrogeology Mining...and more!
21 Accounting/Correcting for SAC? Best method is proper experimental design Sample points or sites should be spaced appropriately Distance required will depend on your study system Made some mistakes all hope is not lost.. Some statistical methods exist to account for SAC 6 (see below for resource) (6) Dale, M.R.T., Fortin, M Spatial autocorrelation and statistical tests in ecology. Écoscience. 2002; 9(2):
Spatial Data Mining. Regression and Classification Techniques
 Spatial Data Mining Regression and Classification Techniques 1 Spatial Regression and Classisfication Discrete class labels (left) vs. continues quantities (right) measured at locations (2D for geographic
Spatial analysis. Spatial descriptive analysis. Spatial inferential analysis:
 Spatial analysis Spatial descriptive analysis Point pattern analysis (minimum bounding box, mean center, weighted mean center, standard distance, nearest neighbor analysis) Spatial clustering analysis
Lecture 5 Geostatistics
 Lecture 5 Geostatistics Lecture Outline Spatial Estimation Spatial Interpolation Spatial Prediction Sampling Spatial Interpolation Methods Spatial Prediction Methods Interpolating Raster Surfaces with
Lab #3 Background Material Quantifying Point and Gradient Patterns
 Lab #3 Background Material Quantifying Point and Gradient Patterns Dispersion metrics Dispersion indices that measure the degree of non-randomness Plot-based metrics Distance-based metrics First-order
Interpolating Raster Surfaces
 Interpolating Raster Surfaces You can use interpolation to model the surface of a feature or a phenomenon all you need are sample points, an interpolation method, and an understanding of the feature or
Spatial Interpolation & Geostatistics
 (Z i Z j ) 2 / 2 Spatial Interpolation & Geostatistics Lag Lag Mean Distance between pairs of points 1 y Kriging Step 1 Describe spatial variation with Semivariogram (Z i Z j ) 2 / 2 Point cloud Map 3
11/8/2018. Spatial Interpolation & Geostatistics. Kriging Step 1
 (Z i Z j ) 2 / 2 (Z i Zj) 2 / 2 Semivariance y 11/8/2018 Spatial Interpolation & Geostatistics Kriging Step 1 Describe spatial variation with Semivariogram Lag Distance between pairs of points Lag Mean
ENGRG Introduction to GIS
 ENGRG 59910 Introduction to GIS Michael Piasecki October 13, 2017 Lecture 06: Spatial Analysis Outline Today Concepts What is spatial interpolation Why is necessary Sample of interpolation (size and pattern)
BAYESIAN MODEL FOR SPATIAL DEPENDANCE AND PREDICTION OF TUBERCULOSIS
 BAYESIAN MODEL FOR SPATIAL DEPENDANCE AND PREDICTION OF TUBERCULOSIS Srinivasan R and Venkatesan P Dept. of Statistics, National Institute for Research Tuberculosis, (Indian Council of Medical Research),
Lecture 8. Spatial Estimation
 Lecture 8 Spatial Estimation Lecture Outline Spatial Estimation Spatial Interpolation Spatial Prediction Sampling Spatial Interpolation Methods Spatial Prediction Methods Interpolating Raster Surfaces
Geostatistics: Kriging
 Geostatistics: Kriging 8.10.2015 Konetekniikka 1, Otakaari 4, 150 10-12 Rangsima Sunila, D.Sc. Background What is Geostatitics Concepts Variogram: experimental, theoretical Anisotropy, Isotropy Lag, Sill,
Luc Anselin Spatial Analysis Laboratory Dept. Agricultural and Consumer Economics University of Illinois, Urbana-Champaign
 GIS and Spatial Analysis Luc Anselin Spatial Analysis Laboratory Dept. Agricultural and Consumer Economics University of Illinois, Urbana-Champaign http://sal.agecon.uiuc.edu Outline GIS and Spatial Analysis
Lecture 3: Exploratory Spatial Data Analysis (ESDA) Prof. Eduardo A. Haddad
 Prof. Eduardo A. Haddad") Lecture 3: Exploratory Spatial Data Analysis (ESDA) Prof. Eduardo A. Haddad Key message Spatial dependence First Law of Geography (Waldo Tobler): Everything is related to everything else, but near things
Lecture 3: Exploratory Spatial Data Analysis (ESDA) Prof. Eduardo A. Haddad Key message Spatial dependence First Law of Geography (Waldo Tobler): Everything is related to everything else, but near things
Finding Hot Spots in ArcGIS Online: Minimizing the Subjectivity of Visual Analysis. Nicholas M. Giner Esri Parrish S.
 Finding Hot Spots in ArcGIS Online: Minimizing the Subjectivity of Visual Analysis Nicholas M. Giner Esri Parrish S. Henderson FBI Agenda The subjectivity of maps What is Hot Spot Analysis? Why do Hot
I don t have much to say here: data are often sampled this way but we more typically model them in continuous space, or on a graph
 Spatial analysis Huge topic! Key references Diggle (point patterns); Cressie (everything); Diggle and Ribeiro (geostatistics); Dormann et al (GLMMs for species presence/abundance); Haining; (Pinheiro and
Introduction. Semivariogram Cloud
 Introduction Data: set of n attribute measurements {z(s i ), i = 1,, n}, available at n sample locations {s i, i = 1,, n} Objectives: Slide 1 quantify spatial auto-correlation, or attribute dissimilarity
Another Look at Non-Euclidean Variography
 Another Look at Non-Euclidean Variography G. Dubois European Commission DG Joint Research Centre Institute for Environment and Sustainability, Ispra, Italy. Email: gregoire.dubois@jrc.it ABSTRACT: Tobler
Introduction to Spatial Statistics and Modeling for Regional Analysis
 Introduction to Spatial Statistics and Modeling for Regional Analysis Dr. Xinyue Ye, Assistant Professor Center for Regional Development (Department of Commerce EDA University Center) & School of Earth,
Lecture 3: Exploratory Spatial Data Analysis (ESDA) Prof. Eduardo A. Haddad
 Prof. Eduardo A. Haddad") Lecture 3: Exploratory Spatial Data Analysis (ESDA) Prof. Eduardo A. Haddad Key message Spatial dependence First Law of Geography (Waldo Tobler): Everything is related to everything else, but near things
Lecture 3: Exploratory Spatial Data Analysis (ESDA) Prof. Eduardo A. Haddad Key message Spatial dependence First Law of Geography (Waldo Tobler): Everything is related to everything else, but near things
Exploratory Spatial Data Analysis (ESDA)
") Exploratory Spatial Data Analysis (ESDA) VANGHR s method of ESDA follows a typical geospatial framework of selecting variables, exploring spatial patterns, and regression analysis. The primary software
Exploratory Spatial Data Analysis (ESDA) VANGHR s method of ESDA follows a typical geospatial framework of selecting variables, exploring spatial patterns, and regression analysis. The primary software
Universitat Autònoma de Barcelona Facultat de Filosofia i Lletres Departament de Prehistòria Doctorat en arqueologia prehistòrica
 Universitat Autònoma de Barcelona Facultat de Filosofia i Lletres Departament de Prehistòria Doctorat en arqueologia prehistòrica FROM MICRO TO MACRO SPATIAL DYNAMICS IN THE VILLAGGIO DELLE MACINE BETWEEN
Copyright The McGraw-Hill Companies, Inc. Permission required for reproduction or display.
 Chapter 15. SPATIAL INTERPOLATION 15.1 Elements of Spatial Interpolation 15.1.1 Control Points 15.1.2 Type of Spatial Interpolation 15.2 Global Methods 15.2.1 Trend Surface Models Box 15.1 A Worked Example
Performance Analysis of Some Machine Learning Algorithms for Regression Under Varying Spatial Autocorrelation
 Performance Analysis of Some Machine Learning Algorithms for Regression Under Varying Spatial Autocorrelation Sebastian F. Santibanez Urban4M - Humboldt University of Berlin / Department of Geography 135
Nature of Spatial Data. Outline. Spatial Is Special
 Nature of Spatial Data Outline Spatial is special Bad news: the pitfalls of spatial data Good news: the potentials of spatial data Spatial Is Special Are spatial data special? Why spatial data require
Soil Moisture Modeling using Geostatistical Techniques at the O Neal Ecological Reserve, Idaho
 Final Report: Forecasting Rangeland Condition with GIS in Southeastern Idaho Soil Moisture Modeling using Geostatistical Techniques at the O Neal Ecological Reserve, Idaho Jacob T. Tibbitts, Idaho State
Kriging Luc Anselin, All Rights Reserved
 Kriging Luc Anselin Spatial Analysis Laboratory Dept. Agricultural and Consumer Economics University of Illinois, Urbana-Champaign http://sal.agecon.uiuc.edu Outline Principles Kriging Models Spatial Interpolation
PRODUCING PROBABILITY MAPS TO ASSESS RISK OF EXCEEDING CRITICAL THRESHOLD VALUE OF SOIL EC USING GEOSTATISTICAL APPROACH
 PRODUCING PROBABILITY MAPS TO ASSESS RISK OF EXCEEDING CRITICAL THRESHOLD VALUE OF SOIL EC USING GEOSTATISTICAL APPROACH SURESH TRIPATHI Geostatistical Society of India Assumptions and Geostatistical Variogram
SASI Spatial Analysis SSC Meeting Aug 2010 Habitat Document 5
 OBJECTIVES The objectives of the SASI Spatial Analysis were to (1) explore the spatial structure of the asymptotic area swept (z ), (2) define clusters of high and low z for each gear type, (3) determine
Exploring the World of Ordinary Kriging. Dennis J. J. Walvoort. Wageningen University & Research Center Wageningen, The Netherlands
 Exploring the World of Ordinary Kriging Wageningen University & Research Center Wageningen, The Netherlands July 2004 (version 0.2) What is? What is it about? Potential Users a computer program for exploring
An Introduction to Pattern Statistics
 An Introduction to Pattern Statistics Nearest Neighbors The CSR hypothesis Clark/Evans and modification Cuzick and Edwards and controls All events k function Weighted k function Comparative k functions
Introduction to Geostatistics
 Introduction to Geostatistics Abhi Datta 1, Sudipto Banerjee 2 and Andrew O. Finley 3 July 31, 2017 1 Department of Biostatistics, Bloomberg School of Public Health, Johns Hopkins University, Baltimore,
Geostatistical Interpolation: Kriging and the Fukushima Data. Erik Hoel Colligium Ramazzini October 30, 2011
 Geostatistical Interpolation: Kriging and the Fukushima Data Erik Hoel Colligium Ramazzini October 30, 2011 Agenda Basics of geostatistical interpolation Fukushima radiation Database Web site Geoanalytic
Chapter 1. Summer School GEOSTAT 2014, Spatio-Temporal Geostatistics,
 Chapter 1 Summer School GEOSTAT 2014, Geostatistics, 2014-06-19 sum- http://ifgi.de/graeler Institute for Geoinformatics University of Muenster 1.1 Spatial Data From a purely statistical perspective, spatial
Global Spatial Autocorrelation Clustering
 Global Spatial Autocorrelation Clustering Luc Anselin http://spatial.uchicago.edu join count statistics Moran s I Moran scatter plot non-parametric spatial autocorrelation Join Count Statistics Recap -
Spatial Analysis and Modeling (GIST 4302/5302) Guofeng Cao Department of Geosciences Texas Tech University
 Guofeng Cao Department of Geosciences Texas Tech University") Spatial Analysis and Modeling (GIST 4302/5302) Guofeng Cao Department of Geosciences Texas Tech University TTU Graduate Certificate Geographic Information Science and Technology (GIST) 3 Core Courses and
Spatial Analysis and Modeling (GIST 4302/5302) Guofeng Cao Department of Geosciences Texas Tech University TTU Graduate Certificate Geographic Information Science and Technology (GIST) 3 Core Courses and
Interpolation and 3D Visualization of Geodata
 Marek KULCZYCKI and Marcin LIGAS, Poland Key words: interpolation, kriging, real estate market analysis, property price index ABSRAC Data derived from property markets have spatial character, no doubt
7 Geostatistics. Figure 7.1 Focus of geostatistics
 7 Geostatistics 7.1 Introduction Geostatistics is the part of statistics that is concerned with geo-referenced data, i.e. data that are linked to spatial coordinates. To describe the spatial variation
Fluvial Variography: Characterizing Spatial Dependence on Stream Networks. Dale Zimmerman University of Iowa (joint work with Jay Ver Hoef, NOAA)
") Fluvial Variography: Characterizing Spatial Dependence on Stream Networks Dale Zimmerman University of Iowa (joint work with Jay Ver Hoef, NOAA) March 5, 2015 Stream network data Flow Legend o 4.40-5.80
Fluvial Variography: Characterizing Spatial Dependence on Stream Networks Dale Zimmerman University of Iowa (joint work with Jay Ver Hoef, NOAA) March 5, 2015 Stream network data Flow Legend o 4.40-5.80
Temporal vs. Spatial Data
 Temporal vs. Spatial Data Temporal 1 dimensional Units: day, week, month Lag: t, t-1, t-2 Durbin-Watson Spatial 2-3 dimensional Units: county, mile, region Lag: near neighbor, networks (?) Moran s I Differencing
Spatial analysis of landscapes: concepts and statistics
 TSPACE RESEARCH REPOSITORY tspace.library.utoronto.ca 2005 Spatial analysis of landscapes: concepts and statistics Published version Helene H. Wagner Marie-Josée Fortin Wagner, H. H. and Fortin, M.-J.
GIST 4302/5302: Spatial Analysis and Modeling
 GIST 4302/5302: Spatial Analysis and Modeling Review Guofeng Cao www.gis.ttu.edu/starlab Department of Geosciences Texas Tech University guofeng.cao@ttu.edu Spring 2016 Course Outlines Spatial Point Pattern
ENVIRONMENTAL MONITORING Vol. II - Geostatistical Analysis of Monitoring Data - Mark Dowdall, John O Dea GEOSTATISTICAL ANALYSIS OF MONITORING DATA
 GEOSTATISTICAL ANALYSIS OF MONITORING DATA Mark Dowdall Norwegian Radiation Protection Authority, Environmental Protection Unit, Polar Environmental Centre, Tromso, Norway John O Dea Institute of Technology,
COMPARISON OF DIGITAL ELEVATION MODELLING METHODS FOR URBAN ENVIRONMENT
 COMPARISON OF DIGITAL ELEVATION MODELLING METHODS FOR URBAN ENVIRONMENT Cahyono Susetyo Department of Urban and Regional Planning, Institut Teknologi Sepuluh Nopember, Indonesia Gedung PWK, Kampus ITS,
Statistics for analyzing and modeling precipitation isotope ratios in IsoMAP
 Statistics for analyzing and modeling precipitation isotope ratios in IsoMAP The IsoMAP uses the multiple linear regression and geostatistical methods to analyze isotope data Suppose the response variable
Spatial Statistics For Real Estate Data 1
 1 Key words: spatial heterogeneity, spatial autocorrelation, spatial statistics, geostatistics, Geographical Information System SUMMARY: The paper presents spatial statistics tools in application to real
Comparison of rainfall distribution method
 Team 6 Comparison of rainfall distribution method In this section different methods of rainfall distribution are compared. METEO-France is the French meteorological agency, a public administrative institution
Influence of parameter estimation uncertainty in Kriging: Part 2 Test and case study applications
 Hydrology and Earth System Influence Sciences, of 5(), parameter 5 3 estimation (1) uncertainty EGS in Kriging: Part Test and case study applications Influence of parameter estimation uncertainty in Kriging:
11. Kriging. ACE 492 SA - Spatial Analysis Fall 2003
 11. Kriging ACE 492 SA - Spatial Analysis Fall 2003 c 2003 by Luc Anselin, All Rights Reserved 1 Objectives The goal of this lab is to further familiarize yourself with ESRI s Geostatistical Analyst, extending
Spatial Analysis II. Spatial data analysis Spatial analysis and inference
 Spatial Analysis II Spatial data analysis Spatial analysis and inference Roadmap Spatial Analysis I Outline: What is spatial analysis? Spatial Joins Step 1: Analysis of attributes Step 2: Preparing for
Types of spatial data. The Nature of Geographic Data. Types of spatial data. Spatial Autocorrelation. Continuous spatial data: geostatistics
 The Nature of Geographic Data Types of spatial data Continuous spatial data: geostatistics Samples may be taken at intervals, but the spatial process is continuous e.g. soil quality Discrete data Irregular:
The Proportional Effect of Spatial Variables
 The Proportional Effect of Spatial Variables J. G. Manchuk, O. Leuangthong and C. V. Deutsch Centre for Computational Geostatistics, Department of Civil and Environmental Engineering University of Alberta
Investigation of Monthly Pan Evaporation in Turkey with Geostatistical Technique
 Investigation of Monthly Pan Evaporation in Turkey with Geostatistical Technique Hatice Çitakoğlu 1, Murat Çobaner 1, Tefaruk Haktanir 1, 1 Department of Civil Engineering, Erciyes University, Kayseri,
Assessing the covariance function in geostatistics
 Statistics & Probability Letters 52 (2001) 199 206 Assessing the covariance function in geostatistics Ana F. Militino, M. Dolores Ugarte Departamento de Estadstica e Investigacion Operativa, Universidad
ROeS Seminar, November
 IASC Introduction: Spatial Interpolation Estimation at a certain location Geostatistische Modelle für Fließgewässer e.g. Air pollutant concentrations were measured at different locations. What is the concentration
13.1 Structure functions. 712 Spatial analysis. Regionalized variable Surface
 7 Spatial analysis Regionalized variable Surface Surface pattern Values of a variable observed over a delimited geographic area form a regionalized variable Excerpt from (Matheron, Chapter 965) 3 of: or
Types of Spatial Data
 Spatial Data Types of Spatial Data Point pattern Point referenced geostatistical Block referenced Raster / lattice / grid Vector / polygon Point Pattern Data Interested in the location of points, not their
KAAF- GE_Notes GIS APPLICATIONS LECTURE 3
 GIS APPLICATIONS LECTURE 3 SPATIAL AUTOCORRELATION. First law of geography: everything is related to everything else, but near things are more related than distant things Waldo Tobler Check who is sitting
A GEOSTATISTICAL APPROACH TO PREDICTING A PHYSICAL VARIABLE THROUGH A CONTINUOUS SURFACE
 Katherine E. Williams University of Denver GEOG3010 Geogrpahic Information Analysis April 28, 2011 A GEOSTATISTICAL APPROACH TO PREDICTING A PHYSICAL VARIABLE THROUGH A CONTINUOUS SURFACE Overview Data
Mapping of Mn and Pb as Effect of Landfill Pollutant based on Ordinary Kriging Interpolation
 American Journal of Environmental Sciences Hypotheses Mapping of Mn and Pb as Effect of Landfill Pollutant based on Ordinary Kriging Interpolation 1 Rokhana Dwi Bekti, 1 Kris Suryowati and 2 Heruna Tanty
On dealing with spatially correlated residuals in remote sensing and GIS
 On dealing with spatially correlated residuals in remote sensing and GIS Nicholas A. S. Hamm 1, Peter M. Atkinson and Edward J. Milton 3 School of Geography University of Southampton Southampton SO17 3AT
GEOSTATISTICS. Dr. Spyros Fountas
 GEOSTATISTICS Dr. Spyros Fountas Northing (m) 140550 140450 140350 Trent field Disturbed area Andover 140250 Panholes 436950 437050 437150 437250 437350 Easting (m) Trent Field Westover Farm (Blackmore,
Agronomy at scale Principles and approaches with examples from
 Agronomy at scale Principles and approaches with examples from Pieter Pypers, 22-11-2016 What is agronomy at scale? Definition: agronomy = the science of soil management and crop production at scale =
Space-time data. Simple space-time analyses. PM10 in space. PM10 in time
 Space-time data Observations taken over space and over time Z(s, t): indexed by space, s, and time, t Here, consider geostatistical/time data Z(s, t) exists for all locations and all times May consider
Analytical Methods. Session 3: Statistics II. UCL Department of Civil, Environmental & Geomatic Engineering. Analytical Methods.
 Analytical Methods Session 3: Statistics II More statistical tests Quite a few more questions that we might want to ask about data that we have. Is one value significantly different to the rest, or to
SPATIAL VARIABILITY MAPPING OF N-VALUE OF SOILS OF MUMBAI CITY USING ARCGIS
 SPATIAL VARIABILITY MAPPING OF N-VALUE OF SOILS OF MUMBAI CITY USING ARCGIS RESHMA RASKAR - PHULE 1, KSHITIJA NADGOUDA 2 1 Assistant Professor, Department of Civil Engineering, Sardar Patel College of
GIST 4302/5302: Spatial Analysis and Modeling Lecture 2: Review of Map Projections and Intro to Spatial Analysis
 GIST 4302/5302: Spatial Analysis and Modeling Lecture 2: Review of Map Projections and Intro to Spatial Analysis Guofeng Cao http://www.spatial.ttu.edu Department of Geosciences Texas Tech University guofeng.cao@ttu.edu
Regression Revisited (again) Isobel Clark Geostokos Limited, Scotland. Abstract
 Isobel Clark Geostokos Limited, Scotland. Abstract") Regression Revisited (again) Isobel Clark Geostokos Limited, Scotland Abstract One of the seminal pioneering papers in reserve evaluation was published by Danie Krige in 1951. In this paper he introduced
Regression Revisited (again) Isobel Clark Geostokos Limited, Scotland Abstract One of the seminal pioneering papers in reserve evaluation was published by Danie Krige in 1951. In this paper he introduced
Optimal Interpolation
 Optimal Interpolation Optimal Interpolation and/or kriging consist in determining the BEST LINEAR ESTIMATE in the least square sense for locations xi where you have no measurements: Example 1: Collected
GIST 4302/5302: Spatial Analysis and Modeling
 GIST 4302/5302: Spatial Analysis and Modeling Lecture 2: Review of Map Projections and Intro to Spatial Analysis Guofeng Cao http://thestarlab.github.io Department of Geosciences Texas Tech University
Michael Harrigan Office hours: Fridays 2:00-4:00pm Holden Hall
 Announcement New Teaching Assistant Michael Harrigan Office hours: Fridays 2:00-4:00pm Holden Hall 209 Email: michael.harrigan@ttu.edu Guofeng Cao, Texas Tech GIST4302/5302, Lecture 2: Review of Map Projection
Spatiotemporal Analysis of Environmental Radiation in Korea
 WM 0 Conference, February 25 - March, 200, Tucson, AZ Spatiotemporal Analysis of Environmental Radiation in Korea J.Y. Kim, B.C. Lee FNC Technology Co., Ltd. Main Bldg. 56, Seoul National University Research
Index. Geostatistics for Environmental Scientists, 2nd Edition R. Webster and M. A. Oliver 2007 John Wiley & Sons, Ltd. ISBN:
 Index Akaike information criterion (AIC) 105, 290 analysis of variance 35, 44, 127 132 angular transformation 22 anisotropy 59, 99 affine or geometric 59, 100 101 anisotropy ratio 101 exploring and displaying
Manuscript of paper for APCOM 2003.
 1 Manuscript of paper for APCOM 2003. AN ANALYSIS OF THE PRACTICAL AND ECONOMIC IMPLICATIONS OF SYSTEMATIC UNDERGROUND DRILLING IN DEEP SOUTH AFRICAN GOLD MINES W. ASSIBEY-BONSU Consultant: Geostatistics
Is there still room for new developments in geostatistics?
 Is there still room for new developments in geostatistics? Jean-Paul Chilès MINES ParisTech, Fontainebleau, France, IAMG 34th IGC, Brisbane, 8 August 2012 Matheron: books and monographs 1962-1963: Treatise
Regression revisited (again)
") by I. Clark* Synopsis One of the seminal pioneering papers in reserve evaluation was published by Danie Krige in 1951. In that paper he introduced the concept of regression techniques in providing better
by I. Clark* Synopsis One of the seminal pioneering papers in reserve evaluation was published by Danie Krige in 1951. In that paper he introduced the concept of regression techniques in providing better
KRIGING is a Minimum Mean-Squared Error
 1 Universal Kriging Interpolator for Satellite-Derived Global Data Henry Coakley, Joshua Williams, and Doran Baker Abstract This paper explores the use of universal Kriging to interpolate sparsely-sampled
AUTOCORRELATION OF PELAGIC FISH CATCH RATES. Kristin Kleisner David Die
 MODELING THE SPATIAL AUTOCORRELATION OF PELAGIC FISH CATCH RATES Kristin Kleisner David Die John F. Walter, III Spatial Geostatistics and Fisheries Typically use geostatistics for sessile species habitat
2/7/2018. Module 4. Spatial Statistics. Point Patterns: Nearest Neighbor. Spatial Statistics. Point Patterns: Nearest Neighbor
 Spatial Statistics Module 4 Geographers are very interested in studying, understanding, and quantifying the patterns we can see on maps Q: What kinds of map patterns can you think of? There are so many
Concepts and Applications of Kriging
 2013 Esri International User Conference July 8 12, 2013 San Diego, California Technical Workshop Concepts and Applications of Kriging Eric Krause Konstantin Krivoruchko Outline Intro to interpolation Exploratory
Spatial Backfitting of Roller Measurement Values from a Florida Test Bed
 Spatial Backfitting of Roller Measurement Values from a Florida Test Bed Daniel K. Heersink 1, Reinhard Furrer 1, and Mike A. Mooney 2 1 Institute of Mathematics, University of Zurich, CH-8057 Zurich 2
University of California, Los Angeles Department of Statistics. Effect of variogram parameters on kriging weights
 University of California, Los Angeles Department of Statistics Statistics C173/C273 Instructor: Nicolas Christou Effect of variogram parameters on kriging weights We will explore in this document how the
How significantly different are your within field zones?
 Advances in Animal Biosciences: Precision Agriculture (ECPA) 2017, (2017), 8:2, pp 620 624 The Animal Consortium 2017 doi:10.1017/s2040470017000012 advances in animal biosciences How significantly different
Spatial Statistics or Why Spatial is Special?
 Spatial Statistics or Why Spatial is Special? Curdin Derungs, GISLab 20.10.2017 Seite 1 Spatial is special Spatial is special Longley et al s (2011) spatial is special -list: 20.10.2017 Seite 3 Spatial
What s special about spatial data?
 What s special about spatial data? Road map Geographic Information analysis The need to develop spatial thinking Some fundamental geographic concepts (PBCS) What are the effects of space? Spatial autocorrelation
Improving Spatial Data Interoperability
 Improving Spatial Data Interoperability A Framework for Geostatistical Support-To To-Support Interpolation Michael F. Goodchild, Phaedon C. Kyriakidis, Philipp Schneider, Matt Rice, Qingfeng Guan, Jordan
Spatial Regression. 1. Introduction and Review. Luc Anselin. Copyright 2017 by Luc Anselin, All Rights Reserved
 Spatial Regression 1. Introduction and Review Luc Anselin http://spatial.uchicago.edu matrix algebra basics spatial econometrics - definitions pitfalls of spatial analysis spatial autocorrelation spatial
2.6 Two-dimensional continuous interpolation 3: Kriging - introduction to geostatistics. References - geostatistics. References geostatistics (cntd.
 .6 Two-dimensional continuous interpolation 3: Kriging - introduction to geostatistics Spline interpolation was originally developed or image processing. In GIS, it is mainly used in visualization o spatial
SPATIAL-TEMPORAL TECHNIQUES FOR PREDICTION AND COMPRESSION OF SOIL FERTILITY DATA
 SPATIAL-TEMPORAL TECHNIQUES FOR PREDICTION AND COMPRESSION OF SOIL FERTILITY DATA D. Pokrajac Center for Information Science and Technology Temple University Philadelphia, Pennsylvania A. Lazarevic Computer
Relationships between Soil salinity and geopedological units in Saveh plain, Iran
 Available online at www.scholarsresearchlibrary.com Annals of Biological Research, 2012, 3 (5):2292-2296 (http://scholarsresearchlibrary.com/archive.html) ISSN 0976-1233 CODEN (USA): ABRNBW Relationships
Concepts and Applications of Kriging
 Esri International User Conference San Diego, California Technical Workshops July 24, 2012 Concepts and Applications of Kriging Konstantin Krivoruchko Eric Krause Outline Intro to interpolation Exploratory
Spatial Data Analysis in Archaeology Anthropology 589b. Kriging Artifact Density Surfaces in ArcGIS
 Spatial Data Analysis in Archaeology Anthropology 589b Fraser D. Neiman University of Virginia 2.19.07 Spring 2007 Kriging Artifact Density Surfaces in ArcGIS 1. The ingredients. -A data file -- in.dbf
Practical 12: Geostatistics
 Practical 12: Geostatistics This practical will introduce basic tools for geostatistics in R. You may need first to install and load a few packages. The packages sp and lattice contain useful function
Spatial Analysis 1. Introduction
 Spatial Analysis 1 Introduction Geo-referenced Data (not any data) x, y coordinates (e.g., lat., long.) ------------------------------------------------------ - Table of Data: Obs. # x y Variables -------------------------------------
GIS and Spatial Statistics: One World View or Two? Michael F. Goodchild University of California Santa Barbara
 GIS and Spatial Statistics: One World View or Two? Michael F. Goodchild University of California Santa Barbara Location as attribute The data table Census summary table What value is location as an explanatory
Spatial Analysis 2. Spatial Autocorrelation
 Spatial Analysis 2 Spatial Autocorrelation Spatial Autocorrelation a relationship between nearby spatial units of the same variable If, for every pair of subareas i and j in the study region, the drawings
GEOSTATISTICAL ANALYSIS OF SPATIAL DATA. Goovaerts, P. Biomedware, Inc. and PGeostat, LLC, Ann Arbor, Michigan, USA
 GEOSTATISTICAL ANALYSIS OF SPATIAL DATA Goovaerts, P. Biomedware, Inc. and PGeostat, LLC, Ann Arbor, Michigan, USA Keywords: Semivariogram, kriging, spatial patterns, simulation, risk assessment Contents
Spatial analysis of a designed experiment. Uniformity trials. Blocking
 Spatial analysis of a designed experiment RA Fisher s 3 principles of experimental design randomization unbiased estimate of treatment effect replication unbiased estimate of error variance blocking =
Data Break 8: Kriging the Meuse RiverBIOS 737 Spring 2004 p.1/27
 Data Break 8: Kriging the Meuse River BIOS 737 Spring 2004 Data Break 8: Kriging the Meuse RiverBIOS 737 Spring 2004 p.1/27 Meuse River: Reminder library(gstat) Data included in gstat library. data(meuse)
OFTEN we need to be able to integrate point attribute information
 ALLAN A NIELSEN: GEOSTATISTICS AND ANALYSIS OF SPATIAL DATA 1 Geostatistics and Analysis of Spatial Data Allan A Nielsen Abstract This note deals with geostatistical measures for spatial correlation, namely
Lecture 9: Introduction to Kriging
 Lecture 9: Introduction to Kriging Math 586 Beginning remarks Kriging is a commonly used method of interpolation (prediction) for spatial data. The data are a set of observations of some variable(s) of