Geovisualization. Luc Anselin. Copyright 2016 by Luc Anselin, All Rights Reserved
|
|
|
- Delilah Edwards
- 5 years ago
- Views:
Transcription

1 Geovisualization Luc Anselin
2 from EDA to ESDA from mapping to geovisualization mapping basics multivariate EDA primer
3 From EDA to ESDA
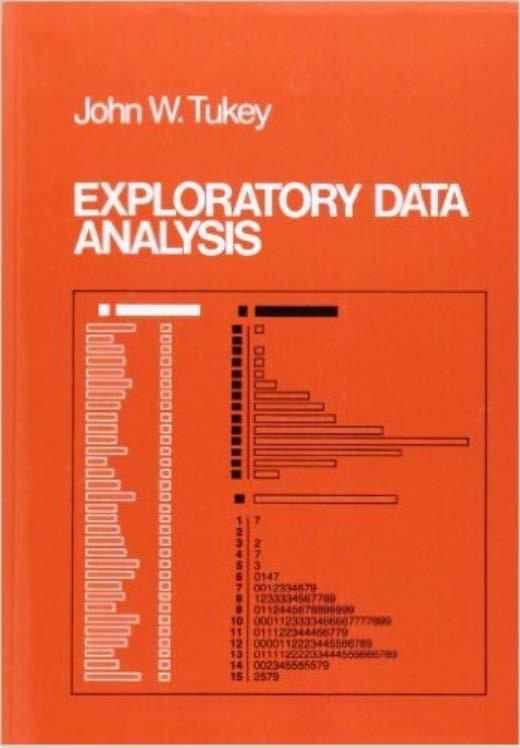
4 Exploratory Data Analysis (EDA) reaction to modeling without looking at the data classic EDA book, Tukey (1977) Good (1983), Philosophy of Science discover potentially explicable patterns

5
6 Data Visualization concept of a view (e.g., Buja et al 1996) a graphical representation and summary of the data many different views chart, table, graph, map
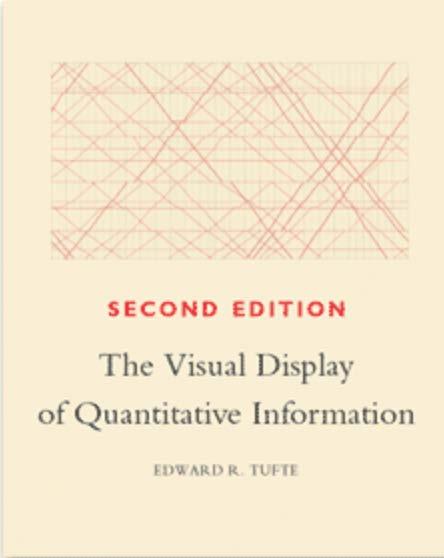
7 Visual Explanations Tufte (1997) and later reasoning about evidence and design of graphics multivariate nature of analytic problems document sources (metadata) quantify and show cause and effect evaluate alternative explanations

8
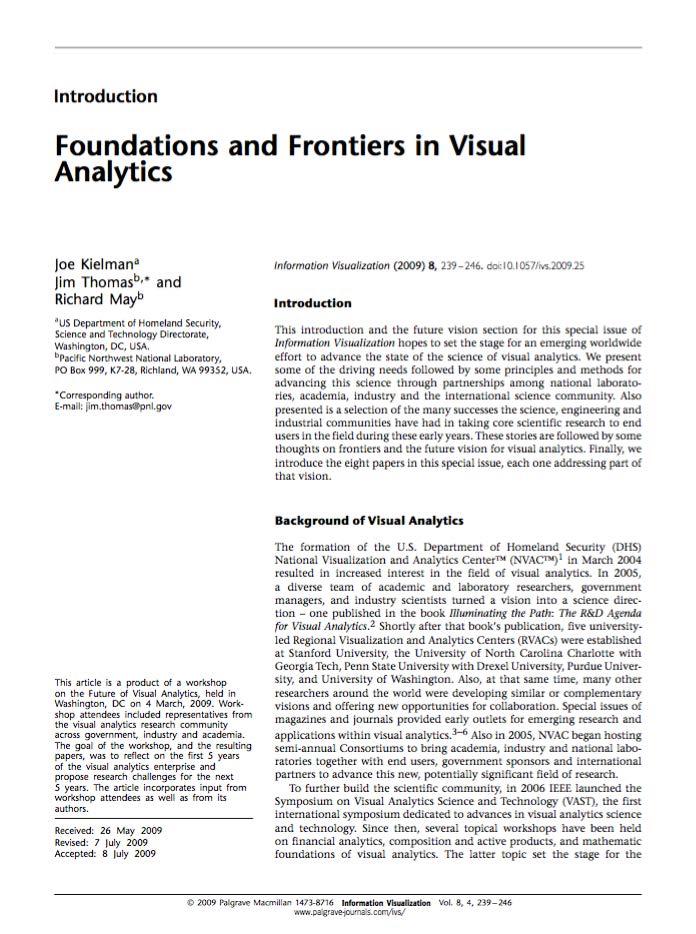
9 Visual Analytics Thomas et al (2005) the science of analytical reasoning facilitated by interactive visual interfaces detect the expected and discover the unexpected
10
11 Exploratory Spatial Data Analysis (ESDA) EDA + describe spatial distributions dynamic statistical maps identify atypical spatial observations spatial outliers discover patterns of spatial dependence and spatial heterogeneity spatial clusters, hot spots, cold spots spatial structural breaks
12 From Mapping to Geovisualization
13 What Is a Map a collection of spatially defined objects (Monmonier) importance of depicting location importance of representing value
14 How to Lie with Maps many design issues legends, colors, intervals projections human perception can be tricked political maps

15
16 Geovisualization map + scientific visualization map as presentation vs map as part of the analysis interactive mapping
17 Maps and Knowledge Discovery exploration, synthesis, presentation, analysis visual popout abductive approach = pattern discovered along with a hypothesis contrast with deductive or inductive interaction between data exploration and human perception
18 Geovisual Analytics leverages both geovisualization and visual analytics interactive mapping animation linking and brushing

19
20 Dynamic Graphics different views to represent the data focusing individual views linking multiple views arranging many views
21 Linking and Brushing linking selection in one view (graph) is simultaneously selected in all views brushing dynamically changing the selection updates all views

22 linked map and graph
23 Mapping Basics
24 Choropleth Map not chloro! choros = region visualize a spatial distribution map counterpart of a histogram discrete approximation of the distribution all observations in the same value interval get the same color


25 histogram and equal intervals choropleth map
26 Choice of Intervals cut points equal interval, natural breaks (Jencks), manual statistical criteria equal share (quantile), standard deviational units
27 Map Design Issues choice of colors perception of pattern red = hot, danger; blue = cool misleading role of area larger areas seem more important legends sequential diverging categorical
28 Statistical Maps
29 Quantile Map data sorted from low to high equal number of observations in each interval examples quartile map (4 categories) quintile map (5 categories) possible issues with ties
30 quintile map (NYC % rental units)
31 Box Map identifying outliers same principle as in box plot fence = median IQR or + 3 IQR IQR = inter quartile range, 25% to 75% six intervals same principle as quartile map outliers identified as a separate category
")
32 upper outliers in box plot and box map (NYC median rent 2008)
33 lower outliers in box plot and box map (NYC median rent 2008)
34 Standard Deviational Map based on standardized data values mean = 0, standard deviation = 1 intervals correspond to one standard deviation outliers are more than 2 standard deviations from the mean

35 standard deviational map (NYC median rent 2008)
36 Cartogram areal unit proportional to variable of interest avoid misleading effect of area use transformed shapes circular cartogram contiguous cartogram

37 box map and circular cartogram

38 contiguous cartogram area = number of votes in electoral college source: Sarah Williams
39 Conditional Maps cc maps, conditioned choropleth maps (Carr) special case of trellis graphs micromap matrix conditioning variables on the axes matrix of mini maps for the variable of interest conditioned by the values on the axes

40 child malnutrition cc map conditioned on poverty index and per capita income (Nepal districts)
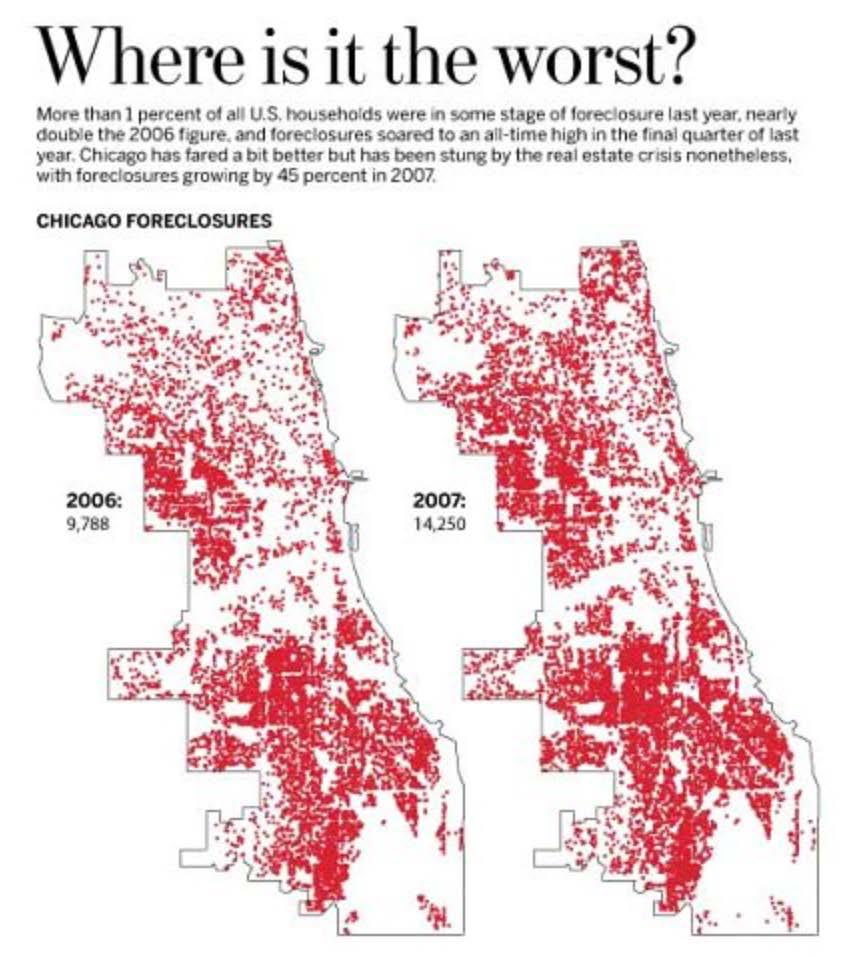
41 Map Animation map movie highlight observations in increasing or decreasing order one at a time cumulative visual impression of patterning/clustering
42 Multivariate EDA Primer
43 Objectives of Multivariate EDA represent multi-dimensional data in two dimensions dimension reduction projection discover structure, interaction, patterns
44 3-D Scatter Plot points in a 3-D data cube two-dimensional analysis on side panels issues of perspective zooming, rotating brushing the 3-D data cube

45 selection in a 3D scatter plot
46 Parallel Coordinate Plot (PCP) due to Inselberg (1984) variables one parallel line for each variable observations a line connecting points on the parallels the line is the counterpart of a point in the multidimensional data cube

47 selected points in PCP
48 Clusters in PCP lines that move closely together correspond to points closely together in multidimensional space = clusters visual cluster identification problems with large data sets remove clutter

49 brushing the PCP
50 Scatter Plot Matrix matrix of bivariate scatter plots each variable once on x-axis and once on y-axis univariate description on diagonal focus on interaction effects
51 scatter plot matrix (Nepal districts)

52 scatter plot matrix with lowess smoother

53 brushing the scatter plot matrix
54 Conditional Plots trellis display conditioning variables on the axes matrix of micro plots for subsets of observations that match the axes conditions data intervals in two dimensions
55 scatter plot trellis graph scatter of per capital income on no safe water conditioned on poverty index and life expectancy
56 Interpretation of Conditional Plots micro plots are similar no effect of conditioning variables micro plots are different conditioning variables interact with variable under consideration effect of conditioning variables
Mapping and Analysis for Spatial Social Science
 Mapping and Analysis for Spatial Social Science Luc Anselin Spatial Analysis Laboratory Dept. Agricultural and Consumer Economics University of Illinois, Urbana-Champaign http://sal.agecon.uiuc.edu Outline
Lecture 3: Exploratory Spatial Data Analysis (ESDA) Prof. Eduardo A. Haddad
 Prof. Eduardo A. Haddad") Lecture 3: Exploratory Spatial Data Analysis (ESDA) Prof. Eduardo A. Haddad Key message Spatial dependence First Law of Geography (Waldo Tobler): Everything is related to everything else, but near things
Lecture 3: Exploratory Spatial Data Analysis (ESDA) Prof. Eduardo A. Haddad Key message Spatial dependence First Law of Geography (Waldo Tobler): Everything is related to everything else, but near things
Outline ESDA. Exploratory Spatial Data Analysis ESDA. Luc Anselin
 Exploratory Spatial Data Analysis ESDA Luc Anselin University of Illinois, Urbana-Champaign http://www.spacestat.com Outline ESDA Exploring Spatial Patterns Global Spatial Autocorrelation Local Spatial
Exploratory Spatial Data Analysis (And Navigating GeoDa)
") Exploratory Spatial Data Analysis (And Navigating GeoDa) June 9, 2006 Stephen A. Matthews Associate Professor of Sociology & Anthropology, Geography and Demography Director of the Geographic Information
Exploratory Spatial Data Analysis (And Navigating GeoDa) June 9, 2006 Stephen A. Matthews Associate Professor of Sociology & Anthropology, Geography and Demography Director of the Geographic Information
Geographical Information Systems Institute. Center for Geographic Analysis, Harvard University. GeoDa: Exploratory Spatial Data Analysis
 Geographical Information Systems Institute, A. Background GeoDa: Exploratory Spatial Data Analysis From geodacenter.asu.edu: GeoDa is a free software program that serves as an introduction to spatial data
Exploratory Spatial Data Analysis and GeoDa
 Exploratory Spatial Data Analysis and GeoDa Luc Anselin Spatial Analysis Laboratory Dept. Agricultural and Consumer Economics University of Illinois, Urbana-Champaign http://sal.agecon.uiuc.edu Outline
Outline. Introduction to SpaceStat and ESTDA. ESTDA & SpaceStat. Learning Objectives. Space-Time Intelligence System. Space-Time Intelligence System
 Outline I Data Preparation Introduction to SpaceStat and ESTDA II Introduction to ESTDA and SpaceStat III Introduction to time-dynamic regression ESTDA ESTDA & SpaceStat Learning Objectives Activities
Descriptive Univariate Statistics and Bivariate Correlation
 ESC 100 Exploring Engineering Descriptive Univariate Statistics and Bivariate Correlation Instructor: Sudhir Khetan, Ph.D. Wednesday/Friday, October 17/19, 2012 The Central Dogma of Statistics used to
Soc/Anth 597 Spatial Demography March 14, GeoDa 0.95i Exercise A. Stephen A. Matthews. Outline. 1. Background
 Soc/Anth 597 Spatial Demography March 14, 2006 GeoDa 0.95i Exercise A Stephen A. Matthews Outline 1. Background 2. Data set introduced (GDANEPAL.SHP) 3. GeoDa introduced Task 1: Start GeoDa Task 2: Open
OPEN GEODA WORKSHOP / CRASH COURSE FACILITATED BY M. KOLAK
 OPEN GEODA WORKSHOP / CRASH COURSE FACILITATED BY M. KOLAK WHAT IS GEODA? Software program that serves as an introduction to spatial data analysis Free Open Source Source code is available under GNU license
Local Spatial Autocorrelation Clusters
 Local Spatial Autocorrelation Clusters Luc Anselin http://spatial.uchicago.edu LISA principle local Moran local G statistics issues and interpretation LISA Principle Clustering vs Clusters global spatial
The GeoDa Book. Exploring Spatial Data. Luc Anselin
 The GeoDa Book Exploring Spatial Data Luc Anselin Copyright 2017 by GeoDa Press LLC All rights reserved. ISBN: 0-9863421-2-2 ISBN-13: 978-0-9863421-2-7 GeoDa Press LLC, Chicago, IL GeoDa TM is a trade
1. Exploratory Data Analysis
 1. Exploratory Data Analysis 1.1 Methods of Displaying Data A visual display aids understanding and can highlight features which may be worth exploring more formally. Displays should have impact and be
BNG 495 Capstone Design. Descriptive Statistics
 BNG 495 Capstone Design Descriptive Statistics Overview The overall goal of this short course in statistics is to provide an introduction to descriptive and inferential statistical methods, with a focus
Visualization Based Approach for Exploration of Health Data and Risk Factors
 Visualization Based Approach for Exploration of Health Data and Risk Factors Xiping Dai and Mark Gahegan Department of Geography & GeoVISTA Center Pennsylvania State University University Park, PA 16802,
Visualizing Data: Basic Plot Types
 Visualizing Data: Basic Plot Types Data Science 101 Stanford University, Department of Statistics Agenda Today s lecture focuses on these basic plot types: bar charts histograms boxplots scatter plots
Geographic Data Science - Lecture IV
 Geographic Data Science - Lecture IV Mapping Data Dani Arribas-Bel Today Mapping data MAUP Choropleths Definition Classes Cartograms Conditional maps Space-Time mapping Data maps Abstraction from the purely
Chapter 7: Making Maps with GIS. 7.1 The Parts of a Map 7.2 Choosing a Map Type 7.3 Designing the Map
 Chapter 7: Making Maps with GIS 7.1 The Parts of a Map 7.2 Choosing a Map Type 7.3 Designing the Map What is a map? A graphic depiction of all or part of a geographic realm in which the real-world features
CS : Spatial Data Modeling and Analysis. Geovisualization
 CS260-002: Spatial Data Modeling and Analysis Geovisualization Visual Perception Learning Styles & Personality Types: Visual, Auditory, Kinesthetic Cholera cases in the London epidemic of 1854 Cholera
MODULE 7 UNIVARIATE EDA - QUANTITATIVE
 MODULE 7 UNIVARIATE EDA - QUANTITATIVE Contents 7.1 Interpreting Shape........................................ 46 7.2 Interpreting Outliers....................................... 47 7.3 Comparing the Median
Spatial Regression. 1. Introduction and Review. Luc Anselin. Copyright 2017 by Luc Anselin, All Rights Reserved
 Spatial Regression 1. Introduction and Review Luc Anselin http://spatial.uchicago.edu matrix algebra basics spatial econometrics - definitions pitfalls of spatial analysis spatial autocorrelation spatial
Chapter 1. Looking at Data
 Chapter 1 Looking at Data Types of variables Looking at Data Be sure that each variable really does measure what you want it to. A poor choice of variables can lead to misleading conclusions!! For example,
Spatial Pattern Analysis: Mapping Trends and Clusters. Lauren M. Scott, PhD Lauren Rosenshein Bennett, MS
 Spatial Pattern Analysis: Mapping Trends and Clusters Lauren M. Scott, PhD Lauren Rosenshein Bennett, MS Presentation Outline Spatial statistics overview Describing spatial patterns Quantifying spatial
METHODS FOR STATISTICS
 DYNAMIC CARTOGRAPHIC METHODS FOR VISUALIZATION OF HEALTH STATISTICS Radim Stampach M.Sc. Assoc. Prof. Milan Konecny Ph.D. Petr Kubicek Ph.D. Laboratory on Geoinformatics and Cartography, Department of
From Practical Data Analysis with JMP, Second Edition. Full book available for purchase here. About This Book... xiii About The Author...
 From Practical Data Analysis with JMP, Second Edition. Full book available for purchase here. Contents About This Book... xiii About The Author... xxiii Chapter 1 Getting Started: Data Analysis with JMP...
KAAF- GE_Notes GIS APPLICATIONS LECTURE 3
 GIS APPLICATIONS LECTURE 3 SPATIAL AUTOCORRELATION. First law of geography: everything is related to everything else, but near things are more related than distant things Waldo Tobler Check who is sitting
Statistics Toolbox 6. Apply statistical algorithms and probability models
 Statistics Toolbox 6 Apply statistical algorithms and probability models Statistics Toolbox provides engineers, scientists, researchers, financial analysts, and statisticians with a comprehensive set of
Spatial Data, Spatial Analysis and Spatial Data Science
 Spatial Data, Spatial Analysis and Spatial Data Science Luc Anselin http://spatial.uchicago.edu 1 spatial thinking in the social sciences spatial analysis spatial data science spatial data types and research
Chapter 1:Descriptive statistics
 Slide 1.1 Chapter 1:Descriptive statistics Descriptive statistics summarises a mass of information. We may use graphical and/or numerical methods Examples of the former are the bar chart and XY chart,
Exploratory Spatial Data Analysis Using GeoDA: : An Introduction
 Exploratory Spatial Data Analysis Using GeoDA: : An Introduction Prepared by Professor Ravi K. Sharma, University of Pittsburgh Modified for NBDPN 2007 Conference Presentation by Professor Russell S. Kirby,
Chapter 3. Data Description
 Chapter 3. Data Description Graphical Methods Pie chart It is used to display the percentage of the total number of measurements falling into each of the categories of the variable by partition a circle.
Lecture 1: Descriptive Statistics
 Lecture 1: Descriptive Statistics MSU-STT-351-Sum 15 (P. Vellaisamy: MSU-STT-351-Sum 15) Probability & Statistics for Engineers 1 / 56 Contents 1 Introduction 2 Branches of Statistics Descriptive Statistics
Chapter 3 Examining Data
 Chapter 3 Examining Data This chapter discusses methods of displaying quantitative data with the objective of understanding the distribution of the data. Example During childhood and adolescence, bone
Lecture Slides. Elementary Statistics Tenth Edition. by Mario F. Triola. and the Triola Statistics Series. Slide 1
 Lecture Slides Elementary Statistics Tenth Edition and the Triola Statistics Series by Mario F. Triola Slide 1 Chapter 3 Statistics for Describing, Exploring, and Comparing Data 3-1 Overview 3-2 Measures
Descriptive statistics Maarten Jansen
 Descriptive statistics Maarten Jansen Overview 1. Classification of observational values 2. Visualisation methods 3. Guidelines for good visualisation c Maarten Jansen STAT-F-413 Descriptive statistics
STP 420 INTRODUCTION TO APPLIED STATISTICS NOTES
 INTRODUCTION TO APPLIED STATISTICS NOTES PART - DATA CHAPTER LOOKING AT DATA - DISTRIBUTIONS Individuals objects described by a set of data (people, animals, things) - all the data for one individual make
STARS: Space-Time Analysis of Regional Systems
 STARS: Space-Time Analysis of Regional Systems Sergio J. Rey Mark V. Janikas April 27, 2004 Abstract Space-Time Analysis of Regional Systems (STARS) is an open source package designed for dynamic exploratory
ECLT 5810 Data Preprocessing. Prof. Wai Lam
 ECLT 5810 Data Preprocessing Prof. Wai Lam Why Data Preprocessing? Data in the real world is imperfect incomplete: lacking attribute values, lacking certain attributes of interest, or containing only aggregate
Analytical Graphing. lets start with the best graph ever made
 Analytical Graphing lets start with the best graph ever made Probably the best statistical graphic ever drawn, this map by Charles Joseph Minard portrays the losses suffered by Napoleon's army in the Russian
AP Final Review II Exploring Data (20% 30%)
") AP Final Review II Exploring Data (20% 30%) Quantitative vs Categorical Variables Quantitative variables are numerical values for which arithmetic operations such as means make sense. It is usually a measure
AP Final Review II Exploring Data (20% 30%) Quantitative vs Categorical Variables Quantitative variables are numerical values for which arithmetic operations such as means make sense. It is usually a measure
2/2/2015 GEOGRAPHY 204: STATISTICAL PROBLEM SOLVING IN GEOGRAPHY MEASURES OF CENTRAL TENDENCY CHAPTER 3: DESCRIPTIVE STATISTICS AND GRAPHICS
 Spring 2015: Lembo GEOGRAPHY 204: STATISTICAL PROBLEM SOLVING IN GEOGRAPHY CHAPTER 3: DESCRIPTIVE STATISTICS AND GRAPHICS Descriptive statistics concise and easily understood summary of data set characteristics
Organization of 2D Space
 Organization of 2D Space Linear Frequency is Mapped in 2D Space Linear frequency time series, bar charts, histograms, etc. feature 2possible more sets of information Most data have multi-dimensional and
Chapter 2: Tools for Exploring Univariate Data
 Stats 11 (Fall 2004) Lecture Note Introduction to Statistical Methods for Business and Economics Instructor: Hongquan Xu Chapter 2: Tools for Exploring Univariate Data Section 2.1: Introduction What is
Introduction to Statistics
 Introduction to Statistics Data and Statistics Data consists of information coming from observations, counts, measurements, or responses. Statistics is the science of collecting, organizing, analyzing,
Spatial Pattern Analysis: Mapping Trends and Clusters
 2013 Esri International User Conference July 8 12, 2013 San Diego, California Technical Workshop Spatial Pattern Analysis: Mapping Trends and Clusters Lauren Rosenshein Bennett Brett Rose Presentation
Intro to GIS Summer 2012 Data Visualization
 Intro to GIS Summer 2012 Data Visualization UNDERSTANDING YOUR MAP DATA Qualitative vs. Quantitative Data Qualitative Data classified by category e.g. Soil types, Animal Species Quantitative Data grouped
M & M Project. Think! Crunch those numbers! Answer!
 M & M Project Think! Crunch those numbers! Answer! Chapters 1-2 Exploring Data and Describing Location in a Distribution Univariate Data: Length Stemplot and Frequency Table Stem (Units Digit) 0 1 1 Leaf
Topic 3: Introduction to Statistics. Algebra 1. Collecting Data. Table of Contents. Categorical or Quantitative? What is the Study of Statistics?!
 Topic 3: Introduction to Statistics Collecting Data We collect data through observation, surveys and experiments. We can collect two different types of data: Categorical Quantitative Algebra 1 Table of
Interactive Statistics Visualisation based on Geovisual Analytics
 Interactive Statistics Visualisation based on Geovisual Analytics Prof. Mikael Jern NCVA LiU and NComVA AB May 2010 - Spin-off company to focus on Interactive Statistics Visualization and Storytelling
Descriptive Data Summarization
 Descriptive Data Summarization Descriptive data summarization gives the general characteristics of the data and identify the presence of noise or outliers, which is useful for successful data cleaning
EXPLORATORY SPATIAL DATA ANALYSIS OF BUILDING ENERGY IN URBAN ENVIRONMENTS. Food Machinery and Equipment, Tianjin , China
 EXPLORATORY SPATIAL DATA ANALYSIS OF BUILDING ENERGY IN URBAN ENVIRONMENTS Wei Tian 1,2, Lai Wei 1,2, Pieter de Wilde 3, Song Yang 1,2, QingXin Meng 1 1 College of Mechanical Engineering, Tianjin University
Spatial Autocorrelation
 Spatial Autocorrelation Luc Anselin http://spatial.uchicago.edu spatial randomness positive and negative spatial autocorrelation spatial autocorrelation statistics spatial weights Spatial Randomness The
1 Introduction Overview of the Book How to Use this Book Introduction to R 10
 List of Tables List of Figures Preface xiii xv xvii 1 Introduction 1 1.1 Overview of the Book 3 1.2 How to Use this Book 7 1.3 Introduction to R 10 1.3.1 Arithmetic Operations 10 1.3.2 Objects 12 1.3.3
Diamonds on the soles of scholarship?
 Educational Performance and Family Income Diamonds on the soles of scholarship? by Introduction Problem Two young girls entering elementary school in Boston aspire to be doctors. Both come from twoparent,
Luc Anselin Spatial Analysis Laboratory Dept. Agricultural and Consumer Economics University of Illinois, Urbana-Champaign
 GIS and Spatial Analysis Luc Anselin Spatial Analysis Laboratory Dept. Agricultural and Consumer Economics University of Illinois, Urbana-Champaign http://sal.agecon.uiuc.edu Outline GIS and Spatial Analysis
1-1. Chapter 1. Sampling and Descriptive Statistics by The McGraw-Hill Companies, Inc. All rights reserved.
 1-1 Chapter 1 Sampling and Descriptive Statistics 1-2 Why Statistics? Deal with uncertainty in repeated scientific measurements Draw conclusions from data Design valid experiments and draw reliable conclusions
Fundamentals to Biostatistics. Prof. Chandan Chakraborty Associate Professor School of Medical Science & Technology IIT Kharagpur
 Fundamentals to Biostatistics Prof. Chandan Chakraborty Associate Professor School of Medical Science & Technology IIT Kharagpur Statistics collection, analysis, interpretation of data development of new
Introduction GeoXp : an R package for interactive exploratory spatial data analysis. Illustration with a data set of schools in Midi-Pyrénées.
 Presentation of Presentation of Use of Introduction : an R package for interactive exploratory spatial data analysis. Illustration with a data set of schools in Midi-Pyrénées. Authors of : Christine Thomas-Agnan,
Analytical Graphing. lets start with the best graph ever made
 Analytical Graphing lets start with the best graph ever made Probably the best statistical graphic ever drawn, this map by Charles Joseph Minard portrays the losses suffered by Napoleon's army in the Russian
MATH 1150 Chapter 2 Notation and Terminology
 MATH 1150 Chapter 2 Notation and Terminology Categorical Data The following is a dataset for 30 randomly selected adults in the U.S., showing the values of two categorical variables: whether or not the
Lecture 2 and Lecture 3
 Lecture 2 and Lecture 3 1 Lecture 2 and Lecture 3 We can describe distributions using 3 characteristics: shape, center and spread. These characteristics have been discussed since the foundation of statistics.
Spatial Pattern Analysis: Mapping Trends and Clusters
 Esri International User Conference San Diego, California Technical Workshops July 24, 2012 Spatial Pattern Analysis: Mapping Trends and Clusters Lauren M. Scott, PhD Lauren Rosenshein Bennett, MS Presentation
AP Statistics. Chapter 6 Scatterplots, Association, and Correlation
 AP Statistics Chapter 6 Scatterplots, Association, and Correlation Objectives: Scatterplots Association Outliers Response Variable Explanatory Variable Correlation Correlation Coefficient Lurking Variables
Descriptive Statistics
 Descriptive Statistics CHAPTER OUTLINE 6-1 Numerical Summaries of Data 6- Stem-and-Leaf Diagrams 6-3 Frequency Distributions and Histograms 6-4 Box Plots 6-5 Time Sequence Plots 6-6 Probability Plots Chapter
Usability Testing of Map Designs
 Usability Testing of Map Designs Linda Williams Pickle National Cancer Institute, Bethesda, MD 20892-8317 (PICKLEL@MAIL.NIH.GOV) Maps have the potential to display the geographic patterns of millions of
What is Statistics? Statistics is the science of understanding data and of making decisions in the face of variability and uncertainty.
 What is Statistics? Statistics is the science of understanding data and of making decisions in the face of variability and uncertainty. Statistics is a field of study concerned with the data collection,
Chapter 1 Descriptive Statistics
 MICHIGAN STATE UNIVERSITY STT 351 SECTION 2 FALL 2008 LECTURE NOTES Chapter 1 Descriptive Statistics Nao Mimoto Contents 1 Overview 2 2 Pictorial Methods in Descriptive Statistics 3 2.1 Different Kinds
3.1 Measure of Center
 3.1 Measure of Center Calculate the mean for a given data set Find the median, and describe why the median is sometimes preferable to the mean Find the mode of a data set Describe how skewness affects
Section 3. Measures of Variation
 Section 3 Measures of Variation Range Range = (maximum value) (minimum value) It is very sensitive to extreme values; therefore not as useful as other measures of variation. Sample Standard Deviation The
Statistics lecture 3. Bell-Shaped Curves and Other Shapes
 Statistics lecture 3 Bell-Shaped Curves and Other Shapes Goals for lecture 3 Realize many measurements in nature follow a bell-shaped ( normal ) curve Understand and learn to compute a standardized score
M 225 Test 1 B Name SHOW YOUR WORK FOR FULL CREDIT! Problem Max. Points Your Points Total 75
 M 225 Test 1 B Name SHOW YOUR WORK FOR FULL CREDIT! Problem Max. Points Your Points 1-13 13 14 3 15 8 16 4 17 10 18 9 19 7 20 3 21 16 22 2 Total 75 1 Multiple choice questions (1 point each) 1. Look at
Objectives Define spatial statistics Introduce you to some of the core spatial statistics tools available in ArcGIS 9.3 Present a variety of example a
 Introduction to Spatial Statistics Opportunities for Education Lauren M. Scott, PhD Mark V. Janikas, PhD Lauren Rosenshein Jorge Ruiz-Valdepeña 1 Objectives Define spatial statistics Introduce you to some
ALGEBRA 1 CURRICULUM COMMON CORE BASED
 ALGEBRA 1 CURRICULUM COMMON CORE BASED (Supplemented with 8th grade PSSA anchors ) UPPER MERION AREA SCHOOL DISTRICT 435 CROSSFIELD ROAD KING OF PRUSSIA, PA 19406 8/20/2012 PA COMMON CORE ALIGNED MATHEMATICS
Subject Algebra 1 Unit 1 Relationships between Quantities and Reasoning with Equations
 Subject Algebra 1 Unit 1 Relationships between Quantities and Reasoning with Equations Time Frame: Description: Work with expressions and equations through understanding quantities and the relationships
Learning Objectives for Stat 225
 Learning Objectives for Stat 225 08/20/12 Introduction to Probability: Get some general ideas about probability, and learn how to use sample space to compute the probability of a specific event. Set Theory:
QUANTITATIVE DATA. UNIVARIATE DATA data for one variable
 QUANTITATIVE DATA Recall that quantitative (numeric) data values are numbers where data take numerical values for which it is sensible to find averages, such as height, hourly pay, and pulse rates. UNIVARIATE
Topic 2: New Directions in Distributed Geovisualization. Alan M. MacEachren
 Topic 2: New Directions in Distributed Geovisualization Alan M. MacEachren GeoVISTA Center Department of Geography, Penn State & International Cartographic Association Commission on Visualization & Virtual
ANÁLISE DOS DADOS. Daniela Barreiro Claro
 ANÁLISE DOS DADOS Daniela Barreiro Claro Outline Data types Graphical Analysis Proimity measures Prof. Daniela Barreiro Claro Types of Data Sets Record Ordered Relational records Video data: sequence of
Observations Homework Checkpoint quizzes Chapter assessments (Possibly Projects) Blocks of Algebra
 Blocks of Algebra") September The Building Blocks of Algebra Rates, Patterns and Problem Solving Variables and Expressions The Commutative and Associative Properties The Distributive Property Equivalent Expressions Seeing
September The Building Blocks of Algebra Rates, Patterns and Problem Solving Variables and Expressions The Commutative and Associative Properties The Distributive Property Equivalent Expressions Seeing
Watch TV 4 7 Read 5 2 Exercise 2 4 Talk to friends 7 3 Go to a movie 6 5 Go to dinner 1 6 Go to the mall 3 1
 Unit 3 Lesson 1 Investigation 2 Check Your Understanding Name: A couple decides to measure their compatibility by ranking their favorite leisure activities. The rankings are given below in the table. Mallisa
Units. Exploratory Data Analysis. Variables. Student Data
 Units Exploratory Data Analysis Bret Larget Departments of Botany and of Statistics University of Wisconsin Madison Statistics 371 13th September 2005 A unit is an object that can be measured, such as
Interactive Cumulative Curves for Exploratory Classification Maps
 Interactive Cumulative Curves for Exploratory Classification Maps Gennady Andrienko and Natalia Andrienko Fraunhofer Institute AIS Schloss Birlinghoven, 53754 Sankt Augustin, Germany Tel +49-2241-142486,
Attribute Data. ArcGIS reads DBF extensions. Data in any statistical software format can be
 This hands on application is intended to introduce you to the foundational methods of spatial data analysis available in GeoDa. We will undertake an exploratory spatial data analysis, of 1,387 southern
Visualisation of Spatial Data
 Visualisation of Spatial Data VU Visual Data Science Johanna Schmidt WS 2018/19 2 Visual Data Science Introduction to Visualisation Basics of Information Visualisation Charts and Techniques Introduction
Week 1: Intro to R and EDA
 Statistical Methods APPM 4570/5570, STAT 4000/5000 Populations and Samples 1 Week 1: Intro to R and EDA Introduction to EDA Objective: study of a characteristic (measurable quantity, random variable) for
Prentice Hall Stats: Modeling the World 2004 (Bock) Correlated to: National Advanced Placement (AP) Statistics Course Outline (Grades 9-12)
 Correlated to: National Advanced Placement (AP) Statistics Course Outline (Grades 9-12)") National Advanced Placement (AP) Statistics Course Outline (Grades 9-12) Following is an outline of the major topics covered by the AP Statistics Examination. The ordering here is intended to define the
National Advanced Placement (AP) Statistics Course Outline (Grades 9-12) Following is an outline of the major topics covered by the AP Statistics Examination. The ordering here is intended to define the
MATH4427 Notebook 4 Fall Semester 2017/2018
 MATH4427 Notebook 4 Fall Semester 2017/2018 prepared by Professor Jenny Baglivo c Copyright 2009-2018 by Jenny A. Baglivo. All Rights Reserved. 4 MATH4427 Notebook 4 3 4.1 K th Order Statistics and Their
COMMON CORE STATE STANDARDS TO BOOK CORRELATION
 COMMON CORE STATE STANDARDS TO BOOK CORRELATION Conceptual Category: Number and Quantity Domain: The Real Number System After a standard is introduced, it is revisited many times in subsequent activities,
I L L I N O I S UNIVERSITY OF ILLINOIS AT URBANA-CHAMPAIGN
 Introduction Edps/Psych/Stat/ 584 Applied Multivariate Statistics Carolyn J Anderson Department of Educational Psychology I L L I N O I S UNIVERSITY OF ILLINOIS AT URBANA-CHAMPAIGN c Board of Trustees,
What is statistics? Statistics is the science of: Collecting information. Organizing and summarizing the information collected
 What is statistics? Statistics is the science of: Collecting information Organizing and summarizing the information collected Analyzing the information collected in order to draw conclusions Two types
Elementary Statistics
 Elementary Statistics Q: What is data? Q: What does the data look like? Q: What conclusions can we draw from the data? Q: Where is the middle of the data? Q: Why is the spread of the data important? Q:
Section 3.2 Measures of Central Tendency
 Section 3.2 Measures of Central Tendency 1 of 149 Section 3.2 Objectives Determine the mean, median, and mode of a population and of a sample Determine the weighted mean of a data set and the mean of a
Exploratory data analysis
 Exploratory data analysis November 29, 2017 Dr. Khajonpong Akkarajitsakul Department of Computer Engineering, Faculty of Engineering King Mongkut s University of Technology Thonburi Module III Overview
The Choropleth Map Slide #2: Choropleth mapping enumeration units
 The Choropleth Map Slide #2: Choropleth mapping is a common technique for representing enumeration data These are maps where enumeration units, such as states or countries, are shaded a particular color
Glossary. The ISI glossary of statistical terms provides definitions in a number of different languages:
 Glossary The ISI glossary of statistical terms provides definitions in a number of different languages: http://isi.cbs.nl/glossary/index.htm Adjusted r 2 Adjusted R squared measures the proportion of the
The Implementation of Autocorrelation-Based Regioclassification in ArcMap Using ArcObjects
 140 The Implementation of Autocorrelation-Based Regioclassification in ArcMap Using ArcObjects Christoph MAYRHOFER Abstract Conventional methods for cartographic classification are often solely based on
Chapter 3. Measuring data
 Chapter 3 Measuring data 1 Measuring data versus presenting data We present data to help us draw meaning from it But pictures of data are subjective They re also not susceptible to rigorous inference Measuring
Describing distributions with numbers
 Describing distributions with numbers A large number or numerical methods are available for describing quantitative data sets. Most of these methods measure one of two data characteristics: The central
Exploratory Data Analysis August 26, 2004
 Exploratory Data Analysis August 26, 2004 Exploratory Data Analysis p. 1/?? Agent Orange Case Study (SS: Ch 3) Dioxin concentrations in parts per trillion (ppt) for 646 Vietnam veterans and 97 veterans