Socio-Economic Atlas of Tajikistan. The World Bank THE STATE STATISTICAL COMMITTEE OF THE REPUBLIC OF TAJIKISTAN
|
|
|
- Lewis Campbell
- 5 years ago
- Views:
Transcription


1 Socio-Economic Atlas of Tajikistan The World Bank THE STATE STATISTICAL COMMITTEE OF THE REPUBLIC OF TAJIKISTAN
2 1) Background Why there is a need for socio economic atlas? Need for a better understanding of the spatial distribution of poverty at a lower level than previously available BUT..Poverty multidimensional concept Many indicators are required Material poverty Socio- economic characteristics Environment Etc..
3 1) Background Why this will be useful? Nationally consistent dataset many indicators at the same area of aggregation This has the potential to inform geographical targeting Some indicators require further elaboration using additional data.
4 Overview 1) Statistical Modelling of TLSS and Census to produce spatially disaggregated estimates of welfare at the Jamoat level Statistical modelling Base Unit Map (Jamoat) PCode / Administrative code matching exercise 2) Atlas Creation of a series of maps for different indicators Aggregated Jamoat data from 2000 Census Additional layers (land cover, terrain, infrastructure) 3) Digital versions CD Internet Atlas
5 2) Statistical Modelling to produce estimates of poverty at the Jamoat level Material poverty TLSS Poverty National Oblast Raion Jamoat
6 1) Statistical Modelling to produce estimates of poverty at the Jamoat level Census Population Housing Ownership of assets Poverty
7 1) Statistical Modelling to produce estimates of poverty at the Jamoat level TLSS x t, y t, z t Census x c, y c, z c Poverty Jamoat level Education of household head Marital status Household size Occupation of household members Poverty =f (x, y, z)
8 Modelling TLSS does NOT allow to produce poverty estimate below the oblast level CENSUS allows analysis at an area of disaggregation below the oblast level BUT does NOT contain information on poverty The poverty mapping procedure allows to combine the strength of the TLSS and the Strength of the CENSUS
9 Tajikistan Poverty Mapping TLSS Census of Tajikistan Stage 1: identify common variables Stage 2: prepare consumption model Stage 3: run simulation on the census dataset in order to get disaggregated estimate of welfare
10 THREE steps: Step 1 Select a set of key indicators common to Census & Survey Assume variables have the same meaning & represent the same population Similar wording Similar average values Obtain descriptive statistics on indicators for both Census & Survey for each strata (oblast divided by urban/rural)
11 Step 2 Carry out series of regression analysis using variables which have a similar distribution log( consumption) = β + β * water + β * prop15to59 + β * hh _ sec+ β * hh _ high o R-square------how good the predictions are. In order to reduce location effect we need to include locational variables such as village means calculated from Census plus environmental variables calculated with GIS analysis This requires assigning a pcode/ter to each PSU in the Survey to LINK the datasets E.g
12 Modelling We derived a model of poverty using a set of explanatory variables common to the TLSS and Census ln y = x β + ch ' ch u ch Log (hh monthly consumption) Examples: Education of household head Marital status Household size Occupation of household members Etc.. Location effect uch = η + ε c ch Household disturbances
13 Step 3 Simulation of several parameters This stage allows to capture the location effect and allows to lower the level of aggregation The RESULTS
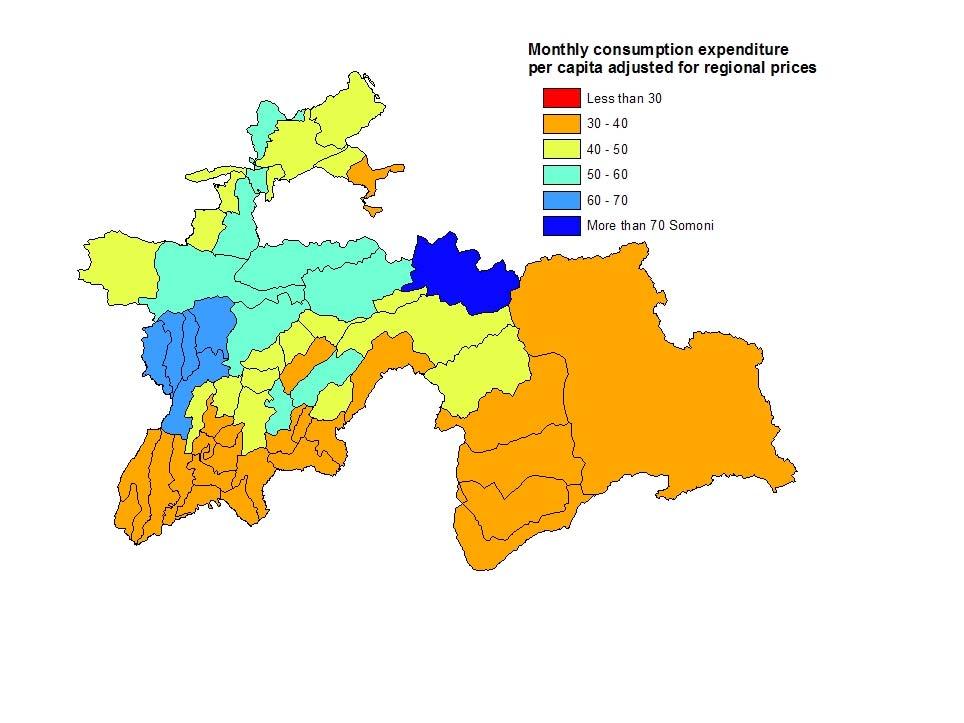
14
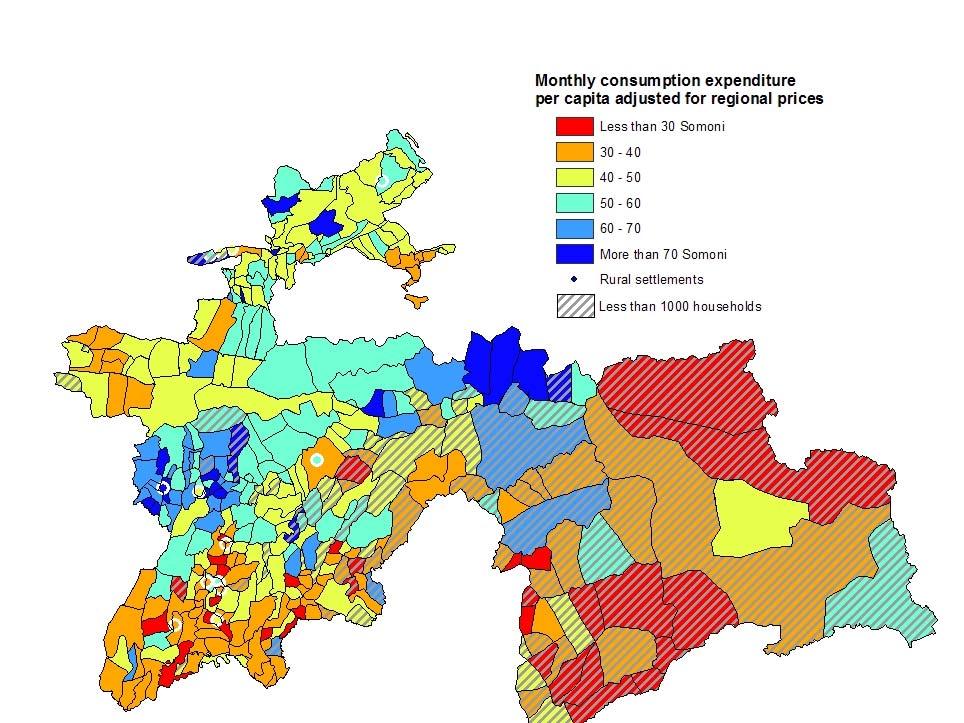
15
16
17
18
19 Atlas Paper Version
20 Atlas CD
21 Further work Combine Variables Map Change over time Combine with other map data
Determining Changes in Welfare Distributions at the Micro-level: Updating Poverty Maps By Chris Elbers, Jean O. Lanjouw, and Peter Lanjouw 1
 Determining Changes in Welfare Distributions at the Micro-level: Updating Poverty Maps By Chris Elbers, Jean O. Lanjouw, and Peter Lanjouw 1 Income and wealth distributions have a prominent position in
Uganda - National Panel Survey
 Microdata Library Uganda - National Panel Survey 2013-2014 Uganda Bureau of Statistics - Government of Uganda Report generated on: June 7, 2017 Visit our data catalog at: http://microdata.worldbank.org
Measuring Poverty. Introduction
 Measuring Poverty Introduction To measure something, we need to provide answers to the following basic questions: 1. What are we going to measure? Poverty? So, what is poverty? 2. Who wants to measure
The World Bank THE STATE STATISTICAL COMMITTEE OF THE REPUBLIC OF TAJIKISTAN
 The World Bank THE STATE STATISTICAL COMMITTEE OF THE REPUBLIC OF TAJIKISTAN Foreword This atlas is the culmination of a significant effort to deliver a snapshot of the socio-economic situation in Tajikistan
Trip Generation Model Development for Albany
 Trip Generation Model Development for Albany Hui (Clare) Yu Department for Planning and Infrastructure Email: hui.yu@dpi.wa.gov.au and Peter Lawrence Department for Planning and Infrastructure Email: lawrence.peter@dpi.wa.gov.au
Multidimensional Poverty in Colombia: Identifying Regional Disparities using GIS and Population Census Data (2005)
") Multidimensional Poverty in Colombia: Identifying Regional Disparities using GIS and Population Census Data (2005) Laura Estrada Sandra Liliana Moreno December 2013 Aguascalientes, Mexico Content 1. Spatial
Multidimensional Poverty in Colombia: Identifying Regional Disparities using GIS and Population Census Data (2005) Laura Estrada Sandra Liliana Moreno December 2013 Aguascalientes, Mexico Content 1. Spatial
National Disaster Management Centre (NDMC) Republic of Maldives. Location
 Republic of Maldives. Location") National Disaster Management Centre (NDMC) Republic of Maldives Location Country Profile 1,190 islands. 198 Inhabited Islands. Total land area 300 sq km Islands range b/w 0.2 5 sq km Population approx.
National Disaster Management Centre (NDMC) Republic of Maldives Location Country Profile 1,190 islands. 198 Inhabited Islands. Total land area 300 sq km Islands range b/w 0.2 5 sq km Population approx.
Understanding China Census Data with GIS By Shuming Bao and Susan Haynie China Data Center, University of Michigan
 Understanding China Census Data with GIS By Shuming Bao and Susan Haynie China Data Center, University of Michigan The Census data for China provides comprehensive demographic and business information
Poverty statistics in Mongolia
 HIGH-LEVEL SEMINAR ON HARMONISATION OF POVERTY STATISTICS IN CIS COUNTRIES SOCHI (RUSSIAN FEDERATION) Poverty statistics in Mongolia Oyunchimeg Dandar Director Population and Social Statistics Department,
Updating Small Area Welfare Indicators in the Absence of a New Census
 Updating Small Area Welfare Indicators in the Absence of a New Census DRAFT Johannes G. Hoogeveen Thomas Emwanu Paul Okiira Okwi* November 13, 2003 Abstract Elbers, Lanjouw and Lanjouw (2003a) show how,
Geotargeting. Cost and impact implications
 Geotargeting Cost and impact implications What are poverty maps? Poverty mapping, the spatial representation and analysis of indicators of human wellbeing and poverty within a region What can poverty maps
Combining Geospatial and Statistical Data for Analysis & Dissemination
 Combining Geospatial and Statistical Data for Analysis & Dissemination (with Special Reference to Qatar Census 2010) Presentation by Mansoor Al Malki, Director of IT Department Qatar Statistics Authority
 CSAE WPS/2008-06 1998-2001 panel Mitch panel Mitch panel Mitch panel 1998-2001 panel 1998 1999 2001 Poverty 68.7% 74.1% 73.1% 70.6% 63.6% Extreme Poverty 28.6% 32.0% 34.5% 25.9% 25.4%
Experiences with the Development and Use of Poverty Maps
 Experiences with the Development and Use of Poverty Maps Case Study Note for VIETNAM * 1. Background information on the poverty mapping initiative The development of the first poverty map in Vietnam was
Integration of Geo spatial and Statistical Information: The Nepelese Experience
 Integration of Geo spatial and Statistical Information: The Nepelese Experience Krishna Raj B.C. Joint Secretary Ministry of Land Reform and Management, Nepal 11 June, 2014 Presentation Outline The Country
Market access and rural poverty in Tanzania
 Market access and rural poverty in Tanzania Nicholas Minot International Food Policy Research Institute 2033 K St. NW Washington, D.C., U.S.A. Phone: +1 202 862-8199 Email: n.minot@cgiar.org Contributed
Taking into account sampling design in DAD. Population SAMPLING DESIGN AND DAD
 Taking into account sampling design in DAD SAMPLING DESIGN AND DAD With version 4.2 and higher of DAD, the Sampling Design (SD) of the database can be specified in order to calculate the correct asymptotic
Presented to Sub-regional workshop on integration of administrative data, big data and geospatial information for the compilation of SDG indicators
 Presented to Sub-regional workshop on integration of administrative data, big data and geospatial information for the compilation of SDG indicators 23-25 April,2018 Addis Ababa, Ethiopia By: Deogratius
Apéndice 1: Figuras y Tablas del Marco Teórico
 Apéndice 1: Figuras y Tablas del Marco Teórico FIGURA A.1.1 Manufacture poles and manufacture regions Poles: Share of employment in manufacture at least 12% and population of 250,000 or more. Regions:
Population Research Center (PRC) Oregon Population Forecast Program
 Oregon Population Forecast Program") Population Research Center (PRC) Oregon Population Forecast Program 2013 Oregon League of Cities Conference Risa S. Proehl Jason R. Jurjevich, Ph.D. Population Research Center (PRC) Population Research
Population Research Center (PRC) Oregon Population Forecast Program 2013 Oregon League of Cities Conference Risa S. Proehl Jason R. Jurjevich, Ph.D. Population Research Center (PRC) Population Research
Lessons Learned from the production of Gridded Population of the World Version 4 (GPW4) Columbia University, CIESIN, USA EFGS October 2014
 Columbia University, CIESIN, USA EFGS October 2014") Lessons Learned from the production of Gridded Population of the World Version 4 (GPW4) Columbia University, CIESIN, USA EFGS October 2014 Gridded Population of the World Gridded (raster) data product
Lessons Learned from the production of Gridded Population of the World Version 4 (GPW4) Columbia University, CIESIN, USA EFGS October 2014 Gridded Population of the World Gridded (raster) data product
ADePT Software platform for Automated Economic Analysis
 ADePT Software platform for Automated Economic Analysis Michael Lokshin, Zurab Sajaia and Sergiy Radyakin DECRG-PO The World Bank Step 1: Data and Output Step 2: Household variables Step 3: Individual
Demographic Data in ArcGIS. Harry J. Moore IV
 Demographic Data in ArcGIS Harry J. Moore IV Outline What is demographic data? Esri Demographic data - Real world examples with GIS - Redistricting - Emergency Preparedness - Economic Development Next
Foundation Geospatial Information to serve National and Global Priorities
 Foundation Geospatial Information to serve National and Global Priorities Greg Scott Inter-Regional Advisor Global Geospatial Information Management United Nations Statistics Division UN-GGIM: A global
GEOGRAPHIC INFORMATION SYSTEMS Session 8
 GEOGRAPHIC INFORMATION SYSTEMS Session 8 Introduction Geography underpins all activities associated with a census Census geography is essential to plan and manage fieldwork as well as to report results
Second High Level Forum on GGIM Seminar on Regional Cooperation in Geospatial Information Management Doha, Qatar, 7 February 2013
 Second High Level Forum on GGIM Seminar on Regional Cooperation in Geospatial Information Management Doha, Qatar, 7 February 2013 Overview on Geospatial Activities in Egypt BY : Eng.Nahla Seddik Mohamed
Land Use in the context of sustainable, smart and inclusive growth
 Land Use in the context of sustainable, smart and inclusive growth François Salgé Ministry of sustainable development France facilitator EUROGI vice president AFIGéO board member 1 Introduction e-content+
Notes On: Do Television and Radio Destroy Social Capital? Evidence from Indonesian Village (Olken 2009)
") Notes On: Do Television and Radio Destroy Social Capital? Evidence from Indonesian Village (Olken 2009) Increasing interest in phenomenon social capital variety of social interactions, networks, and groups
Notes On: Do Television and Radio Destroy Social Capital? Evidence from Indonesian Village (Olken 2009) Increasing interest in phenomenon social capital variety of social interactions, networks, and groups
Brazil within Brazil:
 Public Disclosure Authorized Public Disclosure Authorized Public Disclosure Authorized Public Disclosure Authorized Pol i c y Re s e a rc h Wo r k i n g Pa p e r 4513 Brazil within Brazil: Testing the
An Introduction to China and US Map Library. Shuming Bao Spatial Data Center & China Data Center University of Michigan
 An Introduction to China and US Map Library Shuming Bao Spatial Data Center & China Data Center University of Michigan Current Spatial Data Services http://chinadataonline.org China Geo-Explorer http://chinageoexplorer.org
Economic poverty and inequality at regional level in malta: focus on the situation of children 1
 114 Социально-демографический потенциал регионального развития Для цитирования: Экономика региона. 2015. 3. С. 114-122 For citation: Ekonomika regiona [Economy of Region], 2015. 3. pp. 114-122 doi 10.17059/2015-3-10
Department of Economic and Social Affairs May 2007
 UNITED NATIONS SECRETARIAT ESA/STAT/AC.115/13 Department of Economic and Social Affairs May 2007 Statistics Division English only United Nations Expert Group Meeting on Contemporary Practices in Census
Typical information required from the data collection can be grouped into four categories, enumerated as below.
 Chapter 6 Data Collection 6.1 Overview The four-stage modeling, an important tool for forecasting future demand and performance of a transportation system, was developed for evaluating large-scale infrastructure
GEOSPATIAL DATA OFFERINGS. April 2018
 GEOSPATIAL DATA OFFERINGS April 2018 Introduction Data cannot be explanatory until converted into information. Noteworthy to say a picture can cover more than 1000 words and a map can portray more than
Technical Documentation Demostats april 2018
 Technical Documentation Demostats 2018 april 2018 what it is DemoStats is a database of estimates and projections for a comprehensive set of demographic and socioeconomic attributes about the Canadian
MALDIVES. Regional Expert Workshop On Land Accounting For SDG Monitoring & Reporting (25-27 th Sept 2017) - Fathimath Shanna, Aishath Aniya -
 - Fathimath Shanna, Aishath Aniya -") MALDIVES Regional Expert Workshop On Land Accounting For SDG Monitoring & Reporting (25-27 th Sept 2017) - Fathimath Shanna, Aishath Aniya - ABOUT MALDIVES Approximately 860 km long and 120 km wide Consists
MALDIVES Regional Expert Workshop On Land Accounting For SDG Monitoring & Reporting (25-27 th Sept 2017) - Fathimath Shanna, Aishath Aniya - ABOUT MALDIVES Approximately 860 km long and 120 km wide Consists
Vanessa Nadalin Lucas Mation IPEA - Institute for Applied Economic Research Regional Studies Association Global Conference Fortaleza 2014
 Spatial distribution of sanitation and income inequality in Brazilian Slums Vanessa Nadalin Lucas Mation IPEA - Institute for Applied Economic Research Regional Studies Association Global Conference Fortaleza
ESRI 2008 Health GIS Conference
 ESRI 2008 Health GIS Conference An Exploration of Geographically Weighted Regression on Spatial Non- Stationarity and Principal Component Extraction of Determinative Information from Robust Datasets A
System of collecting social statistics
 PHILIPPINES Inception Meeting System of collecting social statistics The Philippines has a decentralized system. It is composed of a policy-making body data producers data users research and training institutions
8 th Meeting of IAEG-SDGs 5 8 November 2018, Stockholm, Sweden. Meetings. Report
 Meetings 8 th Meeting of IAEG-SDGs Between April 2018 and November 2018, the Working Group on Geospatial Information of the IAEG- SDGs held two online meetings; presented a report to the United Nations
Use of GIS in road sector analysis
 Use of GIS in road sector analysis Uwe Deichmann, DECRG March 30, 2007 Transport Forum and Learning Week 2007 Transport Measurement Matters Indicators of Performance and Impact Geographic information Using
ReCAP Status Review of the Updated Rural Access Index (RAI) Stephen Vincent, Principal Investigator
 Stephen Vincent, Principal Investigator") ReCAP Status Review of the Updated Rural Access Index (RAI) Stephen Vincent, Principal Investigator Establishment of RAI in 2005/2006 2006 Definition of the RAI Note by Peter Roberts Dated September 2005
ReCAP Status Review of the Updated Rural Access Index (RAI) Stephen Vincent, Principal Investigator Establishment of RAI in 2005/2006 2006 Definition of the RAI Note by Peter Roberts Dated September 2005
DETERMINING POVERTY MAP USING SMALL AREA ESTIMATION METHOD
 DETERMINING OVERTY MA USING SMALL AREA ESTIMATION METHOD Eko Yuliasih and Irwan Susanto T Bank UOB Buana Jakarta and Mathematics Dept. F MIA Sebelas Maret University yuliasih.eko@gmail.com Abstract. overty
Cities in Bad Shape: Urban Geometry in India
 Cities in Bad Shape: Urban Geometry in India Mariaflavia Harari presented by Federico Curci September 15, 2015 Harari Cities in Bad Shape September 15, 2015 1 / 19 Research question Estimate effect of
Valuation of environmental amenities in urban land price: A case study in the Ulaanbaatar city, Mongolia
 1989 1990 1991 1992 1993 1994 1995 1996 1997 1998 1999 2000 2001 2002 2003 2004 2005 2006 2007 2008 2009 2010 2011 Population Valuation of environmental amenities in urban land price: A case study in the
Selection of small area estimation method for Poverty Mapping: A Conceptual Framework
 Selection of small area estimation method for Poverty Mapping: A Conceptual Framework Sumonkanti Das National Institute for Applied Statistics Research Australia University of Wollongong The First Asian
Introduction To Raster Based GIS Dr. Zhang GISC 1421 Fall 2016, 10/19
 Introduction To Raster Based GIS Dr. Zhang GISC 1421 Fall 2016, 10/19 Model of the course Using and making maps Navigating GIS maps Map design Working with spatial data Geoprocessing Spatial data infrastructure
Geography for the 2020 Round of Census
 Boundaries Key Census Data EA Id Population Male Female EA Id Area EA Id Num HH Avg HH size Geography for the 2020 Round of Census Linda Peters, Esri lpeters@esri.com Integration of Statistical and Geospatial
Jean Razafindravonoma, Director Direction des Statistiques des Ménages (DSM) de l Institut National de la Statistique, Madagascar
 de l Institut National de la Statistique, Madagascar") Putting Welfare on the Map in Madagascar Africa Region Working Paper Series No. 34 August 00 Abstract In this paper, the authors apply a recently developed small-area estimation technique to derive detailed
Putting Welfare on the Map in Madagascar Africa Region Working Paper Series No. 34 August 00 Abstract In this paper, the authors apply a recently developed small-area estimation technique to derive detailed
H. R heading to fund the award and oversight by the Administrator of grants made under this heading. FEDERAL HIGHWAY ADMINISTRATION
 H. R. 1 92 heading to fund the award and oversight by the Administrator of grants made under this heading. FEDERAL HIGHWAY ADMINISTRATION HIGHWAY INFRASTRUCTURE INVESTMENT For an additional amount for
Data Collection. Lecture Notes in Transportation Systems Engineering. Prof. Tom V. Mathew. 1 Overview 1
 Data Collection Lecture Notes in Transportation Systems Engineering Prof. Tom V. Mathew Contents 1 Overview 1 2 Survey design 2 2.1 Information needed................................. 2 2.2 Study area.....................................
In matrix algebra notation, a linear model is written as
 DM3 Calculation of health disparity Indices Using Data Mining and the SAS Bridge to ESRI Mussie Tesfamicael, University of Louisville, Louisville, KY Abstract Socioeconomic indices are strongly believed
Imagery and the Location-enabled Platform in State and Local Government
 Imagery and the Location-enabled Platform in State and Local Government Fred Limp, Director, CAST Jim Farley, Vice President, Leica Geosystems Oracle Spatial Users Group Denver, March 10, 2005 TM TM Discussion
Globally Estimating the Population Characteristics of Small Geographic Areas. Tom Fitzwater
 Globally Estimating the Population Characteristics of Small Geographic Areas Tom Fitzwater U.S. Census Bureau Population Division What we know 2 Where do people live? Difficult to measure and quantify.
Spatially Disaggregated Estimates of Poverty and Inequality in Thailand
 Spatially Disaggregated Estimates of Poverty and Inequality in Thailand Andrew J. Healy Massachusetts Institute of Technology, Yos Vajaragupta, TDRI Somchai Jitsuchon Thailand Development Research Institute,
Jun Tu. Department of Geography and Anthropology Kennesaw State University
 Examining Spatially Varying Relationships between Preterm Births and Ambient Air Pollution in Georgia using Geographically Weighted Logistic Regression Jun Tu Department of Geography and Anthropology Kennesaw
Poverty and Hazard Linkages
 Poverty and Hazard Linkages Global Risk Identification Programme Proposal Development Coordination Meeting Friday, 19 May 2006 CIESIN Earth Institute Columbia University www.ciesin.columbia.edu Data Improvements
The Church Demographic Specialists
 The Church Demographic Specialists Easy-to-Use Features Map-driven, Web-based Software An Integrated Suite of Information and Query Tools Providing An Insightful Window into the Communities You Serve Key
Georeferencing and Satellite Image Support: Lessons learned, Challenges and Opportunities
 Georeferencing and Satellite Image Support: Lessons learned, Challenges and Opportunities Shirish Ravan shirish.ravan@unoosa.org UN-SPIDER United Nations Office for Outer Space Affairs (UNOOSA) UN-SPIDER
Egypt Public DSS. the right of access to information. Mohamed Ramadan, Ph.D. [R&D Advisor to the president of CAPMAS]
![Egypt Public DSS. the right of access to information. Mohamed Ramadan, Ph.D. [R&D Advisor to the president of CAPMAS]](/thumbs/89/98483713.jpg "Egypt Public DSS. the right of access to information. Mohamed Ramadan, Ph.D. [R&D Advisor to the president of CAPMAS]") Egypt Public DSS ì the right of access to information Central Agency for Public Mobilization and Statistics Arab Republic of Egypt Mohamed Ramadan, Ph.D. [R&D Advisor to the president of CAPMAS] Egypt
Egypt Public DSS ì the right of access to information Central Agency for Public Mobilization and Statistics Arab Republic of Egypt Mohamed Ramadan, Ph.D. [R&D Advisor to the president of CAPMAS] Egypt
Applied Econometrics (MSc.) Lecture 3 Instrumental Variables
 Lecture 3 Instrumental Variables") Applied Econometrics (MSc.) Lecture 3 Instrumental Variables Estimation - Theory Department of Economics University of Gothenburg December 4, 2014 1/28 Why IV estimation? So far, in OLS, we assumed independence.
Applied Econometrics (MSc.) Lecture 3 Instrumental Variables Estimation - Theory Department of Economics University of Gothenburg December 4, 2014 1/28 Why IV estimation? So far, in OLS, we assumed independence.
Module - 3 GIS MAPPING, MIS AND GIS UNDER RAY
 Module - 3 1 GIS MAPPING, MIS AND GIS MIS INTEGRATION UNDER RAY Role of GIS & MIS under RAY Under the scheme, two step implementation strategy has been adopted i.e. preparation of SFCPoAs on whole city
Afghan Profiles: Finding Structure in Survey Data to Better Understand the Human Terrain. Thomas E. Powell, Ph.D. Philip T. Eles, Ph.D.
 Afghan Profiles: Finding Structure in Survey Data to Better Understand the Human Terrain Thomas E. Powell, Ph.D. University of Amsterdam Faculty of Social and Behavioral Sciences t.e.powell@uva.nl Philip
Economic consequences of floods: impacts in urban areas
 Economic consequences of floods: impacts in urban areas SWITCH Paris Conference Paris, 24 th 26 th January 2011 Economic consequences of floods: impacts in urban areas Institutions: Authors Vanessa Cançado
Integration for Informed Decision Making
 Geospatial and Statistics Policy Intervention: Integration for Informed Decision Making Greg Scott Global Geospatial Information Management United Nations Statistics Division Department of Economic and
Agro Ecological Malaria Linkages in Uganda, A Spatial Probit Model:
 Agro Ecological Malaria Linkages in Uganda, A Spatial Probit Model: IFPRI Project Title: Environmental management options and delivery mechanisms to reduce malaria transmission in Uganda Spatial Probit
MAPPING WHERE THE POOR LIVE
 2020 FOCUS BRIEF on the World s Poor and Hungry People October 2007 MAPPING WHERE THE POOR LIVE Todd Benson, Michael Epprecht, and Nicholas Minot A key consideration in planning action to assist poor and
Experiences with the Development and Use of Poverty Maps
 Experiences with the Development and Use of Poverty Maps Case Study Note for MALAWI * 1. Background information on the poverty mapping initiative Recognizing the growing demand for high-resolution poverty
PRELIMINARY DESIGN OF A SPATIAL DECISION SUPPORT SYSTEM FOR POVERTY MANAGEMENT
 PRELIMINARY DESIGN OF A SPATIAL DECISION SUPPORT SYSTEM FOR POVERTY MANAGEMENT F. O. Akinyemi Department of Geography, Obafemi Awolowo University, Ile-Ife, 220001, Nigeria bakin_yem@yahoo.com Commission
The Dwelling Frame project as a tool of achieving socially-friendly Enumeration Areas boundaries for Census 2011, South Africa.
 The Dwelling Frame project as a tool of achieving socially-friendly Enumeration Areas boundaries for Census 2011, South Africa. Mr. Bhekani KHUMALO Statistics South Africa, South Africa Abstract: The Dwelling
QUADERNI DEL DIPARTIMENTO DI ECONOMIA POLITICA E STATISTICA
 QUADERNI DEL DIPARTIMENTO DI ECONOMIA POLITICA E STATISTICA Gianni Betti Ruzhdie Bici Laura Neri Thomas Pave Sohnesen Ledia Thomo Local Poverty and Inequality in Albania n. 745 Gennaio 2017 Local Poverty
THE BRAZILIAN HOUSING PROGRAM - MINHA CASA MINHA VIDA - EFFECT ON URBAN SPRAWL
 THE BRAZILIAN HOUSING PROGRAM - MINHA CASA MINHA VIDA - EFFECT ON URBAN SPRAWL Ciro Biderman Frederido Roman Ramos Martha Hanae Hiromoto EAESP/FGV March 20, 2018 The MCMV Program Main Characteristics From
DIFFERENT INFLUENCES OF SOCIOECONOMIC FACTORS ON THE HUNTING AND FISHING LICENSE SALES IN COOK COUNTY, IL
 DIFFERENT INFLUENCES OF SOCIOECONOMIC FACTORS ON THE HUNTING AND FISHING LICENSE SALES IN COOK COUNTY, IL Xiaohan Zhang and Craig Miller Illinois Natural History Survey University of Illinois at Urbana
MPI and Multidimensional Poverty Analysis What we knew before joining West Bank and Gaza Poverty Assessment team. Nobuo Yoshida April 21, 2011
 MPI and Multidimensional Poverty Analysis What we knew before joining West Bank and Gaza Poverty Assessment team Nobuo Yoshida April 21, 2011 Multidimensional poverty analysis and Oxford-UNDP MPI In July,
About the Author: UID data in SPRS profiler. Representation code. Character. STATE OF INDIA Census code of UID-1
 Formulation of Policy & strategies for slum development through Slum Permanent Record System with GIS as E-TOOL Hema Dudhwala Founder and Principal of SPRS Research foundation Director& Proprietor of AAPIL
Households or locations? Cities, catchment areas and prosperity in India
 Households or locations? Cities, catchment areas and prosperity in India Yue Li and Martin Rama World Bank July 13, 2015 Motivation and approach (Some) cities are drivers of prosperity in India Because
CENSUS MAPPING WITH GIS IN NAMIBIA. BY Mrs. Ottilie Mwazi Central Bureau of Statistics Tel: October 2007
 CENSUS MAPPING WITH GIS IN NAMIBIA BY Mrs. Ottilie Mwazi Central Bureau of Statistics E-mail: omwazi@npc.gov.na Tel: + 264 61 283 4060 October 2007 Content of Presentation HISTORICAL BACKGROUND OF CENSUS
Medical GIS: New Uses of Mapping Technology in Public Health. Peter Hayward, PhD Department of Geography SUNY College at Oneonta
 Medical GIS: New Uses of Mapping Technology in Public Health Peter Hayward, PhD Department of Geography SUNY College at Oneonta Invited research seminar presentation at Bassett Healthcare. Cooperstown,
Operational Definitions of Urban, Rural and Urban Agglomeration for Monitoring Human Settlements
 Operational Definitions of Urban, Rural and Urban Agglomeration for Monitoring Human Settlements By Markandey Rai United Nations Human Settlements Programme PO Box-30030 Nairobi, Kenya Abstract The United
Poverty assessment me-thodology.
 Corneliu BOLBOCEAN, IEFS PhD student, lecturer, State University of Moldova, Department of Social Work REGIONAL DISTRIBUTION OF POVERTY IN MOLDOVA Although poverty is the most stringent problem in Moldova,
Qatar Statistical Geospatial Integration
 Qatar Statistical Geospatial Integration A Presentation by the Ministry of Development Planning & Statistics (MDPS), State of Qatar http://www.mdps.gov.qa (Fourth UN-GGIM Arab States Committee Meeting,
Geoinformatics application in village level dynamic studies
 2018; SP1: 115-119 E-ISSN: 2278-4136 P-ISSN: 2349-8234 JPP 2018; SP1: 115-119 Rana Mamta Centre of Excellence for Energy and Environmental Studies (CEEES), Deenbandhu Chhotu Ram University of Science &
High resolution population grid for the entire United States
 High resolution population grid for the entire United States A. Dmowska, T. F. Stepinski Space Informatics Lab, Department of Geography, University of Cincinnati, Cincinnati, OH 45221-0131, USA Telephone:
Dr.Sinisa Vukicevic Dr. Robert Summers
 Dr.Sinisa Vukicevic Dr. Robert Summers "Planning" means the scientific, aesthetic, and orderly disposition of land, resources, facilities and services with a view to securing the physical, economic and
THE SPATIAL DATA WAREHOUSE OF SEOUL
 THE SPATIAL DATA WAREHOUSE OF SEOUL Jae-Ho Han The Seoul Metropolitan Government Seoul City Hall, Taepyeongno 1(il)-ga, Jung-gu, Seoul 100-744, Korea djhjha@hanmail.net Impyeong Lee Dept. of Geoinformatics,
Impact Evaluation of Rural Road Projects. Dominique van de Walle World Bank
 Impact Evaluation of Rural Road Projects Dominique van de Walle World Bank Introduction General consensus that roads are good for development & living standards A sizeable share of development aid and
SPATIAL ANALYSIS OF POPULATION DATA BASED ON GEOGRAPHIC INFORMATION SYSTEM
 SPATIAL ANALYSIS OF POPULATION DATA BASED ON GEOGRAPHIC INFORMATION SYSTEM Liu, D. Chinese Academy of Surveying and Mapping, 16 Beitaiping Road, Beijing 100039, China. E-mail: liudq@casm.ac.cn ABSTRACT
Exploring the Impact of Ambient Population Measures on Crime Hotspots
 Exploring the Impact of Ambient Population Measures on Crime Hotspots Nick Malleson School of Geography, University of Leeds http://nickmalleson.co.uk/ N.S.Malleson@leeds.ac.uk Martin Andresen Institute
Techniques for Science Teachers: Using GIS in Science Classrooms.
 Techniques for Science Teachers: Using GIS in Science Classrooms. After ESRI, 2008 GIS A Geographic Information System A collection of computer hardware, software, and geographic data used together for
Department of Statistics Malaysia
 Department of Statistics Malaysia 1 2 1 2 3 4 5 Introduction Geographic Information Systems (GIS) Geospatial activities for 2020 Modernisation Way Forward 3 Malaysia Population (Millions) Census 2010 2018
The Socio Economic Development of the Marine Sector in the Atlantic Area. Stephen Hynes
 The Socio Economic Development of the Marine Sector in the Atlantic Area Stephen Hynes Overview SEMRU and its role in Marine Socioeconomic analysis Defining Ocean and Coastal Economies in the Atlantic
Oregon Population Forecast Program Rulemaking Advisory Committee (RAC) Population Research Center (PRC)
 Population Research Center (PRC)") Oregon Population Forecast Program Rulemaking Advisory Committee (RAC) Population Research Center (PRC) RAC Meeting Agenda 1. Committee member introductions 2. Review charge of the Oregon Population Forecast
Oregon Population Forecast Program Rulemaking Advisory Committee (RAC) Population Research Center (PRC) RAC Meeting Agenda 1. Committee member introductions 2. Review charge of the Oregon Population Forecast
Data Requirements in Multidimensional Poverty Measurement
 Data Requirements in Multidimensional Poverty Measurement Oxford Poverty & Human Development Initiative (OPHI) University of Oxford Rabat, 4 June 2014 Limits of the current global MPI surveys: DHS, MICS
Community Targeting for Poverty Reduction in Burkina Faso
 Community Targeting for Poverty Reduction in Burkina Faso by* David Bigman Stefan Dercon Dominique Guillaume Michel Lambotte Abstract: The paper develops a method for targeting anti-poverty programs and
Compact guides GISCO. Geographic information system of the Commission
 Compact guides GISCO Geographic information system of the Commission What is GISCO? GISCO, the Geographic Information System of the COmmission, is a permanent service of Eurostat that fulfils the requirements
GDDS2: GIS AND SMALL AREA STATISTICS. Page 1 of 6
 GDDS2: GIS AD SMALL AREA STATISTICS GDDS2: CHECKLIST Ghana GHAA: AEXURE C Background ame of country Ghana Size of population 21m % of population in urban App 60% Size of country (sq km) 238533 sqkm Geographical
Conducting Fieldwork and Survey Design
 Conducting Fieldwork and Survey Design (Prepared for Young South Asian Scholars Participating in SARNET Training Programme at IHD) Dr. G. C. Manna Structure of Presentation Advantages of Sample Surveys
Administrative Data Research Facility Linked HMDA and ACS Database
 University of Pennsylvania ScholarlyCommons 2017 ADRF Network Research Conference Presentations ADRF Network Research Conference Presentations 11-2017 Administrative Data Research Facility Linked HMDA
Using American Factfinder
 Using American Factfinder What is American Factfinder? American Factfinder is a search engine that provides access to the population, housing and economic data collected by the U.S. Census Bureau. It can
Exploring the Association Between Family Planning and Developing Telecommunications Infrastructure in Rural Peru
 Exploring the Association Between Family Planning and Developing Telecommunications Infrastructure in Rural Peru Heide Jackson, University of Wisconsin-Madison September 21, 2011 Abstract This paper explores